
Simulated Regional Yields of Spring Barley in the United Kingdom under Projected Climate Change

 ,
, 
 ,
,
Abstract
:1. Introduction
2. Materials and Methods
2.1. Data Sources
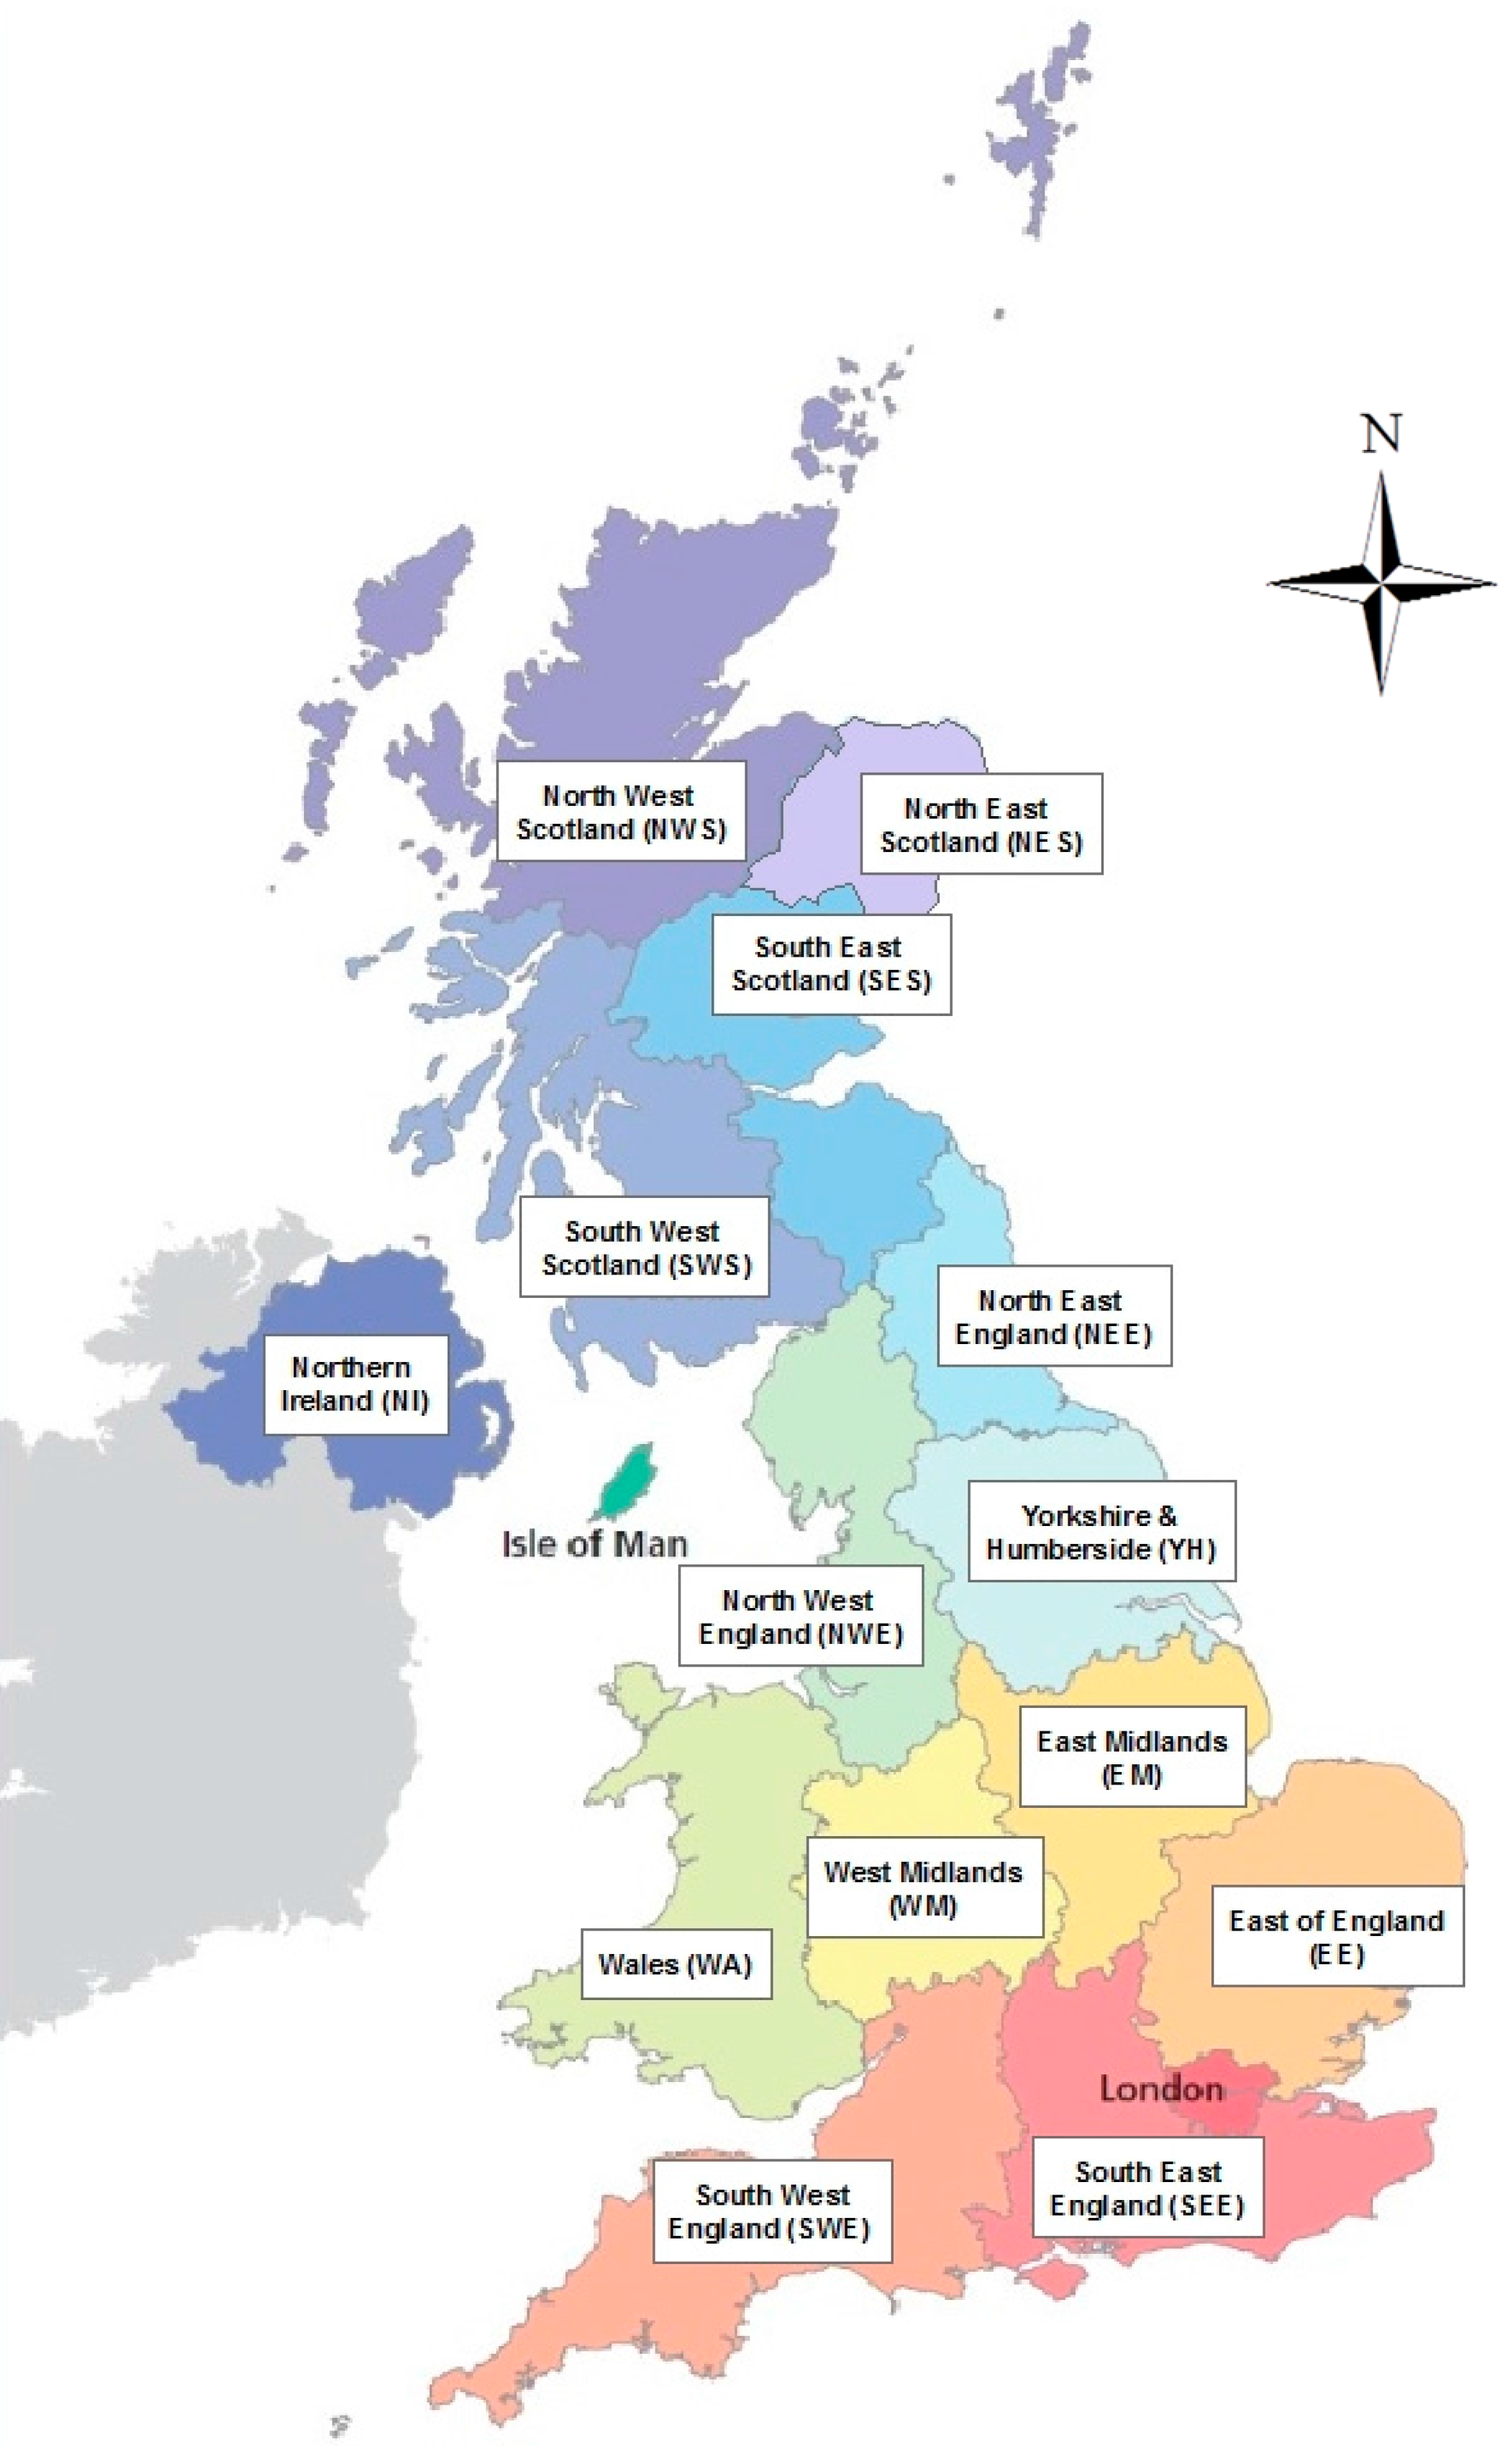
2.1.1. Climate Data
2.1.2. Soil Data
2.1.3. Baseline Yield Data
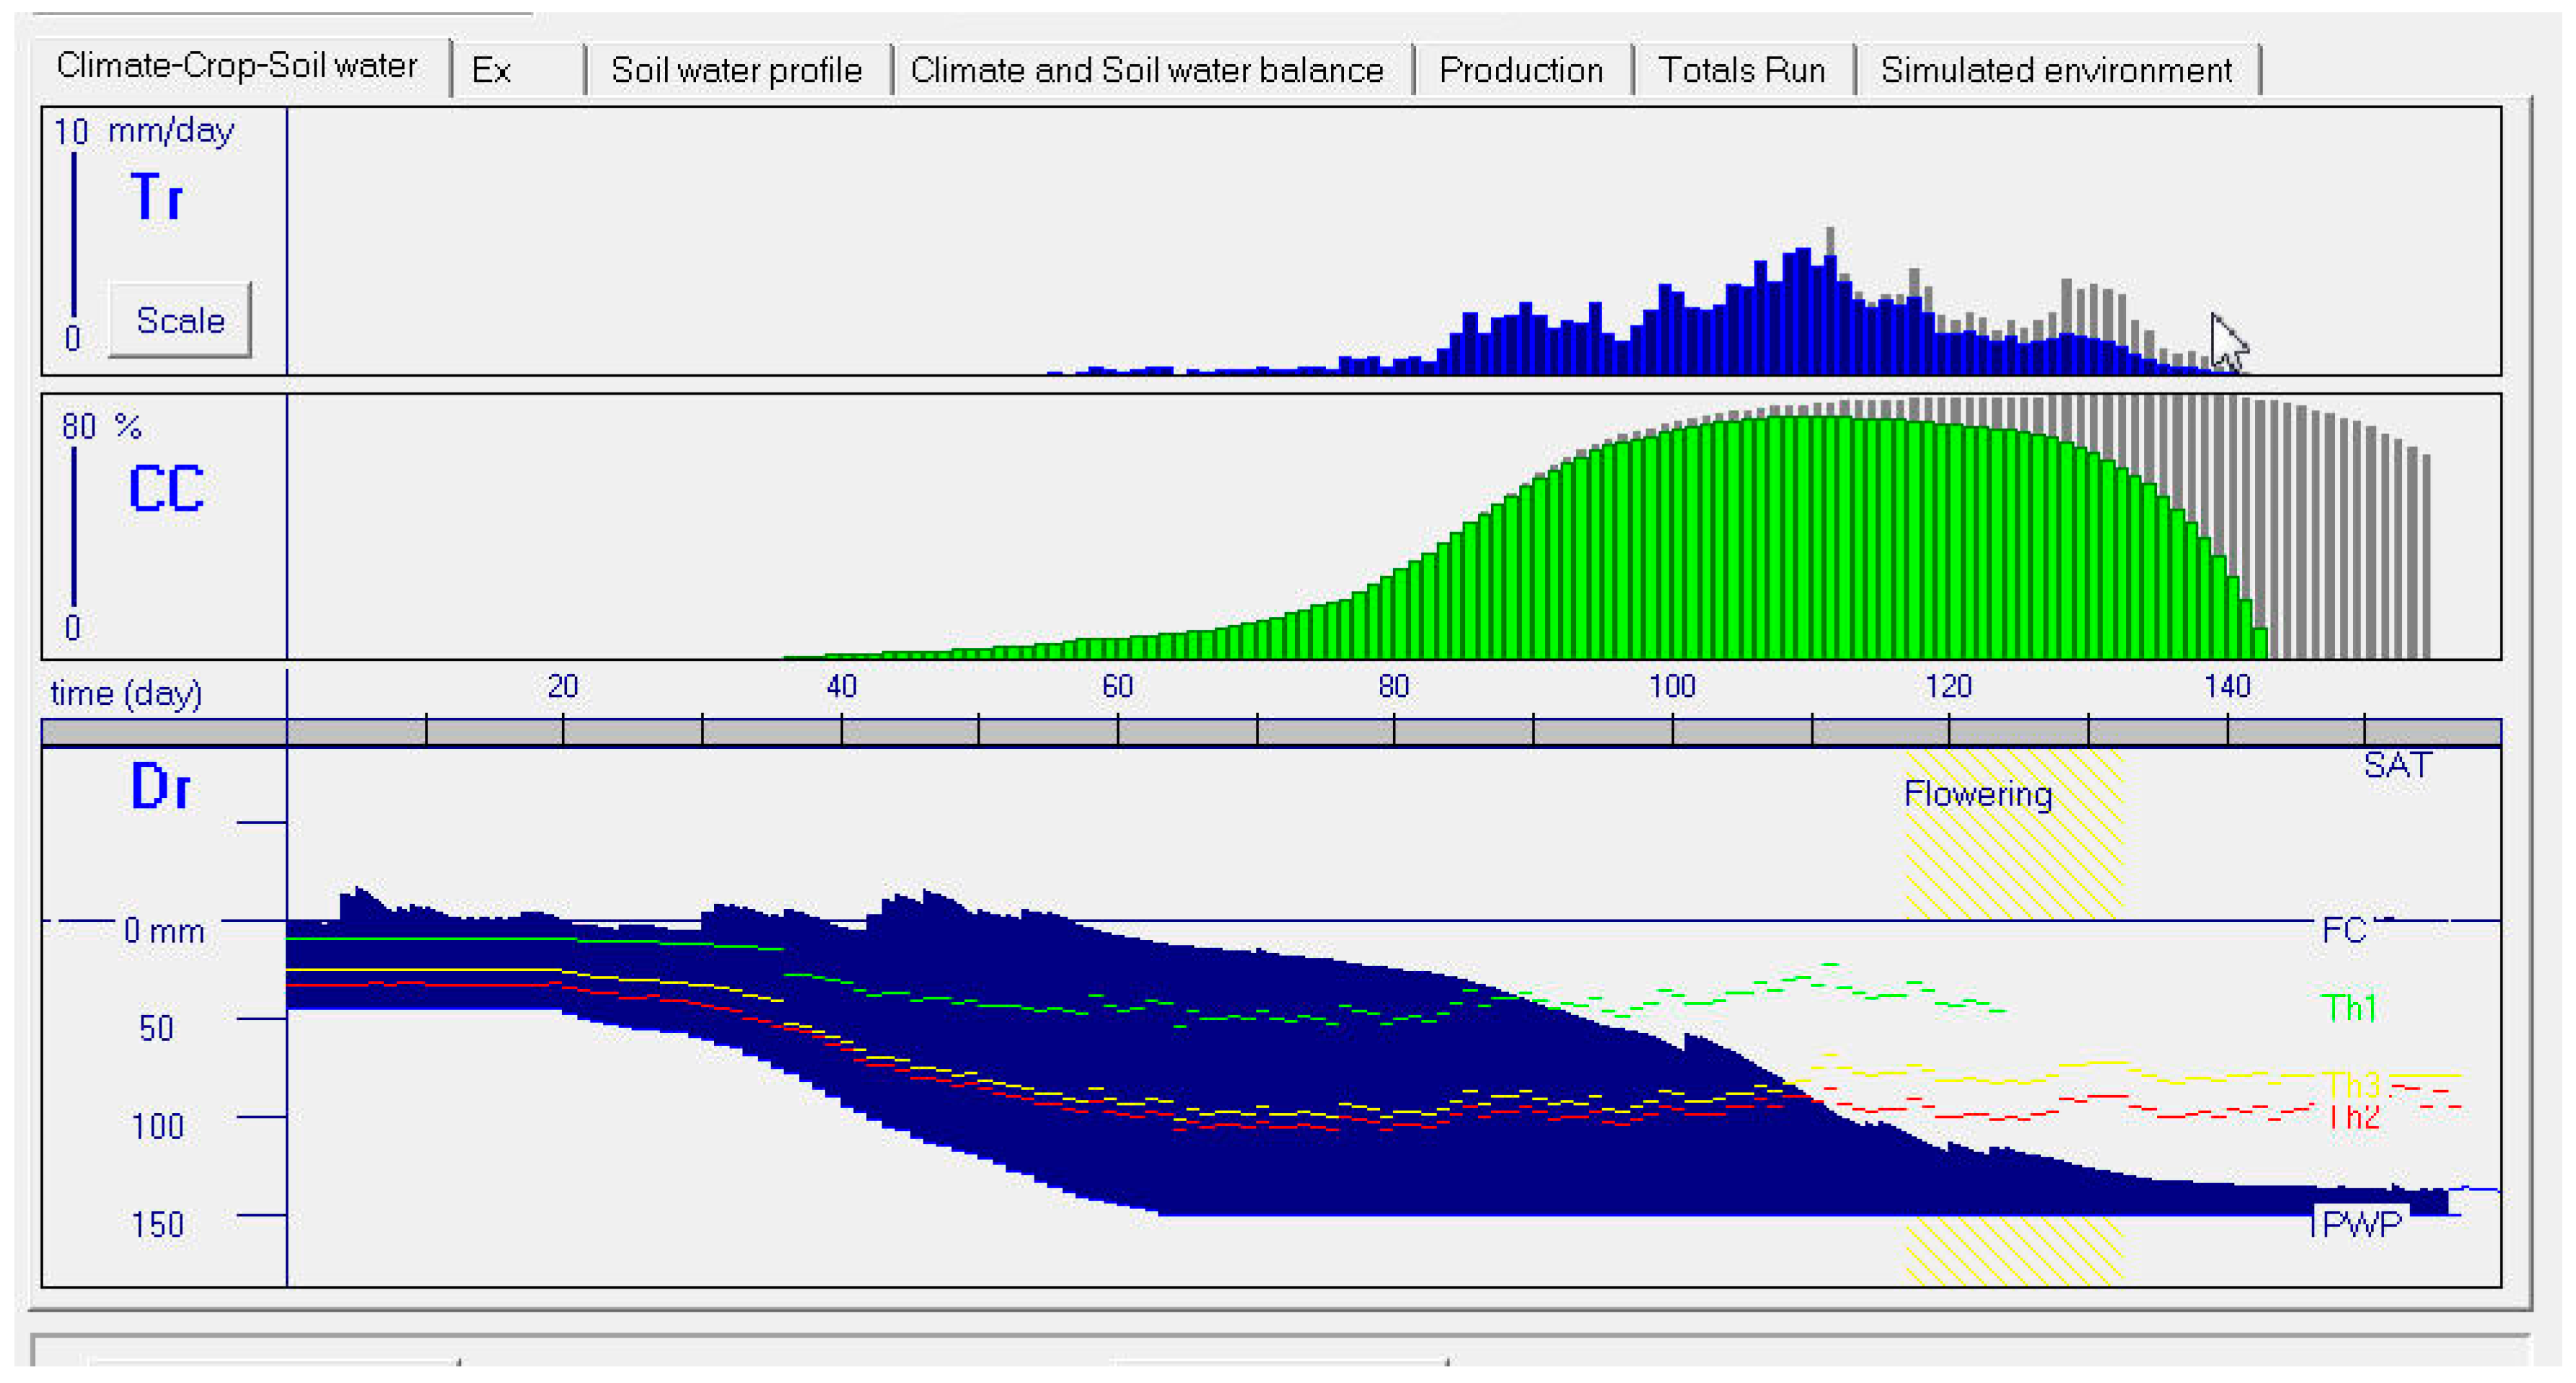
2.2. Simulations
2.3. Data Analysis
3. Results
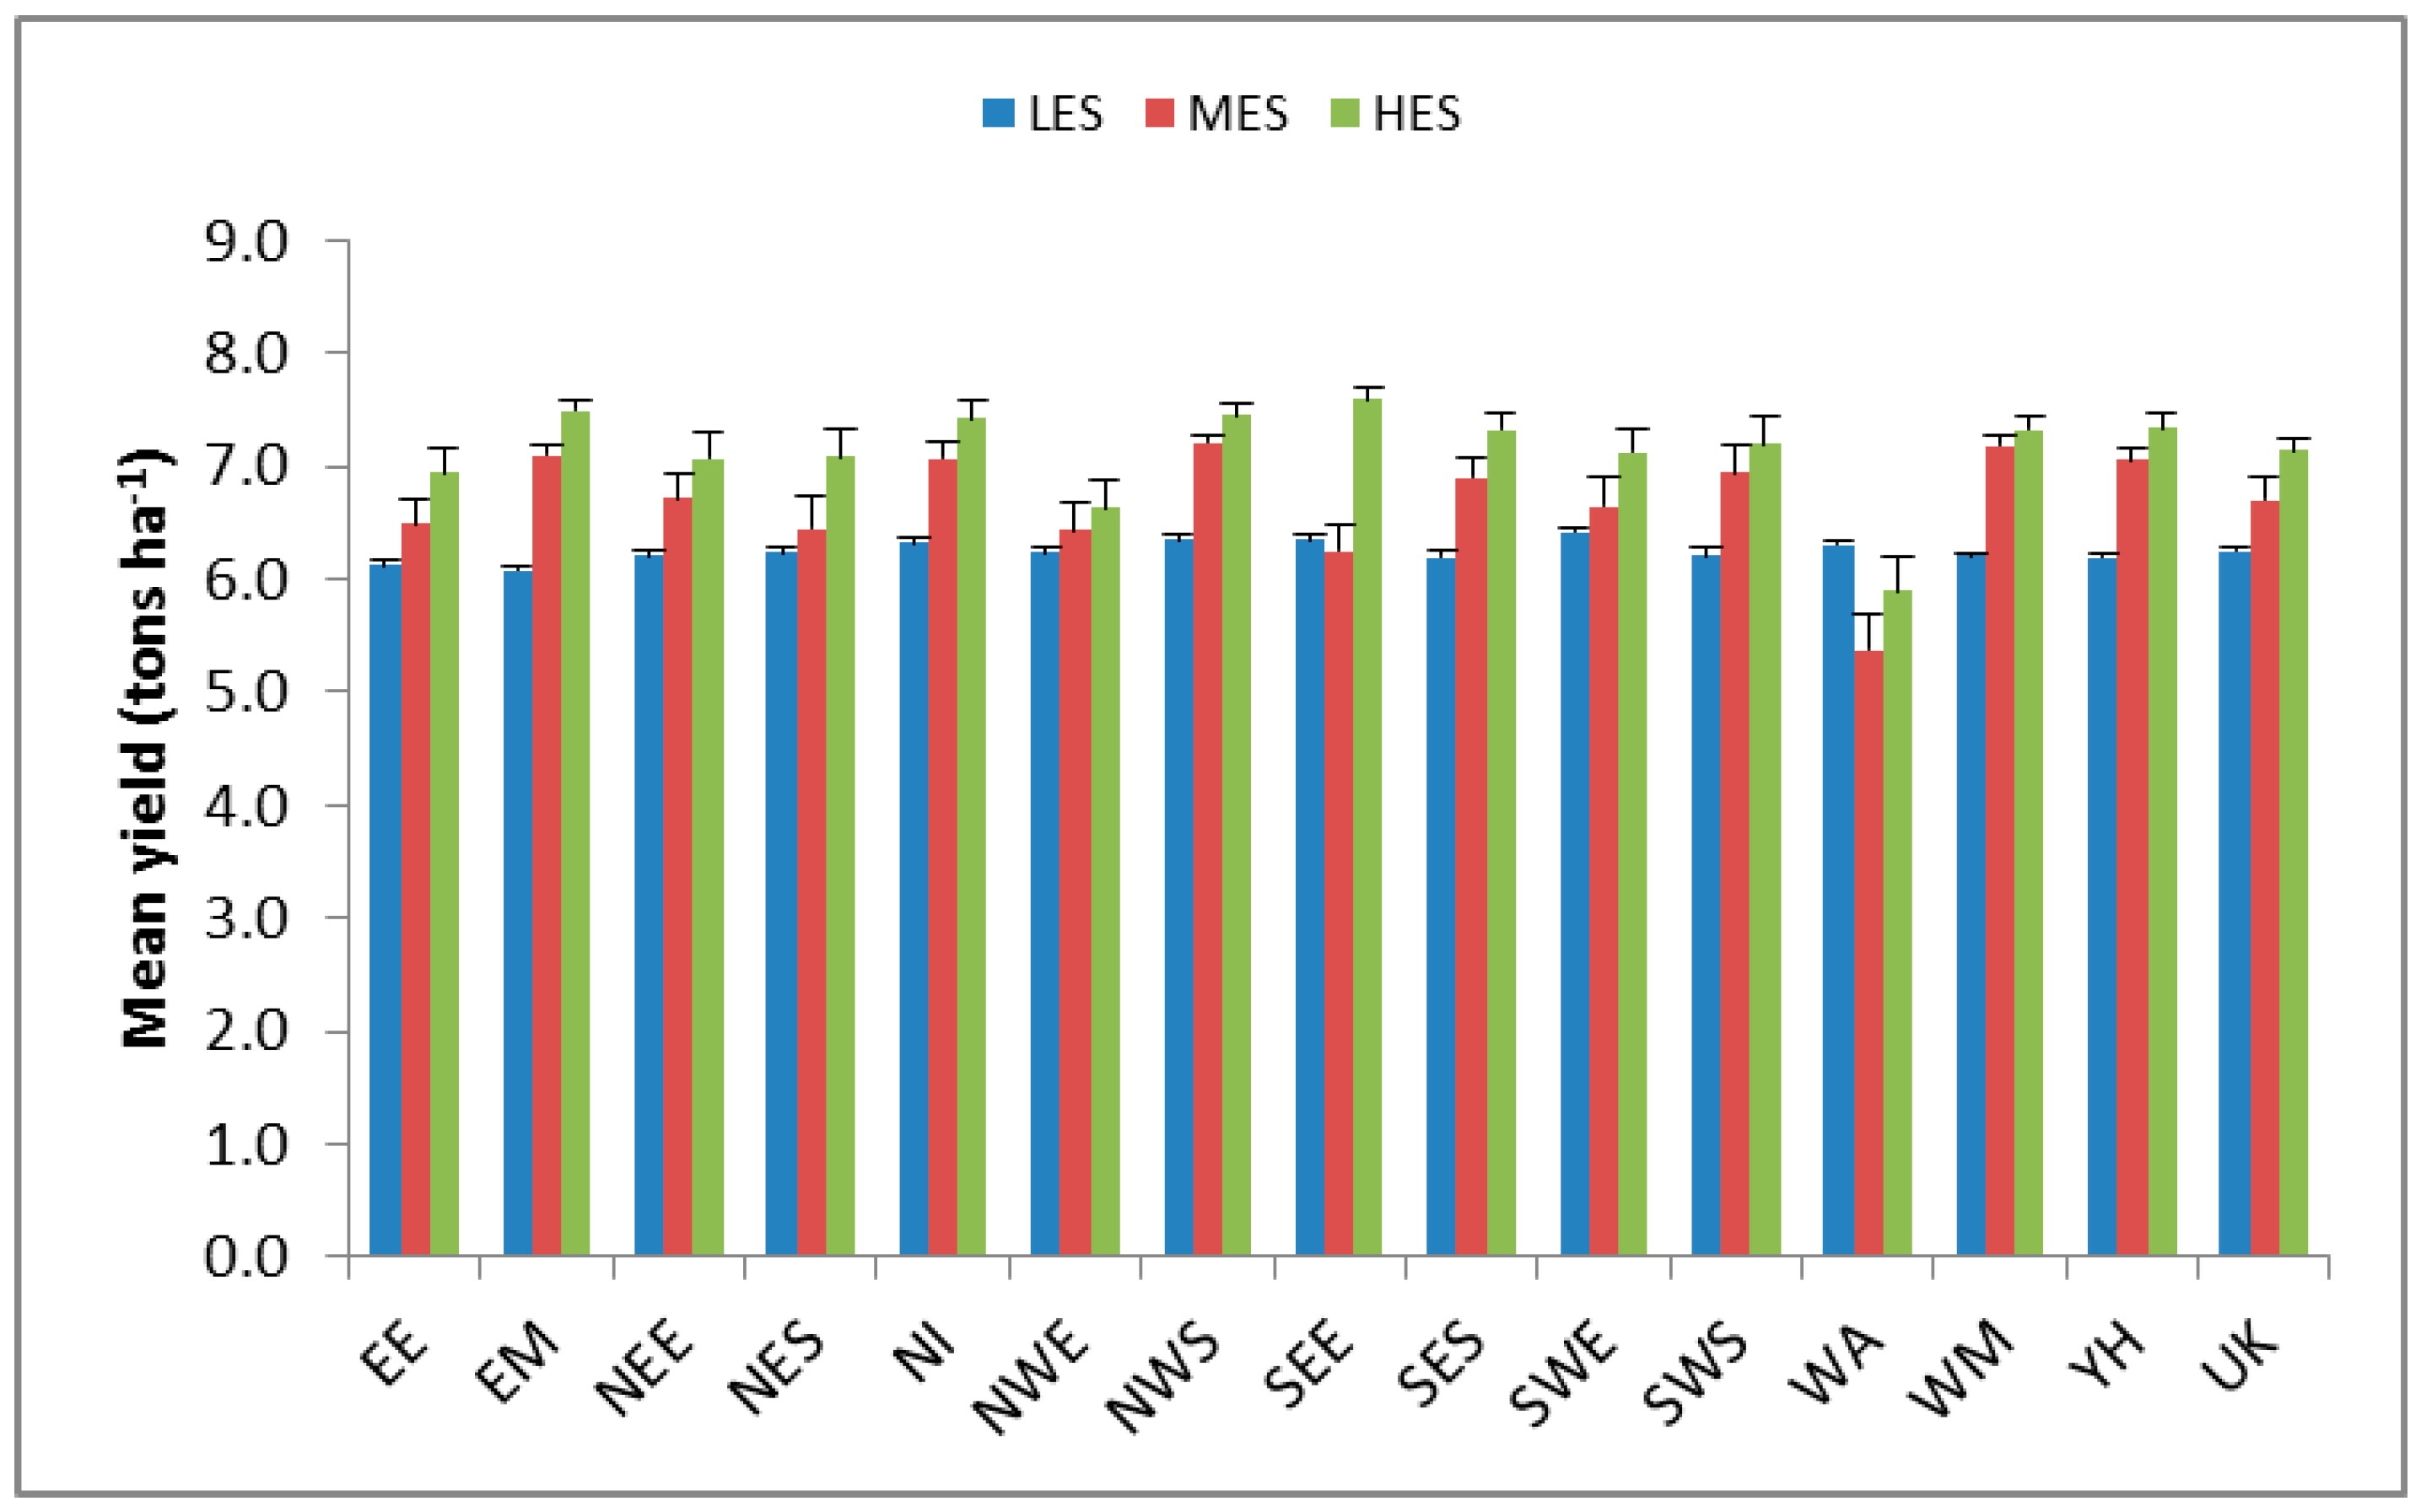
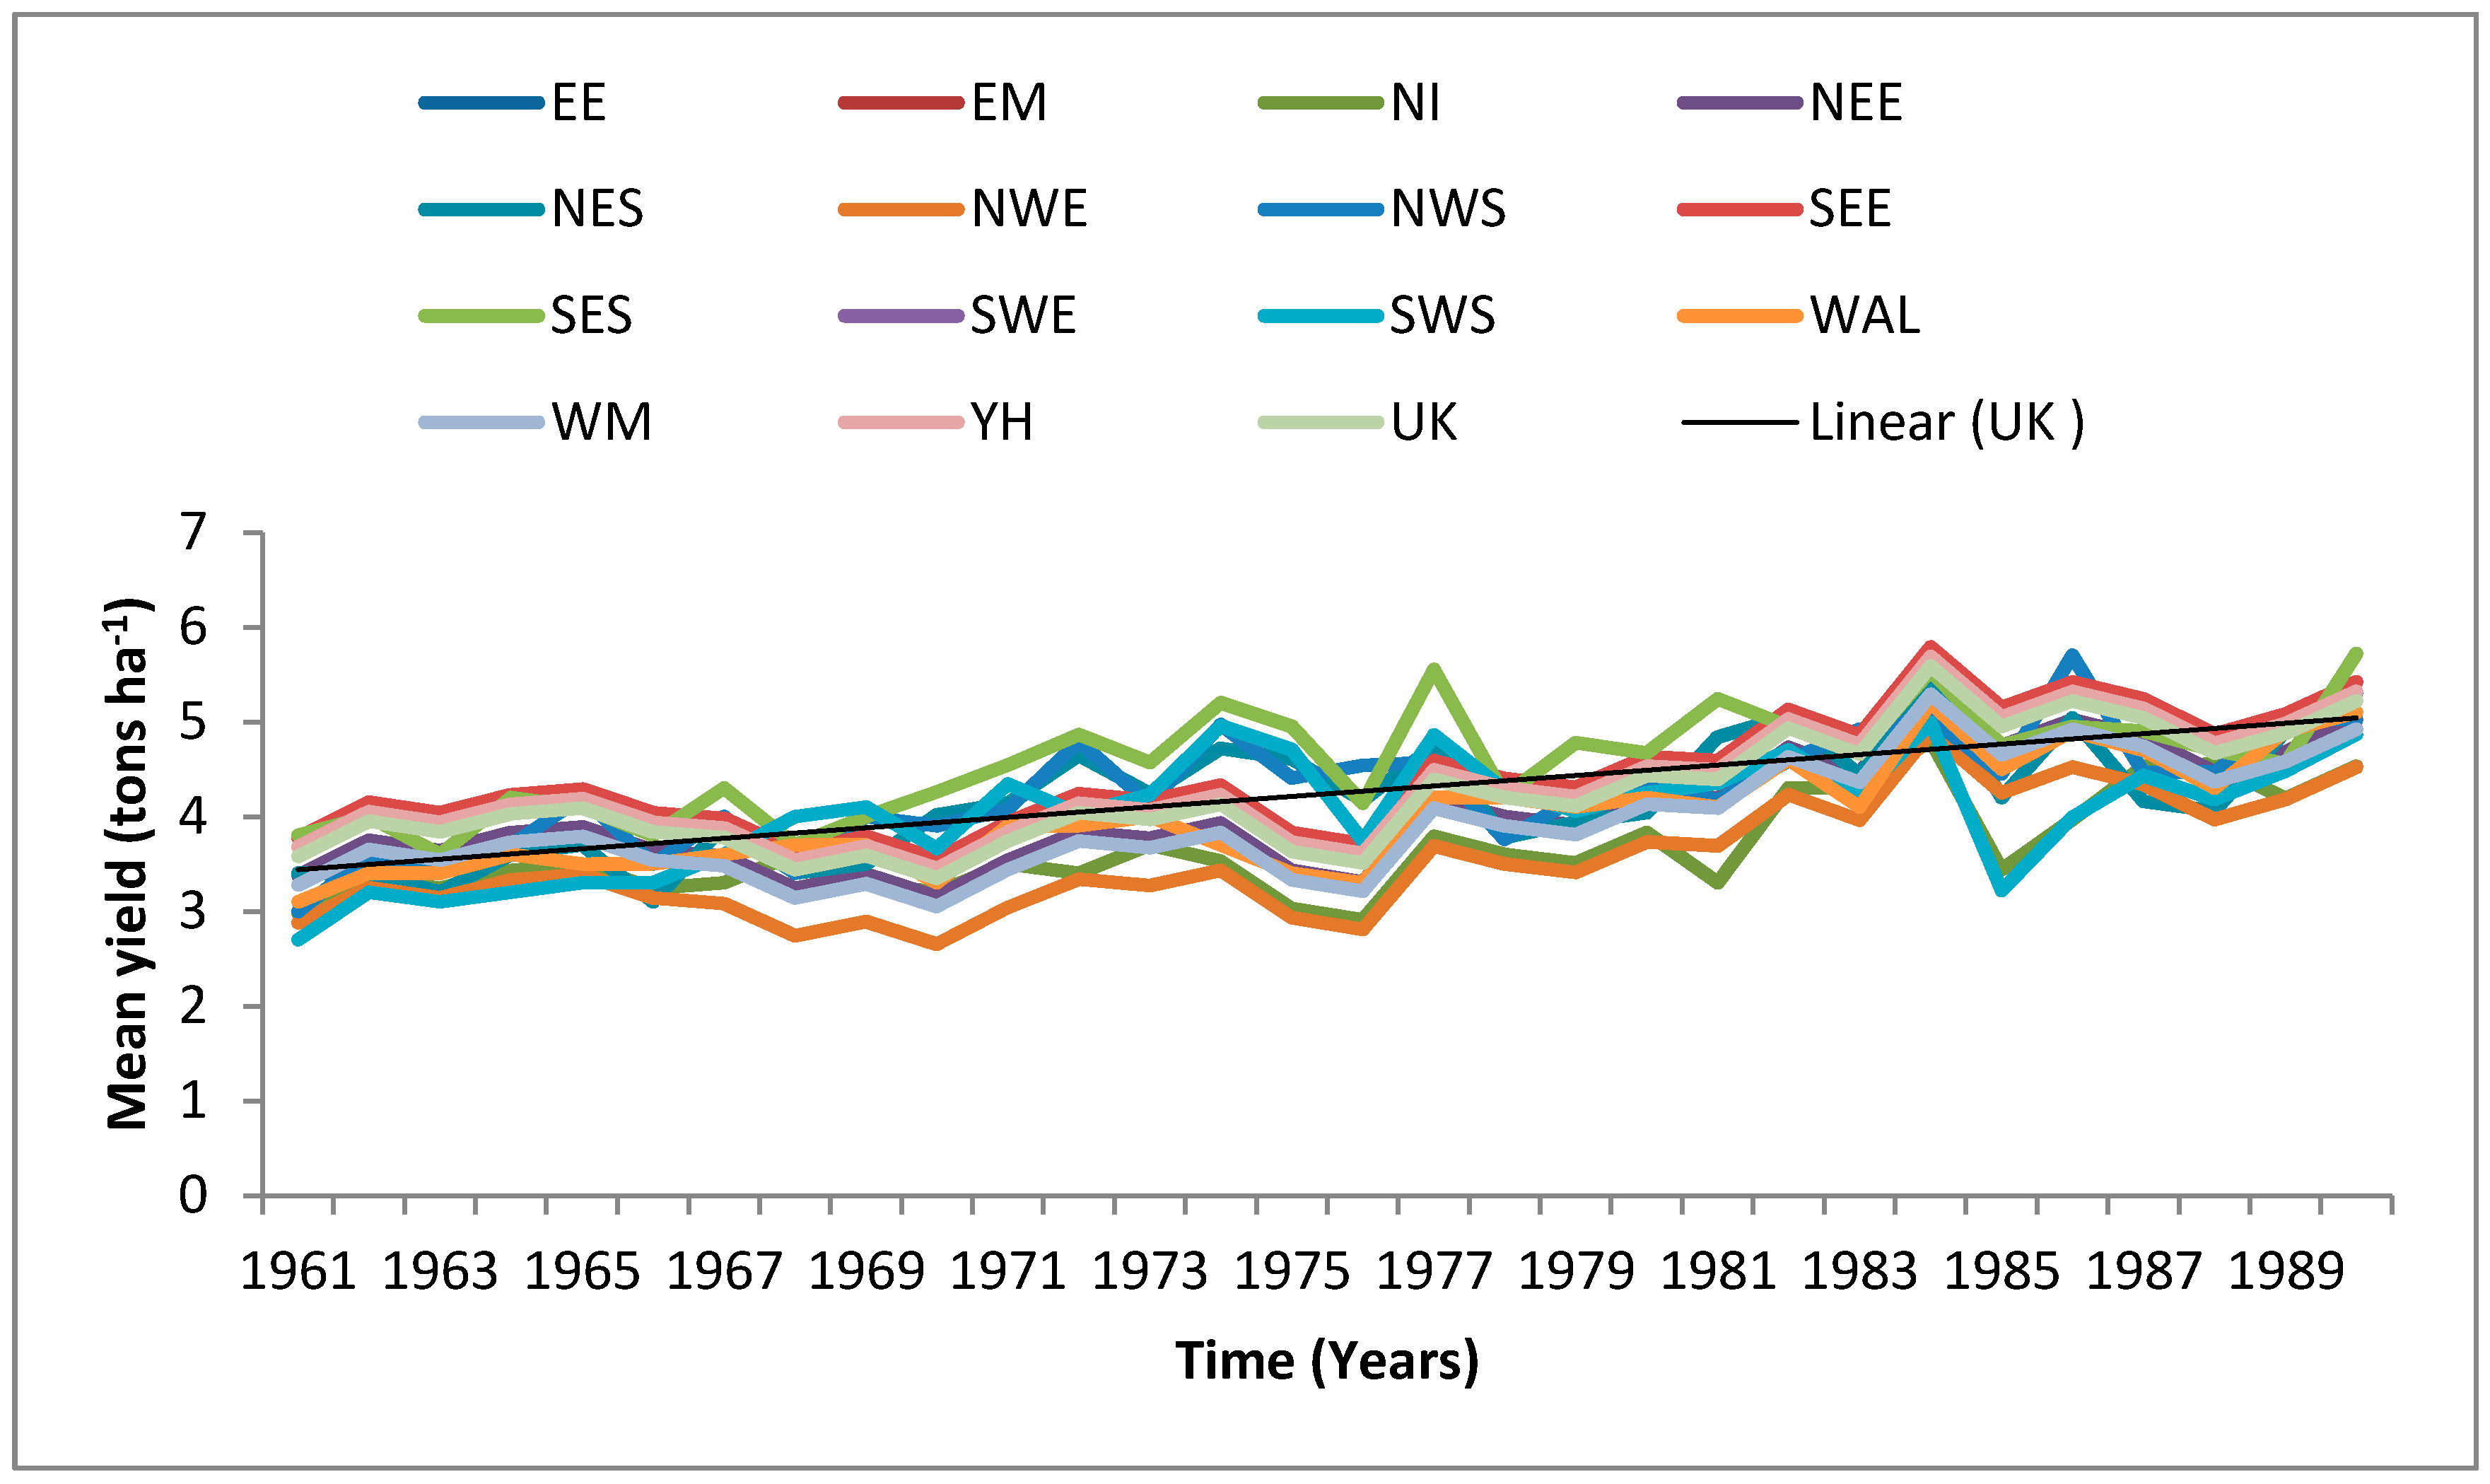
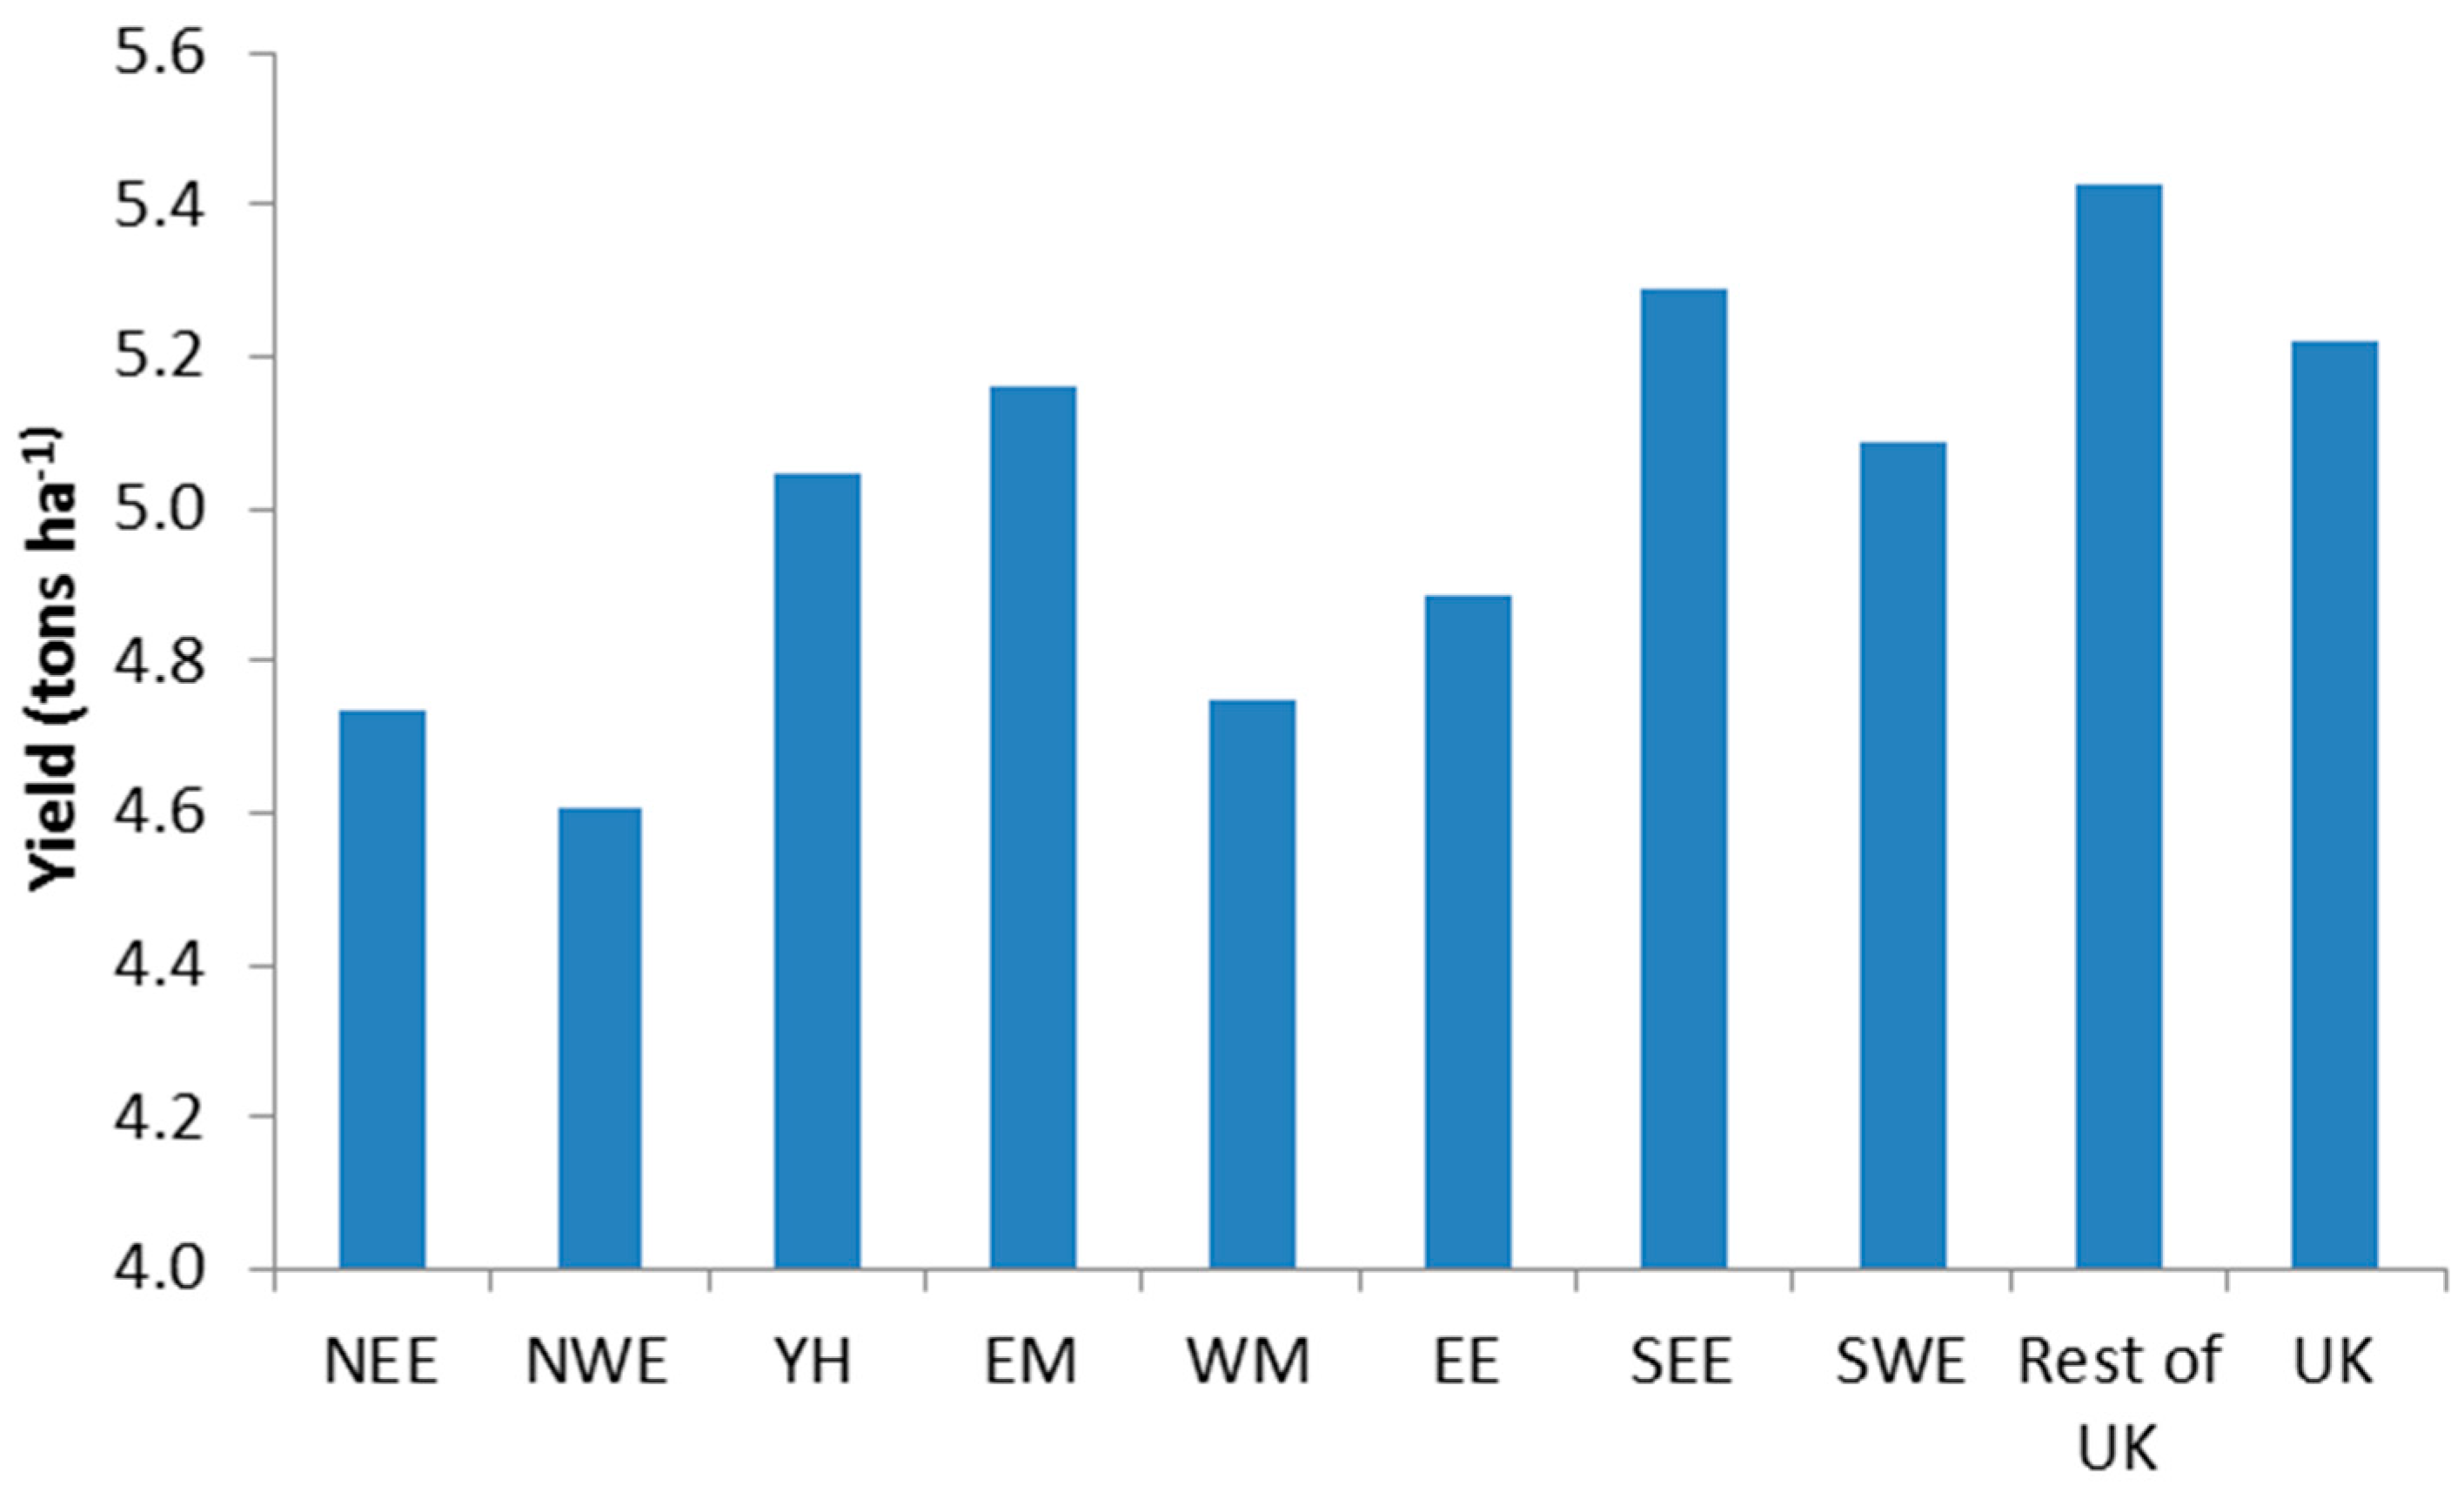
3.1. Baseline Yields
3.2. Accuracy of Sowing Dates
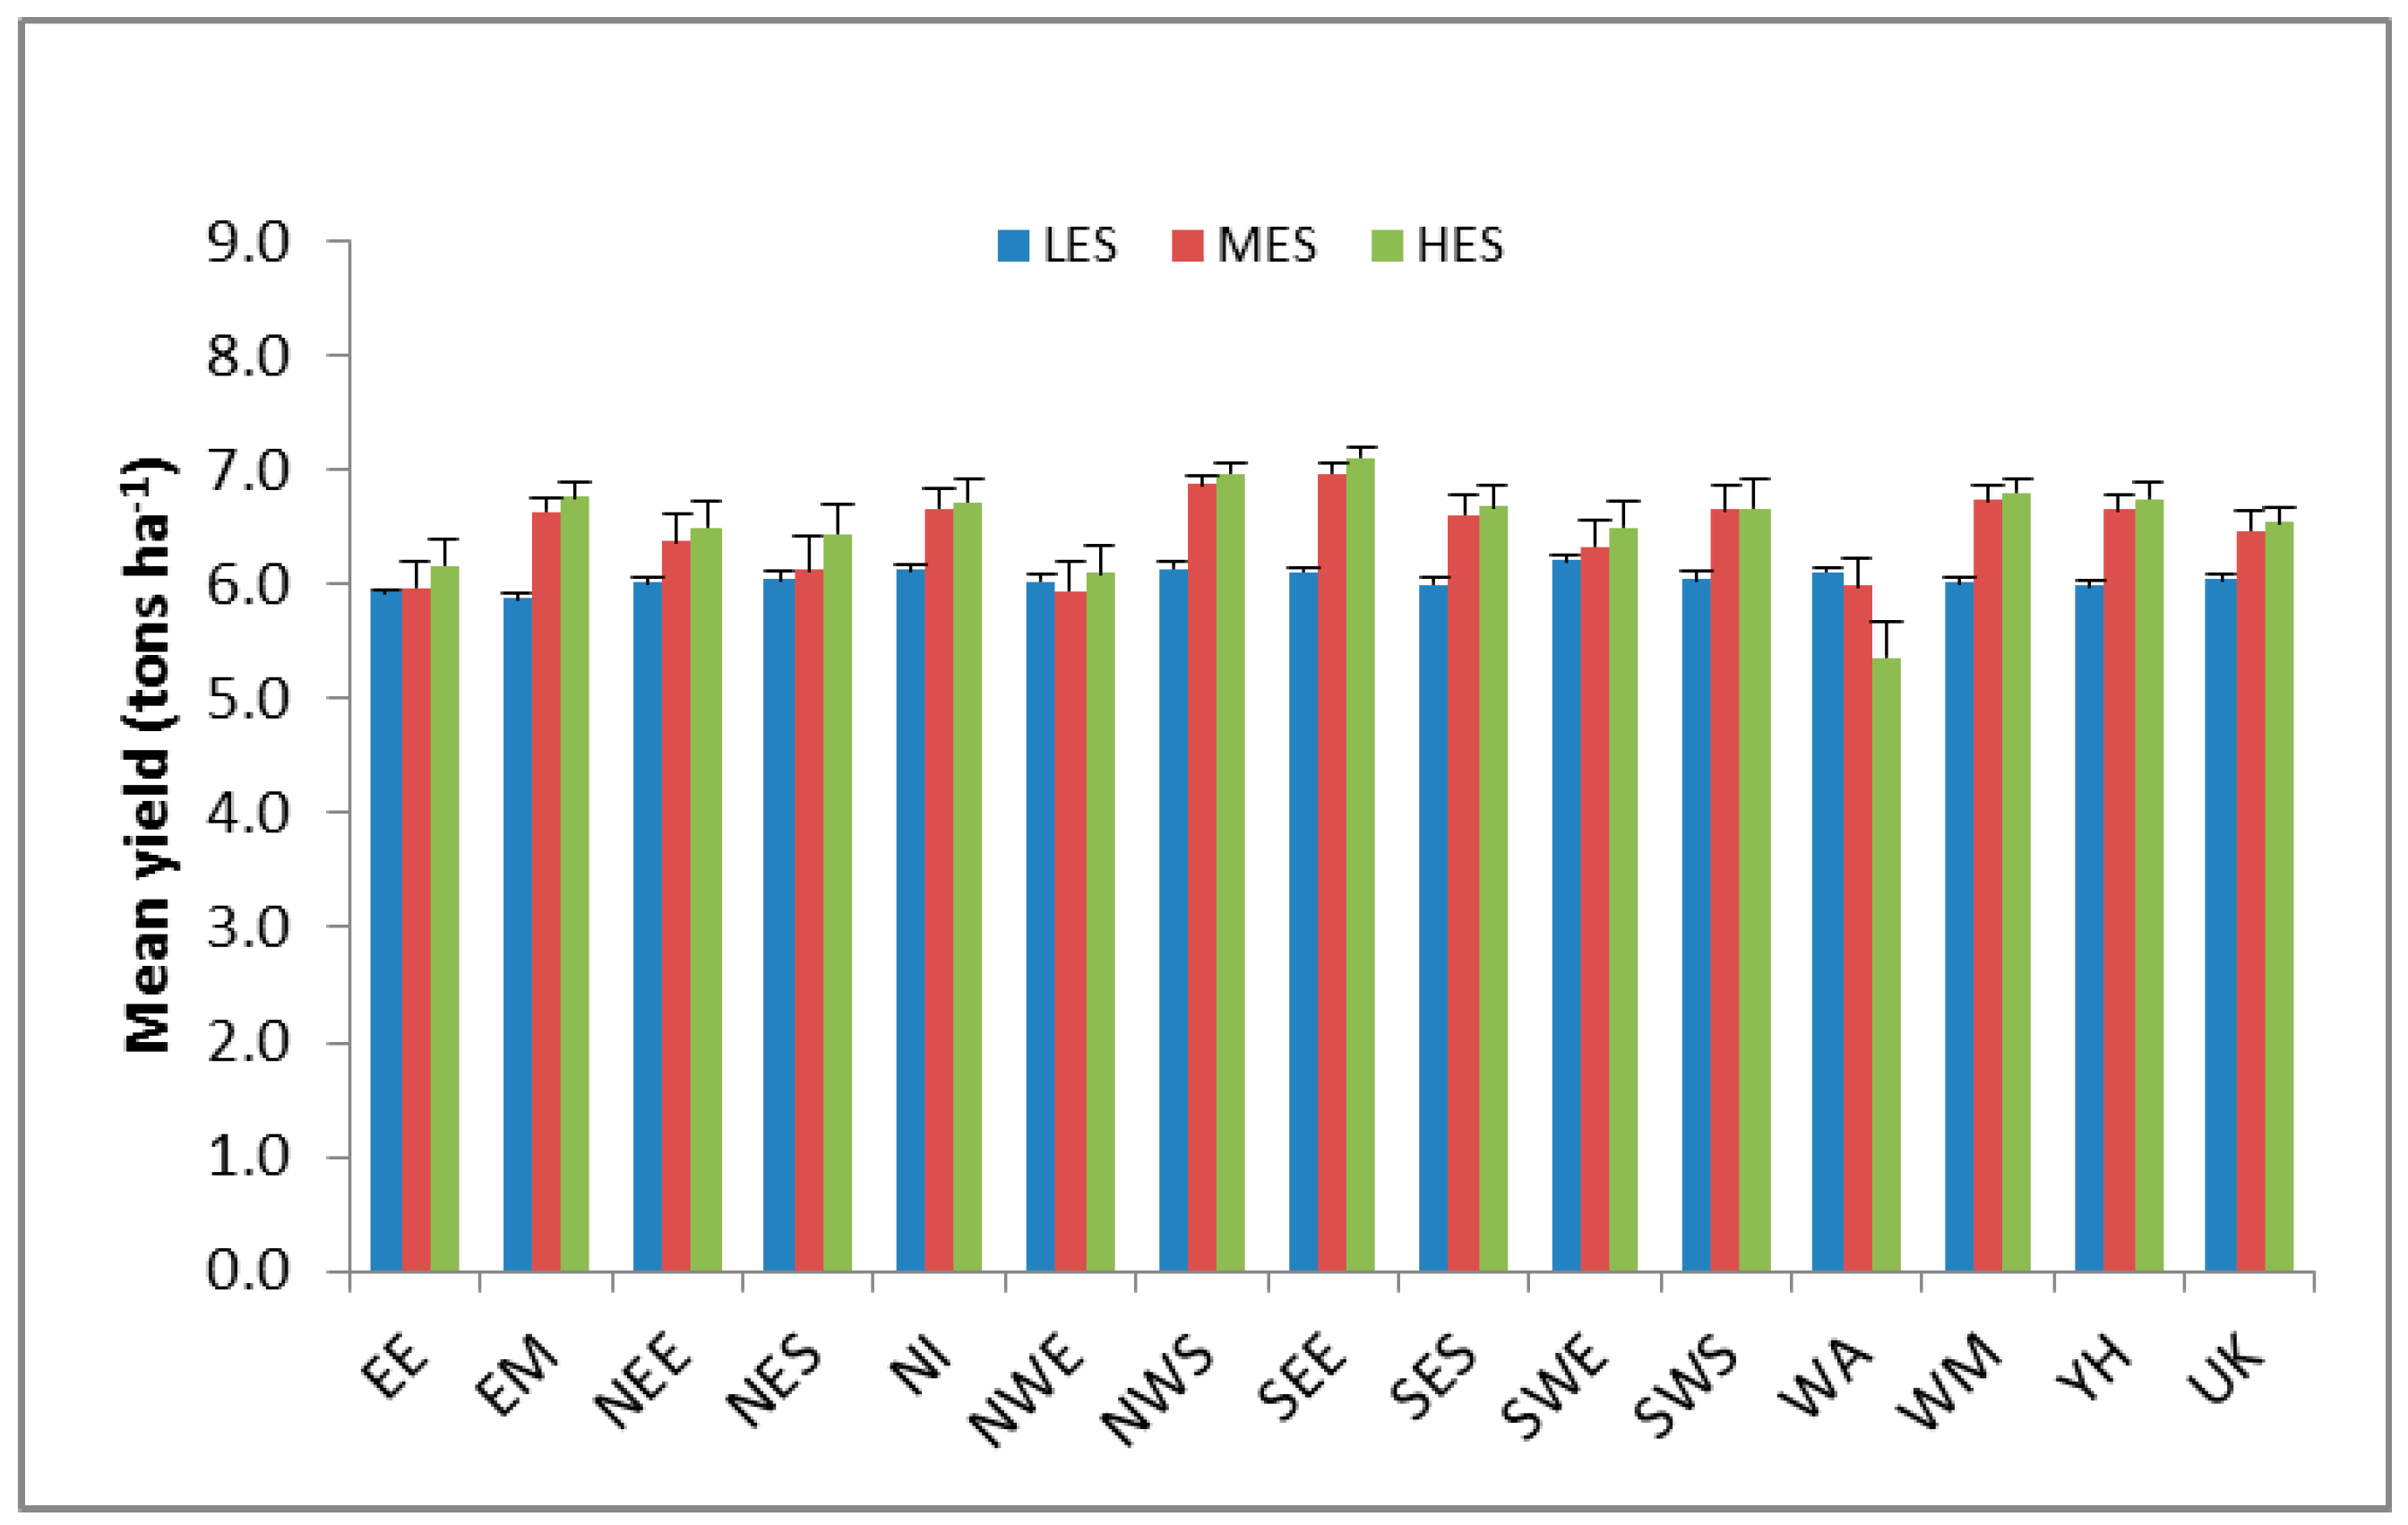
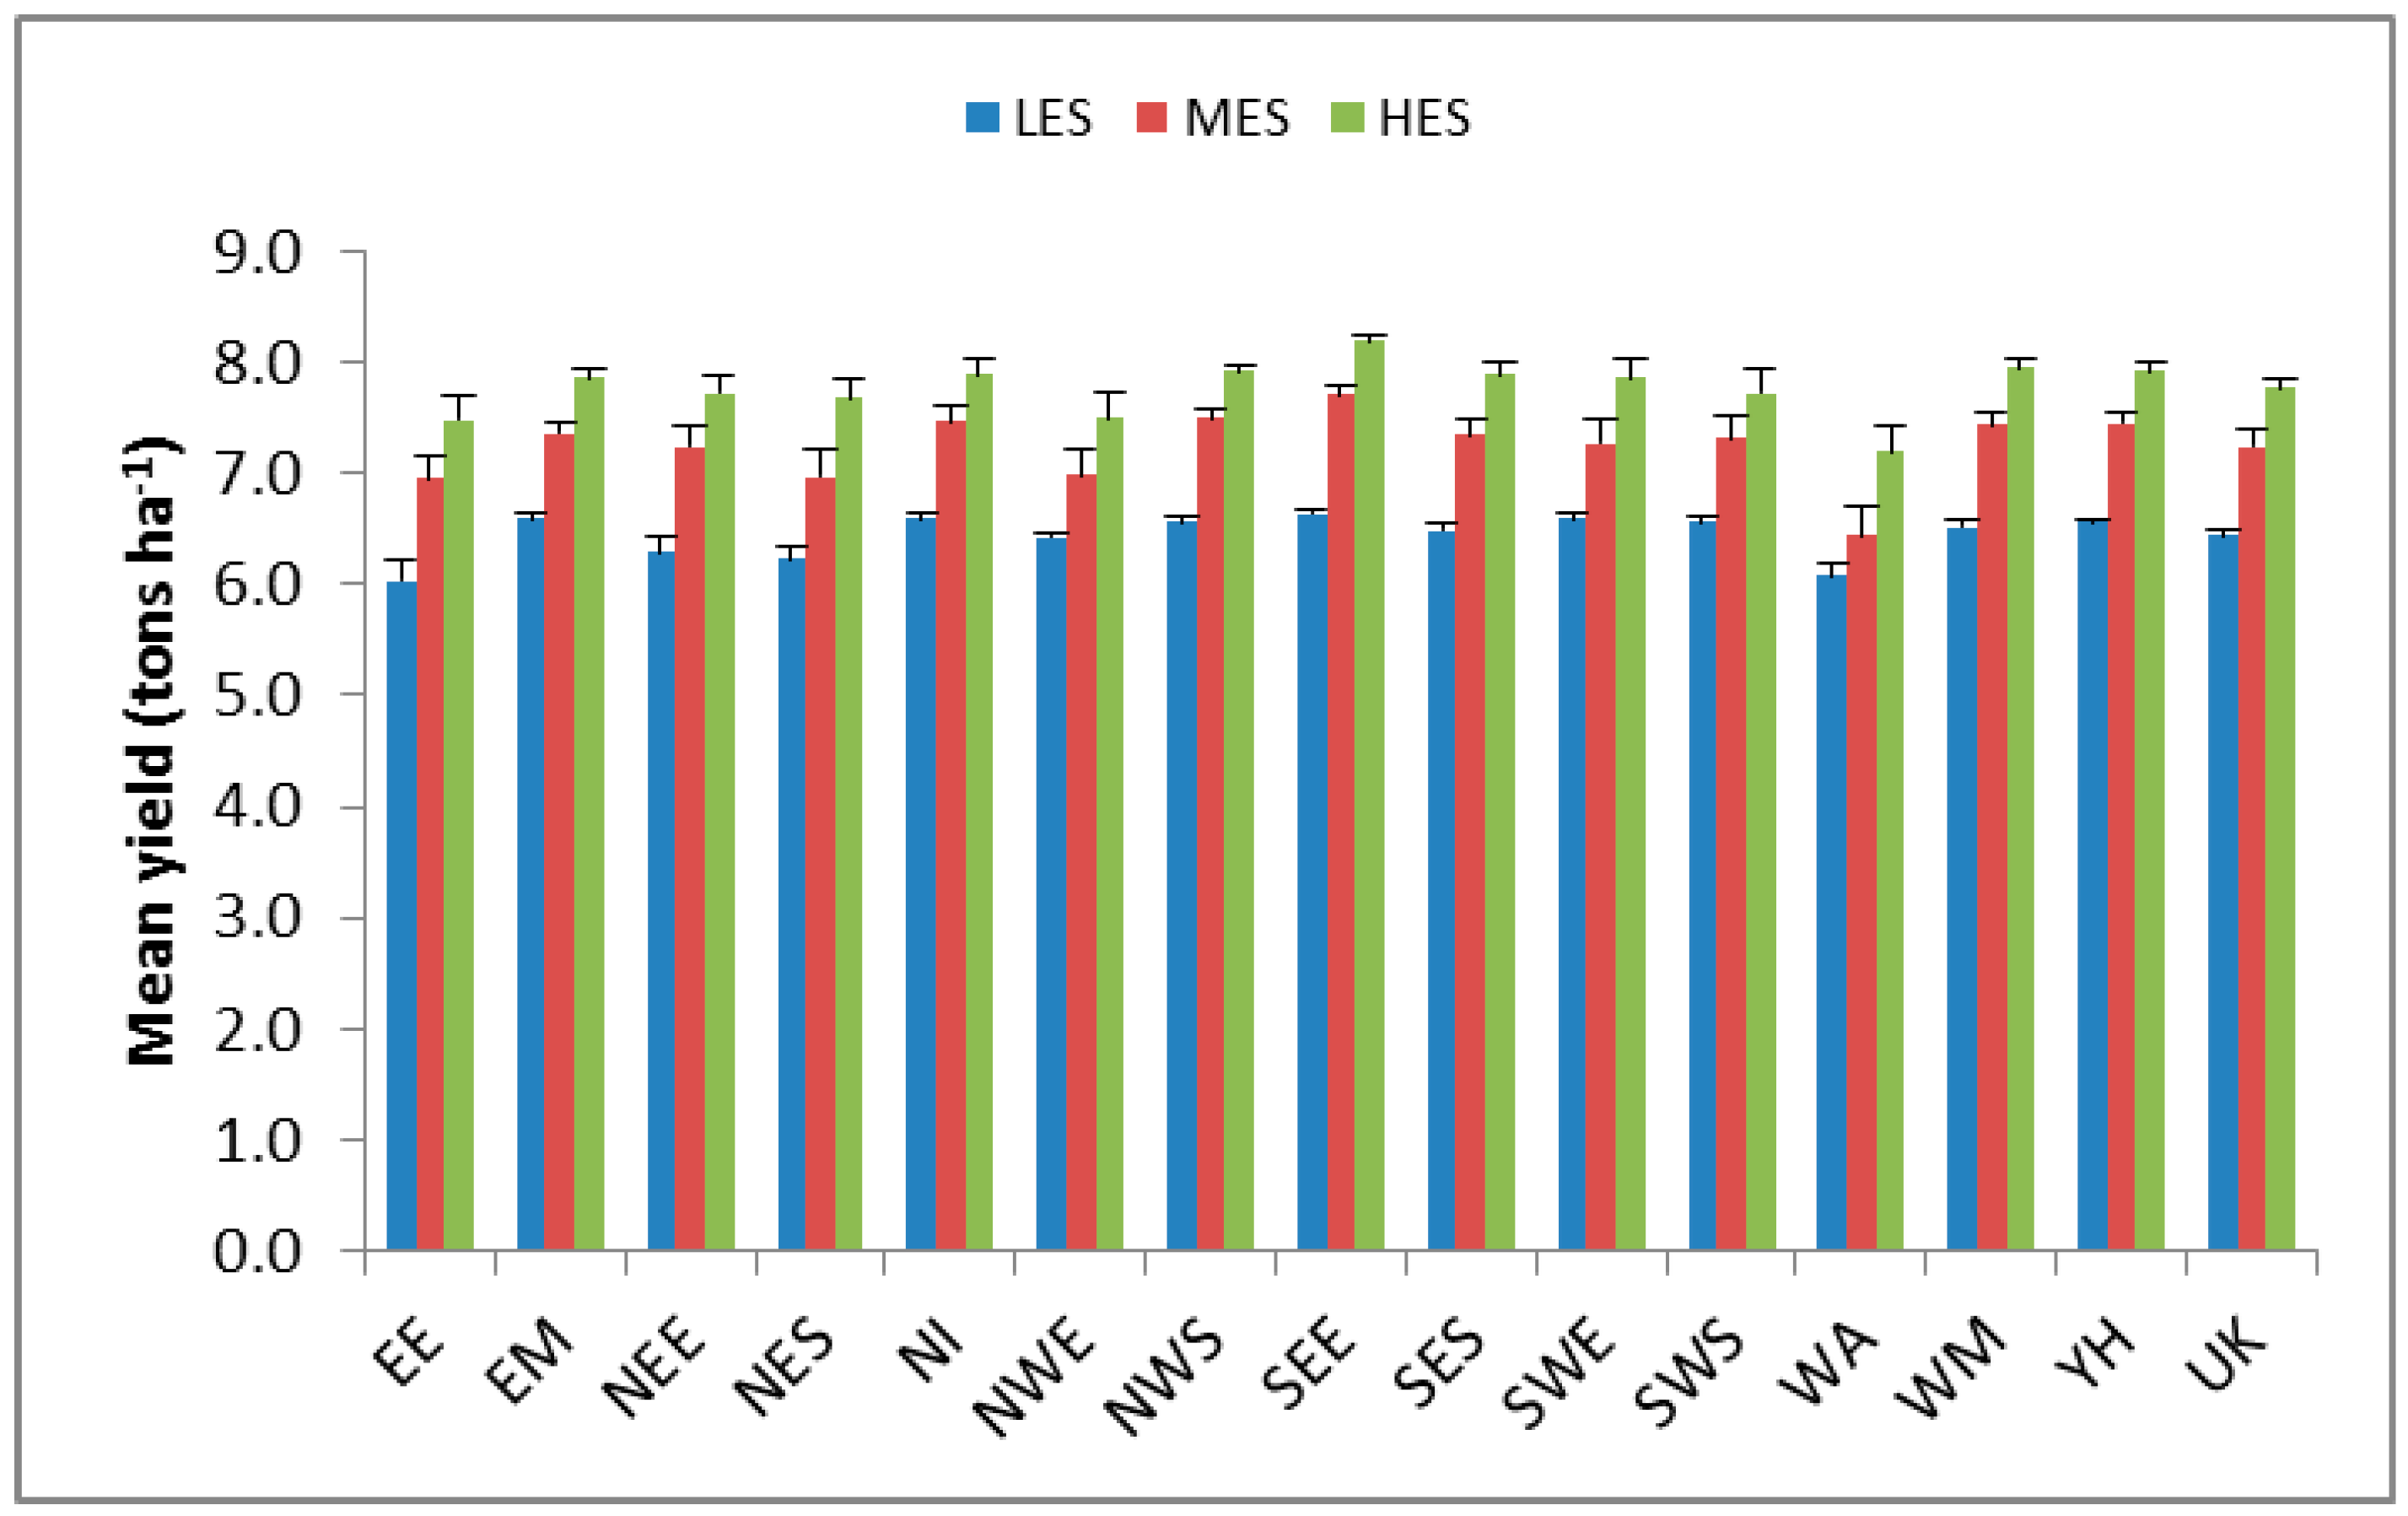
3.3. Simulated Future Yields of Barley
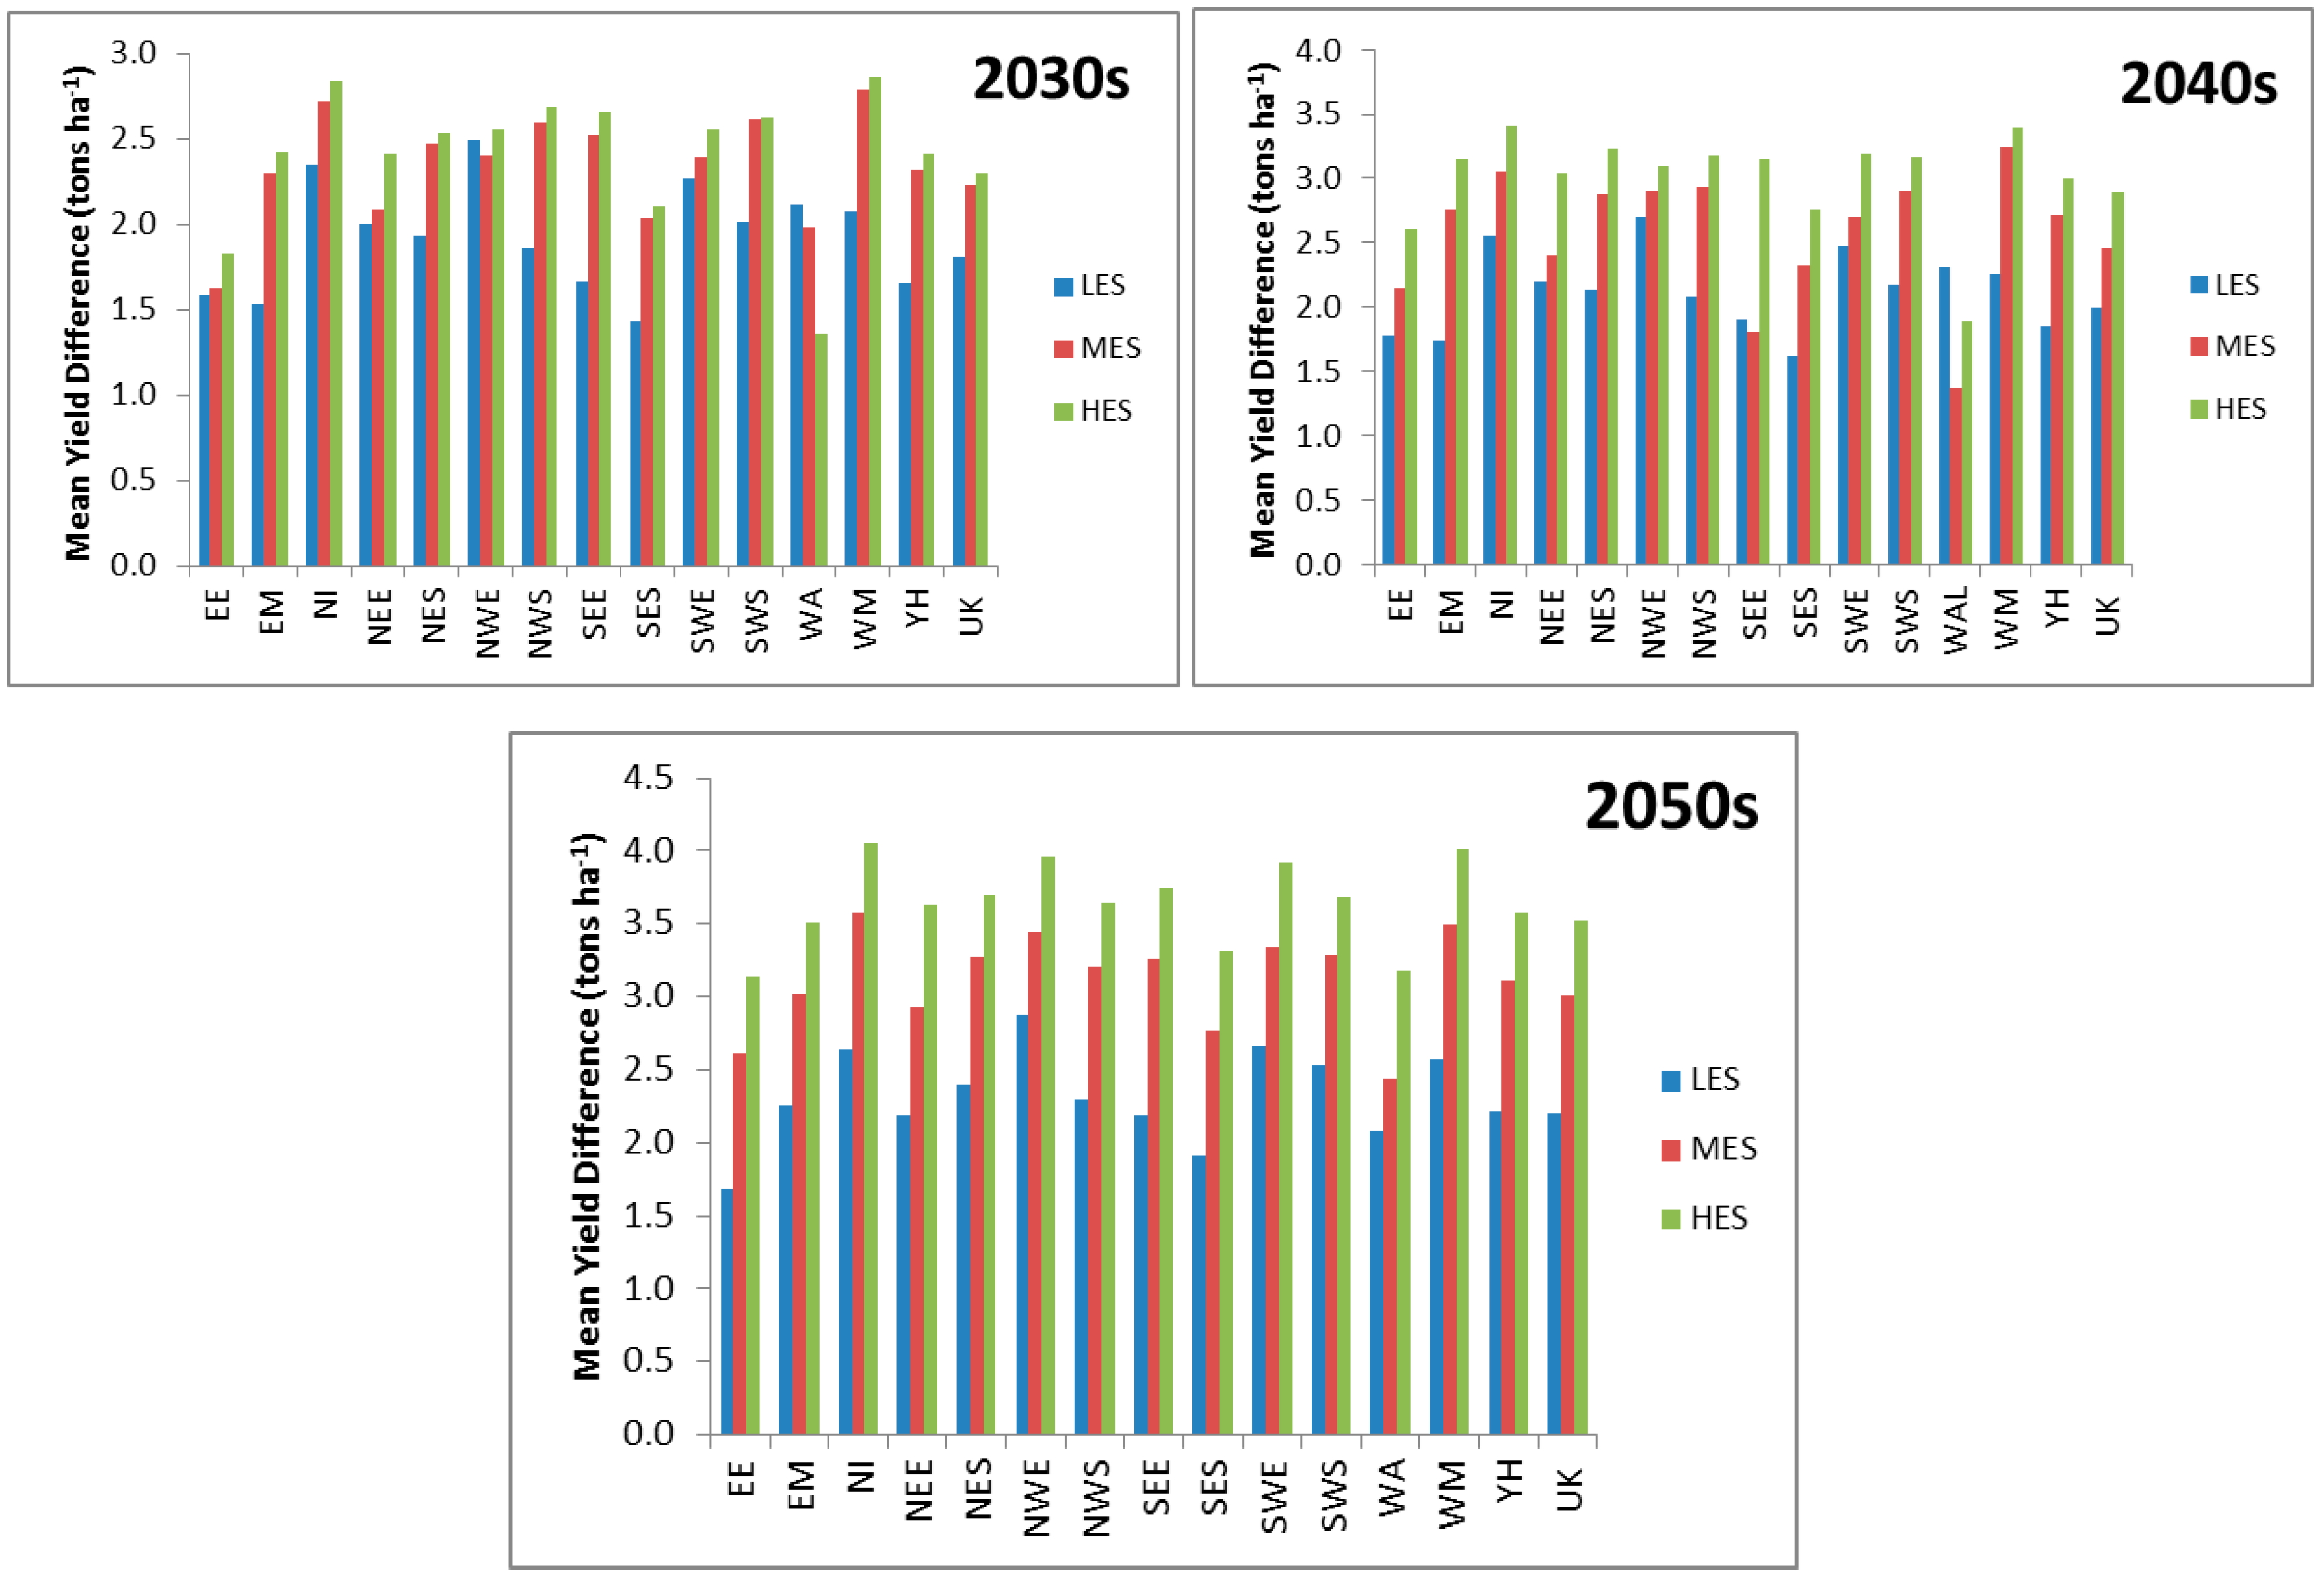
3.4. Differences between Future and Baseline Yields
3.5. Dips in Yields
4. Discussion
4.1. Sowing Date as a Source of Uncertainty
4.2. Yields under Climate Change
4.3. Stresses and Risks to Yields
5. Conclusions
Supplementary Materials
Acknowledgments
Author Contributions
Conflicts of Interest
References
- Newton, A.C.; Flavell, A.J.; George, T.S.; Leat, P.; Mulholland, B.; Ramsay, L.; Revoredo-Giha, C.; Russell, J.; Steffenson, B.J.; Swanston, J.S.; et al. Crops that feed the world 4. Barley: A resilient crop? Strengths and weaknesses in the context of food security. Food Secur. 2011, 3, 141–178. [Google Scholar] [CrossRef]
- Department of Environment, Food and Rural Affairs (Defra). Agriculture in the United Kingdom 2011; Produced for National Statistics; Department of Environment, Food and Rural Affairs (Defra): York, UK, 2011.
- Rötter, R.P.; Palosuo, T.; Pirttioja, N.K.; Dubrovsky, M.; Salo, T.; Fronzek, S.; Aikasalo, R.; Trnka, M.; Ristolainen, A.; Carter, T.R. What would happen to barley production in Finland if global warming exceeded 4 °C? A model-based assessment. Eur. J. Agron. 2011, 35, 205–214. [Google Scholar] [CrossRef]
- DaMatta, F.M.; Grandis, A.; Arenque, B.C.; Buckeridge, M.S. Impacts of climate change on crop physiology and food quality. Food Res. Int. 2010, 43, 1814–1823. [Google Scholar] [CrossRef]
- Richter, G.M.; Semenov, M.A. Modelling impacts of climate change on wheat yields in England and Wales: Assessing drought risks. Agric. Syst. 2005, 84, 77–97. [Google Scholar] [CrossRef]
- Fuhrer, J. Agroecosystem responses to combinations of elevated CO2, ozone and global climate change. Agric. Ecosyst. Environ. 2003, 97, 1–20. [Google Scholar] [CrossRef]
- Claesson, J.; Nycander, J. Combined effects of global warming and increased CO2-concentration on vegetation growth in water-limited conditions. Ecol. Model. 2013, 256, 23–30. [Google Scholar] [CrossRef]
- Clausen, S.K.; Frenck, G.; Linden, L.G.; Mikkelsen, T.N.; Lunde, C.; Jørgensen, R.B. Effects of single and multifactor treatments with elevated temperature, CO2 and ozone on oilseed rape and barley. J. Agron. Crop Sci. 2011, 197, 442–453. [Google Scholar] [CrossRef]
- Robredo, A.; Pérez-López, U.; Miranda-Apodaca, J.; Lacuesta, M.; Mena-Petite, A.; Muñoz Rueda, A. Elevated CO2 reduces the drought effect on nitrogen metabolism in barley plants during drought and subsequent recovery. Environ. Exp. Bot. 2011, 71, 399–408. [Google Scholar] [CrossRef]
- Robredo, A.; Pérez-López, U.; de la Maza, H.S.; González-Moro, B.; Lacuesta, M.; Mena-Petite, A.; Muñoz-Rueda, A. Elevated CO2 alleviates the impact of drought on barley improving water status by lowering stomatal conductance and delaying its effects on photosynthesis. Environ. Exp. Bot. 2007, 59, 252–263. [Google Scholar] [CrossRef]
- Wall, G.W.; Garcia, R.L.; Wechsung, F.; Kimball, B.A. Elevated atmospheric CO2 and drought effects on leaf gas exchange properties of barley. Agric. Ecosyst. Environ. 2011, 144, 390–404. [Google Scholar] [CrossRef]
- Manderscheid, R.; Pacholski, A.; Frühauf, C.; Weigel, H.-J. Effects of free air carbon dioxide enrichment and nitrogen supply on growth and yield of winter barley cultivated in a crop rotation. Field Crops Res. 2009, 119, 185–196. [Google Scholar] [CrossRef]
- Barnabás, B.; Jäger, K.; Fehér, A. The effect of drought and heat stress on reproductive processes in cereals. Plant Cell Environ. 2008, 31, 11–38. [Google Scholar] [CrossRef] [PubMed]
- Holden, N.M.; Brereton, A.J.; Fealy, R.; Sweeney, J. Possible change in Irish climate and its impact on barley and potato yields. Agric. For. Meteorol. 2003, 116, 181–196. [Google Scholar] [CrossRef]
- Fangmeier, A.; Chrost, B.; Högy, P.; Krupinska, K. CO2 enrichment enhances flag leaf senescence in barley due to greater grain nitrogen sink capacity. Environ. Exp. Bot. 2000, 44, 151–164. [Google Scholar] [CrossRef]
- Sæbø, A.; Mortensen, L.M. Growth, morphology and yield of wheat, barley and oats grown at elevated atmospheric CO2 concentration in a cool maritime climate. Agric. Ecosyst. Environ. 1996, 57, 9–15. [Google Scholar] [CrossRef]
- Anjum, S.A.; Xie, X.; Wang, L.C.; Saleem, M.F. Morphological, physiological and biochemical responses of plants to drought stress. Afr. J. Agric. Res. 2011, 6, 2026–2032. [Google Scholar]
- Semenov, M.A.; Shewry, P.R. Modelling predicts that heat stress, not drought, will increase vulnerability of wheat in Europe. Sci. Rep. 2011, 1, 1–5. [Google Scholar] [CrossRef] [PubMed]
- González, A.; Martin, I.; Ayerbe, L. Barley yield in water-stress conditions: The influence of precocity, osmotic adjustment and stomatal conductance. Field Crops Res. 1999, 62, 23–34. [Google Scholar] [CrossRef]
- Ainsworth, E.A.; Rogers, A. The response of photosynthesis and stomatal conductance to rising [CO2]: Mechanisms and environmental interactions. Plant Cell Environ. 2007, 30, 258–270. [Google Scholar] [CrossRef] [PubMed]
- Steduto, P. Biomass Water-Productivity: Comparing the Growth-Engines of Crop Models; FAO Expert Consultation on Crop Water Productivity under Deficient Water Supply; Food and Agriculture Organization of the United Nations: Rome, Italy, 2003. [Google Scholar]
- Kuchar, L.; Lipiec, J.; Rejman, J.; Kolodziej, J.; Kaszewski, B. Simulation of potential yields of spring barley in central-eastern Poland using the CERES-Barley model. Acta Agrophys. 2004, 106, 541–551. [Google Scholar]
- Trnka, M.; Dubrovsky, M.; Žalud, Z. Climate change impacts and adaptation strategies in spring barley production in the Czech Republic. Clim. Chang. 2004, 64, 227–255. [Google Scholar] [CrossRef]
- Havlinka, P.; Trnka, M.; Eitzinger, J.; Smutný, V.; Thaler, S.; Žalud, Z.; Rischbeck, P.; Křen, J. The performance of CERES-Barley and CERES-Wheat under various soil conditions and tillage practices in Central Europe. Die Bodenkult. 2010, 61, 5–17. [Google Scholar]
- Travasso, M.I.; Magrin, G.O. Utility of CERES-Barley under argentine conditions. Field Crops Res. 1998, 57, 329–333. [Google Scholar] [CrossRef]
- Ouda, S.A.; Khalil, F.A.; Afandi, G.E.; Ewis, M.M. Using CropSyst model to predict barley yield under climate change conditions in Egypt: I. Model calibration and validation under current climate. Afr. J. Plant Sci. Biotechnol. 2010, 4, 1–5. [Google Scholar]
- Ouda, S.A.; Khalil, F.A.; Afandi, G.E.; Ewis, M.M. Using CropSyst model to predict barley yield under climate change conditions in Egypt: II. Simulation of the effect of rescheduling irrigation on barley yield. Afr. J. Plant Sci. Biotechnol. 2010, 4, 6–10. [Google Scholar]
- Alexandrov, V.; Eitzinger, J.; Cajic, V.; Oberforster, M. Potential impact of climate change on selected agricultural crops in North-Eastern Austria. Glob. Chang. Biol. 2002, 8, 372–389. [Google Scholar] [CrossRef]
- Rötter, R.P.; Palosuo, T.; Kersebaum, K.C.; Angulo, C.; Bindi, M.; Ewert, F.; Ferrise, R.; Hlavinka, P.; Moriondo, M.; Nende, C.; et al. Simulation of spring barley yield in different climatic zones of Northern and Central Europe: A comparison of nine crop models. Field Crops Res. 2012, 133, 23–36. [Google Scholar] [CrossRef]
- Todorovic, M.; Albrizio, R.; Zivotic, L.; Saab, A.M.-T.; Stockle, C.; Steduto, P. Assessment of AquaCrop, CropSyst and WOFOST models in the simulation of sunflower growth under different water regimes. Agron. J. 2009, 101, 509–521. [Google Scholar] [CrossRef]
- Raes, D.; Steduto, P.; Hsiao, T.C.; Fereres, E. AquaCrop—The FAO crop model to simulate yield response to water: II. Main algorithms and software description. Agron. J. 2009, 101, 438–447. [Google Scholar] [CrossRef]
- Yawson, D.O. Climate Change and Virtual Water: Implications for UK Food Security. Ph.D. Thesis, University of Dundee, Dundee, UK, 2013. [Google Scholar]
- Murphy, J.M.; Sexton, D.M.H.; Jenkins, G.J.; Boorman, P.; Booth, B.; Brown, K.; Clark, R.; Collin, M.; Harris, G.; Kendon, L.; et al. UK Climate Projections Science Report: Climate Change Projections; Met Office Hadley Centre: Exeter, UK, 2009. [Google Scholar]
- Jones, P.D.; Kilsby, C.G.; Harpham, C.; Glenis, V.; Burton, A. UK Climate Projections Science Report: Projections of Future Daily Climate for the UK from the Weather Generator; University of Newcastle: Newcastle, UK, 2009. [Google Scholar]
- Intergovernmental Panel on Climate Change. Climate change 2007: Synthesis report. An assessment of the intergovernmental panel on climate change. In Proceedings of the IPCC Plenary Conference XXVII, Valencia, Spain, 12–17 November 2007.
- Alexandratos, N.; Bruinsma, J. World Agriculture towards 2030/2050: The 2012 Revision; ESA Working Paper No. 12-03; Food and Agriculture Organization of the United Nations: Rome, Italy, 2012. [Google Scholar]
- Corfee-Morlot, J.; Höhne, N. Climate change: Long-term targets and short-term commitments. Glob. Environ. Chang. 2003, 13, 277–293. [Google Scholar] [CrossRef]
- Baruth, B.; Genovese, G.; Montanarella, L. New Soil Information for the MARS Crop Yield Forecasting System; European Commission Directorate General, Joint Research Centre: Ispra, Italy, 2006. [Google Scholar]
- Steduto, P.; Hsiao, T.C.; Raes, D.; Fereres, E. AquaCrop—The FAO crop model to simulate yield response to water: I. Concepts and underlying principles. Agron. J. 2009, 101, 426–437. [Google Scholar] [CrossRef]
- Geerts, S.; Raes, D.; Gracia, M.; Miranda, R.; Cusicanqui, J.A.; Taboada, C.; Mendoza, J.; Huanca, R.; Mamani, A.; Condori, O.; et al. Simulating yield response of Quinoa to water availability with AquaCrop. Agron. J. 2009, 101, 499–508. [Google Scholar] [CrossRef]
- Andarzian, B.; Bannayan, M.; Steduto, P.; Mazraeh, H.; Barati, M.E.; Barati, M.A.; Rahnama, A. Validation and testing of the AquaCrop model under full and deficit irrigated wheat production in Iran. Agric. Water Manag. 2011, 100, 1–8. [Google Scholar] [CrossRef]
- Mainuddin, M.; Kirby, M.; Hoanh, C.T. Adaptation to climate change for food security in the lower Mekong Basin. Food Secur. 2011, 3, 433–450. [Google Scholar] [CrossRef]
- Loague, K.; Green, R.E. Statistical and graphical methods for evaluating solute transport models: Overview and application. J. Contam. Hydrol. 1991, 7, 51–73. [Google Scholar] [CrossRef]
- Yao, F.M.; Qin, P.C.; Zhang, J.H.; Lin, E.; Boken, V. Uncertainties in assessing the effect of climate change on agriculture using model simulation and uncertainty processing methods. Chin. Sci. Bull. 2011, 56, 729–737. [Google Scholar] [CrossRef]
- Niu, X.; Easterling, W.; Hays, C.; Jacobs, A.; Mearns, L. Reliability and input data induced uncertainty of the EPIC model to estimate climate change impact on sorghum yields in the U.S. Great Plains. Agric. Ecosyst. Environ. 2009, 129, 268–276. [Google Scholar] [CrossRef]
- Biernath, C.; Gayler, S.; Bittner, S.; Klein, C.; Högy, P.; Fangmeier, A.; Priesack, E. Evaluating the ability of four crop models to predict different environmental impacts on spring wheat grown in open-top chambers. Eur. J. Agron. 2011, 35, 71–82. [Google Scholar] [CrossRef]
- Guereña, A.; Ruiz-Ramos, M.; Díaz-Ambrona, C.H.; Conde, J.R.; Mínguez, M.I. Assessment of climate change and agriculture in Spain using climate models. Agron. J. 2001, 93, 237–249. [Google Scholar] [CrossRef]
- Matthews, R.B.; Rivington, M.; Muhammed, S.; Newton, A.C.; Hallet, P.D. Adapting crops and cropping systems to future climates to ensure food security: The role of crop modelling. Glob. Food Secur. 2013, 2, 24–28. [Google Scholar] [CrossRef]
- Wilby, R.L.; Orr, H.; Watts, G.; Battarbee, R.W.; Berry, P.M.; Chadd, R.; Dugdale, S.J.; Dunbar, M.J.; Elliott, J.A.; Extence, C.; et al. Evidence needed to manage freshwater ecosystems in a changing climate: Turning adaptation principles into practice. Sci. Total Environ. 2010, 408, 4150–4164. [Google Scholar] [CrossRef] [PubMed]
- McKenzie, B.M.; Bengough, A.G.; Hallet, P.D.; Thomas, W.T.B.; Forster, B.; McNicol, J.W. Deep rooting and drought screening of cereal crops: A novel field-based method and its application. Field Crops Res. 2009, 112, 165–171. [Google Scholar] [CrossRef]
- Rivington, M. The UK Climate Projections as a Research Tool. Scottish Climate Change Impacts Partnership, A9 Workshop 3. Available online: http://www.adaptationscotland.org.uk/Upload/Documents/MLURI_webversion.pdf (accessed on 17 September 2013).
- Easterling, W.E.; Aggarwal, P.K.; Batima, P.; Brander, K.M.; Erda, L.; Howden, S.M.; Kirilenko, A.; Morton, J.; Soussana, J.-F.; Schmidhuber, J.; et al. Food, fibre and forest products. In Climate Change 2007: Impacts, Adaptation And Vulnerability; Parry, M.L., Canziani, O.F., Palutikof, J.P., van der Linden, P.J., Hanson, C.E., Eds.; Cambridge University Press: Cambridge, UK, 2007; pp. 273–313. [Google Scholar]


| Symbol | Parameter Description | Value |
|---|---|---|
| 1. Crop Phenology | ||
| 1.1. Development of green canopy cover (CC) | ||
| Tbase | Base temperature (°C) | 0 |
| Tupper | Upper temperature (°C) | 22 |
| Initial canopy cover (%) | 3.6 | |
| Time from sowing to emergence (GDD) | 135 | |
| Canopy growth coefficient (fraction per GDD) | 0.8 | |
| Maximum canopy cover (%) | 85 | |
| Time from sowing to flowering (GDD) | 950 | |
| Length of flowering stage (GDD) | 215 | |
| Time from sowing to start of senescence (GDD) | 1315 | |
| Canopy decline coefficient (fraction per GDD) | 0.06 | |
| Time from sowing to maturity (GDD) | 1675 | |
| 1.2. Development of root zone | ||
| Minimum effective rooting depth (m) | 0.30 | |
| Maximum effective rooting depth (m) | 0.70 | |
| Shape factor describing root zone expansion | 1.5 | |
| 2. Crop Transpiration | ||
| Crop coefficient at maximum CC | 1.15 | |
| Decline of crop coefficient (%·day−1) due to ageing | 0.15 | |
| Effect of canopy shelter on surface evaporation in late season stage (%) | 50 | |
| 3. Biomass production and yield formation | ||
| 3.1. Crop water productivity | ||
| WP* | Water productivity normalized for ETO and CO2 (g·m−2) | 15 |
| Water productivity normalized for ETO and CO2 during yield formation (as % WP* before yield formation) | 100 | |
| 3.2. Harvest index (HI) | ||
| Reference harvest index (HIo) | 0.49 | |
| Upper threshold for water stress during flowering on HI | 0.82 | |
| Possible increase (%) of HI due to water stress before flowering | 12 (strong) | |
| Coefficient describing positive effect of restricted vegetative growth during yield formation on HI | Moderate | |
| Coefficient describing negative effect of stomatal closure during yield formation on HI | Moderate | |
| Excess of potential fruits | Moderate | |
| Allowable maximum increase (%) of specified HI | 15 | |
| 4. Stresses | ||
| 4.1. Soil water stress | ||
| Pexp,lower | Lower threshold of water stress for triggering inhibited canopy expansion | 0.60 |
| Pexp,upper | Upper threshold for canopy expansion (canopy expansion seizes) | 0.27 |
| Shape factor for water stress coefficient for canopy expansion | 3.5 | |
| Psto | Upper threshold for stomata closure | 0.60 |
| Shape factor for water stress coefficient for stomatal control | 3.0 | |
| Psen | Upper threshold for early senescence due to water stress | 0.60 |
| Shape factor for water stress coefficient for canopy senescence | 3.5 | |
| Ppol | Upper threshold of soil water depletion for failure of pollination | 0.80 |
| Vol. % at anaerobiotic point (with reference to saturation) | 15 | |
| 4.2. Temperature stress | ||
| Minimum air temperature below which pollination starts to fail (cold stress, °C) | 5 | |
| Maximum air temperature above which pollination starts to fail (heat stress, °C) | 30 | |
| Minimum growing degrees required for full biomass production (°C-day) | 15 | |
| Statistic | Mean | Max. | 90th Perc. | Median | 10th Perc. | Min. | Std. Error | Std. Dev. | Skewness |
|---|---|---|---|---|---|---|---|---|---|
| EE | 4.34 | 5.69 | 5.14 | 4.20 | 3.68 | 3.45 | 0.11 | 0.60 | 0.54 |
| EM | 4.34 | 5.69 | 5.14 | 4.20 | 3.68 | 3.45 | 0.11 | 0.60 | 0.54 |
| NI | 3.66 | 4.80 | 4.53 | 3.51 | 3.20 | 2.91 | 0.09 | 0.51 | 0.75 |
| NEE | 4.04 | 5.39 | 4.84 | 3.90 | 3.38 | 3.15 | 0.11 | 0.60 | 0.54 |
| NES | 4.19 | 5.43 | 5.04 | 4.15 | 3.40 | 3.10 | 0.12 | 0.64 | 0.17 |
| NWE | 3.54 | 4.89 | 4.34 | 3.40 | 2.88 | 2.65 | 0.11 | 0.60 | 0.54 |
| NWS | 4.28 | 5.70 | 5.01 | 4.27 | 3.50 | 3.00 | 0.11 | 0.60 | 0.06 |
| SEE | 4.44 | 5.79 | 5.24 | 4.30 | 3.78 | 3.55 | 0.11 | 0.60 | 0.54 |
| SES | 4.57 | 5.72 | 5.24 | 4.62 | 4.00 | 3.60 | 0.10 | 0.56 | 0.18 |
| SWE | 3.94 | 5.29 | 4.74 | 3.80 | 3.28 | 3.05 | 0.11 | 0.60 | 0.54 |
| SWS | 4.03 | 4.99 | 4.86 | 4.14 | 3.22 | 2.70 | 0.11 | 0.62 | −0.35 |
| WAL | 4.00 | 5.20 | 4.90 | 3.95 | 3.40 | 3.10 | 0.10 | 0.58 | 0.51 |
| WM | 3.94 | 5.29 | 4.74 | 3.80 | 3.28 | 3.05 | 0.11 | 0.60 | 0.54 |
| YH | 4.34 | 5.69 | 5.14 | 4.20 | 3.68 | 3.45 | 0.11 | 0.60 | 0.54 |
| UK | 4.24 | 5.59 | 5.04 | 4.10 | 3.58 | 3.35 | 0.11 | 0.60 | 0.54 |
| Region | Sowing Date | Root Mean Square Error (RMSE) |
|---|---|---|
| EE | 13 February | 0.44 |
| EM | 27 February | 0.79 |
| NI | 8 March | 0.66 |
| NEE | 7 March | 0.68 |
| NES | 9 March | 0.74 |
| NWE | 19 February | 0.74 |
| NWS | 24 March | 0.81 |
| SEE | 24 February | 0.55 |
| SES | 9 March | 0.55 |
| SWE | 17 February | 0.65 |
| SWS | 13 March | 0.73 |
| WA | 19 February | 1.15 |
| WM | 27 February | 0.73 |
| YH | 27 February | 0.78 |
| UK | - | 0.35 |
| EE | EM | NEE | NES | NI | NWE | NWS | SEE | SES | SWE | SWS | WA | WM | YH | UK | |
|---|---|---|---|---|---|---|---|---|---|---|---|---|---|---|---|
| Statistic | LES | ||||||||||||||
| Mean | 5.92 | 5.87 | 6.01 | 6.04 | 6.12 | 6.03 | 6.13 | 6.11 | 6.00 | 6.20 | 6.05 | 6.11 | 6.01 | 5.99 | 6.04 |
| Std. Error | 0.04 | 0.04 | 0.06 | 0.06 | 0.06 | 0.06 | 0.06 | 0.05 | 0.07 | 0.04 | 0.07 | 0.04 | 0.04 | 0.05 | 0.05 |
| Std. Dev. | 0.21 | 0.23 | 0.31 | 0.33 | 0.32 | 0.32 | 0.32 | 0.25 | 0.36 | 0.23 | 0.37 | 0.24 | 0.23 | 0.26 | 0.27 |
| Median | 5.91 | 5.88 | 5.96 | 6.00 | 6.04 | 6.01 | 6.16 | 6.07 | 6.00 | 6.16 | 6.05 | 6.07 | 5.98 | 5.96 | 6.01 |
| 90th | 6.16 | 6.16 | 6.49 | 6.54 | 6.57 | 6.48 | 6.54 | 6.45 | 6.52 | 6.49 | 6.57 | 6.50 | 6.32 | 6.35 | 6.45 |
| 10th | 5.76 | 5.68 | 5.66 | 5.70 | 5.74 | 5.67 | 5.76 | 5.80 | 5.61 | 5.93 | 5.65 | 5.86 | 5.77 | 5.69 | 5.71 |
| Skewness | −0.83 | −1.15 | 0.09 | −0.03 | 0.26 | 0.31 | −0.12 | 0.23 | 0.06 | 0.23 | 0.12 | 0.51 | −0.03 | 0.19 | 0.22 |
| Min. | 5.25 | 5.08 | 5.44 | 5.37 | 5.60 | 5.58 | 5.43 | 5.74 | 5.30 | 5.80 | 5.41 | 5.68 | 5.49 | 5.50 | 5.60 |
| Max. | 6.32 | 6.23 | 6.57 | 6.62 | 6.73 | 6.67 | 6.75 | 6.61 | 6.65 | 6.71 | 6.71 | 6.65 | 6.44 | 6.51 | 6.56 |
| MES | |||||||||||||||
| Mean | 5.96 | 6.64 | 6.38 | 6.13 | 6.66 | 5.94 | 6.88 | 6.96 | 6.61 | 6.33 | 6.65 | 5.99 | 6.73 | 6.65 | 6.46 |
| Std. Error | 0.24 | 0.12 | 0.24 | 0.29 | 0.17 | 0.26 | 0.07 | 0.10 | 0.18 | 0.23 | 0.23 | 0.25 | 0.13 | 0.13 | 0.19 |
| Std. Dev. | 1.33 | 0.68 | 1.29 | 1.61 | 0.94 | 1.42 | 0.41 | 0.57 | 0.97 | 1.29 | 1.23 | 1.37 | 0.70 | 0.74 | 1.04 |
| Median | 6.34 | 6.75 | 6.74 | 6.75 | 6.90 | 6.55 | 6.88 | 6.96 | 6.88 | 6.76 | 6.92 | 6.50 | 6.81 | 6.64 | 6.74 |
| 90th | 7.21 | 7.33 | 7.44 | 7.48 | 7.49 | 7.15 | 7.36 | 7.59 | 7.45 | 7.35 | 7.54 | 7.28 | 7.42 | 7.40 | 7.39 |
| 10th | 4.30 | 5.88 | 4.73 | 3.01 | 5.37 | 4.01 | 6.40 | 6.40 | 4.89 | 4.79 | 6.32 | 4.02 | 5.97 | 5.98 | 5.15 |
| Skewness | −1.38 | −1.71 | −1.63 | −1.32 | −1.55 | −1.37 | −0.35 | −0.89 | −1.41 | −2.17 | −2.78 | −1.33 | −1.44 | −1.41 | −1.48 |
| Min | 1.93 | 4.16 | 2.66 | 2.58 | 3.79 | 1.86 | 5.90 | 5.46 | 4.33 | 1.54 | 2.29 | 2.05 | 4.39 | 4.24 | 3.37 |
| Max | 7.46 | 7.52 | 7.69 | 7.59 | 7.71 | 7.59 | 7.60 | 7.78 | 7.70 | 7.61 | 7.77 | 7.45 | 7.57 | 7.60 | 7.62 |
| HES | |||||||||||||||
| Mean | 6.17 | 6.76 | 6.50 | 6.45 | 6.72 | 6.09 | 6.97 | 7.10 | 6.68 | 6.49 | 6.66 | 5.36 | 6.79 | 6.75 | 6.53 |
| Std Error | 0.23 | 0.12 | 0.23 | 0.25 | 0.19 | 0.26 | 0.09 | 0.11 | 0.19 | 0.23 | 0.25 | 0.30 | 0.13 | 0.15 | 0.13 |
| Std. Dev. | 1.28 | 0.66 | 1.29 | 1.37 | 1.04 | 1.41 | 0.49 | 0.59 | 1.02 | 1.24 | 1.38 | 1.65 | 0.72 | 0.84 | 0.71 |
| Median | 6.50 | 6.78 | 6.70 | 6.74 | 6.89 | 6.59 | 6.98 | 6.99 | 6.82 | 6.79 | 6.91 | 5.94 | 6.84 | 6.75 | 6.58 |
| 90th Perc. | 7.35 | 7.48 | 7.62 | 7.72 | 7.74 | 7.49 | 7.56 | 7.83 | 7.70 | 7.64 | 7.72 | 6.90 | 7.63 | 7.68 | 7.41 |
| 10th | 4.36 | 6.06 | 4.93 | 3.78 | 5.22 | 4.29 | 6.40 | 6.61 | 5.03 | 5.14 | 6.14 | 2.81 | 6.08 | 5.89 | 5.79 |
| Skewness | −1.41 | −1.11 | −1.51 | −1.28 | −1.38 | −1.35 | 0.01 | −0.24 | −1.19 | −2.11 | −2.52 | −0.87 | −1.41 | −1.11 | −0.77 |
| Minimum | 2.19 | 4.56 | 2.72 | 3.44 | 3.66 | 2.00 | 6.08 | 5.80 | 4.25 | 1.84 | 1.93 | 1.55 | 4.28 | 4.15 | 4.55 |
| Maximum | 7.68 | 7.76 | 7.91 | 7.94 | 7.96 | 7.79 | 7.93 | 8.07 | 7.92 | 7.96 | 8.01 | 7.62 | 7.76 | 7.91 | 7.56 |
| EE | EM | NEE | NES | NI | NWE | NWS | SEE | SES | SWE | SWS | WA | WM | YH | UK | |
|---|---|---|---|---|---|---|---|---|---|---|---|---|---|---|---|
| Statistic | LES | ||||||||||||||
| Mean | 6.12 | 6.08 | 6.21 | 6.24 | 6.32 | 6.24 | 6.35 | 6.35 | 6.19 | 6.41 | 6.21 | 6.31 | 6.20 | 6.19 | 6.24 |
| Std. Error | 0.04 | 0.04 | 0.06 | 0.06 | 0.06 | 0.05 | 0.06 | 0.04 | 0.07 | 0.04 | 0.06 | 0.04 | 0.04 | 0.04 | 0.04 |
| St. Dev. | 0.20 | 0.21 | 0.31 | 0.31 | 0.31 | 0.29 | 0.31 | 0.21 | 0.36 | 0.21 | 0.35 | 0.22 | 0.19 | 0.25 | 0.25 |
| Median | 6.11 | 6.08 | 6.21 | 6.23 | 6.30 | 6.23 | 6.34 | 6.33 | 6.13 | 6.38 | 6.19 | 6.28 | 6.23 | 6.18 | 6.21 |
| 90th | 6.35 | 6.28 | 6.66 | 6.70 | 6.74 | 6.61 | 6.74 | 6.60 | 6.70 | 6.65 | 6.70 | 6.60 | 6.44 | 6.51 | 6.58 |
| 10th | 5.91 | 5.89 | 5.84 | 5.86 | 5.94 | 5.87 | 5.97 | 6.09 | 5.77 | 6.17 | 5.80 | 6.08 | 5.96 | 5.88 | 5.92 |
| Skewness | −1.12 | −1.25 | 0.09 | −0.09 | 0.18 | 0.17 | −0.17 | 0.10 | 0.04 | 0.17 | 0.16 | 0.02 | −0.31 | 0.03 | 0.13 |
| Minimum | 5.45 | 5.34 | 5.67 | 5.64 | 5.83 | 5.83 | 5.69 | 5.97 | 5.54 | 6.04 | 5.64 | 5.82 | 5.73 | 5.74 | 5.83 |
| Maximum | 6.43 | 6.45 | 6.75 | 6.78 | 6.87 | 6.76 | 6.91 | 6.74 | 6.80 | 6.84 | 6.82 | 6.72 | 6.52 | 6.64 | 6.69 |
| MES | |||||||||||||||
| Mean | 6.49 | 7.10 | 6.72 | 6.45 | 7.07 | 6.44 | 7.21 | 6.24 | 6.90 | 6.65 | 6.95 | 5.38 | 7.19 | 7.05 | 6.70 |
| SE | 0.23 | 0.09 | 0.23 | 0.29 | 0.15 | 0.25 | 0.07 | 0.25 | 0.19 | 0.25 | 0.24 | 0.32 | 0.09 | 0.12 | 0.20 |
| SD | 1.25 | 0.47 | 1.24 | 1.60 | 0.81 | 1.36 | 0.38 | 1.38 | 1.03 | 1.38 | 1.30 | 1.73 | 0.48 | 0.65 | 1.08 |
| Median | 6.89 | 7.13 | 7.12 | 7.09 | 7.24 | 7.08 | 7.24 | 6.76 | 7.23 | 7.15 | 7.22 | 5.69 | 7.17 | 7.09 | 7.01 |
| 90th | 7.55 | 7.69 | 7.80 | 7.68 | 7.79 | 7.53 | 7.75 | 7.64 | 7.76 | 7.65 | 7.88 | 7.18 | 7.73 | 7.81 | 7.67 |
| 10th | 4.93 | 6.48 | 5.34 | 3.46 | 6.02 | 4.23 | 6.72 | 4.07 | 5.07 | 5.09 | 6.59 | 2.90 | 6.65 | 6.02 | 5.25 |
| Skewness | −1.73 | −0.48 | −1.62 | −1.31 | −1.46 | −1.66 | −0.19 | −0.91 | −1.34 | −2.22 | −2.72 | −0.86 | −0.72 | −0.75 | −1.28 |
| Min | 2.12 | 5.90 | 3.14 | 2.95 | 4.52 | 2.24 | 6.48 | 2.76 | 4.57 | 1.47 | 2.42 | 1.49 | 5.92 | 5.45 | 3.67 |
| Max | 7.82 | 7.86 | 7.97 | 7.90 | 8.02 | 7.76 | 7.82 | 8.02 | 8.00 | 7.97 | 8.03 | 7.77 | 7.85 | 7.93 | 7.91 |
| HES | |||||||||||||||
| Mean | 6.94 | 7.49 | 7.07 | 7.09 | 7.42 | 6.64 | 7.45 | 7.59 | 7.33 | 7.12 | 7.19 | 5.89 | 7.33 | 7.34 | 7.14 |
| Standard Error | 0.23 | 0.09 | 0.24 | 0.24 | 0.17 | 0.25 | 0.09 | 0.11 | 0.15 | 0.21 | 0.24 | 0.30 | 0.11 | 0.12 | 0.12 |
| Std. Dev. | 1.24 | 0.50 | 1.32 | 1.33 | 0.91 | 1.36 | 0.51 | 0.62 | 0.80 | 1.14 | 1.30 | 1.64 | 0.60 | 0.68 | 0.64 |
| Median | 7.25 | 7.57 | 7.35 | 7.45 | 7.54 | 7.06 | 7.48 | 7.44 | 7.31 | 7.37 | 7.36 | 6.47 | 7.21 | 7.29 | 7.13 |
| 90th | 7.99 | 8.10 | 8.17 | 8.23 | 8.25 | 7.88 | 8.11 | 8.34 | 8.20 | 8.02 | 8.26 | 7.45 | 8.09 | 8.18 | 7.88 |
| 10th | 5.39 | 6.89 | 5.70 | 4.56 | 6.25 | 4.50 | 6.81 | 7.09 | 6.43 | 5.76 | 6.65 | 3.48 | 6.74 | 6.49 | 6.44 |
| Skewness | −1.88 | −0.44 | −1.54 | −1.25 | −1.31 | −1.53 | −0.04 | −0.32 | −0.86 | −2.13 | −2.46 | −1.03 | −0.18 | −0.21 | −0.70 |
| Minimum | 2.41 | 6.25 | 3.31 | 4.23 | 4.68 | 2.37 | 6.59 | 6.13 | 5.43 | 2.80 | 2.66 | 1.94 | 5.83 | 5.95 | 5.30 |
| Maximum | 8.30 | 8.29 | 8.43 | 8.44 | 8.47 | 8.12 | 8.32 | 8.58 | 8.44 | 8.51 | 8.53 | 8.16 | 8.22 | 8.37 | 8.11 |
| EE | EM | NEE | NES | NI | NWE | NWS | SEE | SES | SWE | SWS | WA | WM | YH | UK | |
|---|---|---|---|---|---|---|---|---|---|---|---|---|---|---|---|
| LES | |||||||||||||||
| Mean | 6.03 | 6.59 | 6.29 | 6.23 | 6.59 | 6.42 | 6.57 | 6.63 | 6.48 | 6.60 | 6.56 | 6.08 | 6.52 | 6.55 | 6.44 |
| Std. Error | 0.18 | 0.04 | 0.13 | 0.12 | 0.06 | 0.05 | 0.04 | 0.04 | 0.06 | 0.04 | 0.04 | 0.11 | 0.06 | 0.04 | 0.05 |
| Std. Dev. | 0.97 | 0.21 | 0.69 | 0.67 | 0.31 | 0.30 | 0.20 | 0.20 | 0.34 | 0.22 | 0.22 | 0.60 | 0.32 | 0.22 | 0.26 |
| Median | 6.34 | 6.58 | 6.50 | 6.44 | 6.66 | 6.43 | 6.59 | 6.64 | 6.54 | 6.59 | 6.58 | 6.24 | 6.57 | 6.55 | 6.46 |
| 90th | 6.62 | 6.81 | 6.71 | 6.62 | 6.81 | 6.77 | 6.80 | 6.86 | 6.76 | 6.86 | 6.82 | 6.73 | 6.82 | 6.82 | 6.75 |
| 10th | 4.47 | 6.44 | 6.08 | 5.96 | 6.38 | 6.21 | 6.30 | 6.40 | 6.16 | 6.43 | 6.27 | 5.38 | 6.10 | 6.31 | 6.10 |
| Skewness | −2.13 | −1.43 | −3.75 | −2.95 | −3.31 | −1.51 | −0.38 | −1.14 | −2.55 | −1.43 | −0.54 | −0.94 | −2.17 | −1.35 | −0.77 |
| Minimum | 2.84 | 5.89 | 3.12 | 3.61 | 5.21 | 5.37 | 6.07 | 5.99 | 5.11 | 5.88 | 6.03 | 4.57 | 5.28 | 5.79 | 5.81 |
| Maximum | 6.82 | 6.86 | 6.80 | 6.76 | 6.90 | 6.82 | 6.89 | 6.89 | 6.84 | 6.88 | 6.90 | 6.78 | 6.86 | 6.85 | 6.82 |
| MES | |||||||||||||||
| Mean | 6.95 | 7.36 | 7.23 | 6.97 | 7.47 | 6.98 | 7.49 | 7.70 | 7.34 | 7.27 | 7.32 | 6.44 | 7.44 | 7.45 | 7.24 |
| Std. Error | 0.21 | 0.09 | 0.19 | 0.26 | 0.13 | 0.23 | 0.08 | 0.08 | 0.15 | 0.21 | 0.22 | 0.28 | 0.11 | 0.10 | 0.17 |
| Std. Dev. | 1.15 | 0.50 | 1.02 | 1.41 | 0.72 | 1.24 | 0.41 | 0.44 | 0.83 | 1.14 | 1.18 | 1.51 | 0.60 | 0.57 | 0.91 |
| Median | 7.19 | 7.45 | 7.50 | 7.51 | 7.64 | 7.45 | 7.50 | 7.71 | 7.59 | 7.59 | 7.60 | 7.11 | 7.52 | 7.52 | 7.49 |
| 90th | 7.80 | 7.92 | 8.00 | 8.07 | 8.12 | 8.01 | 7.97 | 8.19 | 8.10 | 8.08 | 8.13 | 7.68 | 8.03 | 8.00 | 8.01 |
| 10th | 5.61 | 6.92 | 6.26 | 4.05 | 6.68 | 5.69 | 6.98 | 7.28 | 6.12 | 5.93 | 7.08 | 4.30 | 6.93 | 6.95 | 6.20 |
| Skewness | −2.27 | −1.98 | −2.09 | −1.48 | −1.90 | −1.99 | −0.88 | −0.82 | −1.50 | −2.76 | −2.98 | −1.33 | −1.98 | −1.73 | −1.83 |
| Minimum | 2.57 | 5.40 | 3.87 | 3.85 | 4.98 | 2.66 | 6.22 | 6.50 | 5.23 | 2.57 | 2.94 | 2.15 | 5.15 | 5.42 | 4.25 |
| Maximum | 8.11 | 8.11 | 8.20 | 8.19 | 8.25 | 8.20 | 8.12 | 8.32 | 8.26 | 8.32 | 8.22 | 8.04 | 8.11 | 8.11 | 8.18 |
| HES | |||||||||||||||
| Mean | 7.49 | 7.85 | 7.72 | 7.67 | 7.89 | 7.50 | 7.93 | 8.18 | 7.89 | 7.85 | 7.72 | 7.19 | 7.96 | 7.91 | 7.77 |
| Std. Error | 0.20 | 0.08 | 0.17 | 0.17 | 0.13 | 0.22 | 0.06 | 0.07 | 0.12 | 0.17 | 0.22 | 0.24 | 0.09 | 0.10 | 0.09 |
| Std. Dev. | 1.11 | 0.43 | 0.94 | 0.95 | 0.74 | 1.19 | 0.33 | 0.39 | 0.63 | 0.92 | 1.20 | 1.31 | 0.47 | 0.53 | 0.49 |
| Median | 7.79 | 7.92 | 7.99 | 7.96 | 8.07 | 7.93 | 7.94 | 8.19 | 8.04 | 8.11 | 7.99 | 7.75 | 8.01 | 8.00 | 7.87 |
| 90th | 8.25 | 8.35 | 8.41 | 8.49 | 8.53 | 8.38 | 8.37 | 8.60 | 8.49 | 8.51 | 8.57 | 8.24 | 8.38 | 8.44 | 8.27 |
| 10th | 6.38 | 7.40 | 7.02 | 6.03 | 7.01 | 6.50 | 7.44 | 7.84 | 7.06 | 7.09 | 7.42 | 5.55 | 7.52 | 7.48 | 7.33 |
| Skewness | −2.60 | −1.61 | −2.42 | −1.51 | −2.00 | −2.47 | −0.38 | −1.22 | −1.34 | −3.06 | −2.91 | −1.69 | −2.15 | −1.96 | −1.53 |
| Minimum | 3.02 | 6.30 | 4.43 | 5.33 | 5.24 | 2.92 | 7.26 | 6.95 | 6.16 | 3.88 | 3.32 | 3.08 | 6.10 | 5.93 | 6.09 |
| Maximum | 8.53 | 8.50 | 8.54 | 8.62 | 8.68 | 8.59 | 8.43 | 8.73 | 8.67 | 8.71 | 8.70 | 8.48 | 8.51 | 8.47 | 8.37 |
© 2016 by the authors; licensee MDPI, Basel, Switzerland. This article is an open access article distributed under the terms and conditions of the Creative Commons Attribution (CC-BY) license (http://creativecommons.org/licenses/by/4.0/).
Share and Cite
Yawson, D.O.; Ball, T.; Adu, M.O.; Mohan, S.; Mulholland, B.J.; White, P.J. Simulated Regional Yields of Spring Barley in the United Kingdom under Projected Climate Change. Climate 2016, 4, 54. https://doi.org/10.3390/cli4040054
Yawson DO, Ball T, Adu MO, Mohan S, Mulholland BJ, White PJ. Simulated Regional Yields of Spring Barley in the United Kingdom under Projected Climate Change. Climate. 2016; 4(4):54. https://doi.org/10.3390/cli4040054
Chicago/Turabian StyleYawson, David O., Tom Ball, Michael O. Adu, Sushil Mohan, Barry J. Mulholland, and Philip J. White. 2016. "Simulated Regional Yields of Spring Barley in the United Kingdom under Projected Climate Change" Climate 4, no. 4: 54. https://doi.org/10.3390/cli4040054