Article

Diurnal and Seasonal Variation of Surface Urban Cool and Heat Islands in the Semi-Arid City of Erbil, Iraq

1
Department of Geography, Centre for Landscape and Climate Research, University of Leicester, University Road, Leicester LE1 7RH, UK
2
Department of Geography, Soran University, Kawa Street, Soran, Erbil 44008, Iraq
3
National Centre for Earth Observation, University of Leicester, University Road, Leicester LE1 7RH, UK
*
Author to whom correspondence should be addressed.
Climate 2016, 4(3), 42; https://doi.org/10.3390/cli4030042
Submission received: 15 July 2016 / Revised: 12 August 2016 / Accepted: 26 August 2016 / Published: 1 September 2016

Abstract

:
The influence of land surface temperature (LST) makes the near-surface layer of the troposphere a key driver of urban climate. This paper assesses the temporal formation of the daytime Surface Urban Cool Island (SUCI) and night-time Surface Urban Heat Island (SUHI) effect in Erbil, Iraq, situated in a semi-arid climate region. LST retrievals from the Moderate Resolution Imaging Spectroradiometer (MODIS) Aqua and Terra and MODIS Normalized Difference Vegetation Index (NDVI) from January 2003 to December 2014 are analysed. The relationships of LST with NDVI and the Normalized Multi-band Drought Index (NMDI) are investigated in order to assess the influence of vegetation and moisture on the observed patterns of LST and the SUCI/SUHI. The results indicate that during the daytime, in summer, autumn and winter, densely built-up areas had lower LST acting as a SUCI compared to the non-urbanised area around the city. In contrast, at night-time, Erbil experienced higher LST and demonstrated a significant SUHI effect. The relationship between LST and NDVI is affected by seasonality and is strongly inverted during spring (r2 = 0.73; p < 0.01). Contrary to previous studies of semi-arid cities, a SUCI was detected, not only in the morning, but also during the afternoon.

1. Introduction

Since land surface temperature moderates the lowest layer of the atmosphere, it plays an important role in the evolution of the urban climate. The comfort and health of urban residents is affected by surface temperature, which can influence internal building temperatures and energy exchange processes [1]. The variation between the characteristics of surface cover in urban and rural areas, in terms of three-dimensional geometry of the built environment, heat absorption, construction materials, surface albedo and vegetation abundance cause different air and surface temperatures in a city relative to the surrounding less urbanised area.
The term “Surface Urban Cool Island” (SUCI) is defined as an urban area where lower surface temperatures are prevailing compared to the non-urbanised dry surroundings and is commonly found in arid and semi-arid regions [2,3]. In contrast, the Urban Heat Island (UHI) effect refers to areas of higher air and surface temperatures experienced in a city compared to the rural surroundings [4,5,6]. Satellite sensors can be used to investigate the surface temperature of cities and study the growth of SUHIs and their spatial variation [7]. Rao [8] used satellite data of ITOS-1 to study the SUHI of the mid-Atlantic coast of the USA. Matson et al. [9] measured the UHI of the Midwestern and North-western United States during night-time with NOAA5 satellite data. Since then, different platforms such as ground based sensors, satellite and aircraft sensors have been employed for LST and SUHIs observations (Table 1).
Only few studies on the SUCI and SUHI effect have been published for arid and semi-arid climate regions. Notable exceptions include research in Phoenix and Tucson in the United States by Hsu [10]; Brazel and Balling [11]; Tarleton and Katz [12]; Stabler et al. [13]; Golden et al. [14]; Georgescu et al. [15], Kuwait City by Nasrallah et al. [16] and Al Ahsa oasis by Al-Ali [17].
Lazzarini et al. [18] studied the daytime UHI and LST variation in Abu Dhabi using MODIS LST. Their results indicate the existence of a daytime SUCI, in contrast to the common nocturnal SUHI. The higher soil moisture within the urban area in an arid environment compared to the dry, bare surroundings has an effect on the thermal environment as a result of evaporation from the soil which reduces LST via latent heat flux cooling. Frey et al. [19] established the presence of a SUCI in Dubai compared with the surrounding desert. Both residential districts and industrial areas within arid environments recorded lower temperatures than sand.
Rasul et al. [20] used Landsat 8 for studying the spatial variation of daytime SUCI during the dry season in Erbil. The results show that densely built-up areas have lower LST acting as cool islands compared to the non-urbanized area around the city (Table 1). They examined the relationship of LST with wetness, brightness, bareness, built-up and vegetation index maps. The study showed that during the dry season in some cities, such as Erbil, the surface wetness is the main determinant of the SUCI effect, and not vegetation cover. The current research extends these earlier findings to examine seasonal and diurnal patterns of LST and the SUCI/SUHI effects in Erbil.
Temperature affects vegetation productivity, which has an optimum temperature beyond which it declines due to stomatal closure. Vegetation also influences ambient air temperature via evapotranspiration and latent heat flux processes. Consequently, there is a correlation between vegetation and temperature. In UHI studies, the correlation between NDVI and LST has been applied widely [5,21,22,23] but they stated the different result. Liang and Shi [24] and Bajaj et al. [25] confirmed the existence of a strong linear inverse relationship. In contrast, there was no such relationship in Shanghai, China [26]. This disparity may relate to seasonal changes. Yuan and Bauer [27] found that the relationship between LST and NDVI varied between seasons. Wang and Qu [28] proposed NMDI for estimate both soil and vegetation moisture from remote sensing data. As the soil and vegetation water sensitive band, it uses the difference between two liquid water absorption channels (1640 nm and 2130 nm).
Clinton and Gong [29] used MODIS at 1 km spatial resolution with high temporal resolution to investigate surface urban heat islands and/or urban heat sinks of cities on a global scale. The results confirmed that development, land cover, and size of city have the greatest effect on thermal difference. Conversely, factors such as the population and structure of the city have a limited effect. In addition, LULC change and urban expansion in a maritime climatic region leads to increased temperature and UHI intensity, while in dry areas an urban oasis effect can exist [30]. The nature and determinants of the Urban Cool Island effect require greater understanding [31]. A more rigorous quantification and understanding of the SUCI/SUHI in semi-arid climates is necessary.
The objective of this paper is to quantify the temporal formation of the SUCI/SUHI in the study area, as a case study of a city with semi-arid climate, to establish the patterns and assess the influence of vegetation and soil moisture on the temporal variation of LST and SUCI/SUHI. The novel contributions of this paper to the knowledge about the urban thermal environment are:
  • the determination of the seasonal and diurnal variation of the patterns of LST and SUCI/SUHI in a city with semi-arid climate;
  • the quantitative analysis of relationships between LST and NDVI and how they change between seasons

2. Materials and Methods
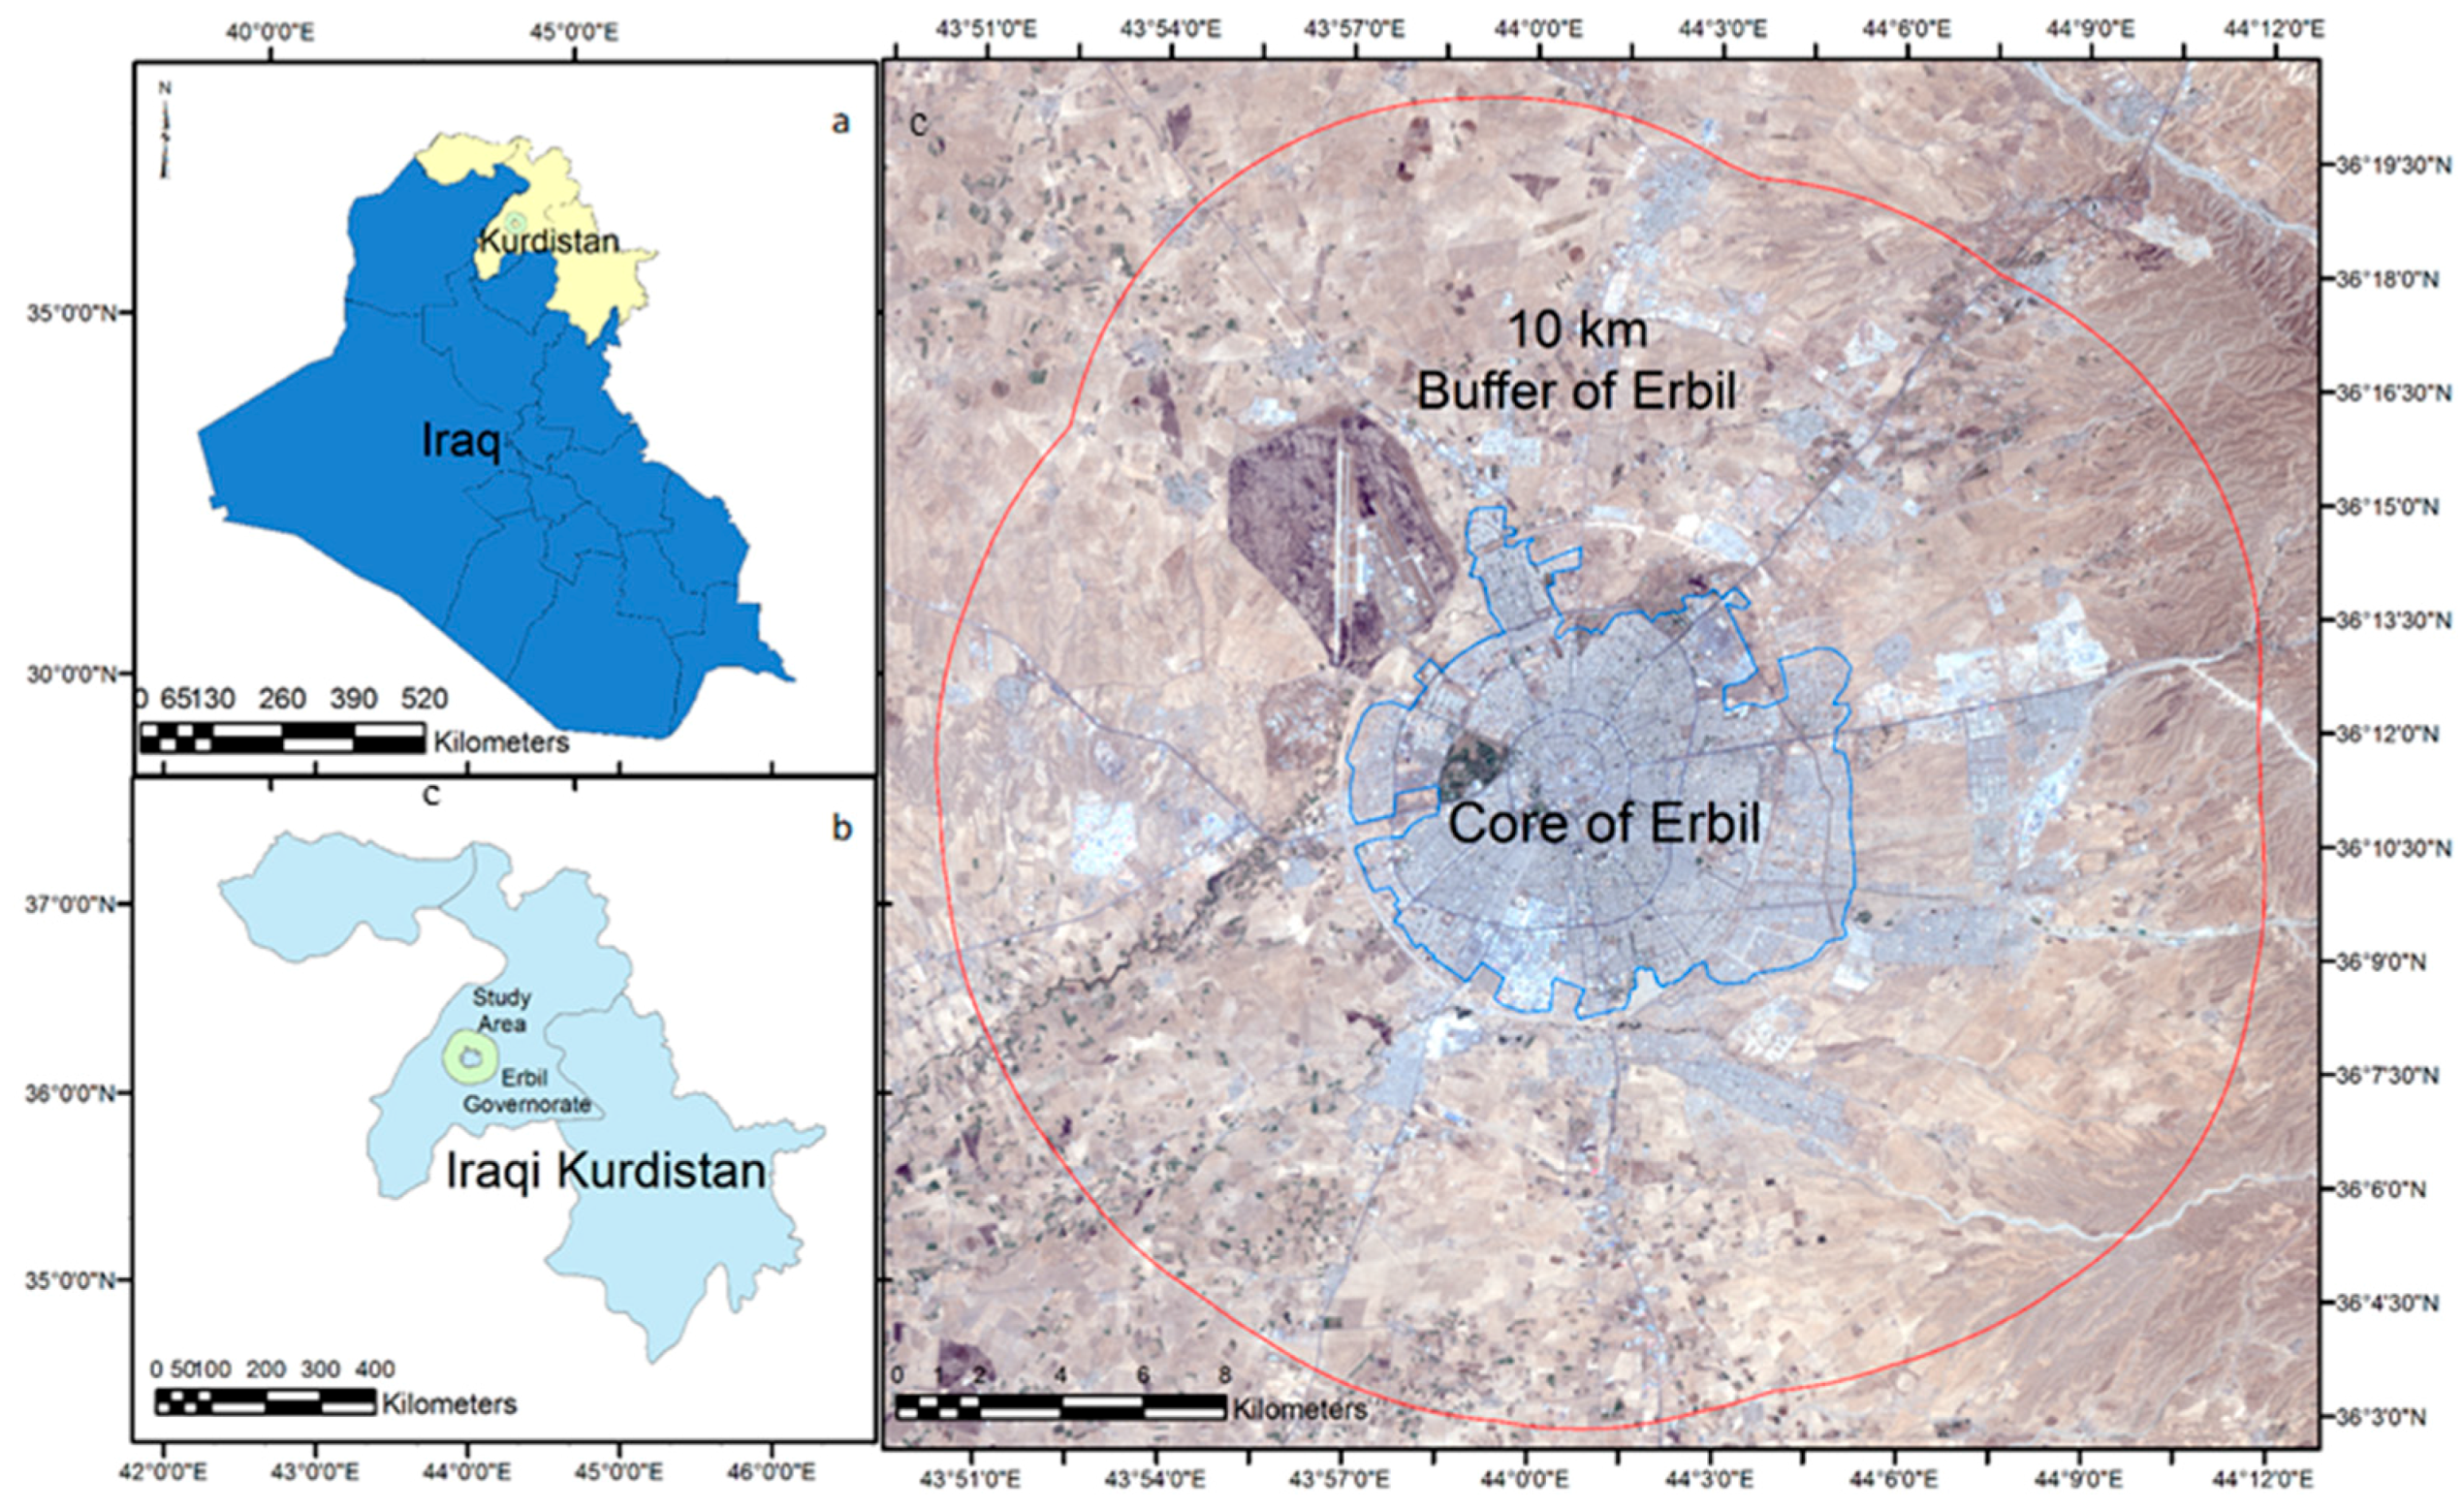
2.1. Study Area

Erbil is the capital of the Kurdistan Region and the main city in the north of Iraq. The city is situated 412 m above mean sea level [44] between 43°57’E to 44°03’E and 36°08’N to 36°14’N (Figure 1). Over the past two decades the infrastructure and population of the city have experienced extensive growth. In 2015, the population of the Erbil Governorate was estimated to be 1,530,722 inhabitants [45]. Over the past 2 decades the annual growth rate of the population in Erbil is 2.9% [46].
The study area has a semi-arid continental climate and is classified as subtropical semi-arid (BSh) in the Koppen climate classification. It has a rainy and cool winter whilst the summer is dry and hot. The average annual precipitation is 380.26 ± 108.88 mm and the majority of it falls from December to March whilst the summer months are dry. The annual air temperature is 21.85 °C and July and August are the hottest months of the year; air temperature during these months can reach 49 °C [47].
Within the urban area, residential land use is the most dominant land use type comprising buildings made of concrete blocks. In the rural area, winter grain cultivation such as wheat and barley is most common and in general, agriculture in the study area is rain-fed rather than irrigated.
The citadel of Erbil is at the heart of the city and is the centre around which the surrounding urban pattern has grown in concentric rings [48]. In the second half of the twentieth century, the third and fourth stages of the city expansion occurred. These newly developed areas are shaped in circular patterns around the city centre [49]. Since 2003, the city changed rapidly and experienced abundant new architectural structures and large housing projects. As an example of the rapid growth, the number of quarters in Erbil reached 82 in 2012 while it was only eight in the 1950s. More tall buildings and small houses characterise this latest stage of city expansion.
The elevation of the city ranges from 319 m in the southwest to 878 m in the northeast of the study area. The mean elevation of the study area is 454 m. A general slope is present from south to northeast. Erbil is built-up on the Erbil Plain and has dark brown soils. Having good structure, large depth and rich in organic materials makes it one of the most fertile soils. The average soil depth of Erbil Plain is 140 cm. Soil texture in Erbil Governorate contains sand, loamy silt, loamy clay and silty clay [50].

2.2. Data

In this study, MODIS data from NASA’s Terra and Aqua satellites are used. The resolution of LST data from MODIS is 1 km. Because it has four overpasses per day, it is better suited for investigating the diurnal variation of LST and the UHI effect than higher resolution sensors such as Landsat 8. Using MODIS Aqua (MYD11A2) and MODIS Terra (MOD11A2), an 8-day composite for a 12-year period was selected, from January 2003 to December 2014. Several categories of MODIS products from years 2003 to 2014 are used: The 8-day LST composite (MOD11A2 and MYD11A2), and 16-day NDVI composite (MOD13Q1) (Table 2).

2.2.1. Land Surface Temperature

LST is the radiative temperature of the land surface [51]. It is influenced by albedo, vegetation cover and soil moisture [52]. The “surface” can include snow and ice, bare soil, grass, or the roofs of buildings [53]. Near-surface air temperature “is a measurement of the average kinetic energy of the air near the surface of the Earth” [54]. Usually LST is measured by remote sensing whereas air temperature is measured 1–2 m above the ground. Near-surface air temperature is a consequence of complex effects of the turbulent heat transports produced by nearby heated surfaces [55].
An 8-day composite product with quality assessment (QA) information from Terra (MOD11A2) and Aqua (MYD11A2) was used. These products were derived from the split-window method [56]. Only LST images, of which 80% or higher pixels passed quality filter are used and lower-accuracy images are excluded. Pixels with zero values that represent NA values are ignored in the statistical analysis. Terra passes over the study area at approximately 11:00 and 22:00 local time, while Aqua images are taken around 02:00 and 13:00 local time.

2.2.2. NDVI

MOD13Q1 is a product from MODIS Terra, which contains a 16-day composite NDVI with 250 m spatial resolution and QA information. A total of 274 MOD13Q1 collection of 5 images from January 2003 to December 2014 were obtained.

2.3. Methodology

2.3.1 Processing Data

MODIS products were downloaded from daac.ornl.gov using the WGS 84 ellipsoid model in UTM projection (zone 38N); associated with QA data for each image. The value of each pixel was multiplied by the scale factors for kLST = 0.02 and kNDVI = 0.0001. All spatial data were stacked and cropped to the study area. Statistics for subsets of the study area, stratified by the city and surrounding area were extracted and the images categorized into different seasons and fill gaps by the linear interpolation method.

2.3.2. LST

For determining the seasonal variation, the images are categorised into four seasons based on astronomical seasons of Erbil. Winter was defined between 22 December and 20 March, spring from 21 March to 20 June, summer from 21 June to 22 September and autumn from 23 September to 21 December. Average LST and standard deviation were calculated for twelve years for urban and the rural areas. The significance of the regression model was tested with Welsh’s t-test.

2.3.3. NDVI

Due to the amount of vegetation varying according to the season and the amount of precipitation, the relationship between LST and NDVI depends on the season. The NDVI data for 12 years is divided into four seasons. Then NDVI and LST data are displayed as scatterplots and linear regression are used to quantify this relationship.

2.3.4. Soil Moisture

Soil moisture is one of the main drivers of LST especially in dry climates. NMDI uses multi near infrared and short wave infrared channels to estimate both soil and vegetation moisture. To calculate NMDI, Equation (1) was employed [28]:
N M D I = b a n d   2 ( b a n d   6 b a n d   7 ) b a n d   2 + ( b a n d   6 b a n d   7 )  
Yao et al.’s [57] algorithm to estimate Soil Moisture Constraint (fsm) from land surface temperature of MODIS satellite data was applied:
f s m = ( 1 D T ) D T / D T m a x
where DT is the diurnal temperature range (LSTday–LSTnight or Tmax–Tmin), DTmax is the maximum diurnal temperature (constant: 60 °C), fsm is scaled between zero and one.

2.2.5. Identification of the Surface UCI and UHI Intensity

There are different methods of measuring UHII. Here, a 10-km buffer zone surrounding the city of Erbil is selected as a “rural” (non-urban) reference area. The city limit used to define urban areas and the shapefile of the city was created in ArcGIS based on high-resolution satellite imagery. The city boundary delimits predominantly urban areas, which contain some pixels of other LULC classes while the buffer principally represents rural areas (92%), which contain only a small number (1.3%) of urban pixels. The intensity of SUCI and SUHI is calculated using Equation (3) [58].
Δ L S T = L S T u L S T r
where SUHI = Surface Urban Heat Island; SUCI = Surface Urban Cool Island; L S T u = mean LST of urban area; L S T r = mean LST of rural buffer area. A positive value represents a SUHI situation, while a negative result represents SUCI.

2.2.6. Variation between Urban and Rural Areas

The means and standard deviations of LST, NDVI and NMDI were calculated for both the city and rural areas. The percentage of low quality LST images was low at night (Terra 2.5% and Aqua 2.4%) while it was higher for daytime data (Terra 12% and Aqua 20%).

2.2.7. Relationship of LST with NDVI, fsm and NMDI

The relationships between LST and the various influencing factors are presented as scatterplots. In addition, assuming linear relationships, linear regression is used. The significance of the regression model was tested using the Welch method.

3. Results

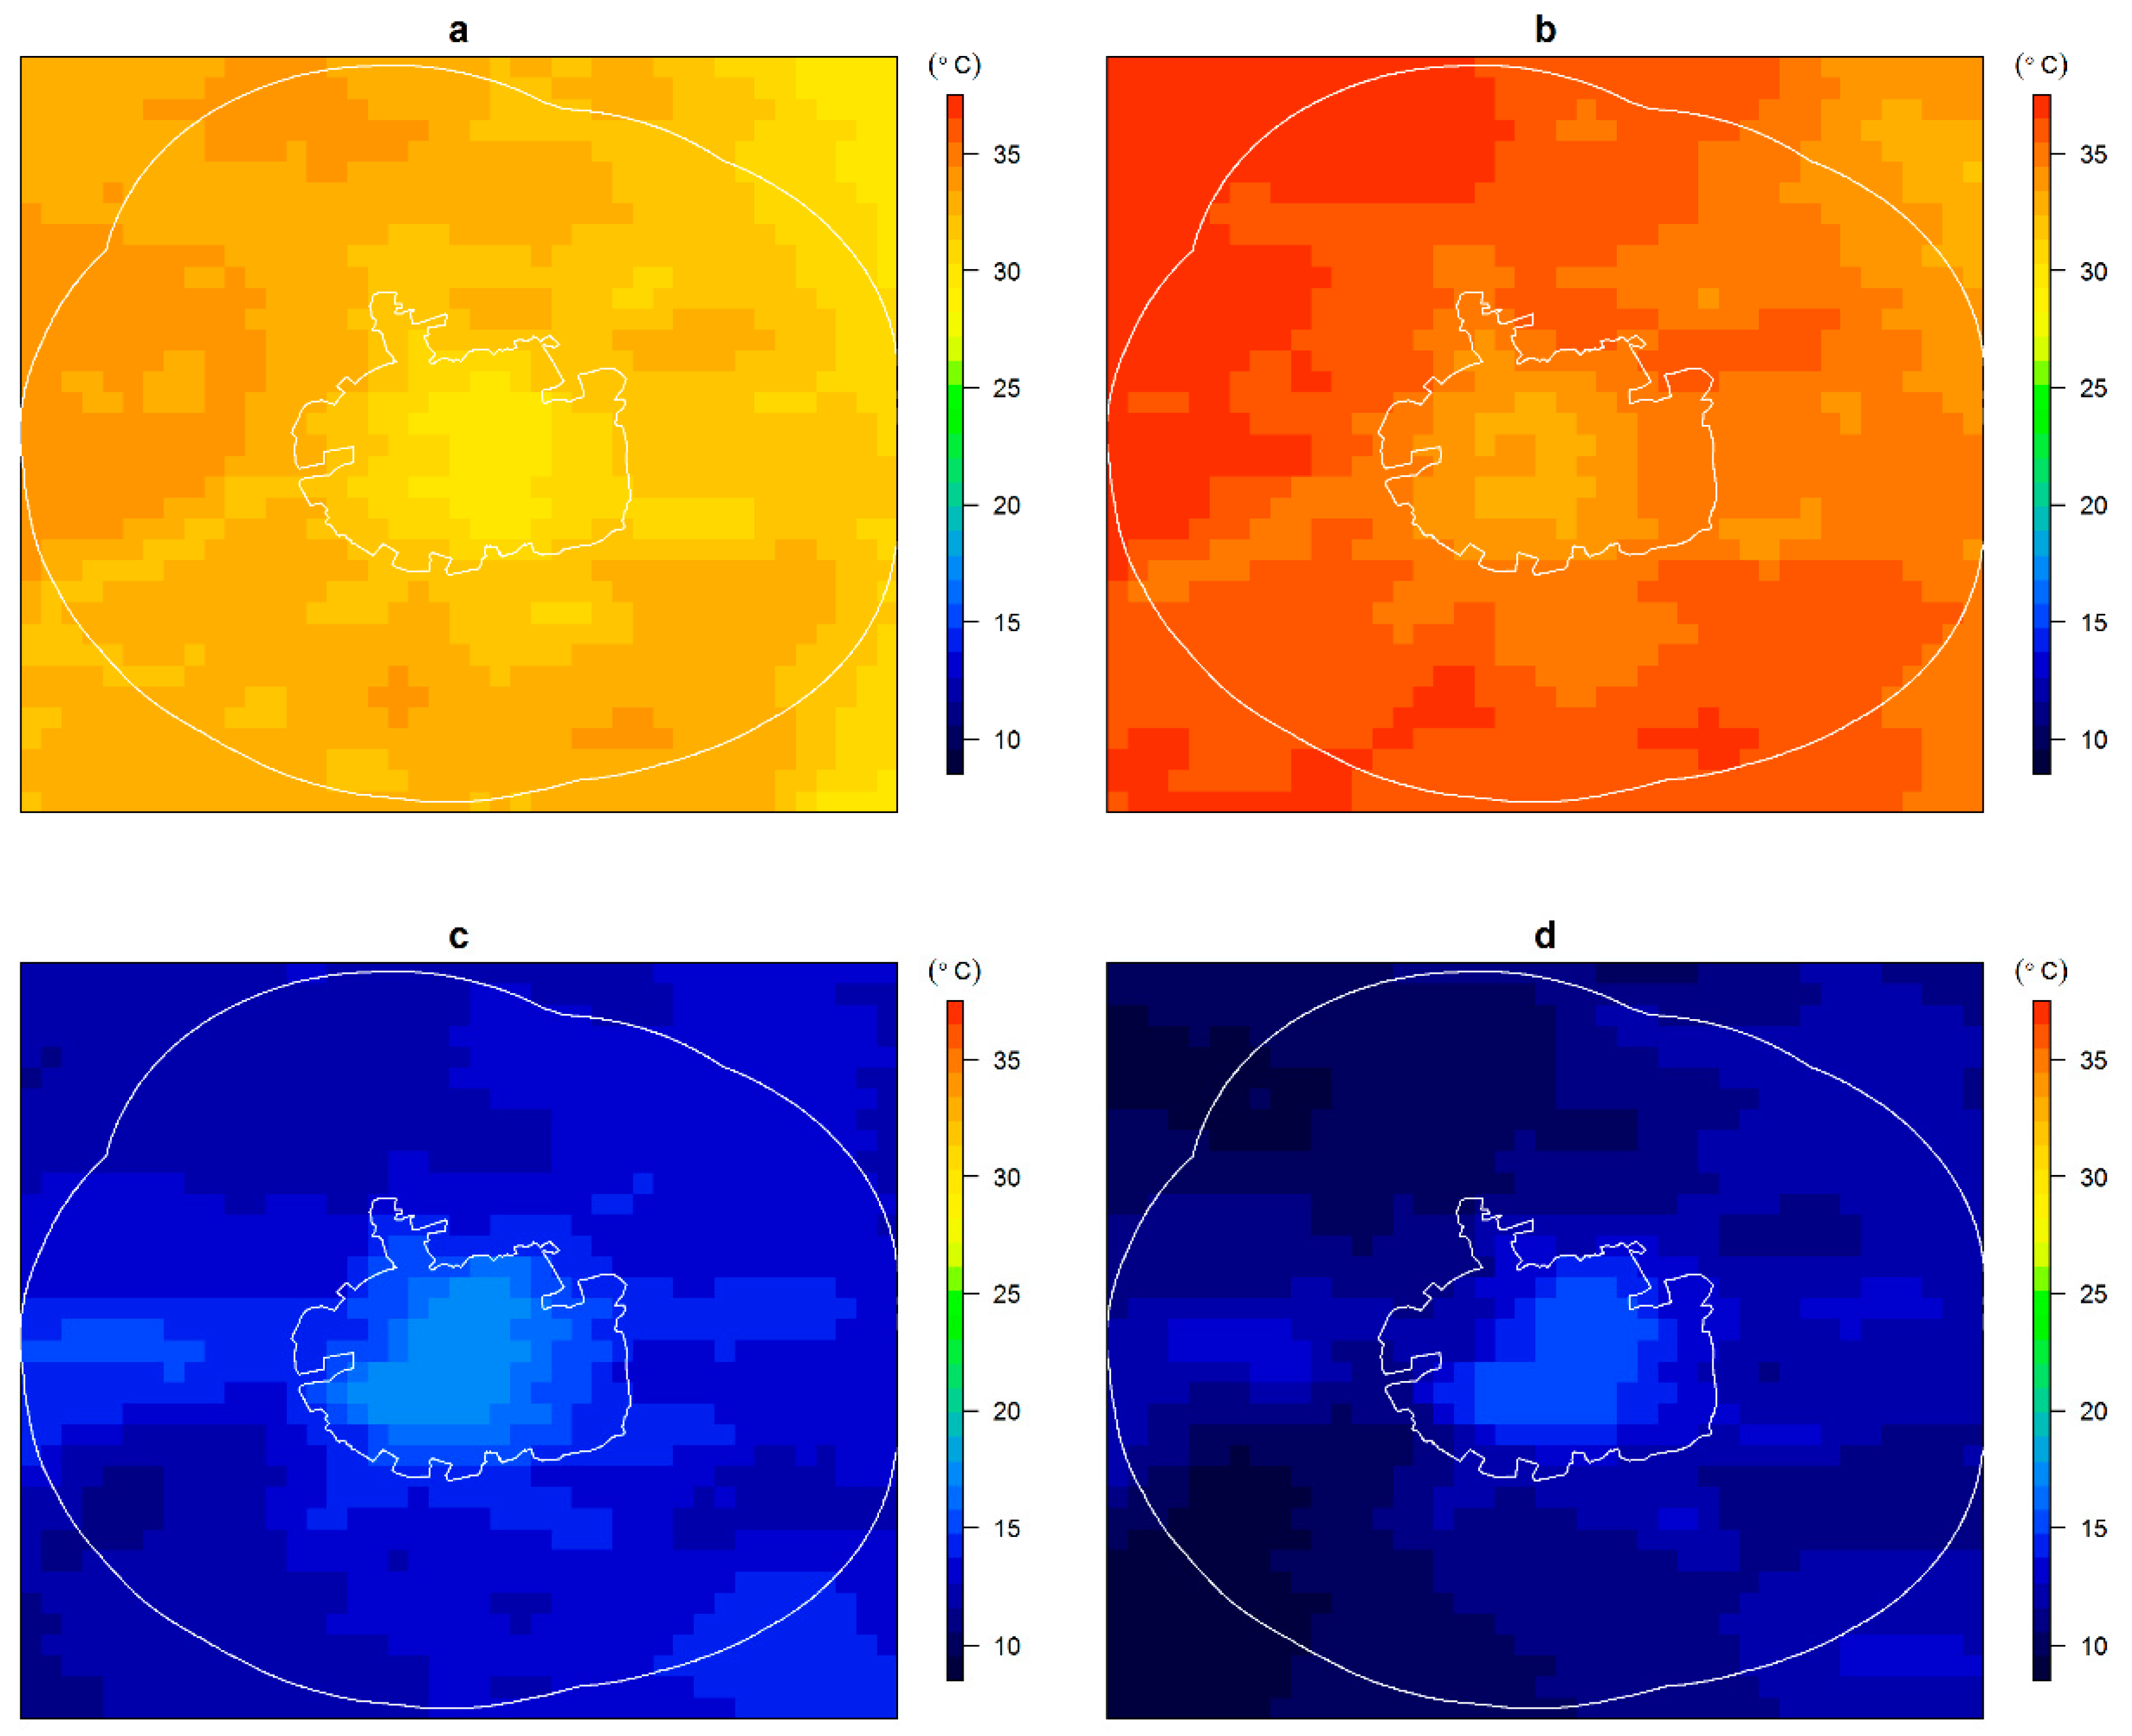
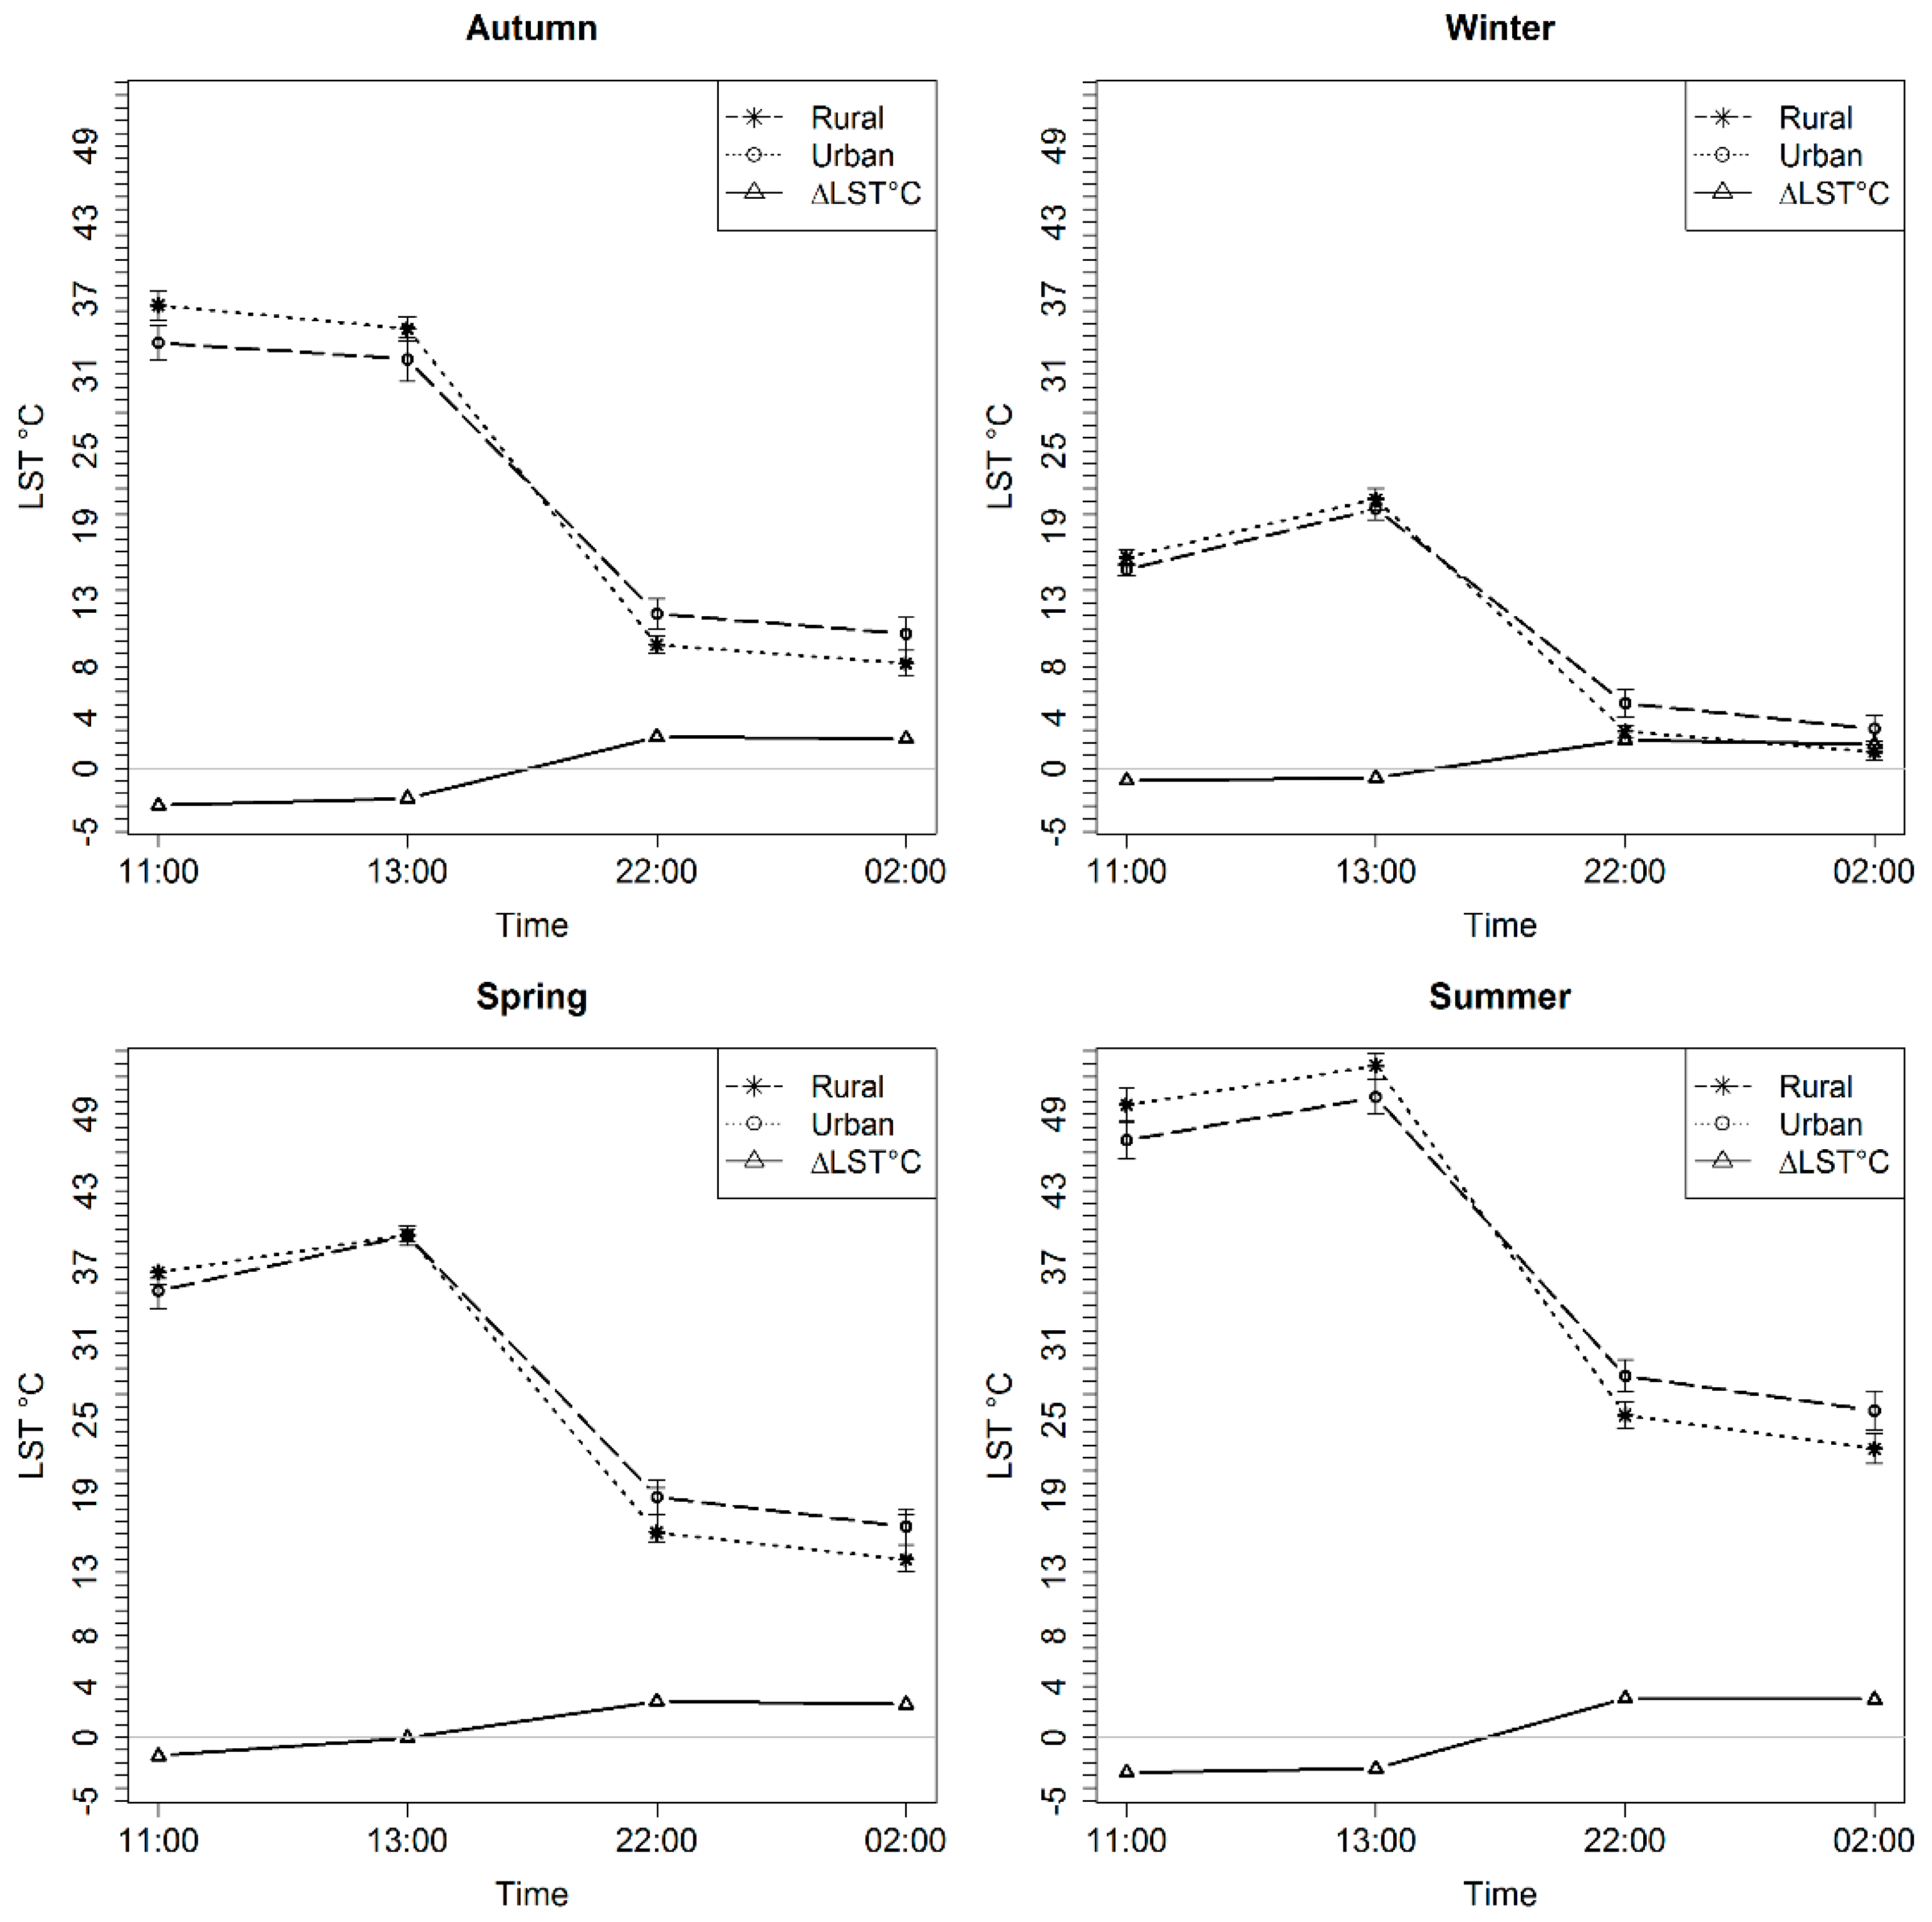
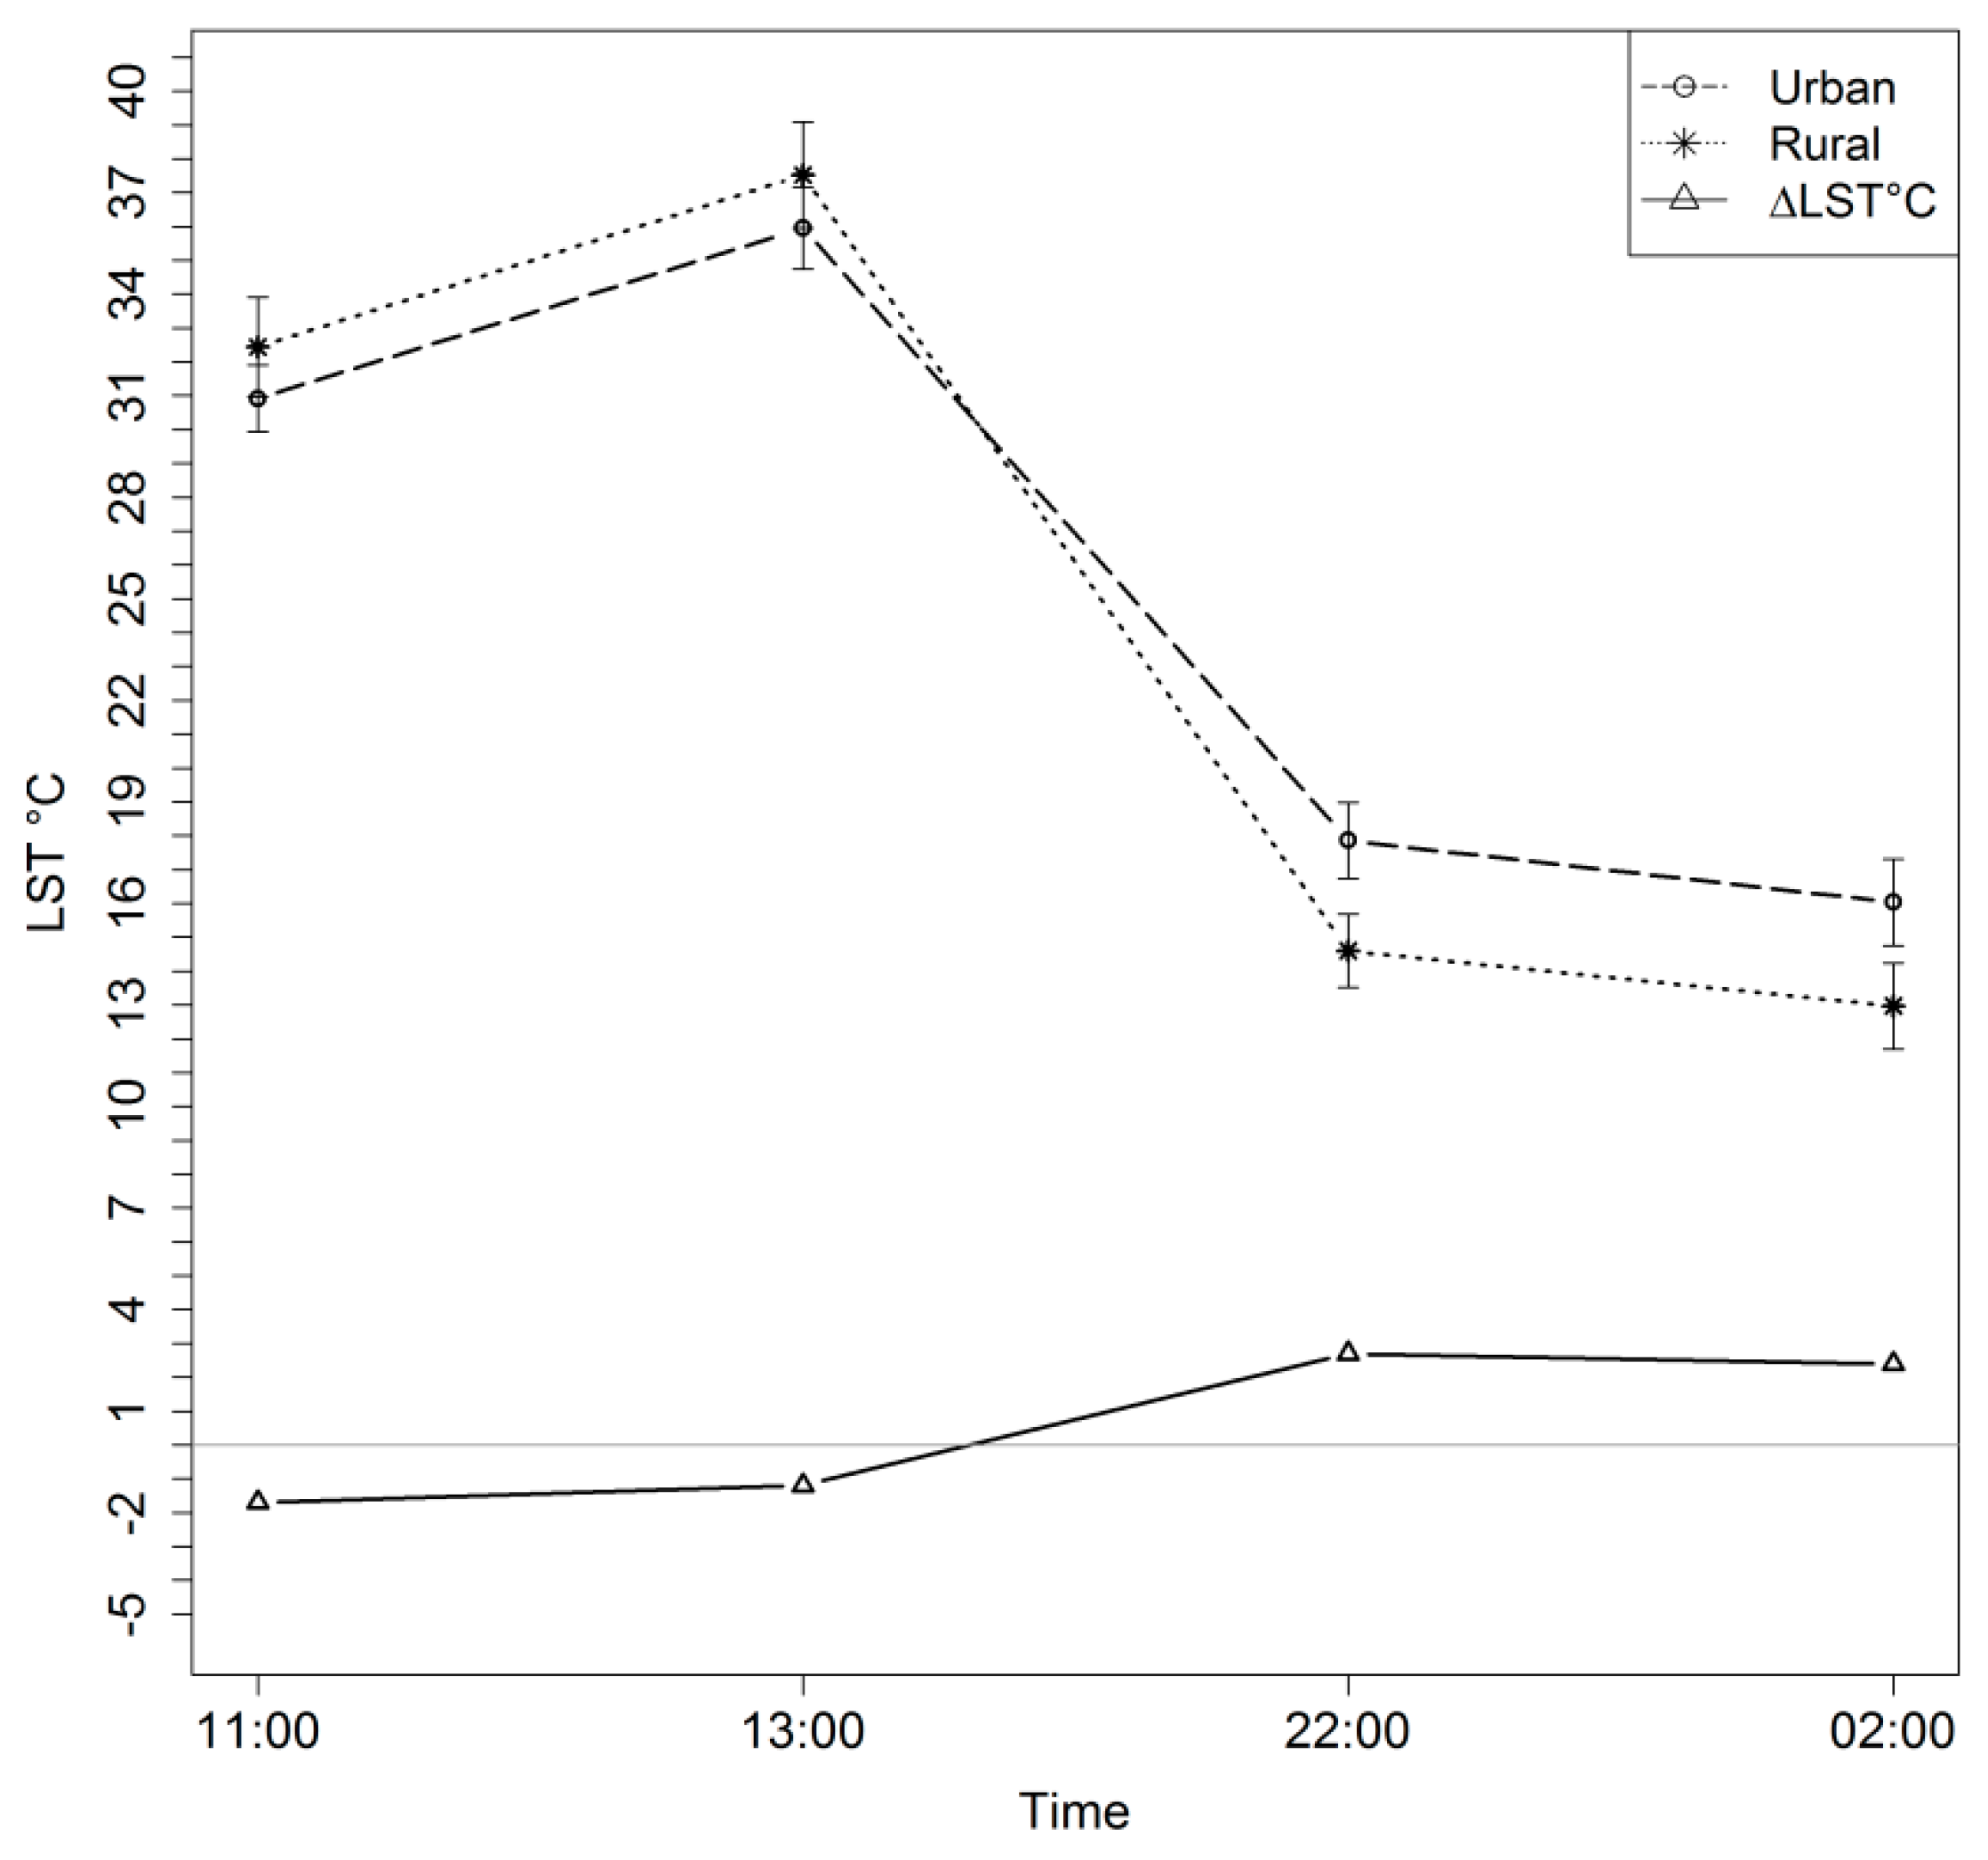
3.1. Diurnal Variation of LST and SUCI/SUHI

There is considerable variation of LST and SUCI/SUHI between the city and rural areas due to the variation of heat absorption and radiation during the day and night, respectively. Figure 2 indicates that generally during the day the city experiences a SUCI effect. The magnitude of the SUCI intensity tends to be greatest (–1.78 ± 1.68 °C) in the morning (11:00) although there is some seasonal variation. However, at night the situation is reversed and LST in the city is higher than the rural surroundings and a SUHI is experienced. The SUHI intensity attains its highest value, around 2.67 ± 0.72 °C, in the early night (~22:00 pass); this drops off during the late night. In terms of the most extreme SUCI and SUHI during these 12 years, in the morning (11:00) SUCI was −5.37 °C, and in the afternoon it was −5.32 °C. The highest SUHI of early night was 4.59 °C and it was 4.28 °C in the late night.
Figure 3 demonstrates the variation between the average LST and SUCI/SUHI over all seasons between the city of Erbil and the rural surroundings for the four overpasses of the Terra and Aqua satellite during 2014. At ~11:00, the LST of the city was 30.92 ± 0.98 °C, whilst the LST of the rural area was 32.44 ± 1.46 °C. The city experienced a daytime SUCI averaging −1.5 °C, decreasing to −1.2 °C by the afternoon. In contrast, at night the surface of the rural environment radiates more heat than the surface of the city. Consequently, the average LST of the city in 2014 at ~22:00 was 17.86 ± 1.12 °C whilst in the rural area it was 14.6 °C ± 1.09 °C. The SUHI intensity was 3.3 °C, decreasing to 3.1 °C by ~02:00.

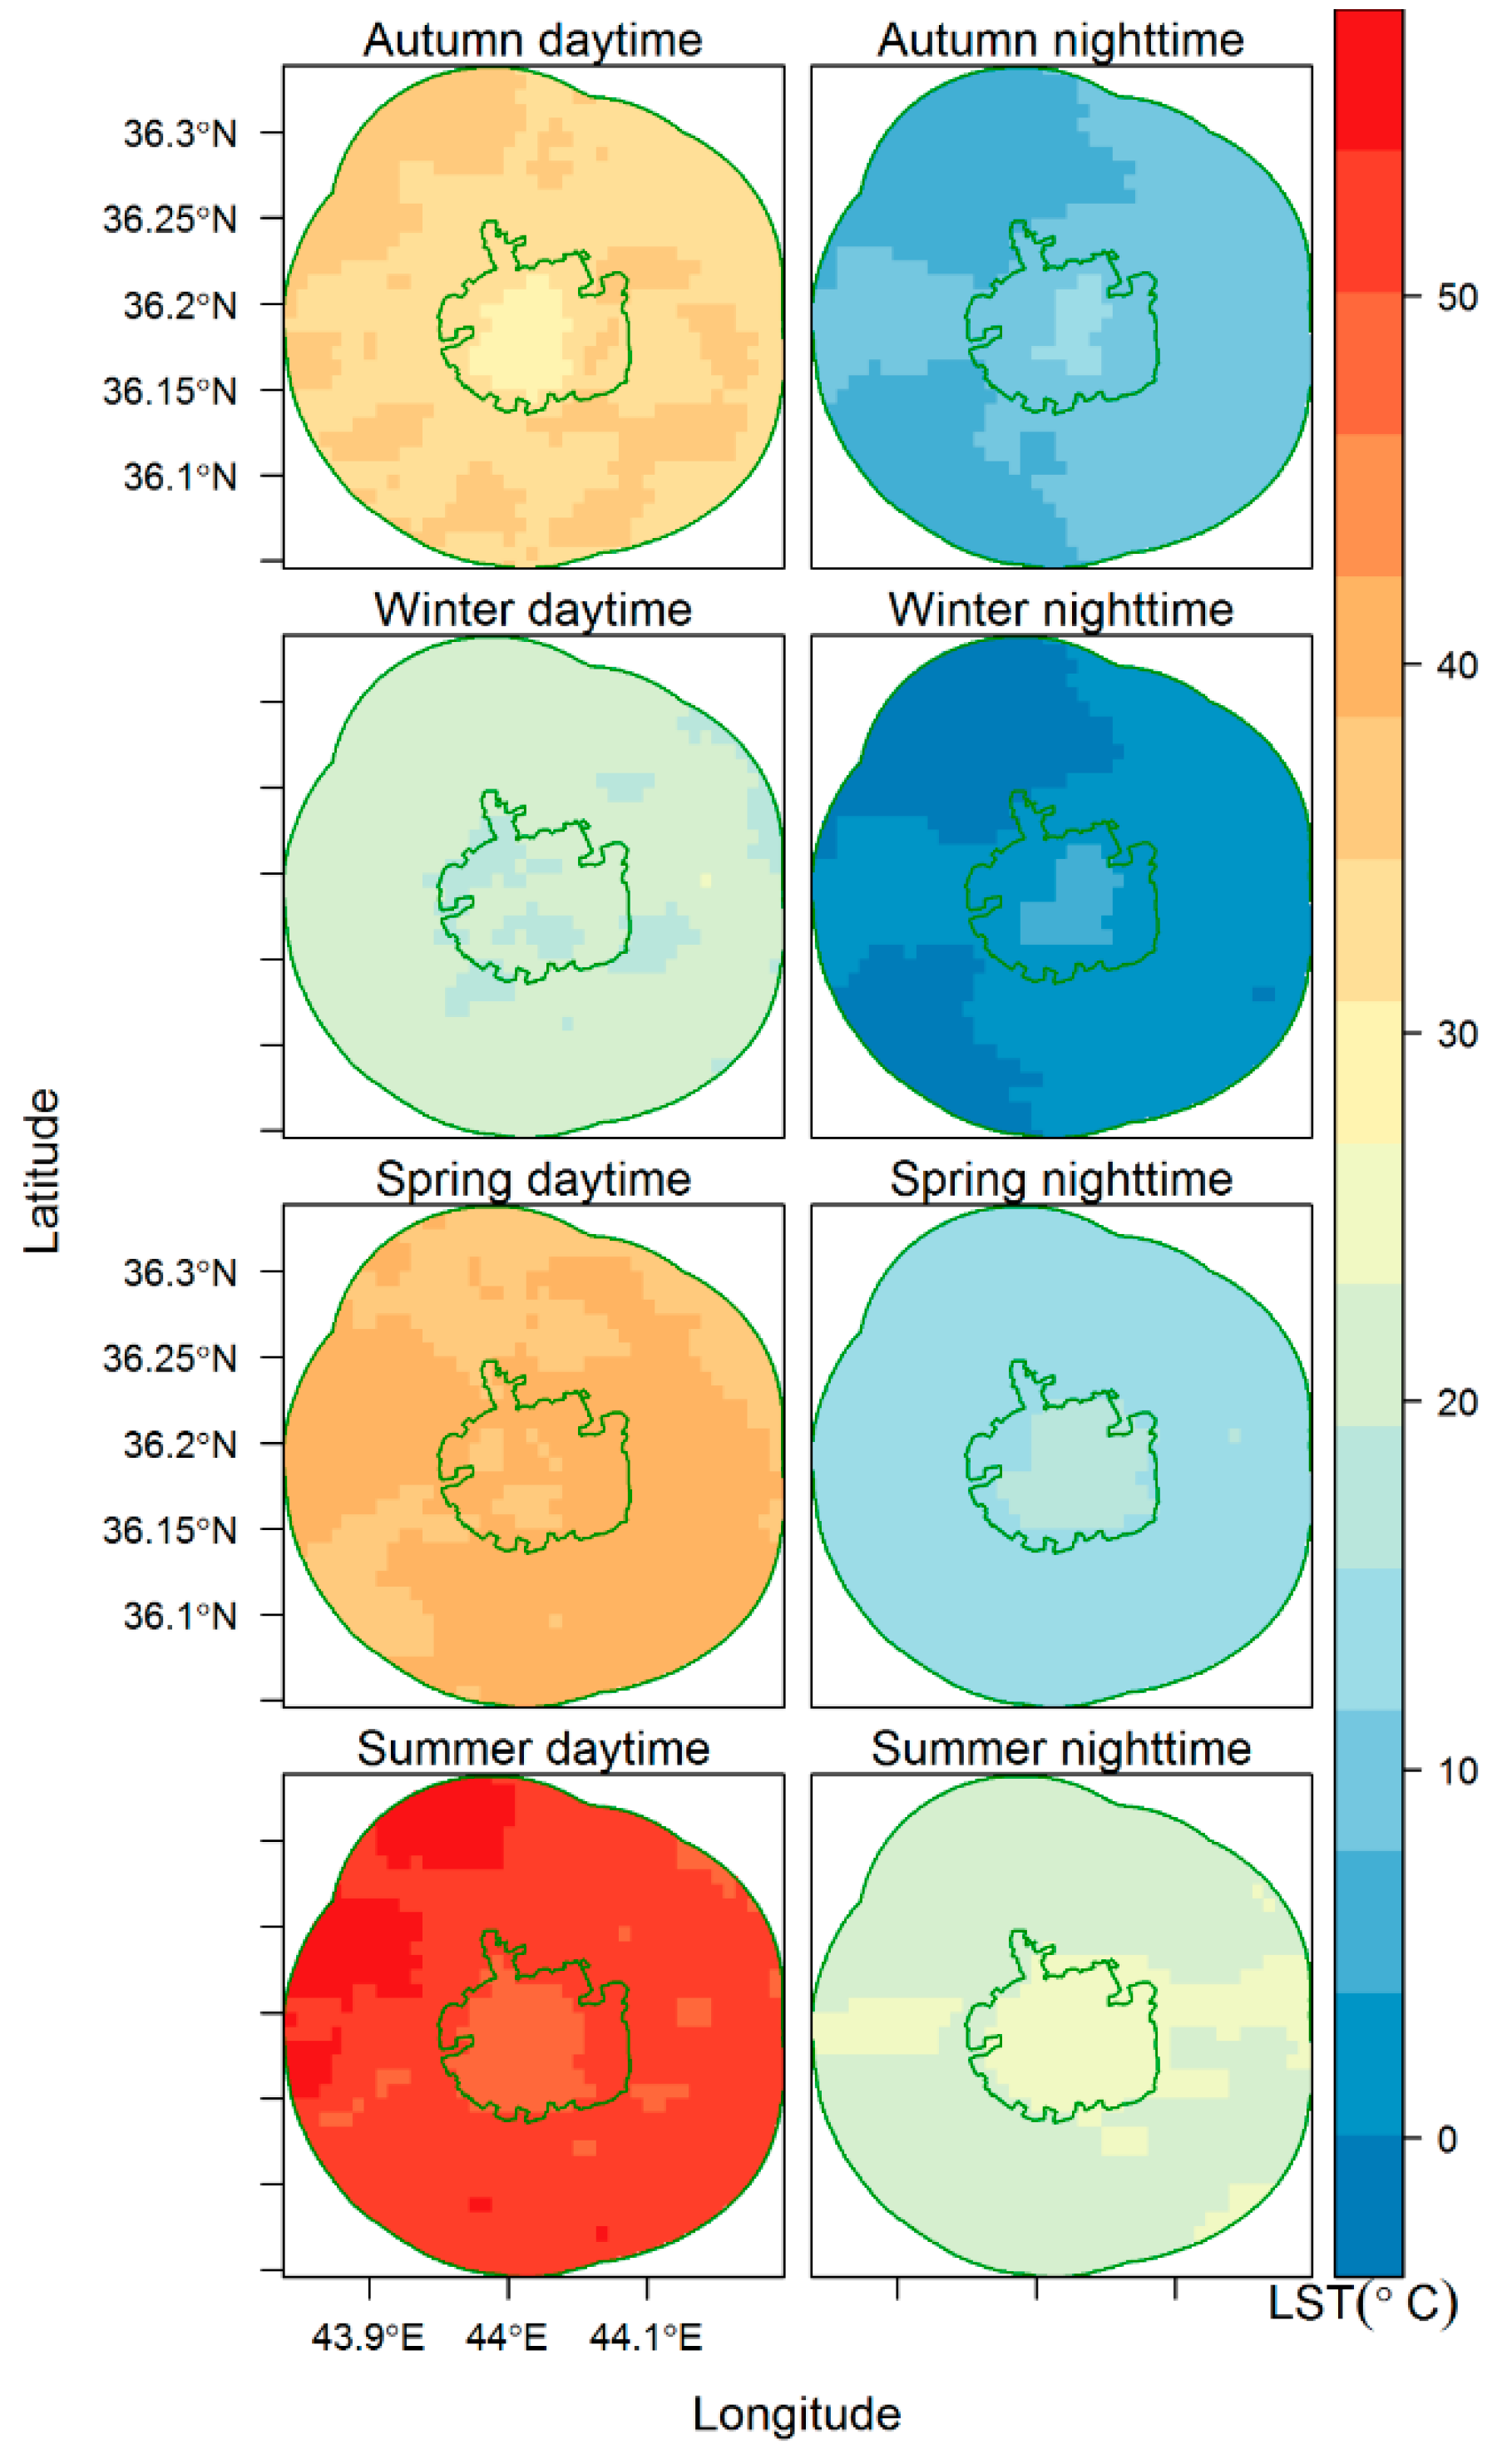
3.2. Seasonal Variation of LST and SUCI/SUHI

The city exhibits a night-time SUHI with varying intensity depending on the season (Figure 4 and Figure 5). In the spring and summer, the intensity of the SUHI in the study area is higher than during autumn and winter. In contrast, the intensity of the daytime SUCI (negative SUHI) is higher in autumn and summer; the incidence of a daytime SUCI decreases in winter and spring. Spring is the growing season for grasses and crops in the rural area, which cools the local environment via reduced heat absorption and greater evapotranspiration and latent heat flux during this season.
In autumn, during the daytime LST in the rural area is higher than the LST of Erbil and it exhibits a SUCI. In contrast, at night the urban areas experienced a SUHI (Table 3). In spring during the daytime, the city typically exhibited a mild SUCI (at ~13:00 the SUCII was −0.05 ± 0.64 °C). During the night-time SUHI was 2.82 °C ± 1.05. In summer, the average of LST in the city at ~11:00 was 46.98 ± 1.43 °C and the LST of the rural area 49.76 ± 1.30 °C. The SUCI intensity was −2.78 °C at 11:00, whilst during the night-time the city exhibited a SUHI intensity of 3.05 °C. This is particularly problematic from a public health perspective; as it is reducing thermal comfort while increasing the risk of heatstroke, exhaustion, and heat-related mortality. In addition, it increases the effect of heat waves on inhabitants who are sensitive to high temperatures, such as the elderly, children and the sick [59,60,61,62].

3.3. Vegetation and Moisture Indices

3.3.1. NDVI

In general, during the last 12 years the NDVI of the rural area was higher than the NDVI of Erbil. The average NDVI of the rural area was 0.22 ± 0.11 whereas the average NDVI of the city was 0.16 ± 0.05 (Table 4). Since vegetation in the study area is strongly dependent upon precipitation, the value of NDVI varies between years depending on the amount of rain. The peak NDVI value was recorded in 2003 when it was 0.57 in the rural area and 0.37 in the city. The total precipitation in that year was high (496.3 mm) compared to the annual average (386.2 mm). The lowest values of NDVI (0.12 ± 0.02) coincided with reduced precipitation in 2008 (297.5 mm). Moreover, the value of NDVI demonstrates seasonal variation. High values (0.31 ± 0.07 in the rural and 0.19 ± 0.05 in the city) occur in spring when precipitation is high and temperatures start to increase. In contrast, during the dry season (summer) the seasonal average of NDVI dropped to the lowest value with 0.14 ± 0.01 in the rural area and 0.13 ± 0.01 in the city.

3.3.2. NMDI

In general, the NMDI in the city is higher than the rural surroundings and it displays annual and seasonal variation. The average NMDI in the city during 2003 to 2014 was 0.69 ± 0.03 and it was 0.60 ± 0.12 in the rural area (Table 4). The high moisture in the city compare to the rural areas is a result of irrigation activity of city dwellers and low precipitation in the area.

3.3.3. Soil Moisture Constraint

In general, the fsm in the city is higher than the rural surroundings and it displays annual and seasonal variation. The average fsm in the city during 2003 to 2014 was 0.35 ± 0.11 and it was 0.27 ± 0.11 in the rural area. The peak fsm of the city was 0.77 in December 2013 and the lowest value was 0.18 in June 2006. Moreover, the highest value of the rural area was 0.82 in December 2013 and the lowest value (0.12) was recorded in June 2006. In general, fsm is high in the winter and autumn when it is between 0.4 to 0.7, while in the summer it reduced to between 0.1 and 0.3.

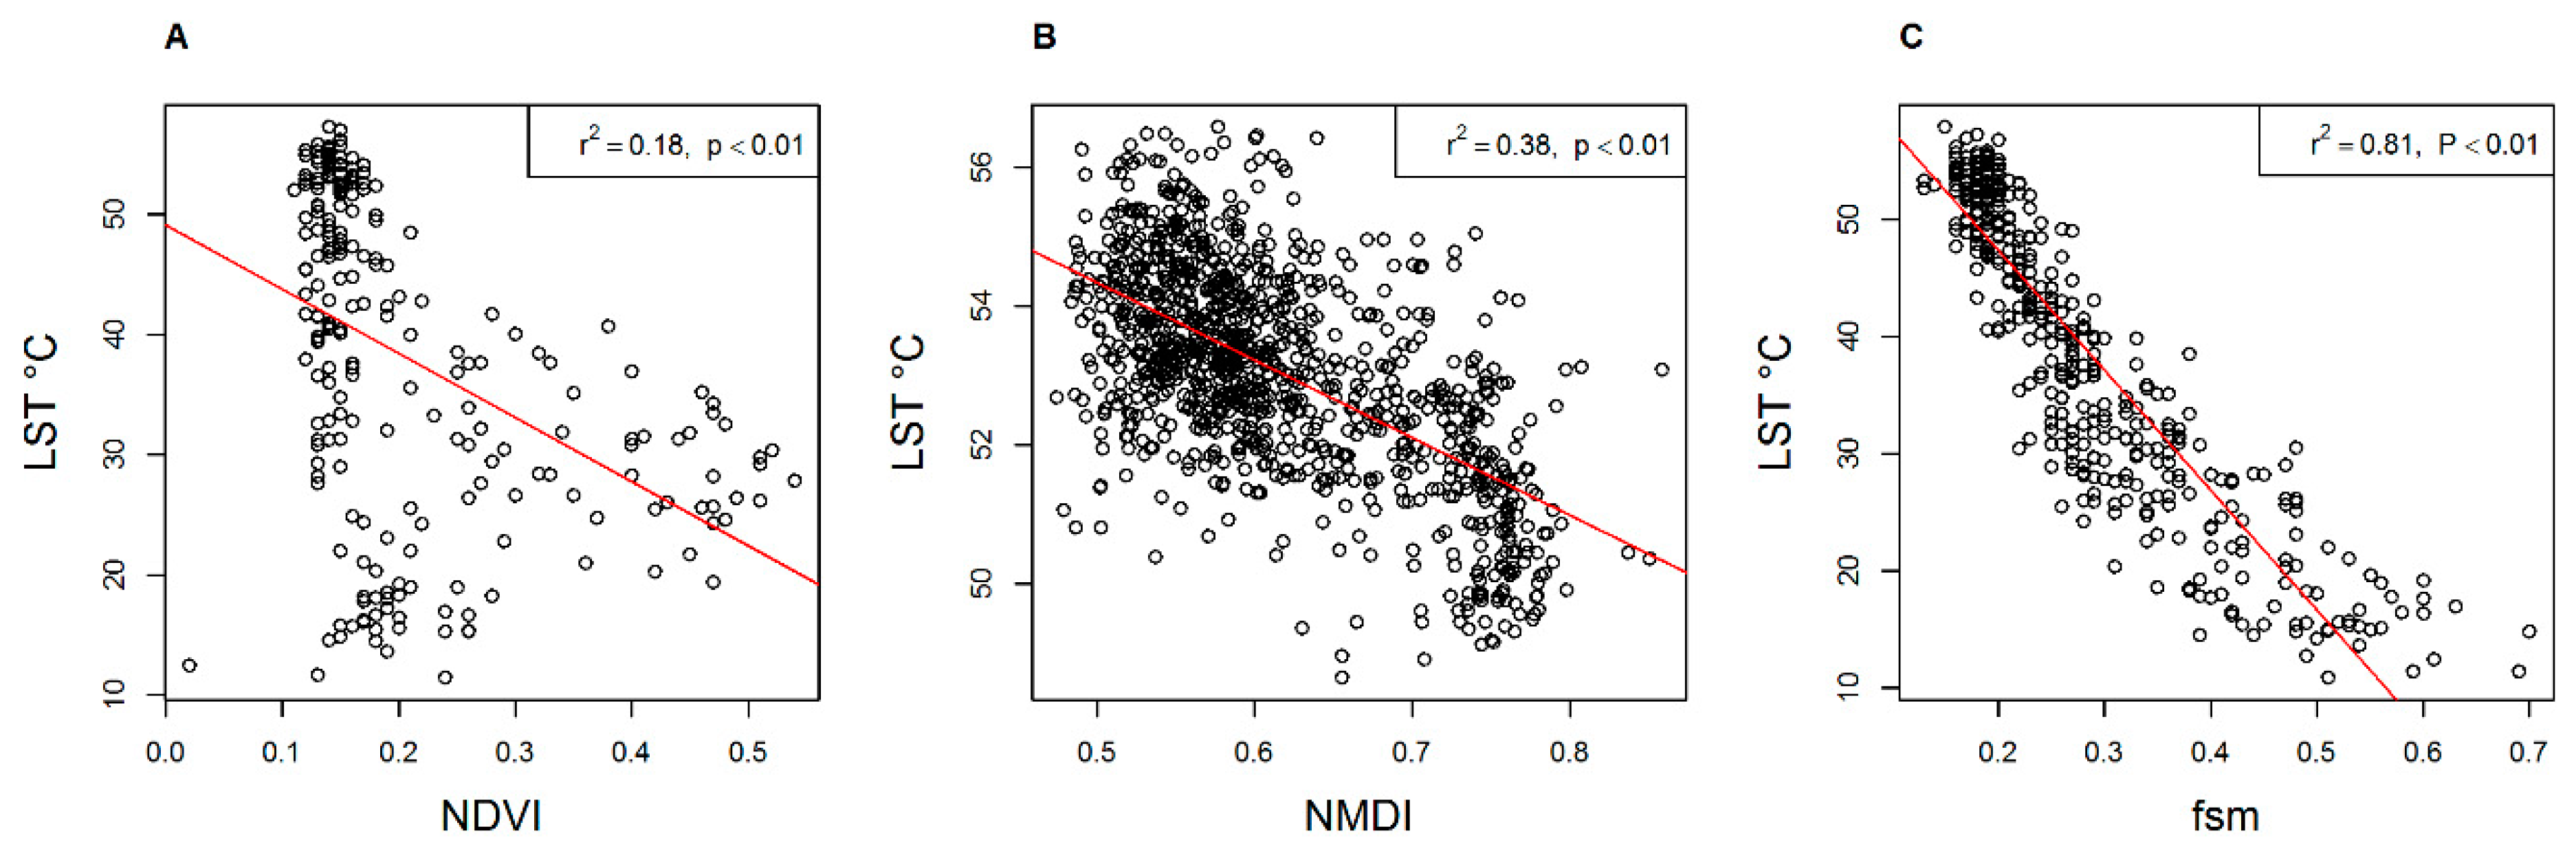
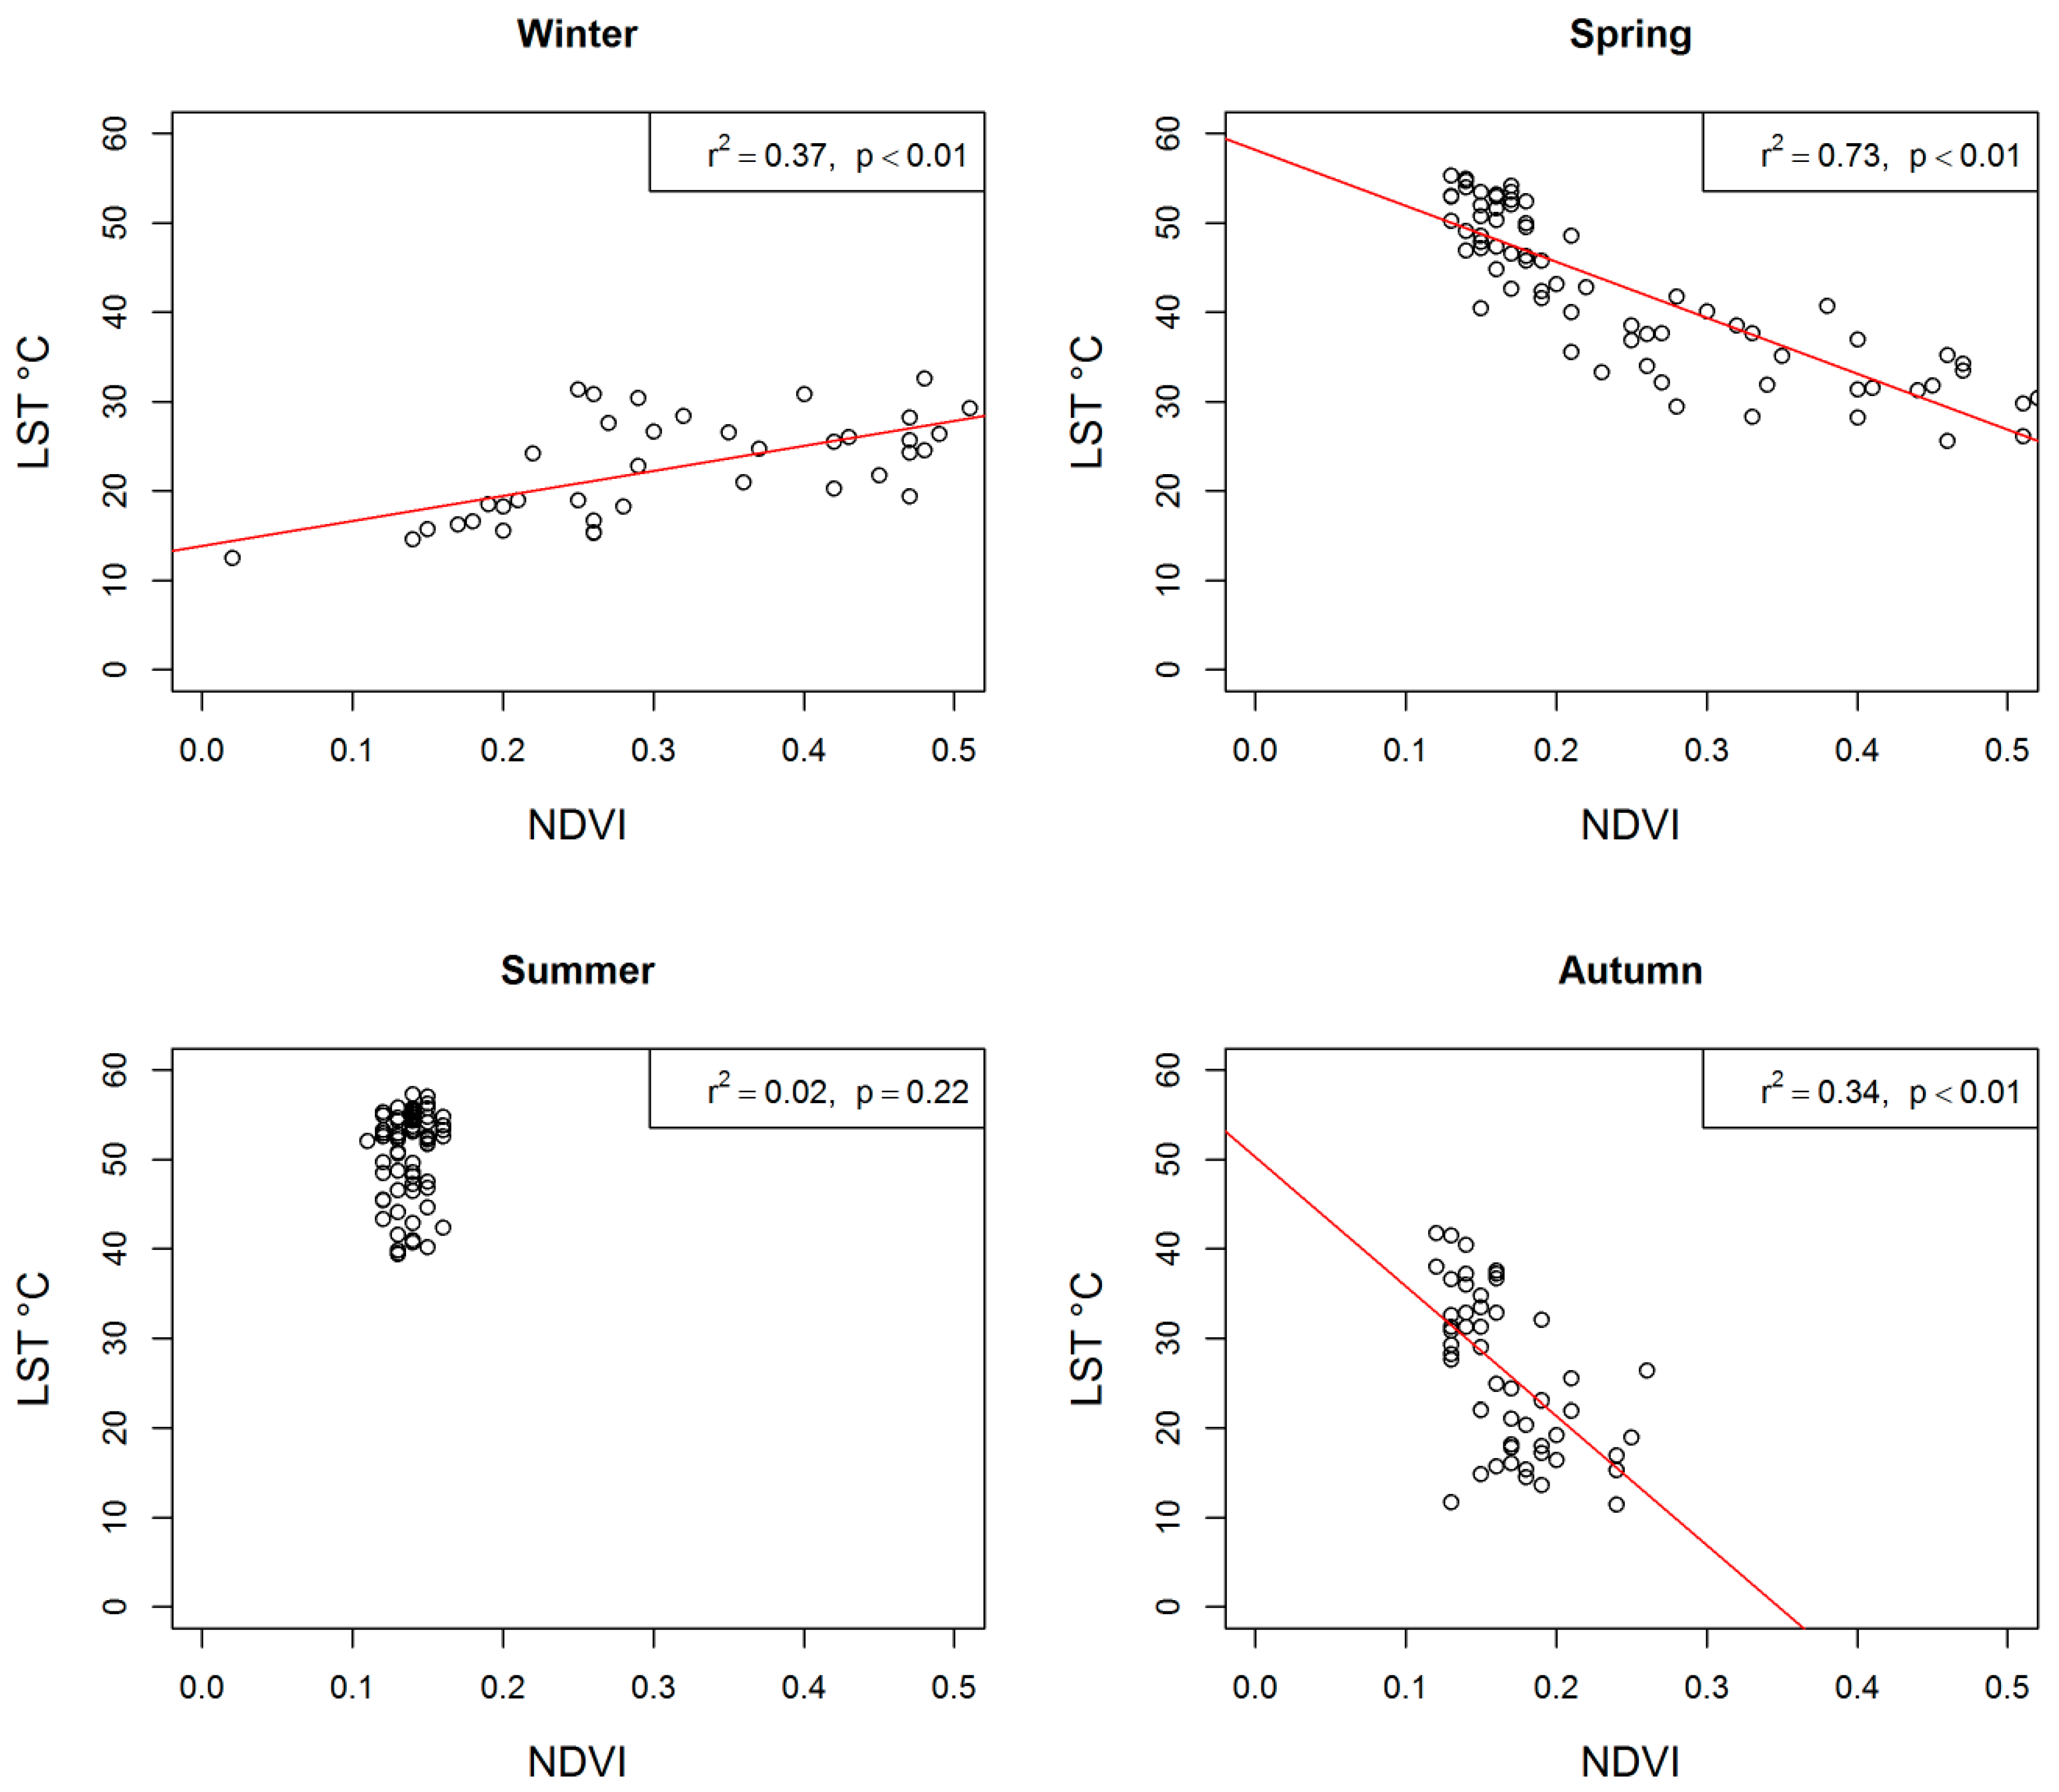
3.4. Relationships between LST and NDVI, fsm and NMDI

A weak but statistically significant inverse relationship (r2 = 0.18; p < 0.01) between surface temperature and NDVI was found (Figure 6). As a result of seasonal vegetation phenology, the relationship of LST with NDVI varies by season. In the wet spring, vegetation in the study area increases significantly. During this season the highest inverse relationship (r2 = 0.73, p < 0.01) is found between LST and NDVI (Figure 7). In the dry summer, NDVI values drop to the lowest level and the relationship with LST becomes very weak (r2 = 0.02, p = 0.22). At the start of the wet season in autumn, NDVI increases slightly and the relationship with LST is stronger (r2 = 0.34, p < 0.01). However, in the winter the relationship between NDVI and LST during daytime switches to a positive relationship (r2 = 0.37, p < 0.01), especially when LST is low. As an extension of our previous results [20], applying MODIS products to establish the relationship of LST and NDVI for each season in this research adds further insight into the nature of this relationship.
A moderate inverse relationship (r2 = 0.38; p < 0.01) is found between LST and NMDI. Inside the city the NMDI is 0.35 ± 0.11 and the mean LST at ~11:00 is 30.92 ± 0.98 °C, whilst in the 10 km buffer of the city the NMDI decreases to 0.27 ± 0.11. Moreover, the mean LST increased to 32.44 ± 1.46 °C.
A strong statistically significant inverse relationship (r2 = 0.81; p < 0.01) is ascertained between LST and fsm. Areas with high fsm have low LST; for inside the city border the fsm is 0.35 ± 0.11 and the mean LST at ~11:00 is 30.92 ± 0.98 °C, whilst in the 10 km buffer of the city the fsm decreases to 0.27 ± 0.11. Moreover, the mean LST increased to 32.44 ± 1.46 °C.

4. Discussion

The results presented here demonstrate a different dynamic behaviour in the semi-arid climate of Erbil, where the strongest SUHI occurs at night, confirming earlier results by Cheval et al. [63], and turning into a SUCI during the day. The results indicate the existence of SUCI during different times of the day and not only in the morning as stated in the literature [64,65,66,67].
The seasonal variation of SUCI/SUHI indicates that the night-time SUHI is stronger in the spring and summer than the autumn and winter. This is in agreement with Li et al. [68], who found that SUHI is higher in summer and spring and weaker in the winter and autumn. Similarly, Chow and Roth [38] observed the highest UHI intensity during the dry season and lowest intensities during the wet season. On the other hand, daytime SUCI intensity in the autumn and summer is higher than in winter and turns neutral in the spring. In general, during summer the UHI effect is more important to the urban residential areas. This is due to the more extreme thermal conditions, which increase illnesses and deaths related to heat [69].
During the study period, NDVI of the rural areas was on average 0.06 higher than the NDVI of the urban areas. The result for Erbil as a semi-arid area disagrees with results from arid studies, for instance for Phoenix in the USA [11,12]. Nevertheless, because the vegetation in the area mainly depends on precipitation, this difference of NDVI between the city and rural areas increases significantly in spring and decreases during the dry season. In March 2010 and 2013, this difference reached 0.31 while in August and September 2013 no differences were observed.
This study also examined the relationship of LST and NDVI by season for twelve years of MODIS data. The general relationship for the 12-year period was weakly negative. In general vegetation in the study area depends on the precipitation, rather than irrigation. Therefore, the majority of croplands are dry in the summer time. Therefore, this seasonality in vegetation lead to seasonal variation in relationship between LST and NDVI. The results indicate that this relationship changes significantly with season, confirming the results of Yuan and Bauer [27] and Sun and Kafatos [21]. In the summer, it is very weak. The peak of the inverse relationship is located in the spring within the period of vegetation growth, meaning that in the area of high vegetation greenness LST decreases. On the contrary, during the winter, which is a relatively cold and wet season in the study area, this relationship turns positive and LST rises with increasing NDVI. This positive relationship is consistent with Sun and Kafatos [21] during the winter, Haashemi et al. [42] and the results of Schultz and Halpert [70] in the high and mid-latitudes. The reason for this positive relationship is potentially related to vegetation water content which retains heat during the cold period; the decrease of photosynthesis may also have an influence [42].

5. Conclusions

During the twelve years of MODIS observations, the greatest magnitude of SUCI occurs in the morning. However, the greatest magnitude of SUHI emerged at early night. Diurnal variation shows that in the morning, the average LST of the city was lower than the rural and the city experienced a SUCI during the day with higher intensity in the morning than the afternoon. Average LST of the city in 2014 at night was higher than the LST of the rural area.
In terms of seasonal variation, during the night in all seasons the city exhibits a SUHI with different intensity. In the spring and summer, the intensity of the SUHI in the study area is higher than in autumn and winter. During the day-time the SUCII is higher in autumn and summer and decreases in winter, changing to a weak SUCI in the spring, which is the growing season of grasses and crops in rural areas. For this reason, the rural area absorbs heat more slowly in spring. In summer, the hottest and driest season, at 13:00 the average LST of the city is 50.36 ± 1.35 °C and LST of the rural areas is 52.84 ± 1.01 °C and SUCII is −2.48 °C. During the night-time, the city exhibits a SUHI with SUHII around 3.05 °C.
The examination of the key factors that influence LST in the study area shows that during the last twelve years NDVI in rural areas was higher than in Erbil city. In contrast, NMDI in the city is higher than in the rural area and shows annual and seasonal variation. The reason is that in the urban areas people wet the surface by irrigation of urban green spaces, mainly in greener residential areas and urban parks [71], while in the rural areas agriculture is rain-fed rather than irrigated. In the study area, 93% of croplands are rain-fed [72], therefore, the vast majority of croplands are very dry in the summertime.
A strong significant inverse relationship is ascertained between LST and fsm. A weak but significant inverse relationship between LST and NDVI was found. This relationship varies in magnitude with season. During spring, the strongest inverse relationship is found between LST and NDVI. This relationship weakened in summer and was moderately strong (inverse) in autumn. However, in winter this relationship turns into a moderate positive relationship. A moderate (significant) inverse relationship is found between surface temperature and NMDI.
MODIS LST was effective for studying the temporal variation of SUHI/SUHI (e.g., diurnal and seasonal). In addition, using QA data in the quality control process helped to achieve results that are more accurate. Using R scripts in addition to ENVI Software for processing MODIS products in this study was time-saving. Applying MODIS products for the relationship of LST and NDVI investigated for each season in this research adds details of the nature of the relationship between them, and explains the reason of argument on this relationship in literature.
A SUCI was detected in the semi-arid city of Erbil during different times of the day and not only in the morning as stated in previous literature. This study has focused on the temporal variation of the SUCI/SUHI. Spatial variations, based on land cover and land use in Erbil, have been investigated previously [20]. Future studies on the surface temperature of cities in arid and semi-arid environments are required to confirm the results presented here. Other research should focus on long-term air temperature measurements for UCI/UHI exploration. This study was limited to assessing a subset of all possible factors influencing the UHI effect while future studies should address this limitation and explore more factors that affect LST, such as urban geometry, albedo and building components.

Acknowledgments

The authors would like to thank the HCDP Scholarship Programme and Soran University for their financial support of this research. Many thanks go to the Oak Ridge National Laboratory Distributed Active Archive Centre (ORNL DAAC), for providing the research with MODIS products of the case study area. We would also like to acknowledge the R Development Core Team to continuously improve and support this freely available software. H. Balzter was supported by the Royal Society Wolfson Research Merit Award, 2011/R3 and the NERC National Centre for Earth Observation.

Author Contributions

Azad Rasul conceived the research and processed all the data. Azad Rasul, Heiko Balzter and Claire Smith all contributed in designing the research, writing and editing the paper.

Conflicts of Interest

The authors declare no conflict of interest. The founding sponsors had no role in the design of the study; in the collection, analyses, or interpretation of data; in the writing of the manuscript, and in the decision to publish the results.

References

  1. Voogt, J.A.; Oke, T.R. Thermal remote sensing of urban climates. Remote Sens. Environ. 2003, 86, 370–384. [Google Scholar] [CrossRef]
  2. Guoyin, C.; Mingyi, D. Relationship between thermal inertia and urban heat sink in Beijing derived from satellite images. In Proceedings of the 2009 Joint Urban Remote Sensing Event, Shanghai, China, 20–22 May 2009.
  3. Shigeta, Y.; Ohashi, Y.; Tsukamoto, O. Urban Cool Island in daytime-analysis by using thermal image and air temperature measurements. In Proceedings of the Seventh International Conference on Urban Climate, Yokohama, Japan, 29 June–3 July 2011.
  4. Witherick, M.; Ross, S.R.; Small, R.J. A Modern Dictionary of Geography; Oxford University Press: Oxford, UK, 2001. [Google Scholar]
  5. Weng, Q.; Lu, D.; Schubring, J. Estimation of land surface temperature—Vegetation abundance relationship for urban heat island studies. Remote Sens. Environ. 2004, 89, 467–483. [Google Scholar] [CrossRef]
  6. Farina, A. Exploring the Relationship between Land Surface Temperature and Vegetation Abundance for Urban Heat Island Mitigation in Seville. Master’s Thesis, Lund University, Lund, Sweden, 2012. [Google Scholar]
  7. Watson, C. Analysis of Urban Heat Island Climates along the I-85/I-40 Corridor in Central North Carolina. Ph.D. Thesis, University of North Carolina, Chapel Hill, NC, USA, 2012. [Google Scholar]
  8. Rao, P. Remote sensing of urban heat islands from an environmental satellite. Bull. Am. Meteorol. Soc. 1972, 53, 647. [Google Scholar]
  9. Matson, M.; Mcclain, E.P.; McGinnis, D.F., Jr.; Pritchard, J.A. Satellite detection of urban heat islands. Mon. Weather Rev. 1978, 106, 1725–1734. [Google Scholar] [CrossRef]
  10. Hsu, S. Variation of an urban heat island in Phoenix. Prof. Geogr. 1984, 36, 196–200. [Google Scholar] [CrossRef]
  11. Brazel, S.W.; Balling, R.C., Jr. Temporal analysis of long-term atmospheric moisture levels in Phoenix, Arizona. J. Clim. Appl. Meteorol. 1986, 25, 112–117. [Google Scholar] [CrossRef]
  12. Tarleton, L.F.; Katz, R.W. Statistical explanation for trends in extreme summer temperatures at Phoenix, Arizona. J. Clim. 1995, 8, 1704–1708. [Google Scholar] [CrossRef]
  13. Stabler, L.B.; Martin, C.A.; Brazel, A.J. microclimates in a desert city were related to land use and vegetation index. Urban For. Urban Green. 2005, 3, 137–147. [Google Scholar] [CrossRef]
  14. Golden, J.S.; Brazel, A.; Salmond, J.; Laws, D. Energy and water sustainability: The role of urban climate change from metropolitan infrastructure. J. Eng. Sustain. Community Dev. 2006, 1, 55–70. [Google Scholar] [CrossRef]
  15. Georgescu, M.; Moustaoui, M.; Mahalov, A.; Dudhia, J. An alternative explanation of the semiarid urban area “oasis effect”. J. Geophys. Res. Atmos. 2011. [Google Scholar] [CrossRef]
  16. Nasrallah, H.A.; Brazel, A.J.; Balling, R.C. Analysis of the Kuwait city urban heat island. Int. J. Climatol. 1990, 10, 401–405. [Google Scholar] [CrossRef]
  17. Al-Ali, A.M.H. The Effect of Land Cover on the Air and Surface Urban Heat Island of a Desert Oasis. Ph.D. Thesis, Durham University, Durham, UK, 2015. [Google Scholar]
  18. Lazzarini, M.; Marpu, P.R.; Ghedira, H. Temperature-land cover interactions: The inversion of urban heat island phenomenon in desert city areas. Remote Sens. Environ. 2013, 130, 136–152. [Google Scholar] [CrossRef]
  19. Frey, C.M.; Rigo, G.; Parlow, E.; Marçal, A. The cooling effect of cities in a hot and dry environment. In Proceedings of the Global Developments in Environmental Earth Observation from Space, Porto, Portugal, 6–11 June 2005.
  20. Rasul, A.; Balzter, H.; Smith, C. Spatial variation of the daytime surface urban cool island during the dry season in Erbil, Iraqi Kurdistan, from Landsat 8. Urban Clim. 2015, 14, 176–186. [Google Scholar] [CrossRef]
  21. Sun, D.; Kafatos, M. Note on the NDVI-LST relationship and the use of temperature-related drought indices over North America. Geophys. Res. Lett. 2007, 34, 1–4. [Google Scholar] [CrossRef]
  22. Weng, Q.; Lu, D. A Sub-Pixel Analysis of urbanization effect on land surface temperature and its interplay with impervious surface and vegetation coverage in Indianapolis, United States. Int. J. Appl. Earth Obs. Geoinf. 2008, 10, 68–83. [Google Scholar] [CrossRef]
  23. Schwarz, N.; Schlink, U.; Franck, U.; Großmann, K. Relationship of land surface and air temperatures and its implications for quantifying urban heat island indicators—An application for the city of Leipzig (Germany). Ecol. Ind. 2012, 18, 693–704. [Google Scholar] [CrossRef]
  24. Liang, S.; Shi, P. analysis of the relationship between urban heat island and vegetation cover through Landsat ETM: A case study of Shenyang. In Proceedings of the 2009 Joint Urban Remote Sensing Event, Shanghai, China, 20–22 May 2009.
  25. Bajaj, D.N.; Inamdar, A.B.; Vaibhav, V. Temporal variation of urban heat island using Landsat data: A case study of Ahmedabad, India. In Proceedings of the 33rd Asian Conference on Remote Sensing 2012, Pattaya, Thailand, 26–30 November 2012.
  26. Zhang, Z.; Ji, M.; Shu, J.; Deng, Z.; Wu, Y. Surface urban heat island in Shanghai, China: Examining the relationship between land surface temperature and impervious surface fractions derived from landsat etm imagery. Remote Sens. Spat. Inf. Sci. 2008, 37, 601–606. [Google Scholar]
  27. Yuan, F.; Bauer, M.E. Comparison of impervious surface area and normalized difference vegetation index as indicators of surface urban heat island effects in Landsat imagery. Remote Sens. Environ. 2007, 106, 375–386. [Google Scholar] [CrossRef]
  28. Wang, L.; Qu, J.J. NMDI: A normalized multi-band drought index for monitoring soil and vegetation moisture with satellite remote sensing. Geophys. Res. Lett. 2007. [Google Scholar] [CrossRef]
  29. Clinton, N.; Gong, P. MODIS detected surface urban heat islands and sinks: Global locations and controls. Remote Sens. Environ. 2013, 134, 294–304. [Google Scholar] [CrossRef]
  30. Ren, G.; Zhou, Y. Urbanization effect on trends of extreme temperature indices of national stations over mainland China, 1961–2008. J. Clim. 2014, 27, 2340–2360. [Google Scholar] [CrossRef]
  31. Li, S.; Mo, H.; Dai, Y. Spatio-temporal pattern of urban cool island intensity and its eco-environmental response in Chang-Zhu-Tan urban agglomeration. Commun. Inf. Sci. Manag. Eng. 2011, 1, 1–6. [Google Scholar]
  32. Kłysik, K.; Fortuniak, K. Temporal and spatial characteristics of the urban heat island of Lodz, Poland. Atmos. Environ. 1999, 33, 3885–3895. [Google Scholar] [CrossRef]
  33. Memon, R.A.; Leung, D.Y.; Liu, C. An investigation of urban heat island intensity (UHII) as an indicator of urban heating. Atmos. Res. 2009, 94, 491–500. [Google Scholar] [CrossRef]
  34. Tran, H.; Uchihama, D.; Ochi, S.; Yasuoka, Y. Assessment with satellite data of the urban heat island effects in Asian mega cities. Int. J. Appl. Earth Obs. Geoinf. 2006, 8, 34–48. [Google Scholar] [CrossRef]
  35. Kolokotroni, M.; Giridharan, R. Urban heat island intensity in London: An investigation of the impact of physical characteristics on changes in outdoor air temperature during summer. Sol. Energy 2008, 82, 986–998. [Google Scholar] [CrossRef]
  36. Saitoh, T.; Shimada, T.; Hoshi, H. Modeling and simulation of the Tokyo urban heat island. Atmos. Environ. 1996, 30, 3431–3442. [Google Scholar] [CrossRef]
  37. Roth, M.; Oke, T.; Emery, W. Satellite-derived urban heat islands from three coastal cities and the utilization of such data in urban climatology. Int. J. Remote Sens. 1989, 10, 1699–1720. [Google Scholar] [CrossRef]
  38. Chow, W.T.; Roth, M. Temporal dynamics of the urban heat island of Singapore. Int. J. Climatol. 2006, 26, 2243–2260. [Google Scholar] [CrossRef]
  39. Tomlinson, C.; Prieto-Lopez, T.; Bassett, R.; Chapman, L.; Cai, X.; Thornes, J.; Baker, C. Showcasing urban heat island work in Birmingham—Measuring, monitoring, modelling and more. Weather 2013, 68, 44–49. [Google Scholar] [CrossRef]
  40. Stathopoulou, M.; Cartalis, C. Daytime urban heat islands from Landsat ETM and Corine land cover data: An application to major cities in Greece. Sol. Energy 2007, 81, 358–368. [Google Scholar] [CrossRef]
  41. Montávez, J.P.; Rodríguez, A.; Jiménez, J.I. A study of the urban heat island of Granada. Int. J. Climatol. 2000, 20, 899–911. [Google Scholar] [CrossRef]
  42. Haashemi, S.; Weng, Q.; Darvishi, A.; Alavipanah, S. Seasonal variations of the surface urban heat island in a semi-arid city. J. Appl. Meteorol. Climatol. 2016. [Google Scholar] [CrossRef]
  43. Frey, C.; Rigo, G.; Parlow, E. Urban radiation balance of two coastal cities in a hot and dry environment. Int. J. Remote Sens. 2007, 28, 2695–2712. [Google Scholar] [CrossRef]
  44. Sharif, A. Climate of the Erbil Region. Ph.D. Thesis, University of Salahadden, Erbil, Iraq, 1998. [Google Scholar]
  45. Erbil Governorate Profile. Available online: http://reliefweb.int/sites/reliefweb.int/files/resources/Erbil_governorate_profile_May_2015.pdf (accessed on 26 August 2016).
  46. Dizayee, R.H. Groundwater Degradation and Sustainability of the Erbil Basin, Erbil: Kurdistan Region, Iraq. Master’s Thesis, Texas Christian University, Fort Worth, TX, USA, 2014. [Google Scholar]
  47. Elements Climatic Data of Erbil City. Available online: http://earthexplorer.usgs.gov/ (accessed on 26 August 2016).
  48. Ibrahim, R.I.; Mushatat, S.A.; Abdelmonem, M.G. Erbil. Cities 2015, 49, 14–25. [Google Scholar] [CrossRef]
  49. Baper, S.Y.; Hassan, A.S.; Ismail, S.T. Modernization theory and house garden transformation: A case study in Erbil city. In Proceedings of the 2nd International Seminar on Tropical Eco-Settlements, Bali, Indonesia, 3–5 November 2010.
  50. Kahraman, L.M. Geographical analysis of the characteristics of soils and the problems of the province of Abril and scalability land productivity. Am. J. Civ. Eng. Archit. 2016. [Google Scholar] [CrossRef]
  51. Ghent, D.; Kaduk, J.; Remedios, J.; Ardö, J.; Balzter, H. Assimilation of land surface temperature into the land surface model JULES with an ensemble Kalman filter. J. Geophys. Res. Atmos. 2010. [Google Scholar] [CrossRef]
  52. Land Surface Temperature | Copernicus Global Land Service. 2016. Available online: http://land.copernicus.eu/global/products/lst (accessed on 1 March 2016).
  53. Land Surface Temperature: Global Maps. 2016. Available online: http://earthobservatory.nasa.gov/GlobalMaps/view.php?d1=MOD11C1_M_LSTDA (accessed on 1 March 2016).
  54. Near Surface Air Temperature—GES DISC-Goddard Earth Sciences Data and Information Services Center. 2016. Available online: http://disc.gsfc.nasa.gov/hydrology/data-holdings/parameters/near_surf_air_temp.shtml (accessed on 17 January 2016).
  55. Unger, J.; Gál, T.; Rakonczai, J.; Musci, L.; Szatman, J.; Tobak, Z. Air temperature versus surface temperature in urban environment. In Proceedings of the 7th International Conference on Urban Climate, Yokohama, Japan, 29 June–3 July 2009.
  56. Wan, Z.; Dozier, J. A Generalized split-window algorithm for retrieving land-surface temperature from space. IEEE Trans. Geosci. Remote Sens. 1996, 34, 892–905. [Google Scholar]
  57. Yao, Y.; Liang, S.; Cheng, J.; Liu, S.; Fisher, J.B.; Zhang, X.; Jia, K.; Zhao, X.; Qin, Q.; Zhao, B. MODIS-driven estimation of terrestrial latent heat flux in china based on a modified Priestley–Taylor algorithm. Agric. Meteorol. 2013, 171, 187–202. [Google Scholar] [CrossRef]
  58. Oke, T.R. Boundary Layer Climates, 2nd ed.; Routledge: London, UK, 1987. [Google Scholar]
  59. Reducing Urban Heat Islands: Compendium of Strategies Urban Heat Island Basics. Available online: https://www.epa.gov/sites/production/files/2014-06/documents/basicscompendium.pdf (accessed on 29 August 2016).
  60. Su, Y.; Foody, G.M.; Cheng, K. Spatial non-stationarity in the relationships between land cover and surface temperature in an urban heat island and its impacts on thermally sensitive populations. Landsc. Urban Plan. 2012, 107, 172–180. [Google Scholar] [CrossRef]
  61. Chapman, L.; Azevedo, J.A.; Prieto-Lopez, T. Urban heat & critical infrastructure networks: A viewpoint. Urban Clim. 2013, 3, 7–12. [Google Scholar]
  62. Steeneveld, G.; Koopmans, S.; Heusinkveld, B.; Theeuwes, N. Refreshing the role of open water surfaces on mitigating the maximum urban heat island effect. Landsc. Urban Plan. 2014, 121, 92–96. [Google Scholar] [CrossRef]
  63. Cheval, S.; Dumitrescu, A.; Bell, A. The urban heat island of Bucharest during the extreme high temperatures of July 2007. Theor. Appl. Climatol. 2009, 97, 391–401. [Google Scholar] [CrossRef]
  64. Bornstein, R.D. Observations of the urban heat island effect in New York City. J. Appl. Meteorol. 1968, 7, 575–582. [Google Scholar] [CrossRef]
  65. Oke, T.R. The energetic basis of the urban heat island. Meteorol. Soc. 1982, 108, 1–24. [Google Scholar] [CrossRef]
  66. Morris, C.; Simmonds, I. Associations between varying magnitudes of the urban heat island and the synoptic climatology in Melbourne, Australia. Int. J. Climatol. 2000, 20, 1931–1954. [Google Scholar] [CrossRef]
  67. Miao, S.; Chen, F.; LeMone, M.A.; Tewari, M.; Li, Q.; Wang, Y. An observational and modeling study of characteristics of urban heat island and boundary layer structures in Beijing. J. Appl. Meteorol. Climatol. 2009, 48, 484–501. [Google Scholar] [CrossRef]
  68. Li, Y.; Zhang, H.; Kainz, W. Monitoring patterns of urban heat islands of the fast-growing Shanghai metropolis, China: Using time-series of Landsat TM/ETM data. Int. J. Appl. Earth Obs. Geoinf. 2012, 19, 127–138. [Google Scholar] [CrossRef]
  69. Tan, J.; Zheng, Y.; Tang, X.; Guo, C.; Li, L.; Song, G.; Zhen, X.; Yuan, D.; Kalkstein, A.J.; Li, F. The urban heat island and its impact on heat waves and human health in Shanghai. Int. J. Biometeorol. 2010, 54, 75–84. [Google Scholar] [CrossRef] [PubMed]
  70. Schultz, P.; Halpert, M. Global analysis of the relationships among a vegetation index, precipitation and land surface temperature. Remote Sens. 1995, 16, 2755–2777. [Google Scholar] [CrossRef]
  71. Souch, C.; Grimmond, S. Applied climatology: Urban climate. Prog. Phys. Geogr. 2006, 30, 270–279. [Google Scholar] [CrossRef]
  72. Fadhil, A.M. Drought mapping using geoinformation technology for some sites in the Iraqi Kurdistan region. Int. J. Digit. Earth 2011, 4, 239–257. [Google Scholar] [CrossRef]
Figure 1. Map of Iraq, the Kurdistan Region and true colour Landsat image of the study area. (a) Iraq’s map; (b) Kurdistan Regional Government; (c) the study area.
Climate 04 00042 g001
Figure 2. Average Land Surface Temperature of the city and the rural areas from MODIS Aqua and Terra for both day and night-time passes over 12 years, from 2003 to 2014. (a) 11:00; (b) 13:00; (c) 22:00; (d) 2:00.
Climate 04 00042 g002
Figure 3. Diurnal variation of average 2014 Land Surface Temperature and Surface Urban Cool Island/Surface Urban Heat Island during the day and night.
Climate 04 00042 g003
Figure 4. Diurnal variation of average Land Surface Temperature in different seasons over 12 years from Aqua and Terra MODIS and Surface Urban Cool Island/Surface Urban Heat Island.
Climate 04 00042 g004
Figure 5. Seasonal variation of average Land Surface Temperature over 12 years, based on MODIS Aqua, the green line is the boundary of Erbil city.
Climate 04 00042 g005
Figure 6. Relationship of Land Surface Temperature with NDVI, fsm and NMDI, from MODIS data.
Climate 04 00042 g006
Figure 7. Land Surface Temperature vs. Seasonal NDVI, from 12 years MODIS data.
Climate 04 00042 g007
Table 1. A summary of published studies of Urban Heat Island Intensity (UHII)/Urban Cool Island Intensity (UCII) around the world.
Study AreaClimateReference StudyApproachUHII/UCII °C
Łódź, Poland 2,Cfb: Marine West CoastKlysik and Fortuniak [32]Weather station data12
Hong Kong, China 2,Cfa: Humid SubtropicalMemon et al. [33]Weather station data10.5
Manchester, UK 2,Cfb: Marine West CoastKnight et al. [34]Modeling10
London, UK 2,Cfb: Marine West CoastKolokotroni and Giridharan [35]Weather station data8.6
Tokyo, Japan 1,Cfa: Humid SubtropicalSaitoh et al. [36]Modeling8
Vancouver, Canada 1,Csb: Warm-summer MediterraneanRoth et al. [37]Satellite data7.5
Singapore 2,Af: Tropical RainforestChow and Roth [38]Weather station data7.1
Birmingham, UK 1,Cfb: Marine West CoastTomlinson et al. [39]Satellite data5
Athens, Greece 1,Csa: Dry-summer SubtropicalStathopoulou and Cartalis [40]Satellite data3.3
Granada, Nicaragua 2,*Aw: Tropical SavannaMontavez et al. [41]Weather station data−2.0
Okayama, Japan 2,*Cfa: Humid SubtropicalShigeta et al. [3]Weather station data–2.0
Erbil, Iraq 1,*BSh: Subtropical Semiarid (Hot Steppe)Rasul et al. [20]Satellite data−3.9
Tehran, Iran 1,*BSk: Subtropical Semiarid
(Cold Steppe)
Haashemi et al. [42]Satellite data−4
Dubai, UAE 1,*Bwh: Subtropical DesertFrey et al. [43]Satellite data−5
Abu Dhabi 1,*Bwh: Subtropical DesertLazzarini et al. [18]Satellite data−6
1 Surface-temperature based; 2 Air-temperature based; * UCII; ▫ UHII.
Table 2. Summary of MODIS image products used in this study.
DatasetResolution (m)Product
MOD11A21000LST
MYD11A21000LST
MOD13Q1250NDVI
MOD09GA1000Bands 1–7
Table 3. Diurnal variation of average Land Surface Temperature and ∆ LST in different seasons over 12 years from Aqua and Terra MODIS.
SeasonTimeMean LST °C CitySD °CMean LST °C RuralSD °C∆ LST °C
Autumn11:0033.51.3836.451.16–2.95
13:0032.21.7334.590.94–2.39
22:0012.151.189.690.692.46
02:0010.561.298.2512.31
Winter11:0015.620.4616.610.64–1
13:0020.410.8321.180.83–0.77
22:005.11.112.90.482.21
02:003.111.021.250.591.87
Spring11:0035.11.4336.580.97–1.47
13:0039.440.4839.490.8–0.05
22:0018.931.3716.110.722.82
02:0016.581.4313.990.972.59
Summer11:0046.981.4349.761.3–2.78
13:0050.361.3552.841.01–2.48
22:0028.411.2725.3613.05
02:0025.711.5122.731.192.98
Table 4. Min, max and mean of NDVI, NMDI and fsm of Erbil city and rural area of 12 years from MODIS data.
ParameterMin (City)Max (City)Mean (City)SDMin (Rural)Max (Rural)Mean (Rural)SD
NDVI0.10.370.160.050.110.570.220.11
NMDI0.610.760.690.030.000.720.600.12
fsm0.180.770.350.110.120.820.270.11

