
Initiatives towards Carbon Neutrality in the Helsinki Metropolitan Area


Department of Environmental Sciences, University of Helsinki, P.O. Box 65, Viikinkaari 1, 00014 Helsinki, Finland
*
Author to whom correspondence should be addressed.
Climate 2016, 4(3), 36; https://doi.org/10.3390/cli4030036
Submission received: 5 April 2016
/
Revised: 14 June 2016
/
Accepted: 6 July 2016
/
Published: 18 July 2016
(This article belongs to the Special Issue Measuring the Impact of Public-Private Governance for Climate Change)
Abstract
:Carbon neutrality represents one climate strategy adopted by many cities, including the city of Helsinki and the Helsinki metropolitan area in Finland. This study examines initiatives adopted by the Helsinki metropolitan area aimed at reducing energy-related carbon emissions and achieving carbon neutrality through future actions. Various sectorial energy consumption rates per year and carbon emissions from various sectors within the city of Helsinki and the metropolitan area were extracted from an online database and re-calculated (in GWh, MWh/inhabitant and MtCO2e, KtCO2e/inhabitant). We employed a backcasting scenario method to explore the various carbon reduction measures in the Helsinki metropolitan area. About 96% of the emissions produced in the Helsinki metropolitan area are energy-based. District heating represents the primary source of emissions, followed by transportation and electricity consumption, respectively. We also found that accomplishing the carbon reduction strategies of the Helsinki metropolitan area by 2050 remains challenging. Technological advancement for clean and renewable energy sources, smart policies and raising awareness resulting in behavioral changes greatly affect carbon reduction actions. Thus, strong political commitments are also required to formulate and implement stringent climate actions.
1. Introduction
The global climate has transformed, and the consequent causes of climate change have been observed in recent decades [1]. The average temperature increase in Finland has reached more than 2 degrees Celsius (2.3 ± 0.3 °C) over the last 166 years, almost twice as high as the global temperature increase (0.74 °C /100 years) [2]. This rising temperature has affected weather patterns in the Arctic region, and reducing this rising temperature is vital. Recent concerns and practices around the world stand as solid benchmarks to mitigate climate change but require much work to approach our climate goals. Countries and cities have initiated their own climate actions aimed at achieving various strategic goals. Finland has also adopted its ambitious goals to cut carbon dioxide (CO2) emissions together with other member states in the European Union (EU). Local governments, such as cities, play a key role in developing and implementing policies to mitigate and adapt to climate change [3]. However, cities also stand at the center of economic and political activities necessary to make progress in climate policy discussions [4]. Cities in the Arctic region appear motivated to address this problem. Helsinki, the capital city of Finland, is one city in this region initiating its own carbon neutral practices and aims to become carbon neutral by 2050. Carbon neutrality is one of the climate strategies of many other cities in the EU, including the cities of Copenhagen, Stockholm and Oslo in the Nordic area [5,6]. However, such strategies are challenging to accomplish because entire energy systems must be retrofitted and developed with new objectives aimed at clean energy and climate goals.
The Helsinki Region Environmental Services Authority (HSY) is a municipal body in the Helsinki metropolitan area aimed at making the metropolitan area carbon neutral by 2050 [7]. The Helsinki metropolitan area includes four cities: Helsinki, Espoo, Vantaa and Kauniainen. In 2007, all four cities formulated a joint climate strategy to achieve by 2030 that includes 120 measures related to green energy consumption and energy improvement measures to reduce carbon emissions and energy consumption [7,8]. Thus far, Helsinki is the only city that has actually ratified this joint strategy [9]. However, the CO2 emissions reduction strategies envisioned by HSY and established by the city of Helsinki appear challenging to materialize within the set timeline because of political changes, the economic turmoil in the country and the slow development of carbon reduction actions. The climate mitigation targets of the city of Helsinki are stricter than those in the strategy for the entire Helsinki metropolitan area. The city of Helsinki aimed to reduce carbon emissions by 30% by 2020 and intends to be carbon neutral by 2050 [10]. It also aims to achieve a 20% energy efficiency improvement by 2020 compared to 2005, and to increase the share of renewable energy sources to least 20% by 2020 [10]. The city of Vantaa has committed to an 80% total carbon reduction by 2050, but the cities of Espoo and Kauniainen did not define such targets [11]. The targets set for total emissions reduction in the Helsinki metropolitan area by HSY stand at 20% by 2020 and a 39% reduction per capita by 2030 [12]. Baseline measurements for all targets for all cities were taken from 1990.
This paper analyses carbon reduction activities aimed at climate mitigation in the city of Helsinki now and in the future, but also investigates similar activities in the Helsinki metropolitan area. To do so, we use a backcasting scenario of the strategic energy–associated carbon neutral actions in the city of Helsinki and the metropolitan area reflecting both past and present carbon emissions. In our analysis, we assess past energy emissions in the Helsinki metropolitan area cities from 1990 to 2014 and emissions targets for 2020, 2030 and 2050 focusing on critical decisions and actions necessary in current climate strategies. We also provide insights into the possibilities for future actions towards carbon neutrality in the Helsinki metropolitan area. Such climate actions also serve as models for other cities around the world. Through this study, local governments and city authorities can review their climate change mitigation and carbon reduction actions and develop new objectives.
2. Background: The Importance of Carbon Neutrality Actions in the Helsinki Metropolitan Area
Carbon neutral refers to balancing artificial carbon emissions by offsetting various emissions cutting actions and sustainable energy production methods [13]. Key carbon/greenhouse gases (GHG) include CO2, methane (CH4), nitrous oxide (N2O), hydrofluorocarbons (HFC), perfluorocarbons (PFC) and sulphur hexafluoride (SF6) [14]. CO2 is the primary carbon gas causing global warming because it has the highest potential surface warming capacity and remains in the atmosphere longer than any other greenhouse gas [1]. The primary greenhouse gases in the Helsinki metropolitan area in 2014 included CO2, N2O and CH4 [10]. Unlike many other countries and cities, the contribution of CH4 production is negligible in the Helsinki metropolitan area compared to other carbon emissions [15].
Various factors, such as the number of inhabitants, means of transport, energy production processes and consumer habits, determine the generation of emissions in a specific area. Helsinki covers a total area of 690 km2 (consisting of a land area of 190 km2 and 500 km2 of sea area) and the metropolitan area expands across 2370 km2 (770 km2 of land area and 1600 km2 of sea area) [16]. In 2015, the total population of the city of Helsinki reached 620,715, growing to 1,106,418 for the entire metropolitan area (Table 1). The mean temperature for this region is 6.6 °C [16].
Three major energy industries serve the Helsinki metropolitan area: Helen Ltd. (Helsinki energy), Vantaan Energia and Fortum Oy, which generate most of the heat, electricity and emissions in this region. Helen Ltd., the major power producer in the city of Helsinki, initiated several climate strategies aimed at reaching 20% renewable energy production by 2020 and becoming carbon neutral by 2050 [11]. The primary emitters in the transportation sectors consist of passenger cars, ships, boats and trucks [17]. Two large wastewater treatment plants (WWTPs)—Viikinmäki WWTP and Suomenoja WWTP—are situated in the Helsinki metropolitan area [18]. All biogas produced by Viikinmäki WWTP is utilized by the plant itself, while Suomenoja WWTP sells all of its biogas for commercial purposes for use in vehicles [19]. Several energy efficient construction and renovation projects related to voluntary building codes are underway in the city of Helsinki [17]. The Kalasatama ecotown project, an example of green construction using smart technologies to construct sustainable housing, recently broke ground. While the trends related to carbon reduction and neutrality in the Helsinki metropolitan area began in 2008 through 2010, the actual effects of the energy reduction were felt initially in 2011 [15].
Changes in the climatic patterns of the Helsinki region as well as Finland as a whole have been clearly observed through changes in the timing of snowfalls, drought and warmer winters, rainier summers, changes in Baltic Sea ice and a declining snow cover [20]. Finland took part in the Paris Climate Conference held in December 2015 in Paris, France, which resulted in an agreement to reduce global temperatures to well below 2 °C [21]. This agreement also implores the Finnish government as well as cities to act to reduce carbon emissions and to protect the climate. However, the development of clean and renewable energy systems and CO2 emissions reduction measures in other Nordic cities such as Oslo and Stockholm are more extensive compared to the cities in the Helsinki metropolitan area [22]. For instance, Copenhagen aimed to achieve carbon neutrality by 2025 and in 2011 achieved a 21% CO2 reduction from 2005 levels [23]. Furthermore, Copenhagen implemented climate strategies such as increasing the production of wind power inside and outside the city, establishing plants to convert waste to energy and encouraging businesses to use green technologies [23]. Similarly, the city of Stockholm adopted a strategy to become fossil fuel free by 2040 and to feature public transport that is fossil fuel free by 2025 [24]. Stockholm is implementing such strategies by constructing ecological city districts, retrofitting buildings using high-energy standards and establishing sustainable transport such as a metro system, a congestion charge and investments in clean vehicles and fuels [24]. Finally, the city of Oslo aims to be fossil fuel free by 2030 and to establish a fossil fuel free public transportation systems by 2020; it has already started banning fossil fuels and promoting biogas and electric vehicles in the transportation sector [25]. All of these developments challenge the Helsinki metropolitan area to reinforce its carbon neutral measures. Various environmental and climate institutions have also pressured the government, cities and energy industries to reduce carbon emissions.
3. Methods
We collected data on energy consumption and emissions production in the Helsinki metropolitan area from the City of Helsinki Environmental Center. Other data were collected from reports, research and news articles, as well as from discussions with authorities at the Helsinki Environmental Center, participating in seminars organized by the City of Helsinki and observing new technologies in the metropolitan area. We also conducted three interviews with experts in the climate field from the Helsinki area to understand current and future emissions reduction strategies and actions. We used these various sources in order to increase our level of understanding on the emissions-related strategies designed for climate actions. Detailed information about how data were collected appears in Table 1.
Energy and emissions data from 1990 to 2014 were sorted into five-year intervals for our detailed analysis. Sectorial energy consumption levels and carbon emissions from various sectors within the city of Helsinki and the entire metropolitan area were extracted from an online database, re-calculated (in GWh, MWh/inhabitant and MtCO2e, KtCO2e/inhabitant) and the results are presented. We analyzed city-specific per capita energy consumption levels and emissions data focusing on district heating (DH) emissions. The terms “carbon emissions” and “carbon reductions” used in this article refer to the emissions and reductions of all greenhouse gases measured in CO2 equivalents. CO2 equivalent calculations are based on national emissions factors.
We employed a backcasting scenario method to analyze the various carbon reduction measures in the Helsinki metropolitan area. The backcasting scenario is defined as an archetypal image of the future, created using mental maps or models that reflect various perspectives on past, present and future developments [26]. As a strategic problem-solving framework, it allows us to determine how we can reach specified outcomes in the future [27]. Similarly, the World Health Organization (WHO) has defined the backcasting scenario as “[m]oving step-wise back in time from a future scenario to the present in order to identify the decisions and actions that must be taken at critical points if the scenario is to be achieved” [27]. The city of Helsinki has set a strategy for the future scenario (to become carbon neutral by 2050), which the metropolitan area has also adopted. The backcasting scenario method helps us to analyze how the city of Helsinki and the metropolitan area can become carbon neutral by 2050 by considering past (from 1990), current and future (2050) situations related to climate actions and strategies for energy consumption levels and carbon emissions.
We noted energy consumption and carbon emissions trends from 1990 to 2014 and analyzed carbon reduction activities, initiatives and progress towards future goals. In addition to studying current activities and strategies aimed at future goals, several possible actions and plans to address climate goals were analyzed according to the information gathered from various sources (Table 1) and our own understandings. The backcasting scenario method used to analyze carbon emissions and carbon reduction actions were underlined through three different topics: (a) carbon reduction projections and demographic change; (b) current scenarios and monitoring trends in energy consumption and emissions; and (c) future scenarios and possibilities for reducing emissions.
4. Results
4.1. Carbon Reduction Projections and Demographic Change
The trends related to demographic change and carbon reduction projections provide information about whether current activities aimed at reducing carbon emissions are possible.
Demographic change. The population composition represents one factor influencing carbon reduction goals. The carbon footprint of inhabitants is based on the number of people living in the area considered, the types of transportation modes used and the energy consumption habits of the inhabitants. Environmental awareness, economic and societal situations and technological perceptions among inhabitants also factor into carbon reductions. A growing population increases the consumption of energy and fuels and produces further greenhouse gas emissions.
The populations of both the city of Helsinki and the entire metropolitan area grew since 1990 and will continue to do so until 2050 (Table 2). It is estimated that the population of the city of Helsinki will reach 758,236 by 2050, while the metropolitan area’s population will reach 1,361,938 by 2040 (Table 2) [15]. This increasing population will certainly consume further resources, including energy and fuels, and generate additional carbon emissions. This means that the government’s policies to increase resource efficiency and tackle a growing population at the present level are important considerations.
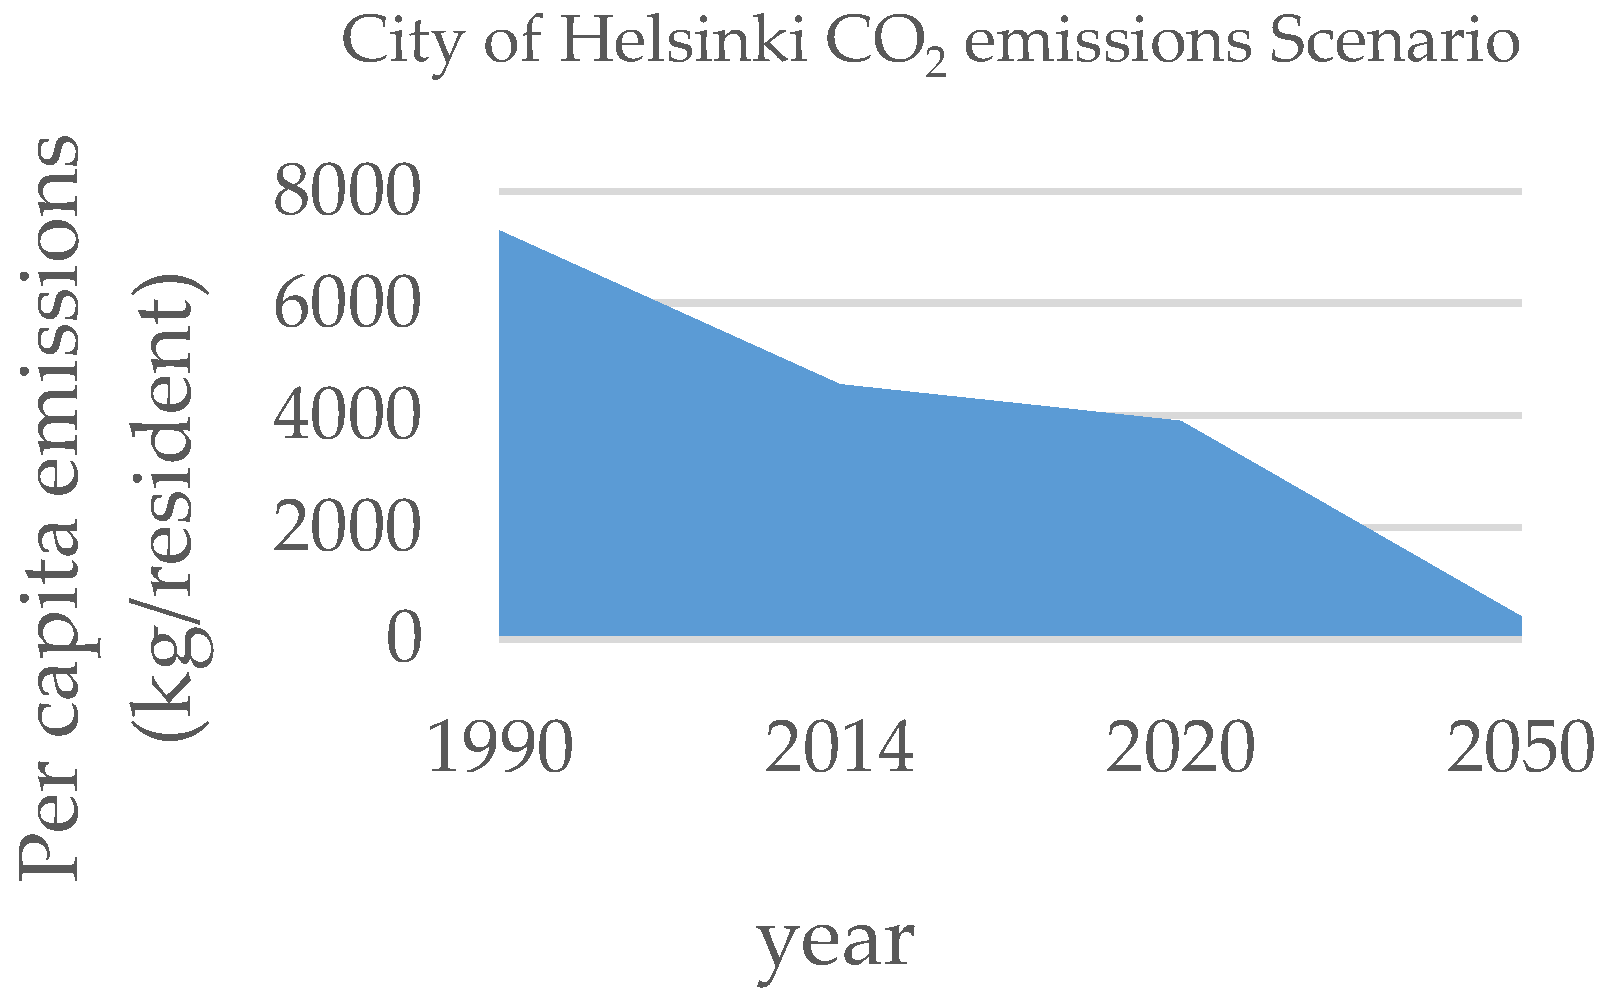
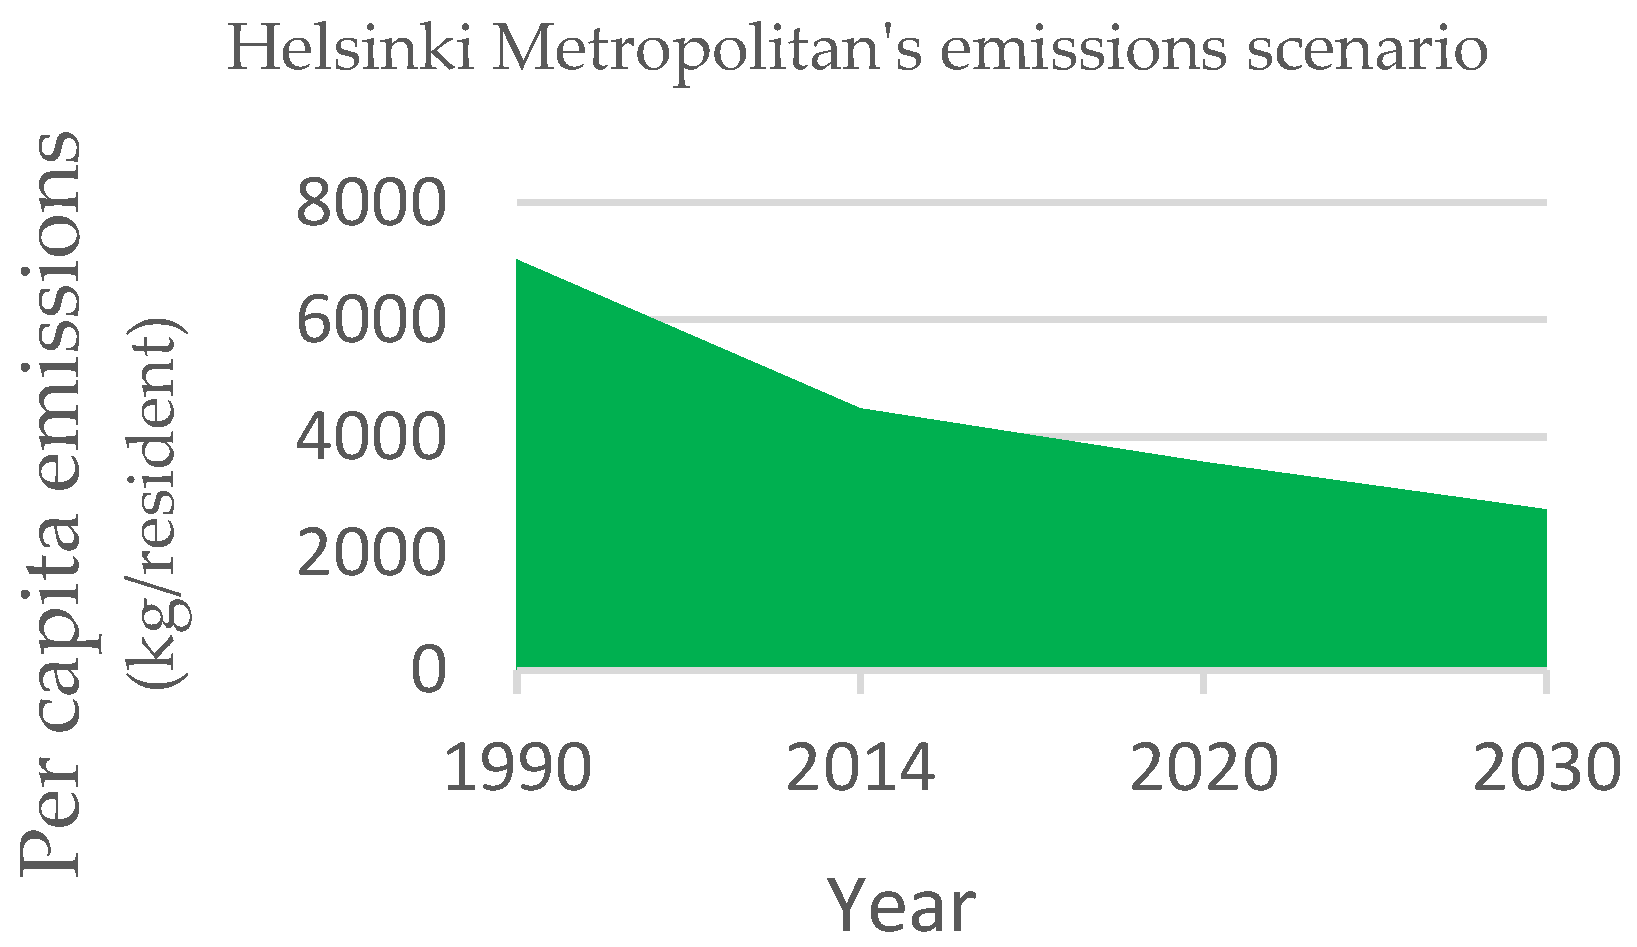
Carbon reduction projections. Current scenarios show that the carbon reduction goals for the city of Helsinki can be realized only if carbon reduction activities materialize faster than they currently are, while reaching the goals of the metropolitan area appears implausible. The actual projection for per capita carbon reductions for the city of Helsinki stands at 94%, with the total emissions set to reach 92% by 2050 [29]. The city of Helsinki reduced per capita carbon emissions to 38.6% as of 2014, decreasing the carbon burden to 4553 kg/resident from the 1990 level of 7300 kg/resident (Figure 1). Total emissions have decreased by 22.8% from 3.6 million kg CO2 to 2.8 million kg CO2 during the same time period [29]. Similarly, the entire metropolitan area has achieved a 30% reduction in per capita carbon emissions from 7020 kg/resident in 1990 to 4480 kg/resident in 2014 (Figure 2), decreasing total emissions by 5.8% from 5.82 million kg CO2 to 5.48 million kg CO2 in the same period [29].
The city of Helsinki has further projected a per capita carbon emissions reduction to 3900 kg per resident (–47%) by 2020 and 400 kg/resident (94%) by 2050, with total emissions dropping to 2.52 million (–30%) by 2020 and 288,000 tons (–92%) by 2050 [29]. While HSY envisions reaching a carbon neutral Helsinki metropolitan area by 2050, it does not yet have descriptive reduction measures in place [29]. Clear targets for the metropolitan area only exist for total emissions reductions by 2020 and per capita carbon emissions reductions by 2030 (Table 3). This indicates that the carbon neutrality goals of the metropolitan area are weaker than those for the city of Helsinki. While the goals of the city of Helsinki are stronger, short-term strategies and intervals are missing except for a climate goal for the period 2013 to 2016 [7].
Per capita emissions for the city of Helsinki as well as the entire metropolitan area have decreased significantly, approaching the defined goals. However, the total emissions reductions for the metropolitan area remain far behind the target set for 2020—that is, total emissions decreased only 5.2% between 1990 and 2014 [15]. The city of Helsinki has reduced total emissions by three-fourths during the same period and reached 30% of the carbon reduction target to be reached by 2030, a goal it can reach if the carbon reduction rate increases at a slightly higher-than-current rate [15].
4.2. Current Scenarios and Monitoring Trends for Energy and Emissions
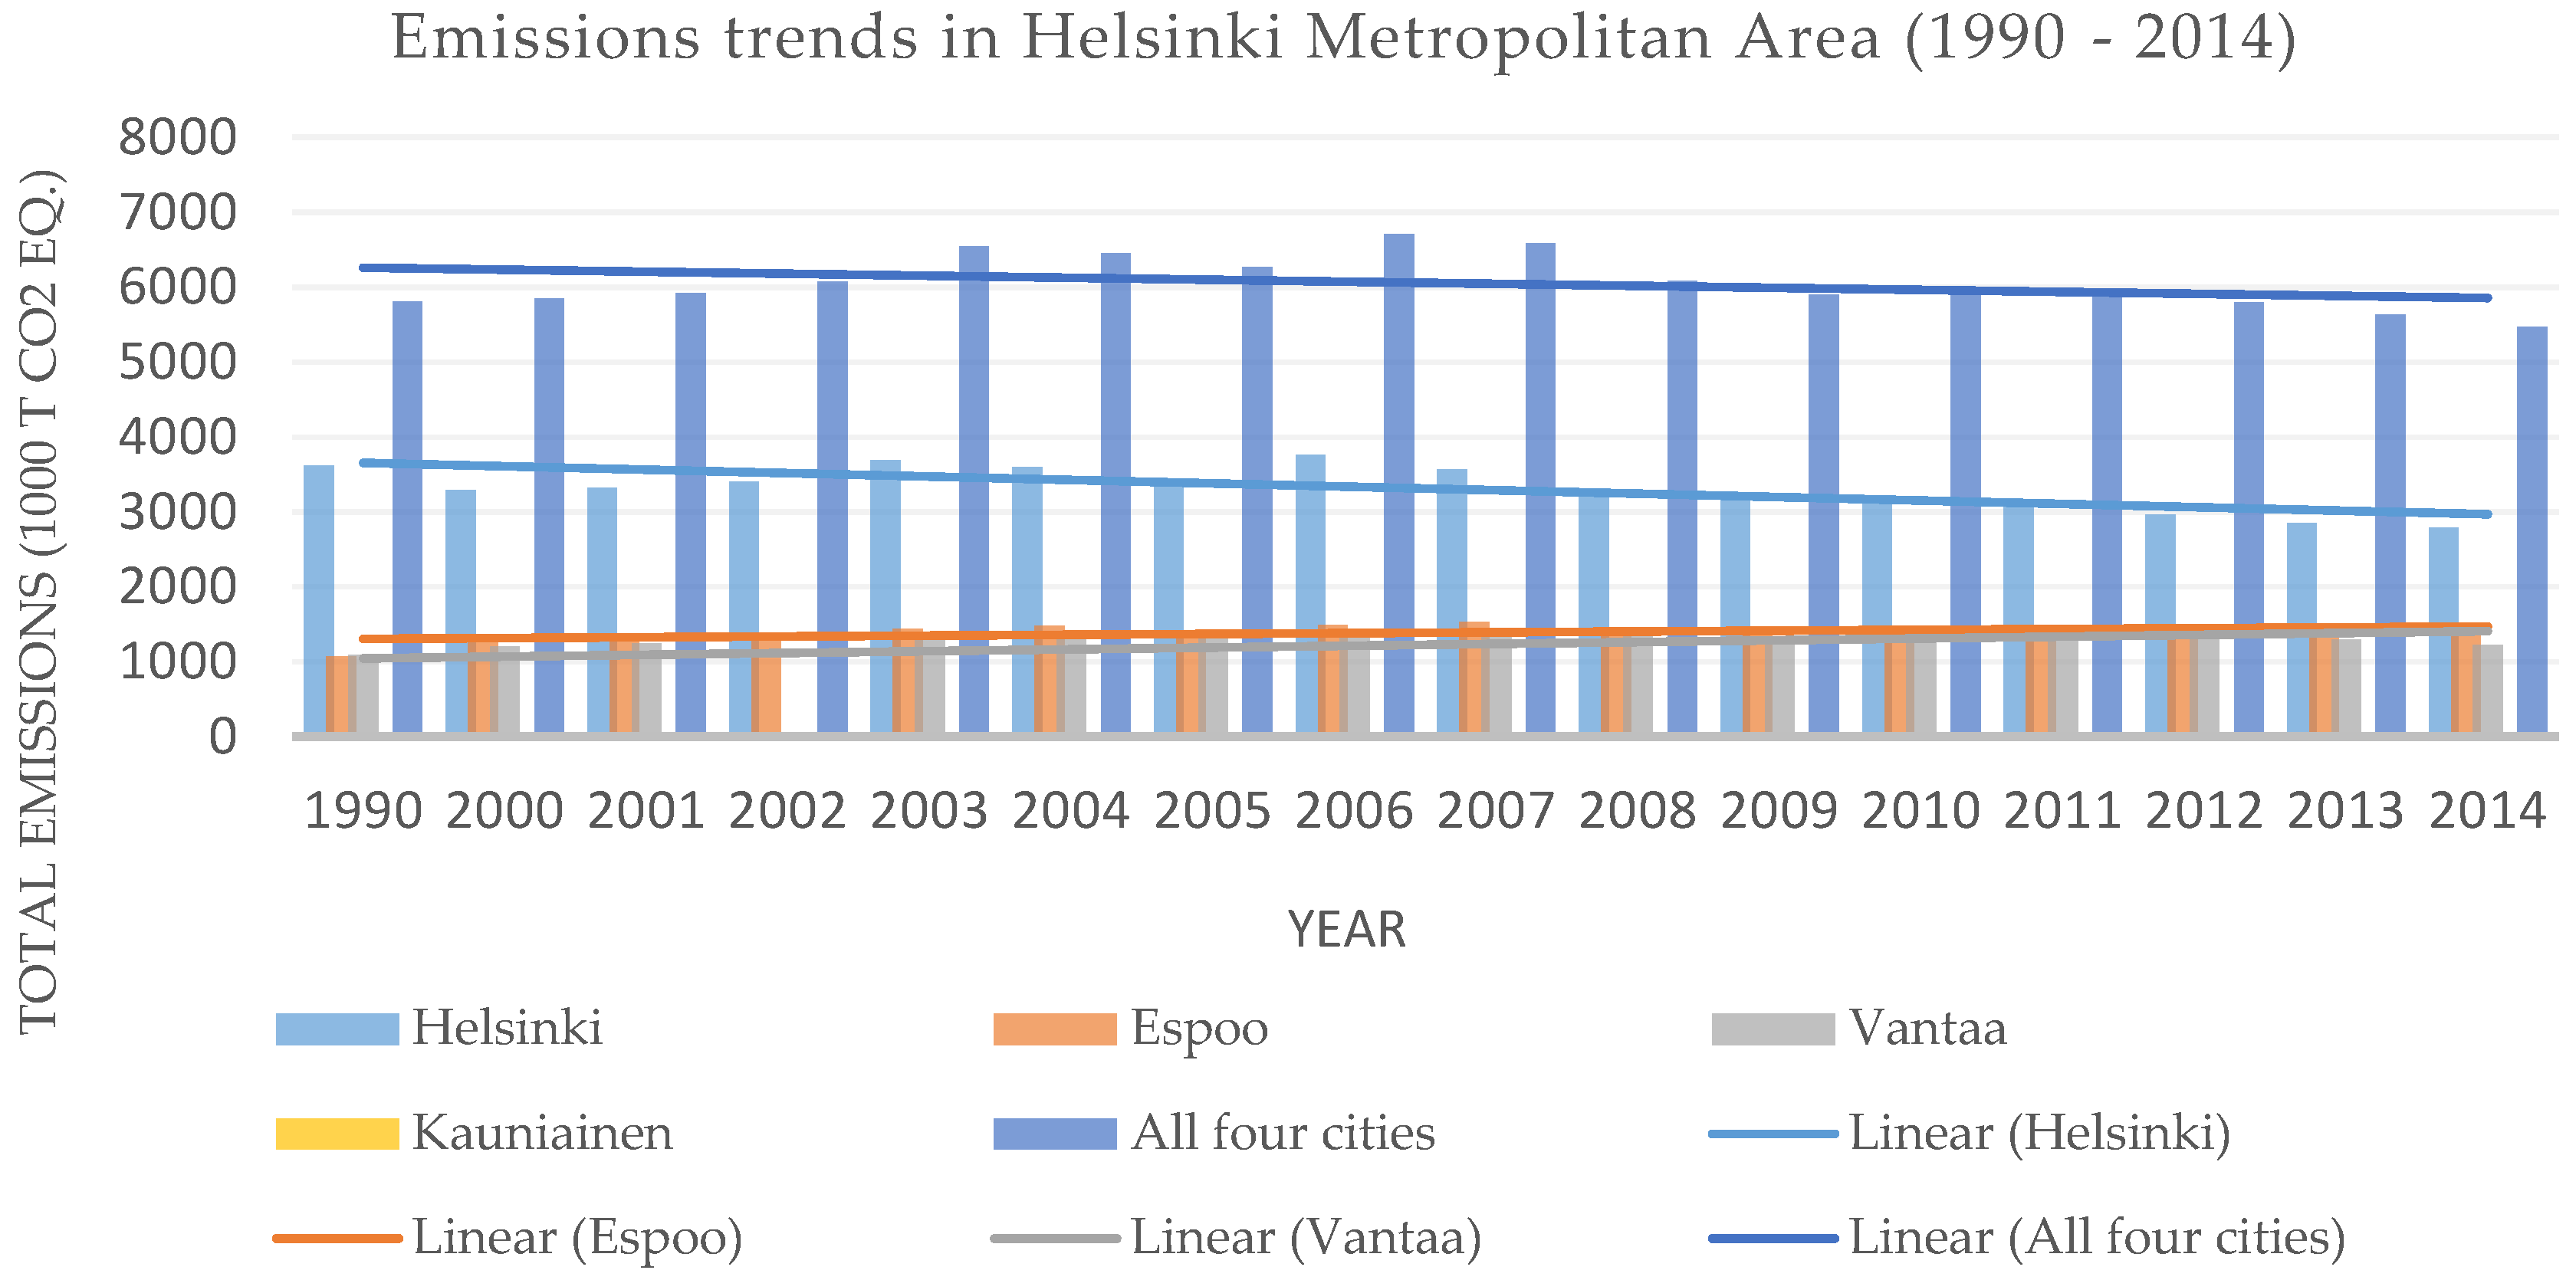
Carbon emissions reduction trends. While concerns about carbon reduction activities in Finland began some time ago, actual carbon reductions for the city of Helsinki only occurred after 2007 and since 2012 for the metropolitan area (Figure 3). Trends towards increasing total emissions in the metropolitan area remained linear from 1990 through 2010, while a trend towards carbon reductions in the city of Helsinki began in 2011 and in 2010 in the metropolitan area. Total emissions for the city of Helsinki in 2001 and 2010 remained constant while per capita emissions diminished.
Average total carbon emissions reduction rates for the city of Helsinki and the metropolitan area between 1990 and 2014 reached 0.93% and 0.22% per annum, respectively. If the reduction rate continues at this pace, the city of Helsinki will reach a total carbon reduction of 53.8% by 2050 and 12.7% by 2050 for the metropolitan area. However, the city of Helsinki per annum average per capita emissions reduction rate stands at 1.6%, which approaches a 96.5% per capita carbon reduction by 2050 if population growth and carbon emissions reduction activities continue at their current levels. The average per capita emissions reduction for the metropolitan area stands at 1.2% per annum, which approaches a 74% per capita emissions reduction by 2050 if the situation remains constant.
Alternatively, annual total carbon reduction in the city of Helsinki stands at 3.1% and 2.4% for the entire metropolitan area after implementation of the climate strategy in 2007. If this trend continues linearly, the city of Helsinki will become carbon neutral before 2050 and the metropolitan area will reduce total carbon emissions by up to 91.6% by 2050. Nonetheless, until now, this trend towards reduction seems possible due to the long-term investments related to carbon reduction activities and infrastructure. For instance, about a 3% reduction in carbon emissions in the metropolitan area in 2014 compared to 2013 was due primarily to the effects of a waste-to-energy power plant [30]. The establishment of this power plant took about four years (2011–2014) excluding the planning phase [11]. If the emissions reduction trends are viewed on a city level, Helsinki and Espoo have made satisfactory progress, while Kauniainen significantly regressed, and, since 2005, Vantaa regressed making progress only after 2008 (Figure 3). Considering the increasing population and the decreases in per capita emissions since 2007, total emissions are not declining sufficiently rapidly. To continue this linear growth in per capita carbon emissions reductions and to further improve total emissions reductions, implementing several strong climate actions are required.
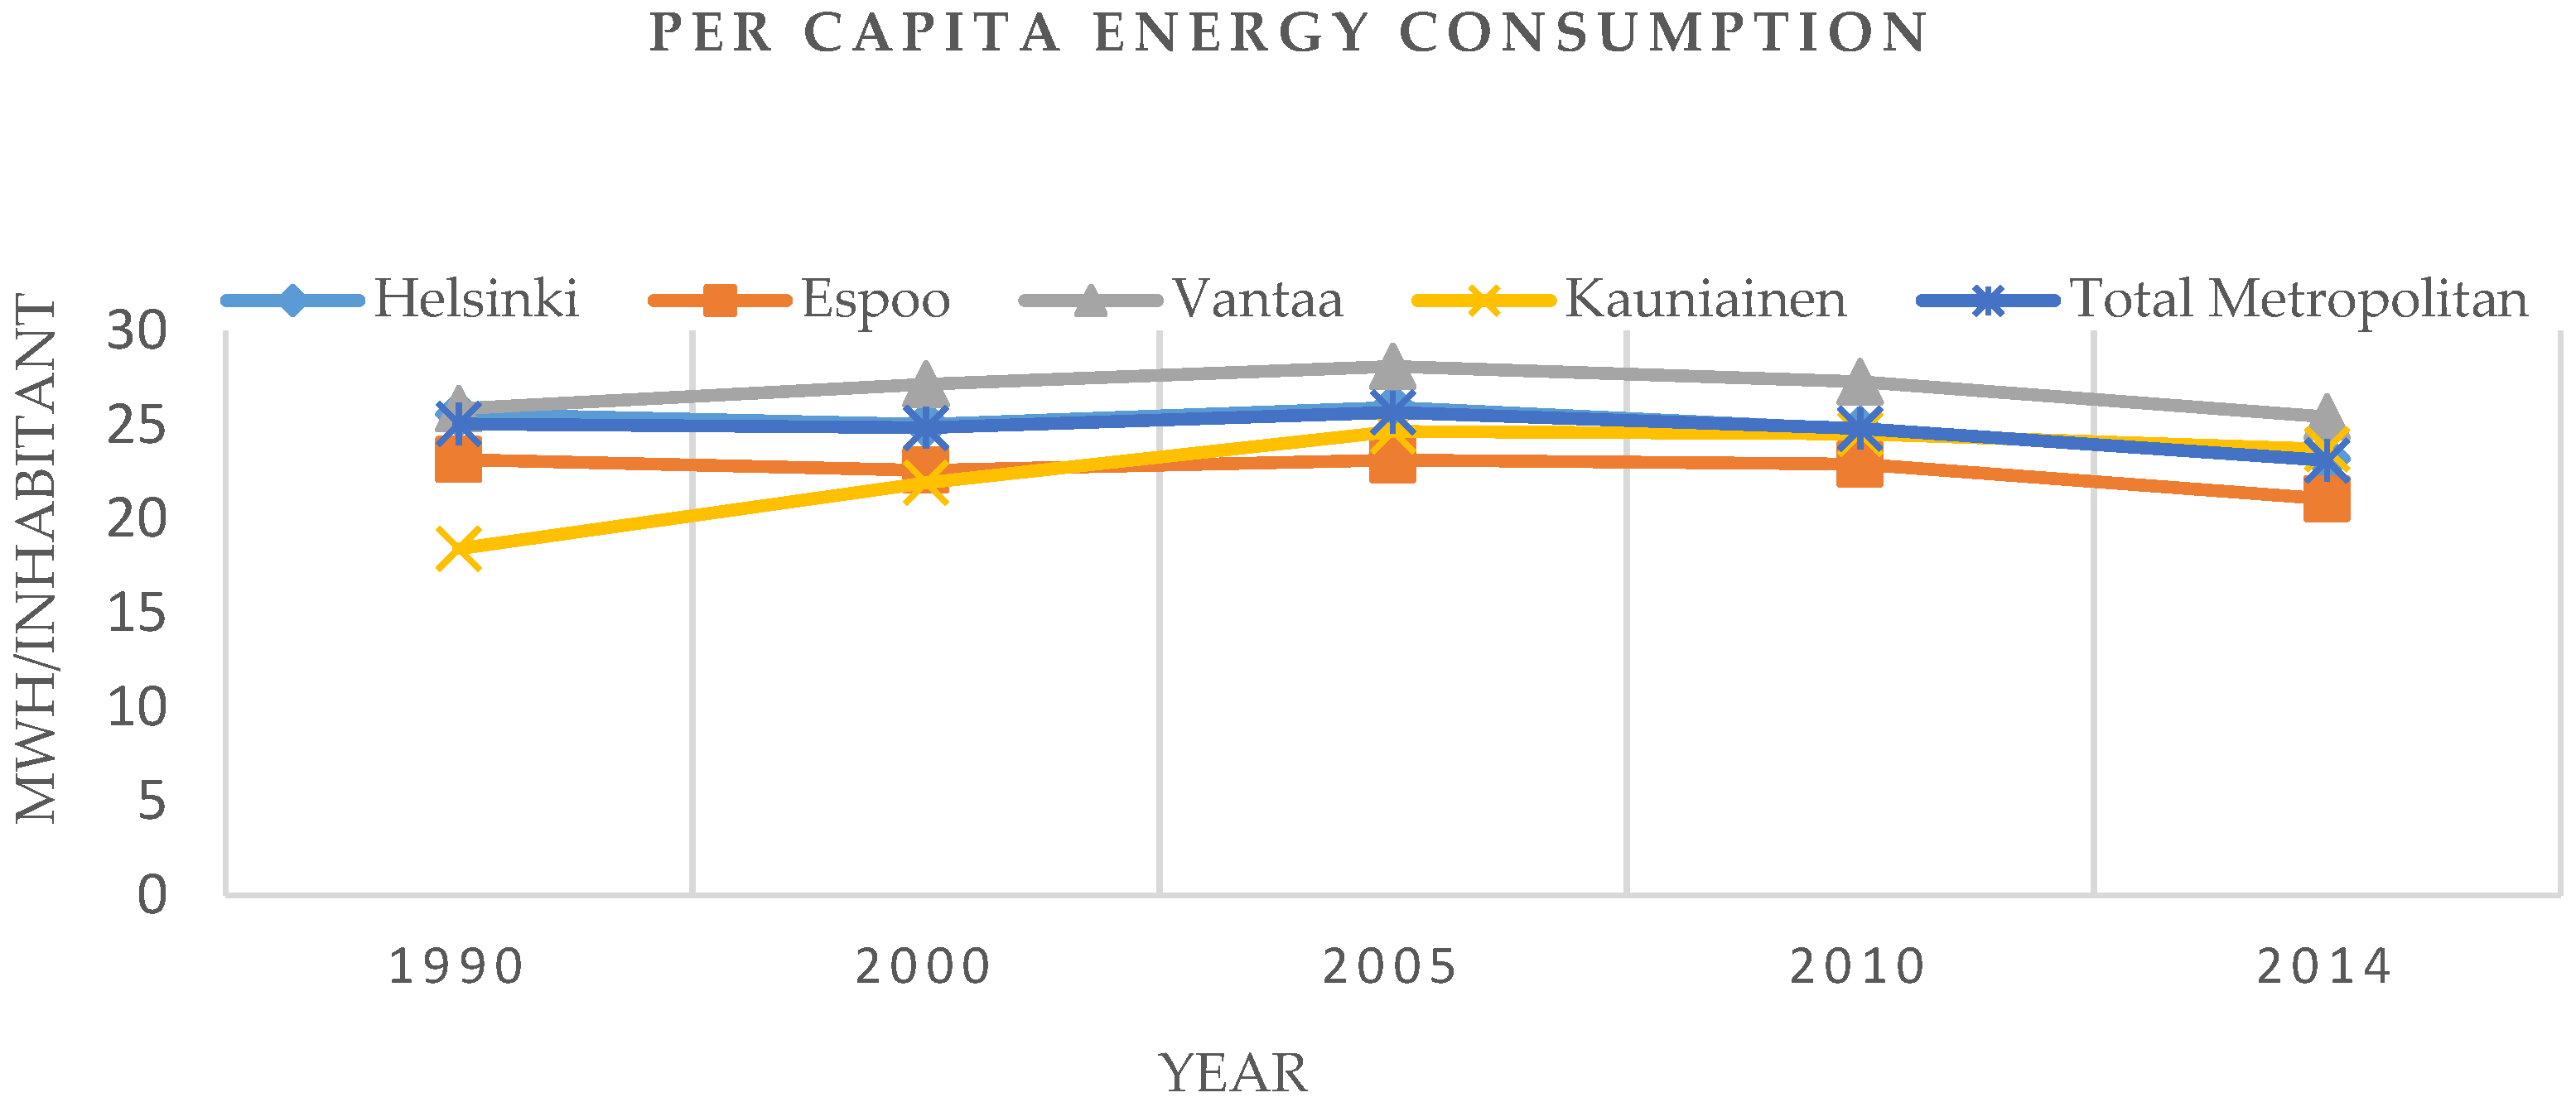
Energy consumption scenario. Energy consumption greatly affects emissions. The higher the energy consumption, the greater the amount of emissions, although emissions resulting from renewable energy sources remain lower than those from fossil fuel–based energy sources. Per capita energy consumption in the city of Helsinki has decreased since 2008, and since 2007 in the metropolitan area. Espoo’s energy consumption began to decline in 2011, while Vantaa’s energy consumption began to decline in 2007 (Figure 4). Kauniainen’s total energy consumption has been increasing, while per capita energy consumption has decreased since 2007 (Figure 4). The primary energy-consuming sectors both in the city of Helsinki and the metropolitan area consist of district heating, electricity use and passenger cars. In 2014 in Helsinki, 48% of the energy consumed by the city was for district heating, 28% for electricity consumption and 9% for passenger cars. For the metropolitan area, 43% of the energy consumed was for district heating, 27% for electricity consumption and 11% for passenger cars. These proportions suggest that major energy reforms are needed for the heating and transportation sectors.
Per capita energy consumption in the city of Helsinki decreased by 9% and by 8% in the metropolitan area between 1990 and 2014. Energy consumption related to industry and machinery decreased the most (by 79% in the city of Helsinki and by 75% in the metropolitan area) followed by the separate heating (by 34% and 35%, respectively). Similarly, energy consumption through passenger cars, other modes of transport and district heating also decreased during this period. However, energy consumption related to electric heating, shipping, trains and electricity consumption in general increased during this period, although the contributions from these sectors to total energy consumption were small. Energy consumption from each these sectors may have increased due to the construction of more railway, metro and tram lines and due to the increased use of electric heating systems in individual households. Similarly, the use of renewable energy sources compared to total energy production remained quite low. This suggests that industrial activities were either constrained or industrial energy consumption improved between 1990 and 2014. However, by considering future strategies related to climate goals (by 2030 and 2050), many opportunities exist related to improving these areas given current conditions.
Emissions scenario. The city of Helsinki generated 70% (in 1990) and 73% (in 2014) emissions from direct energy consumption and 18% (in 1990) and 23.2% (in 2014) emissions from the consumption of fuel related to transportation. Similarly, the metropolitan area generated 66% of its total emissions in 1990 and 72.2% in 2014 from direct energy consumption and 21.1% in 1990 and 24.1% in 2014 from transportation-related fuel consumption. This suggests that 96.2% of the emissions produced in the city of Helsinki and 96.3% of the emissions produced in the metropolitan area resulted from energy in 2014.
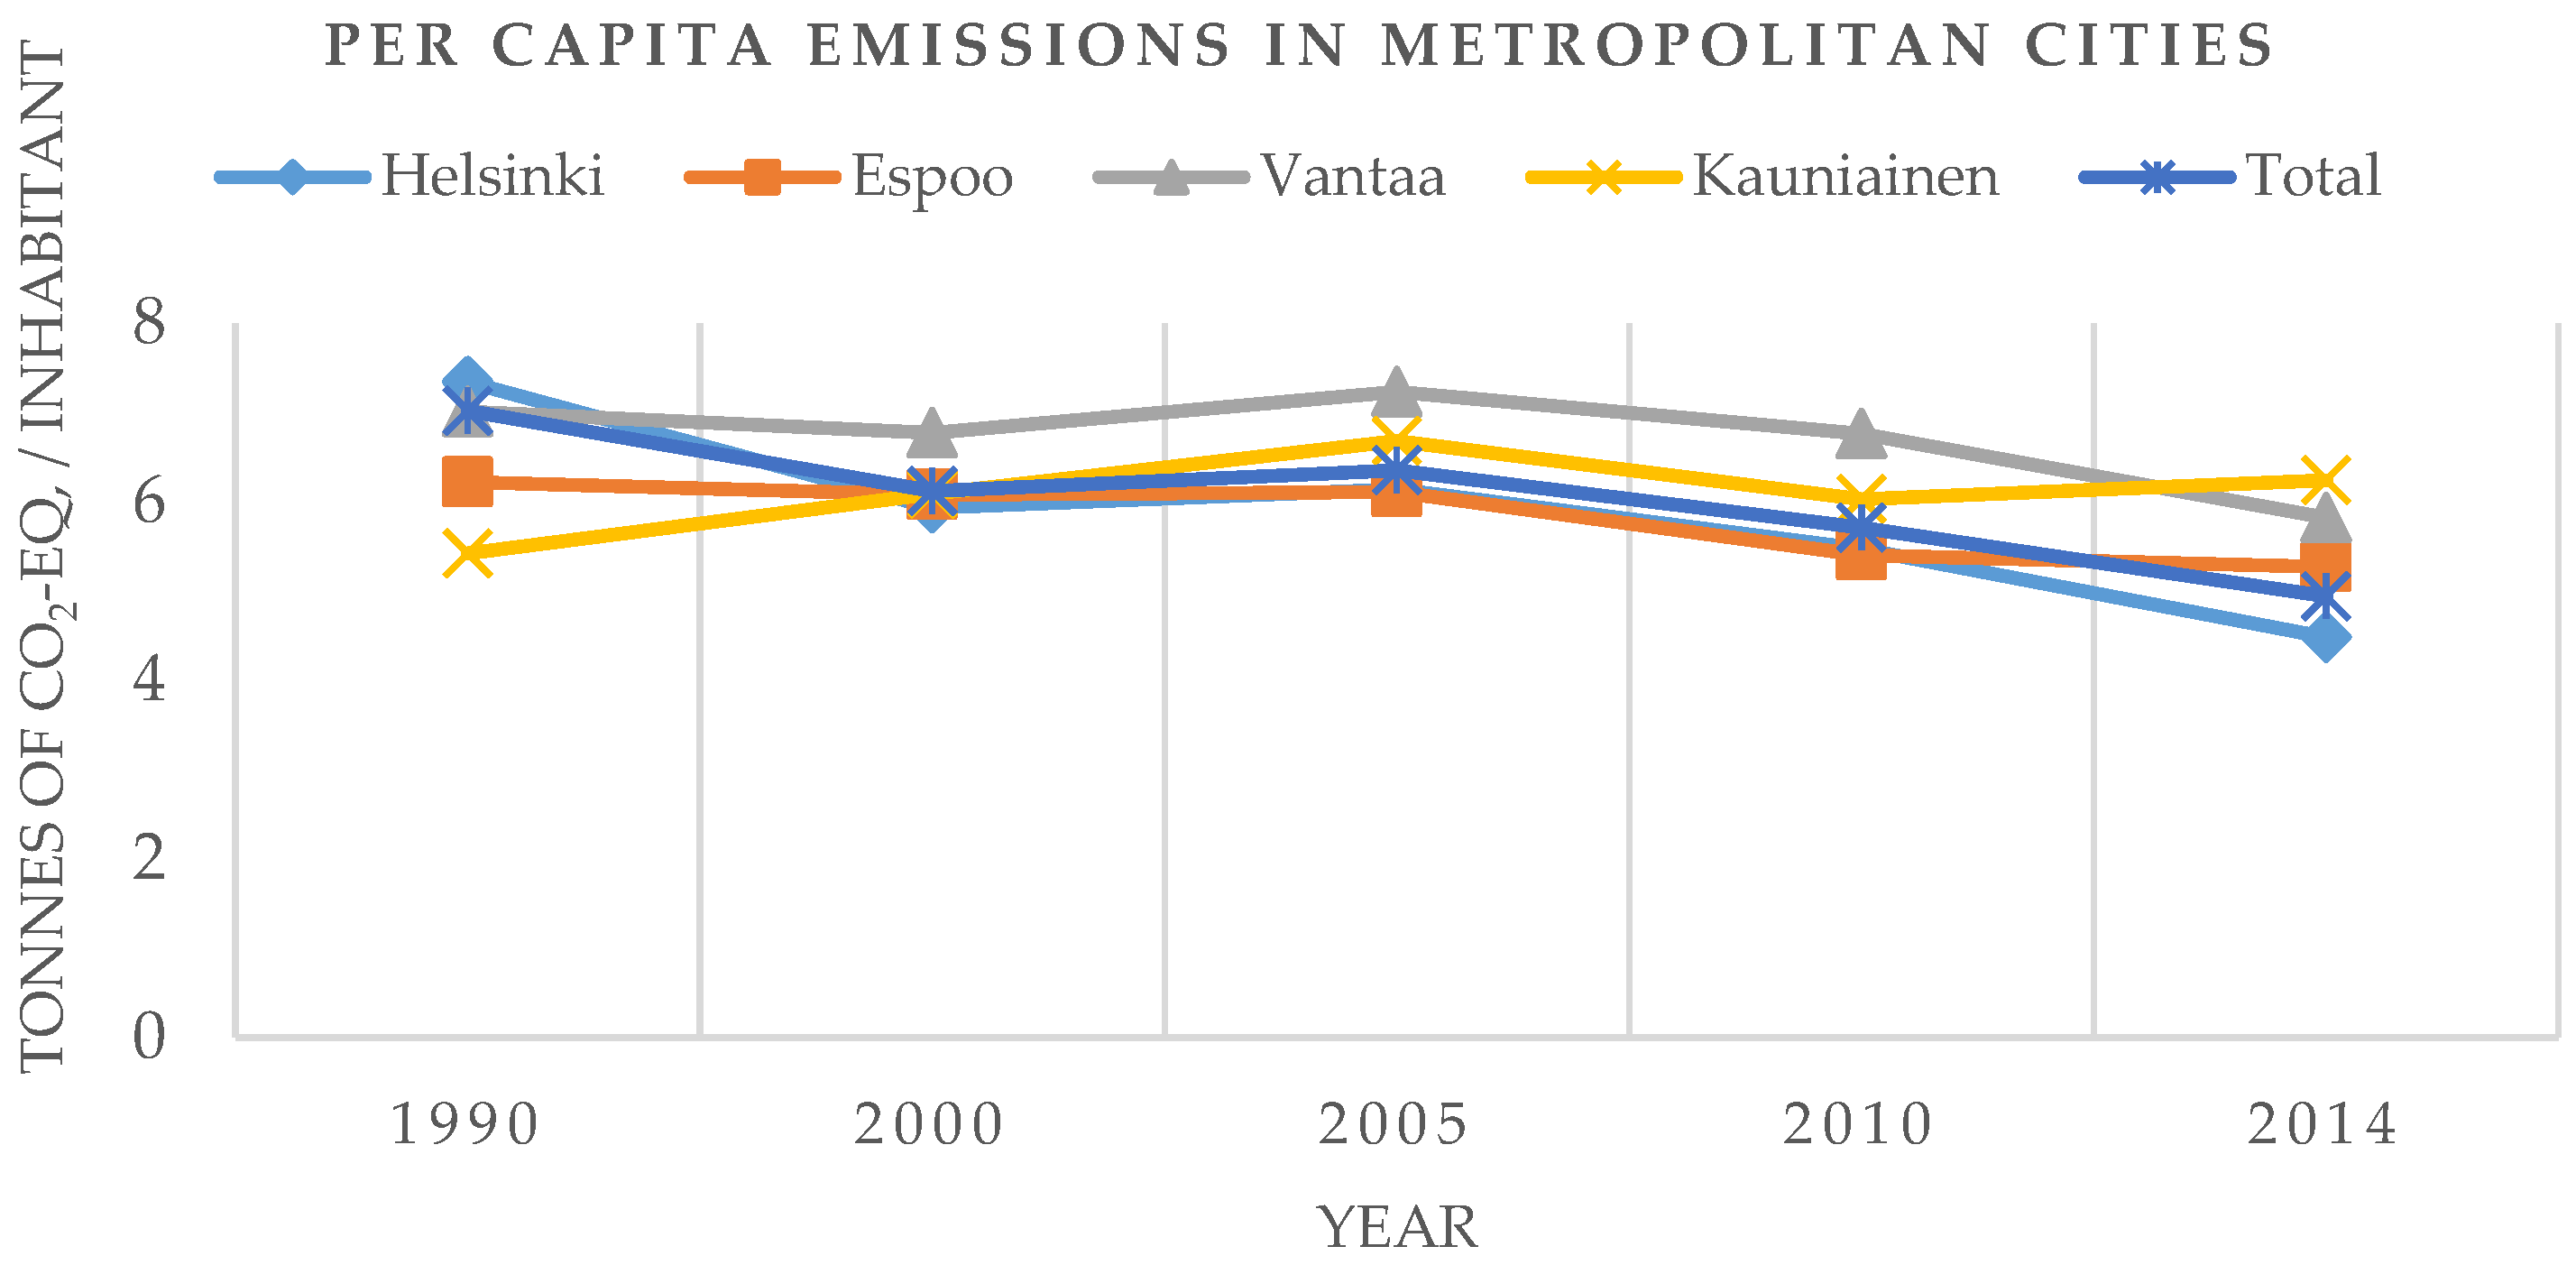
In the city of Helsinki in 2014, district heating generated 45% of carbon emissions, 25% resulted from transportation and 18% resulted from electricity consumption. Similarly, in the metropolitan area in 2014, district heating, transport and electricity consumption generated 42%, 25% and 16% of carbon emissions, respectively. Per capita carbon emissions in the city of Kauniainen were highest, followed by Vantaa and Espoo, with the city of Helsinki demonstrating the lowest per capita rates in 2014 (Figure 5). Per capita emissions for the cities of Kauniainen and Espoo increased for the period between 2010 and 2014, while the cities of Helsinki and Vantaa as well as the entire metropolitan area observed decreasing per capita emissions during that time (Figure 5). The proportional trends in emissions across all sectors are likely to remain constant for 2020 and 2030 since the emissions-reducing activities look similar.
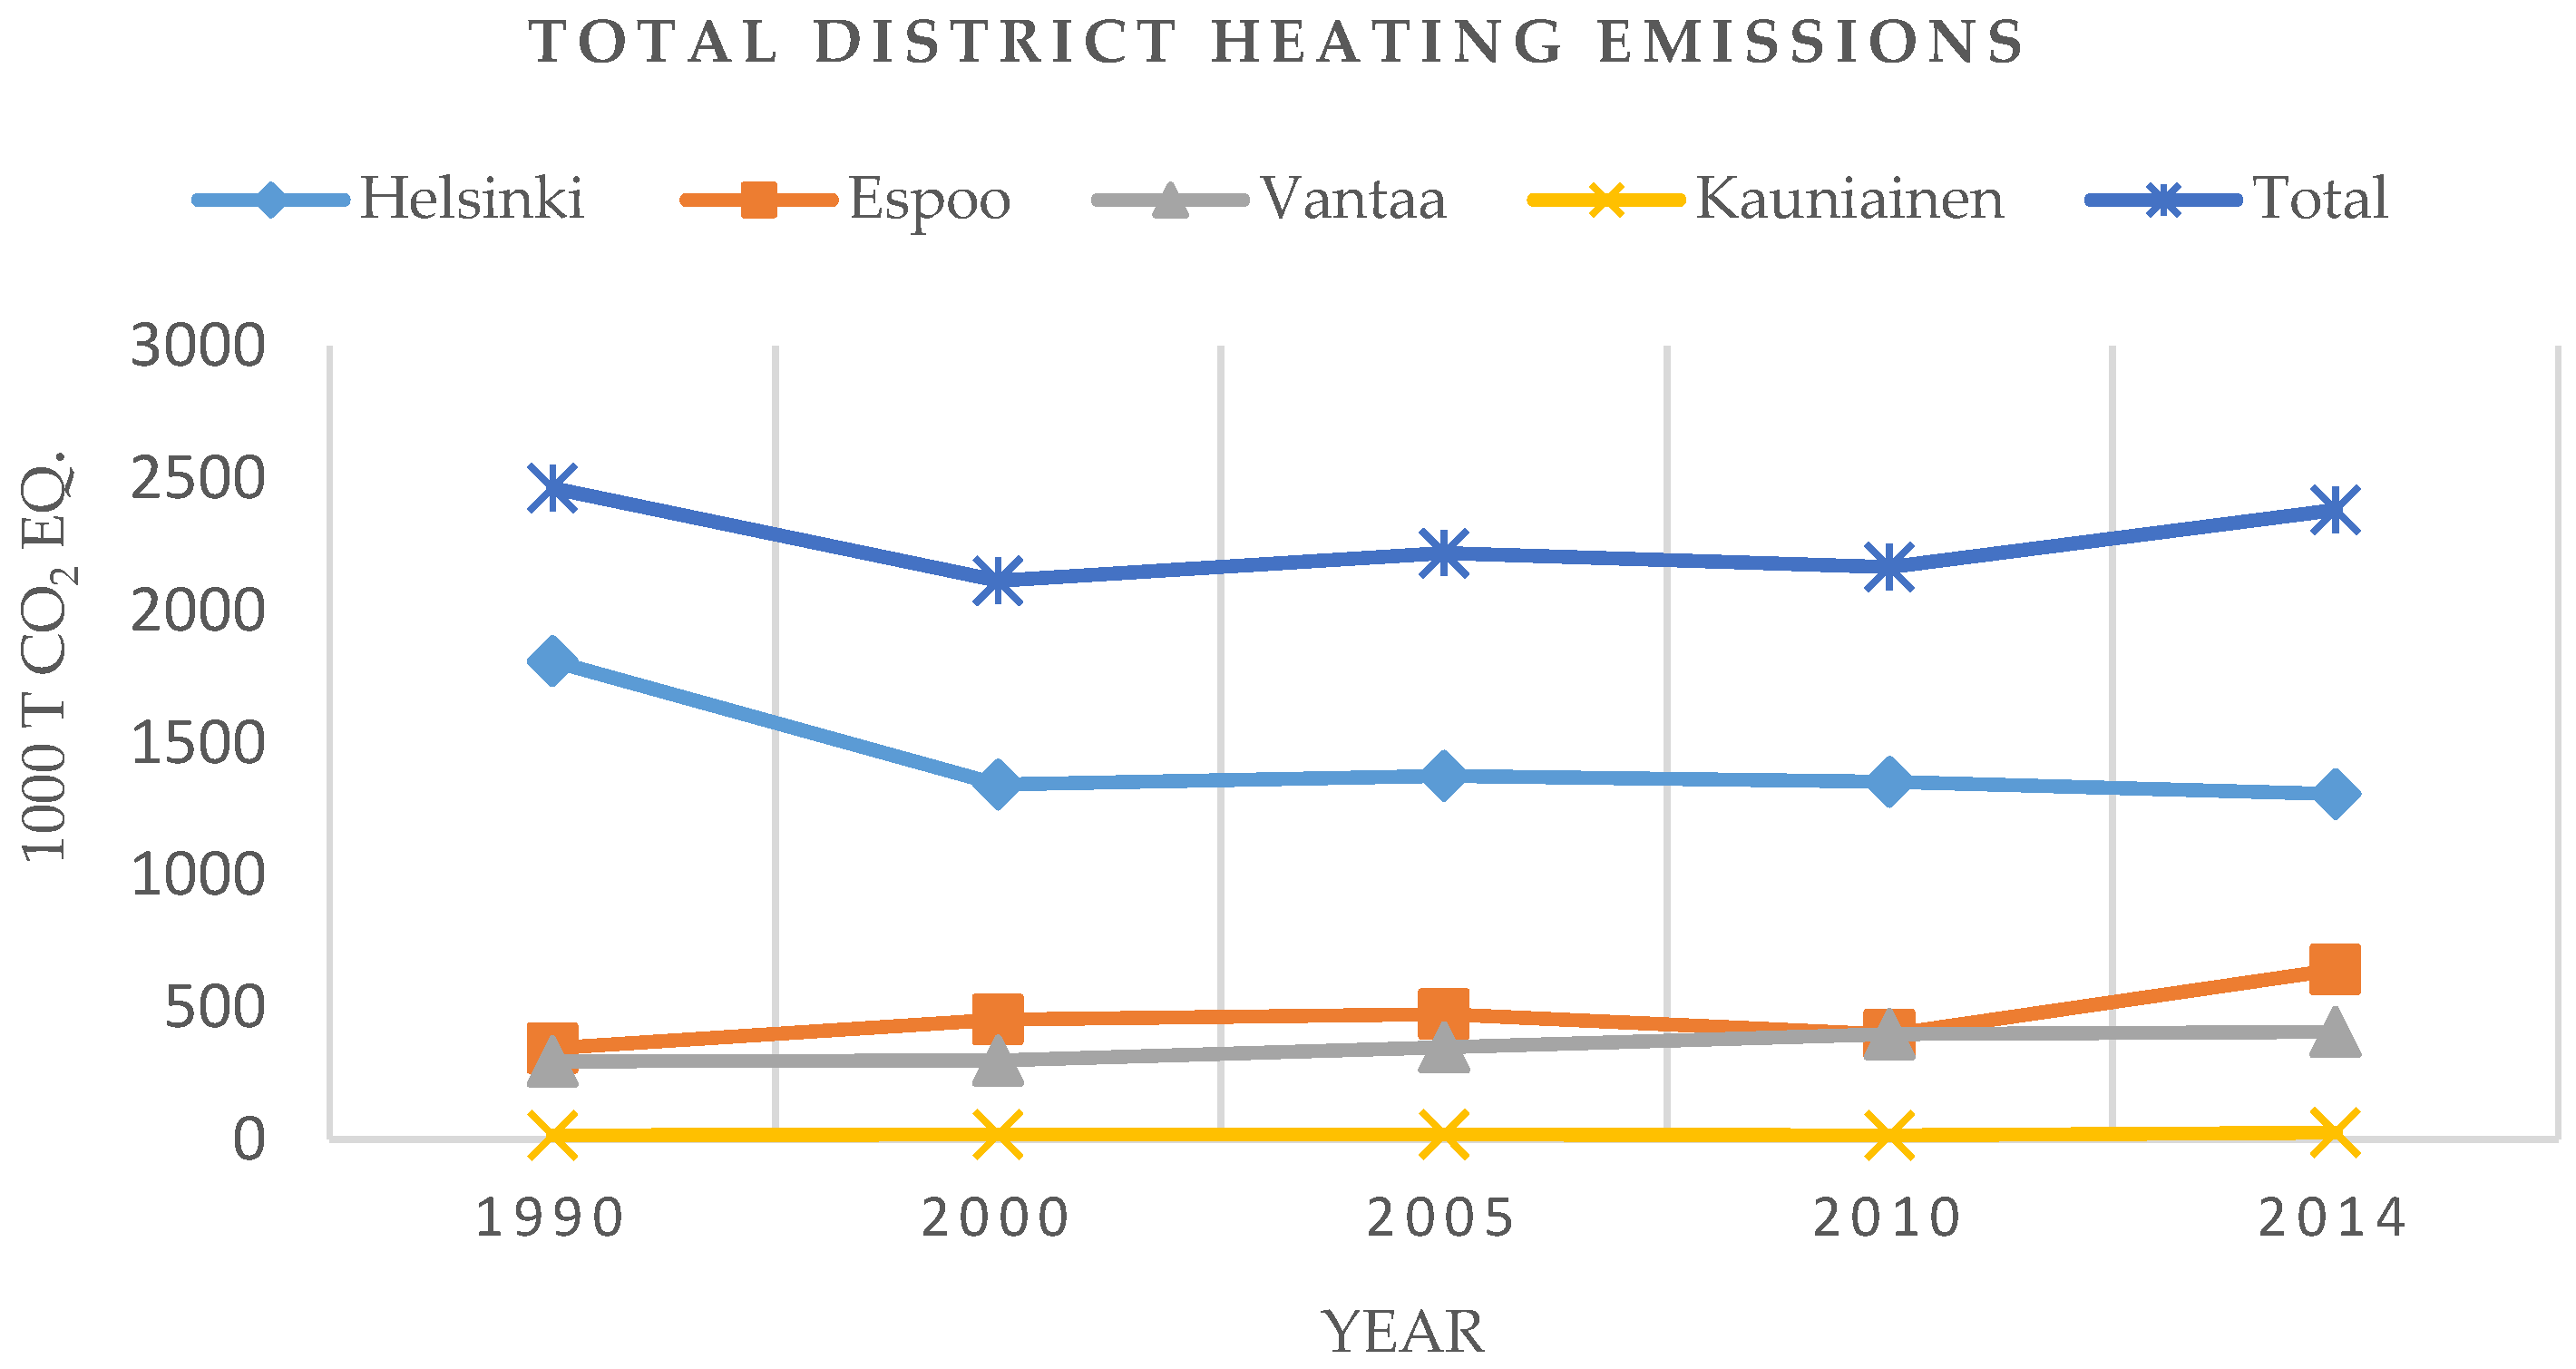
District heating is a sustainable source of heating but remains the largest source of carbon emissions in the Helsinki metropolitan area. In 2014, the cities of Helsinki, Espoo, Vantaa and Kauniainen produced district heating emissions reaching 55%, 27%, 17% and 1%, respectively, of the total district heating emissions for the entire metropolitan area [10]. Helen Ltd., the primary district heating producer in the city of Helsinki, is gradually shifting its fossil fuels to low emissions–generating fuels. For instance, it decreased its use of coal fuel by increasing its reliance on natural gas in recent years, and in 2015 began blending 5% to 7% wood pellets with its heating fuels in its power plants [31]. This decreased emissions in the city of Helsinki. In addition, the city of Helsinki launched several other measures to increase the share of renewable sources in district heating and the entire energy system. Such examples include the Suvilahti solar power plant (260, 000 KWh) launched in 2015, several public buildings producing solar power, solar heat pumps installed at several places, the launch of a solar energy home campaign and Helen Ltd.’s district heating and cooling system expansions [32]. All of these initiatives will result in small but positive effects on district heating emissions reductions in the near future. However, these activities need to expand further to meet the climate goals for 2020 and 2030.
In 2013 and 2014, the city of Vantaa reduced total emissions by 5% due to the energy produced by a waste-to-energy plant, which diminished the share of coal and natural gas used in district heating [30]. Small-scale renewable energy production practices are also increasingly more common in the Helsinki metropolitan area. For instance, geothermal energy has been generated in the Villa Elfvik Nature House and three other houses, and solar panels have been installed on new homes and on renovated schools in the Espoo region [33]. Total and per capita emissions reductions from district heating reached 27.9% and 42.8%, respectively, in the city of Helsinki and 3.3% and 29.6% in the metropolitan area between 1990 and 2014. However, the cities of Vantaa, Espoo and Kauniainen increased total district heating emissions by 37.9%, 86.7% and 79.7%, respectively, and per capita emissions by 5.8%, 14.3% and 171.4%, respectively, during the same period.
While district heating emissions levels began decreasing in 2007 in the city of Helsinki, trends for the metropolitan area have consistently fluctuated between 2000 and 2014 (Figure 6). The use of fossil fuels for district heat production stands at about 95% within Helen Ltd. and 86% in Vantaan Energia. In 2014, Helen Ltd. utilized 48% natural gas, 45% coal, 2% oil and only 5% renewable energy sources to generate district heat. Similarly, Vantaan Energia used 52% coal, 33% natural gas, 1% oil and 14% renewable energy sources to generate district heat in the same year. This suggests that the proportion of clean and renewable fuel sources used remains quite low in the metropolitan area. Helen Ltd. began using renewables to produce district heating in 2006, while Vantaan Energia began doing so in 2003 [34]. Helen Ltd. used national hydropower and wind power as renewable energy sources, while Vantaan energia only used wind power [34]. Current trends in the use of renewable sources in the energy system remain far smaller than what is necessary to meet the renewable energy consumption target (20%) by 2020. Thus, cities should aim for a 100% shift from fossil fuels to renewable energy sources in the district heating system to achieve carbon neutrality by 2050. This will require much work by cities in order to improve their district heating system–related fuel use practices.
Transportation constitutes the second largest source of carbon emissions both in the city of Helsinki (23.2%) and in the Helsinki metropolitan area (24.1%) [15]. In 1990, the city of Helsinki produced 649,830 tons of total carbon emissions resulting from transportation, which was reduced by 3000 tons by 2014; the metropolitan area produced 1,225,010 tons in 1990, reduced by 95,000 tons by 2014 [15]. The per capita emissions reductions related to transportation in the city of Helsinki reached 21% between 1990 and 2014, and 20% in the metropolitan area [15]. Transportation emits the highest amount of CO2, along with carbon monoxide, N2O and hydrocarbons. In the city of Helsinki, the primary carbon emitters in the transportation sector consist of road transport (about 70%) [33]. In recent years, emissions generated from ship traffic and airports slightly diminished compared to road transport. However, the trends related to decreasing transportation emissions vis-a-vis long-term strategic goals remain insufficient.
Several strategic movements aimed at reducing transportation-related emissions and at promoting sustainable methods of transportation services have been initiated in the Helsinki metropolitan area. The city of Helsinki has completed several initiatives, such as the completion of a pedestrian and cycling route from Töölönlahti to Ruoholahti (1.3 km), schemes to support workplace commute planning and the construction of cross-sectional public transport, granting priority parking to low-emissions vehicles and providing information on the best route choice through the region’s journey planner services [29]. The city of Helsinki recently began building bicycle-sharing facilities with parking places situated in various areas in the city center [11]. Other cities have launched initiatives, such as the completion in 2015 of a railway line to connect Vantaankoski to the airport via Tikkurila (11.8 km), beginning construction of a west-side metro line connecting Helsinki to Matinkylä to Kivinlahti in Espoo and the development of a Hastus system to estimate driving time and customer satisfaction surveys to improve transport [33]. All of these initiatives demonstrate that the city of Helsinki is motivated to reduce carbon emissions related to transportation.
In 2014, emissions generated from the consumption of electricity remained the third largest source both in the city of Helsinki and in the metropolitan area [15]. The city of Helsinki reduced 1.1% of its total emissions resulting from the consumption of electricity between 1990 and 2014, while the metropolitan area increased such emissions by 6.4%. Nevertheless, both reduced per capita emissions by 21.9% and 20.6%, respectively, during the same period [15].
4.3. Future Scenarios and Possibilities for Emissions Reductions
By examining the projections (for 2030 and 2050) for emissions reductions, we find multiple opportunities for improving current climate-related strategies and activity plans both in the city of Helsinki and the metropolitan area. The city of Helsinki envisions several future strategies for carbon emissions reductions. These aim at constructing all new buildings to be more energy efficient, relying only on electric buses or buses using biofuels by 2020, using local renewable energy sources, investing in smart energy systems, using waste converted to energy, and revising parking policies to promote lower transportation related emissions and raising awareness among citizens [29]. Numerous other possibilities also exist which may improve the current status of carbon-reducing actions and help achieve carbon neutrality. Both the city of Helsinki and the entire metropolitan area should improve the application of the best available technologies related to renewable and clean energy production, energy-saving measures and energy efficiency improvements. Current policy measures also need improvement related to implementing the appropriate future actions. These include applying commonly available renewable energy technologies such as solar energy, wind power, geothermal energy and hydropower energy, technologies currently rarely used in the Helsinki metropolitan area. Similarly, the use of biofuels and other green fuels in the transportation and heating systems remain negligible.
The Helsinki metropolitan area possesses a significant solar potential (about 900 kwh/m2) despite its cold weather and dark winters [35]. Thus far, a small number of private households and public buildings have installed solar panels and thermal collectors in the metropolitan area. Only two large-scale solar farm projects exist thus far in the city of Helsinki (Suvilahti and Kivikko), with the construction of another underway in Espoo [36]. This suggests that plenty of opportunities exist to produce energy from solar technology through private-public collaboration in the Helsinki metropolitan area. Similarly, a negligible amount of wind energy has been produced in the Helsinki metropolitan area [37]. However, a recent study showed that a majority of citizens in the Helsinki metropolitan area positively view wind energy [37]. Perhaps individuals can install small wind turbines for their homes, while feasibility studies on offshore energy productions continue. Currently, only a few households and one pilot industrial-level plant (40 MW in Otaniemi in Espoo) produce geothermal energy in the Helsinki metropolitan area [38]. Geothermal energy production, consisting of tunnel lining technology in the metro tunnels, wastewater discharge tunnels and road tunnels, is perhaps feasible [39]. Further studies will definitively determine its potential impact, but geothermal production may provide both clean energy production and emissions reductions in the longer term. Therefore, it is imperative that further studies examine geothermal energy production in additional locations in the Helsinki metropolitan area. A negligible amount of hydroelectricity (7300 MWh/a) has been produced by the Pitkäkoski and Kalliomäki power plants [40]. In addition, Helen Ltd. uses 60 MW of hydroelectricity nationally [37]. The feasibility of generating hydroelectricity from the Vantaa River and tidal/wave power from the Baltic Sea should be studied. Overall, producing energy from these renewable sources provides significant opportunities to reduce carbon emissions in the future. However, among all of these renewable technologies, solar energy technology represents the most feasible and most economical option. It may in fact fulfill the current renewable energy targets for 2030 and 2050 since it is easily available and its market price continues to steadily decline.
Shifting from fossil fuels (coal, natural gas, oils, petroleum and peat) to biofuels (wood pellets, straw, biodiesel and electricity) for energy production and transport reduces CO2 emissions. Thus, to further reduce CO2 emissions, all energy industries in the metropolitan area should shift to using wood pellets, other biofuels and waste. Certain types of waste, such as waste oil, can also be used to produce biodiesel [41]. Interest is increasing on the use of CO2 as feed stocks for chemical and fuel production [42]. Currently, plastic waste can be used to generate biodiesel [43]. Perhaps the Helsinki metropolitan area could use its vast amount of plastic waste to generate biodiesel. Emphasis should be placed on using pyrolysis and synthetic natural gas production (SNG) for liquid biofuel production. Furthermore, replacing all district heating boilers with combined heat and power (CHP) heat, and adding heat pumps and a heat storage capacity to CHP plants reduces carbon emissions. Likewise, fueling buses and cars with methane produced from food residue, wastewater sludge and landfill byproducts significantly reduces carbon emissions. In addition, using LED or solar lamps instead of conventional lamps in homes and for streetlights and using solar photovoltaics (PVs) on ships and boats can save a huge amount of energy. Finally, increasing bio-oil and electrical buses and encouraging the use of bicycles can also reduce emissions. For instance, the city of Stockholm promoted bicycle riding in recent years, leading to a 76% increase in the number of cyclists during the last 10 years [24]. Similarly, the city of Copenhagen promoted cycling, since 52% of its population uses bicycles as their primary means of transportation [44]. The cities in the Helsinki metropolitan area should also rapidly adopt similar action plans. Likewise, the number of electric vehicles and charging stations for them should be increased. Currently, only 60 charging stations exist in Finland [45]. Railway, metro and tram lines should be expanded to reduce transportation-related emissions.
Energy consumption in homes and businesses also needs to be addressed. For instance, the home remote control application developed by Helen Ltd. [31] should be used to limit excessive electricity consumption in both private and public buildings. Additionally, using a net metering system, such as that in use in the United States, can be used to manage billing systems for consumed versus generated electricity on both residential and commercial solar properties [46]. Similarly, the use of waste heat recovery systems in high heat producing buildings and air ventilation systems can significantly reduce the amount of energy used. Reducing daily water use can also save energy. The use of solar grills and solar heat pumps may help to reduce carbon emissions. To reduce the carbon footprint, builders should make use of old materials when constructing new homes, which also proves economically viable.
Changing the energy consumption habits of individuals and society as a whole remains a challenging task, but green policy methods and awareness programs may help to change behaviors. Thus, smart policy measures should be formulated in collaboration between the private and public sectors to make Helsinki and the Helsinki metropolitan area green. For instance, green campus methods, such as those activities adopted by universities, can raise awareness and provide a model for creating green cities. Prioritizing farm-level wind, geothermal and solar energy production and providing suitable incentives attracts the private sector to invest in renewable energies. Implementing smart policies to stop coal-fueled boats from entering Helsinki ports can also reduce carbon emissions in the city. Furthermore, using contaminated lands to harvest renewable energy can make use of wasteland as well as reduce costs and emissions. Encouraging individuals to share bikes and cars and establishing car- and bike-sharing communities can reduce energy and fuel consumption. Information related to the potential of solar and wind energy sources in cities should be provided to citizens. For example, HSY published a solar potential map for the Helsinki area, but many citizens are not aware of it [11]. Providing training programs in support of local climate conservation to additional individuals can serve to expand the reach of awareness programs.
Finally, Finland’s current feed-in tariff system consists of limited small-scale productions of wind, solar and geothermal energy. Wind power projects are entitled to a subsidy only between the combined energy generation capacities of 500 KVA and 2500 MVA [37]. For wind, biogas and wood fuels, the power plant feed-in tariff is granted based on the mean market price of electricity, equivalent to 83.50/MWh [47]. Current subsidy systems for clean energy production and use require revisions that encourage citizens and investors to generate energy from renewable sources. Strong policy measures should be implemented to conserve the forested lands surrounding the metropolitan area since these lands absorb emissions. Carbon reduction plans or climate strategies should be programmed and revised in five-year intervals to enhance carbon-related activities. Local city councils and the central government should take more responsibility towards formulating and implementing strong and effective strategies in order to achieve the various climate goals by 2030 and 2050.
5. Discussion
Our analyses show that current carbon reduction actions in the Helsinki metropolitan area are insufficient to achieve carbon neutrality by 2050. While the efforts of the city of Helsinki to achieve carbon neutrality are optimistic, the weak emissions reduction commitments by the other three cities in the metropolitan area render the joint climate-related strategies inadequate. Thus, no commitment to achieve a carbon neutral Helsinki metropolitan area by 2050 exists. However, a regional environmental body, HSY, envisions carbon neutrality. This indicates a lack of solid cooperation among the four cities towards climate actions. Despite this lack of cooperation, carbon reduction activities in both the city of Helsinki and the metropolitan area in recent years have expanded, representing a positive sign towards reaching carbon neutrality goals.
The majority (96%) of emissions produced in both the city of Helsinki and the metropolitan area stems from the consumption, production and distribution of energy. A previous study also revealed that 95% of emissions produced in the city of Helsinki were energy-based [48]. Expectations suggested that the energy industries in the Helsinki metropolitan area would rely more on renewable fuels, but in 2014, renewable fuels comprised only 5% of the energy consumption of Helen Ltd. and 15% of Vantaan energia. Helen Ltd.’s target to increase the share of renewables to 20% by 2020 currently seems quite difficult to reach. Likewise, the use of other renewable energy sources in the metropolitan area remains quite small. Currently, no attractive subsidies for small-scale renewable energy production in Finland exist. Thus, more renewable energy incentives may promote the production of both the small-scale and farm-level renewable energy sources.
Energy consumption from industries and machineries in the Helsinki metropolitan area has decreased significantly, and the emission of CH4 has been contained in recent years. Helen Ltd.’s carbon neutrality goal supports the climate actions of the city of Helsinki. In addition, a few activities, such as the expansion of metro lines, the construction of bicycle paths and initiatives aimed at constructing an eco-city, are noteworthy. Neighboring capital cities have strategies to develop fossil fuel–free transportation and fossil fuel–free cities. Currently, the city of Helsinki and other cities in the metropolitan area do not have such strategies. Although, along similar lines, the city of Helsinki formulated a climate roadmap for 2050 which includes several fossil fuel-cutting strategies.
Our results extend to all four cities in the Helsinki metropolitan area, providing ways in which they may formulate better climate-related strategies in future. A comparison of the climate actions between the city of Helsinki and the metropolitan area can assist other cities on how to improve their climate strategies. Formulating solid ideas and policies towards carbon reduction activities remain difficult tasks, proving further challenging due to the political decisions necessary to implement such projects. Even policy measures already formulated take much time to materialize due to the necessity of reaching consensus between political parties and local and central governments alike. Emissions scenarios and possible future action plans can generate new ideas for joint climate strategies aimed at achieving carbon neutrality. However, only implementing improvements to one city’s efforts remains insufficient; all four cities acting together, however, can result in a carbon neutral Helsinki metropolitan area by 2050.
6. Conclusions
This study showed that current energy-related climate actions are necessary in order to improve efforts aimed at achieving carbon neutrality by 2050. Heating stands as the main source of emissions in the Helsinki metropolitan area, which can be improved by shifting from fossil fuels to renewable fuel sources. Industrial operations should rely on wood pellets, straw, bio-oils and biomasses rather than coal and natural gas. The use of renewable energy sources reduces carbon emissions and will prevent a future energy crisis. Renewable energy sources also provide additional business and employment opportunities in the Helsinki metropolitan area. Priority should be given to improving the energy efficiency of buildings and transportation systems. Public and private buildings need to shift towards energy self-production and becoming energy-independent. This can be achieved by implementing smart policy measures and awareness programs such as to aware the people about the use wind turbines, geo-thermal heat pumps, and solar panels. Promoting public transportation and cycling can help to reduce emissions resulting from passenger cars. Additional construction projects and the expansion of transportation infrastructure will help develop emissions-free transportation systems.
Given that Helen Ltd. has a carbon-neutral goal, other industries also need to follow suit and aim for carbon neutrality. Establishing a waste-to-energy plant in the city of Vantaa has played a significant role in reducing emissions. Other cities should learn from the city of Vantaa and explore the possibility of constructing additional waste-to-energy plants within their territorial boundaries. Additionally, solar energy represents an important source of energy that will greatly impact the strategy of increasing the production of renewable energy sources. Public–private sector collaboration is essential in reducing emissions and producing renewable energy sources. Similarly, universities should establish green campus methods to take part in carbon emissions reduction activities. The city of Helsinki is further ahead of the other cities in the metropolitan area on reducing carbon emissions. Its climate-related strategies and actions mirror those of other neighboring capital cities, and current progress indicates its likelihood of achieving carbon neutrality by 2050. Other cities, however, also require stringent carbon reduction strategies. Those cities not currently committed to carbon neutral strategies should draft such measures as soon as possible, and adopt similar goals as neighboring capital cities to establish fossil fuel–free transportation systems. Most importantly, strong political commitments are also necessary in order to formulate and implement stringent climate-related strategies.
Acknowledgments
Most of the data used in this research were collected from the city of Helsinki Environmental Center. We would like to thank all of those at the Helsinki Environmental Center, especially Senior Environmental Inspector Jari Viinanen and Project Planner Sonja-Maria Ignatius, for sharing their precious time in lengthy discussions.
Author Contributions
Karna Dahal collected the data, performed the analyses and drafted the manuscript; Professor Jari Niemelä provided supervision of all stages and commented on the manuscript.
Conflicts of Interest
The authors declare no conflicts of interest.
References
- IPCC. Climate Change. Contribution of Working Groups, I, II, III to the Fifth Assessment Report of the Intergovernmental Panel on Climate Change. Available online: https://www.ipcc.ch/pdf/assessment-report/ar5/syr/SYR_AR5_FINAL_full.pdf (accessed on 26 November 2015).
- Mikkonen, S.; Laine, M.; Mäkelä, H.; Gregow, H.; Tuomenvirta, H.; Lehtinen, M.; Laaksonen, A. Trends in the average temperature in Finland, 1847–2013. Stoch. Environ. Res. Risk Assess. 2015, 29, 1521–1529. [Google Scholar]
- Barbi, F.; Ferreira, L. Climate change in Brazilian cities: Policy strategies and responses to global warming 2013. IJESD 2013, 4, 49–51. [Google Scholar] [CrossRef]
- Hunt, A.; Watkiss, P. Climate change impacts and adaptation in cities: A review of the literature 2010. Clim. Chang. 2011, 104, 13–49. [Google Scholar] [CrossRef] [Green Version]
- Carbon Neutral Cities Alliance, 2014. Available online: http://usdn.org/public/page/75/Background (accessed on 6 June 2016).
- Climate Actions. 2020 Climate & Energy Package. European Commission, 2015. Available online: http://ec.europa.eu/clima/policies/strategies/2020/index_en.htm (accessed on 31 December 2015).
- Climate change. Helsinki Metropolitan Area Climate Strategy. Helsingin seudun ympäristöpalvelut, 2015. Available online: https://www.hsy.fi/en/experts/climatechange/mitigation/Pages/mitigation_strategy_and_targets.aspx (accessed on 30 December 2015).
- Climate Change. Adaptation Strategy. Helsingin Seudun Ympäristöpalvelut, 2015. Available online: https://www.hsy.fi/en/experts/climatechange/adaptation/Pages/-Adaptation-strategy.aspx (accessed on 5 January 2016).
- Vantaan Energia. The New Waste Burning Investment in the Helsinki Metropolitan Area. WastED - Waste Management Education. Available online: http://www.wasted.fi/images/StudyTrip/New%20waste-to-energy%20power%20plant.pdf (accessed on 17 December 2015).
- Goals. Stadin Ilmasto. Available online: http://www.stadinilmasto.fi/en/goals/ (accessed on 5 December 2015).
- Viinanen, J.; Ignatius, S.-M.; City of Helsinki Environmental Centre. Personal communication, 2016.
- Helsinki Metropolitan Area Climate Strategy to the Year 2030. Helsinki Region Environmental Services Authority, 2007. Available online: https://www.hsy.fi/sites/Esitteet/EsitteetKatalogi/Raportit/Helsinki_Metropolitan_Area_Climate_strategy_summary.pdf (accessed on 23 December 2015).
- Green Stories. The Meaning of Carbon Neutrality. Gogreen. Available online: http://www.go-green.ae/greenstory_view.php?storyid=1200 (accessed on 11 December 2015).
- Sustainable United Nations. A Guide to Greenhouse Gas Emissions in UN Organizations. Greening the Blue, 2009. Available online: http://www.greeningtheblue.org/sites/default/files/EmissionReductionGuide.pdf (accessed on 26 January 2016).
- Taulukko: Helsingin, Espoon, Kauniaisten ja Vantaan Kulutusta Vastaavat Kasvihuonekaasupäästöt 1990–2014. Helsingin Ympäristotilasto, 2015. Available online: http://www.helsinginymparistotilasto.fi/ (accessed on 2 January 2016).
- Achievements and Challenges of Sustainable Development in Helsinki. City of Helsinki, 2007. Available online: http://www.hel.fi/static/ymk/esitteet/keke-achievements.pdf (accessed on 17 January 2016).
- Environmental Report. City of Helsinki, 2014. Available online: http://www.hel.fi/static/ymk/yrap/en/environmental-report-2014.pdf (accessed on 18 January 2016).
- Water Services: Wastewater Treatment Plants. Helsinki Region Environmental Services Authority, 2015. Available online: https://www.hsy.fi/en/experts/water-services/wastewater-treatment-plants/Pages/default.aspx (accessed on 18 January 2016).
- Heinonen, M.; Helsinki Region Environmental Services Authority (HSY). Personal communication, 2016.
- All about Arctic Climatology and Meteorology. National Snow & Ice Data Centre, 2012. Available online: https://nsidc.org/cryosphere/arctic-meteorology/climate_change.html (accessed on 1 December 2015).
- Climate Action. Paris Agreement. European Commission, 2015. Available online: http://ec.europa.eu/clima/policies/international/negotiations/future/index_en.htm (accessed on 4 January 2016).
- Nordic Solutions for Sustainable Cities. Stadin Ilmasto, 2011. Available online: http://www.stadinilmasto.fi/files/2014/08/Nordic-solutions-for-sustainable-cities.pdf (accessed on 12 February 2015).
- Green Urban Denmark. Low Carbon & New Energy. Cities in Denmark. Danish Ministry of Housing, Urban and Rural Affairs, 2014. Available online: http://www.mbbl.dk/sites/mbbl.dk/files/dokumenter/publikationer/green_urban_dk_03072014.pdf (accessed on 13 December 2015).
- Stockholm—The first European Green Capital. Executive Office. Stockholm, 2015. Available online: http://ec.europa.eu/environment/europeangreencapital/wp-content/uploads/2011/04/Stockholm-First-European-Green-Capital-.pdf (accessed on 25 January 2016).
- Tennent, J. Oslo Is First Capital City to Divest from Fossil Fuels and Plans to Halve Emissions by 2020. Ibtimes, 2015. Available online: http://www.ibtimes.co.uk/oslo-first-capital-city-divest-fossil-fuels-plans-halve-emissions-by-2020-1524753 (accessed on 26 January 2016).
- Rotmans, J.; Asselt, M.V.; Anastasi, C.; Greeuw, S.; Mellors, J.; Peters, S.; Rijkens, N. Visions for a sustainable Europe. Futures 2000, 32, 809–831. [Google Scholar] [CrossRef]
- Backcasting Approach for Sustainable Mobility. Available online: http://publications.jrc.ec.europa.eu/repository/bitstream/111111111/7659/1/backcasting%20final%20report.pdf (accessed on 29 November 2015).
- Taulukko: Helsingin Seudun Väestö 1.1.1980–2015 Sekä Väestöennustevaihtoehdot 1.1.2016–2050. Helsingin Seudun Aluesarjat, 2015. Available online: http://www.aluesarjat.fi/ (accessed on 30 December 2015).
- Helsinki’s Climate Roadmap. City of Helsinki Environmental Centre, 2015. Available online: http://issuu.com/helsinginymparistokeskus/docs/helsinki_climate_roadmap_20150427 (accessed on 17 December 2015).
- Climate change. Greenhouse Gas Emissions. Helsingin Seudun Ympäristöpalvelut, 2015. Available online: https://www.hsy.fi/en/experts/climatechange/mitigation/Pages/Greenhouse-Gas-Emissions.aspx (accessed on 7 January 2016).
- Helen’s Electricity. Helen Oy. Available online: https://www.helen.fi/en/electricity/real-estates/hima/ (accessed on 11 January 2016).
- Helsingin Seudun Ympäristöpalvelut-Kuntayhtymä. HSY:n Energiatase ja Kasvihuonekaasujen Päästöt 2010 (HSY’s Energy Balance and Greenhouse Gas Emissions). Helsingin Seudun Ympäristöpalvelut, 2011. Available online: https://hsy.fi/sites/Esitteet/EsitteetKatalogi/Julkaisusarja/8_2011_HSY_energitase_kasvihuonekaasujen_paastot_2010.pdf (accessed on 11 January 2016).
- Pääkaupunkiseudun Ilmastotekoja. Helsingin Seudun Ympäristöpalvelut, 2014. Available online: https://www.hsy.fi/sites/Esitteet/EsitteetKatalogi/Katsaukset/Pk-seudun_ilmastotekoja_2014_1.pdf (accessed on 3 January 2016).
- Energiavastuullisuus. Taulukko: Helsingin Energian Ympäristöpennisähkön ja Vantaan Energian Tuulisähkön Asiakasmäärät Vuosina 2000–2014. Helsingin Ymparistotilasto, 2015. Available online: http://www.helsinginymparistotilasto.fi/ (accessed on 11 December 2015).
- Suri, M.; Huld, T.; Dunlop, E.; Ossenbrink, H. Potential of solar electricity generation in the European Union member states and candidate countries. Sol. Energy 2007, 81, 1295–1305. [Google Scholar] [CrossRef]
- Why to Invest in Solar Energy? Finsolar, 2015. Available online: http://www.finsolar.net/?page_id=1553&lang=en_US (accessed on 15 January 2016).
- Finnish Wind Turbines and Wind Power Projects. The Finnish Wind Power Association (FWPA), 2015. Available online: http://www.tuulivoimayhdistys.fi/en/wind-power-in-finland/industrial-wind-power-in-finland/industrial-wind-power-in-finland (accessed on 14 January 2016).
- Mäkelä, J. Mayor’s Blog. Finland’s Deepest Hole Sits Well in Espoo Innovation Garden. City of Espoo, 2015. Available online: http://www.espoo.fi/en-US/City_of_Espoo/Organization/Mayor/Mayors_blog/Finlands_deepest_hole_sits_well_in_Espoo (70018) (accessed on 15 January 2016).
- Geothermal Tunnel Lining. Ground Source Heat Pump (GSHP) Association, 2012. Available online: http://www.gshp.org.uk/pdf/Ralf_Winterling_REHAU_Tunnelling.pdf (accessed on 11 January 2016).
- Hydropower Plants on the River Kymijoki. Helen Oy. Available online: https://www.helen.fi/en/helen-oy/about-us/energy-production/power-plants/hydropower-plants-on-the-river-kymijoki/ (accessed on 20 January 2016).
- Biodiesel Workshop Presentation. Rochester Institute of Technology, 2012. Available online: http://www.rit.edu/affiliate/nysp2i/sites/rit.edu.affiliate.nysp2i/files/biodiesel_workshop_presentation_2012-10-05.pdf (accessed on 11 January 2016).
- Dibenedetto, A.; Angelini, A.; Stufano, P. Use of carbon dioxide as feedstock for chemicals and fuels: Homogeneous and heterogeneous catalysis. JCTV 2014, 89, 334–353. [Google Scholar] [CrossRef]
- Dewedar, R. Student Finds New Way of Turning Plastic into Biofuel. SciDev Net, 2012. Available online: http://www.scidev.net/global/education/news/student-finds-new-way-of-turning-plastic-into-biofuel.html (accessed on 12 January 2016).
- European Green Capital. Copenhagen Winner, 2014. European Commission, 2012. Available online: http://ec.europa.eu/environment/europeangreencapital/wp-content/uploads/2012/07/Copenhagen-Short-Leaflet_Web.pdf (accessed on 26 January 2016).
- Electricity: Helen Oy 2015. Available online: https://www.helen.fi/en/electricity/real-estates/charging-electric-vehicles/ (accessed on 26 January 2016).
- Issues and Policies. Distributed Solar. Net Metering. Solar Energy Industries Association. Available online: http://www.seia.org/policy/distributed-solar/net-metering (accessed on 13 January 2016).
- Feed-in Tariff. Energy Authority, 2015. Available online: https://www.energiavirasto.fi/en/web/energy-authority/feed-in-tariff (accessed on 4 January 2016).
- Ryynäinen, E.; Oja, L.; Vehviläinen, I.; pietiläinen, O.-P.; Antikainen, R.; Tainio, P. Helsingin Kaupungin Ympäristökeskuksen Julkaisuja 7/2014. Helsinki: Helsingin Kaupunki Ympäristökeskus, 2014. Available online: http://www.hel.fi/static/ymk/julkaisut/julkaisu-07-14.pdf (accessed on 30 November 2015).
Figure 1.
Carbon reduction projection for the city of Helsinki. Note: Figure 1 was created using data accessed from Helsinki Environmental Statistics 2015, Helsinki Region Environmental Services Authority (HSY) and the City of Helsinki Environmental Report from 2014.
Figure 1.
Carbon reduction projection for the city of Helsinki. Note: Figure 1 was created using data accessed from Helsinki Environmental Statistics 2015, Helsinki Region Environmental Services Authority (HSY) and the City of Helsinki Environmental Report from 2014.

Figure 2.
Carbon reduction projection for the Helsinki metropolitan area. Note: Figure 2 was created using data accessed from Helsinki Environmental Statistics 2015, Helsinki Region Environmental Services Authority (HSY) and the City of Helsinki Environmental Report from 2014.
Figure 2.
Carbon reduction projection for the Helsinki metropolitan area. Note: Figure 2 was created using data accessed from Helsinki Environmental Statistics 2015, Helsinki Region Environmental Services Authority (HSY) and the City of Helsinki Environmental Report from 2014.

Figure 3.
Emissions reduction trends for the cities in the Helsinki metropolitan area from 1990 to 2014 [15].
Figure 3.
Emissions reduction trends for the cities in the Helsinki metropolitan area from 1990 to 2014 [15].

Figure 4.
Per capita energy consumption in the Helsinki metropolitan cities [15].
Figure 4.
Per capita energy consumption in the Helsinki metropolitan cities [15].

Figure 5.
Per capita emissions in the Helsinki metropolitan cities [15].
Figure 5.
Per capita emissions in the Helsinki metropolitan cities [15].

Figure 6.
District heating emissions in the cities of the Helsinki metropolitan area [15].
Figure 6.
District heating emissions in the cities of the Helsinki metropolitan area [15].

| Sources | Type of Information | # | Purpose of the Data Collected |
|---|---|---|---|
| Websites | Environment-related departments from the government and institutions, United Nations and European Union bodies | 29 | To define climatic terms and research methods |
| Journal articles | Chemical and biotechnology journals, workshop presentations and climate-related policies | 4 | To identify technological processes and related terms |
| Reports | City’s environmental reports, European Union reports and reports from the Intergovernmental Panel on Climate Change (IPCC) | 11 | To gather climate actions and emissions data and information |
| Emails and interviews | Email conversations and interviews with city authorities (interviewees: Jari Viinanen and Sonja-Maria Ignatius) and wastewater utilities (interviewee: Mari Heinonen) | 20 | To understand the emissions data, climate strategies and actions aimed at carbon neutrality |
| Newspaper articles and social media posts | Yle, BBC, Helsinki Times, International Business Times, Linkedin and Facebook | 30 | Updates on global and regional climate activities |
| Presentations and seminars | Seminar organized by the City of Helsinki Environmental Center | 1 | To understand smart energy systems such as power storage |
| Webinars | Webinar organized by Climate Technology Center (CTCN) | 1 | To understand Copenhagen’s climate efforts |
Table 2.
Population scenarios and projections for the cities in the Helsinki metropolitan area [28].
| Year | 1990 | 2015 | 2020 | 2030 | 2040 | 2050 |
|---|---|---|---|---|---|---|
| Helsinki | 490,691 | 620,715 | 657,774 | 712,598 | 737,019 | 758,236 |
| Metropolitan area | 820,639 | 1,106,418 | 1,175,276 | 1,286,654 | 1,361,938 | — |
| City of Helsinki | Metropolitan Area | |||
|---|---|---|---|---|
| Year | Total Emissions (MtCO2e) | Per Capita Emissions (KtCO2e) | Total Emissions (MtCO2e) | Per Capita Emissions (KtCO2e) |
| 1990 | 3.6 | 7300 | 5.8 | 7020 |
| 2014 | 2.8 | 4480 | 5.5 | 4940 |
| % reduction (1990–2014) | 22.2 | 38.6 | 5.2 | 29.6 |
| Targets | ||||
| 2020 | 2.52 | 3900 | 4.64 | |
| 2030 | — | — | 4282 | |
| 2050 | carbon neutral | carbon neutral | — | 0 |
© 2016 by the authors; licensee MDPI, Basel, Switzerland. This article is an open access article distributed under the terms and conditions of the Creative Commons Attribution (CC-BY) license (http://creativecommons.org/licenses/by/4.0/).
Share and Cite
MDPI and ACS Style
Dahal, K.; Niemelä, J. Initiatives towards Carbon Neutrality in the Helsinki Metropolitan Area. Climate 2016, 4, 36. https://doi.org/10.3390/cli4030036
AMA Style
Dahal K, Niemelä J. Initiatives towards Carbon Neutrality in the Helsinki Metropolitan Area. Climate. 2016; 4(3):36. https://doi.org/10.3390/cli4030036
Chicago/Turabian StyleDahal, Karna, and Jari Niemelä. 2016. "Initiatives towards Carbon Neutrality in the Helsinki Metropolitan Area" Climate 4, no. 3: 36. https://doi.org/10.3390/cli4030036
Note that from the first issue of 2016, this journal uses article numbers instead of page numbers. See further details here.