
Trend Analysis for Extreme Rainfall at Sub-Daily and Daily Timescales in Côte d’Ivoire

Abstract
:1. Introduction
2. Materials and Methods
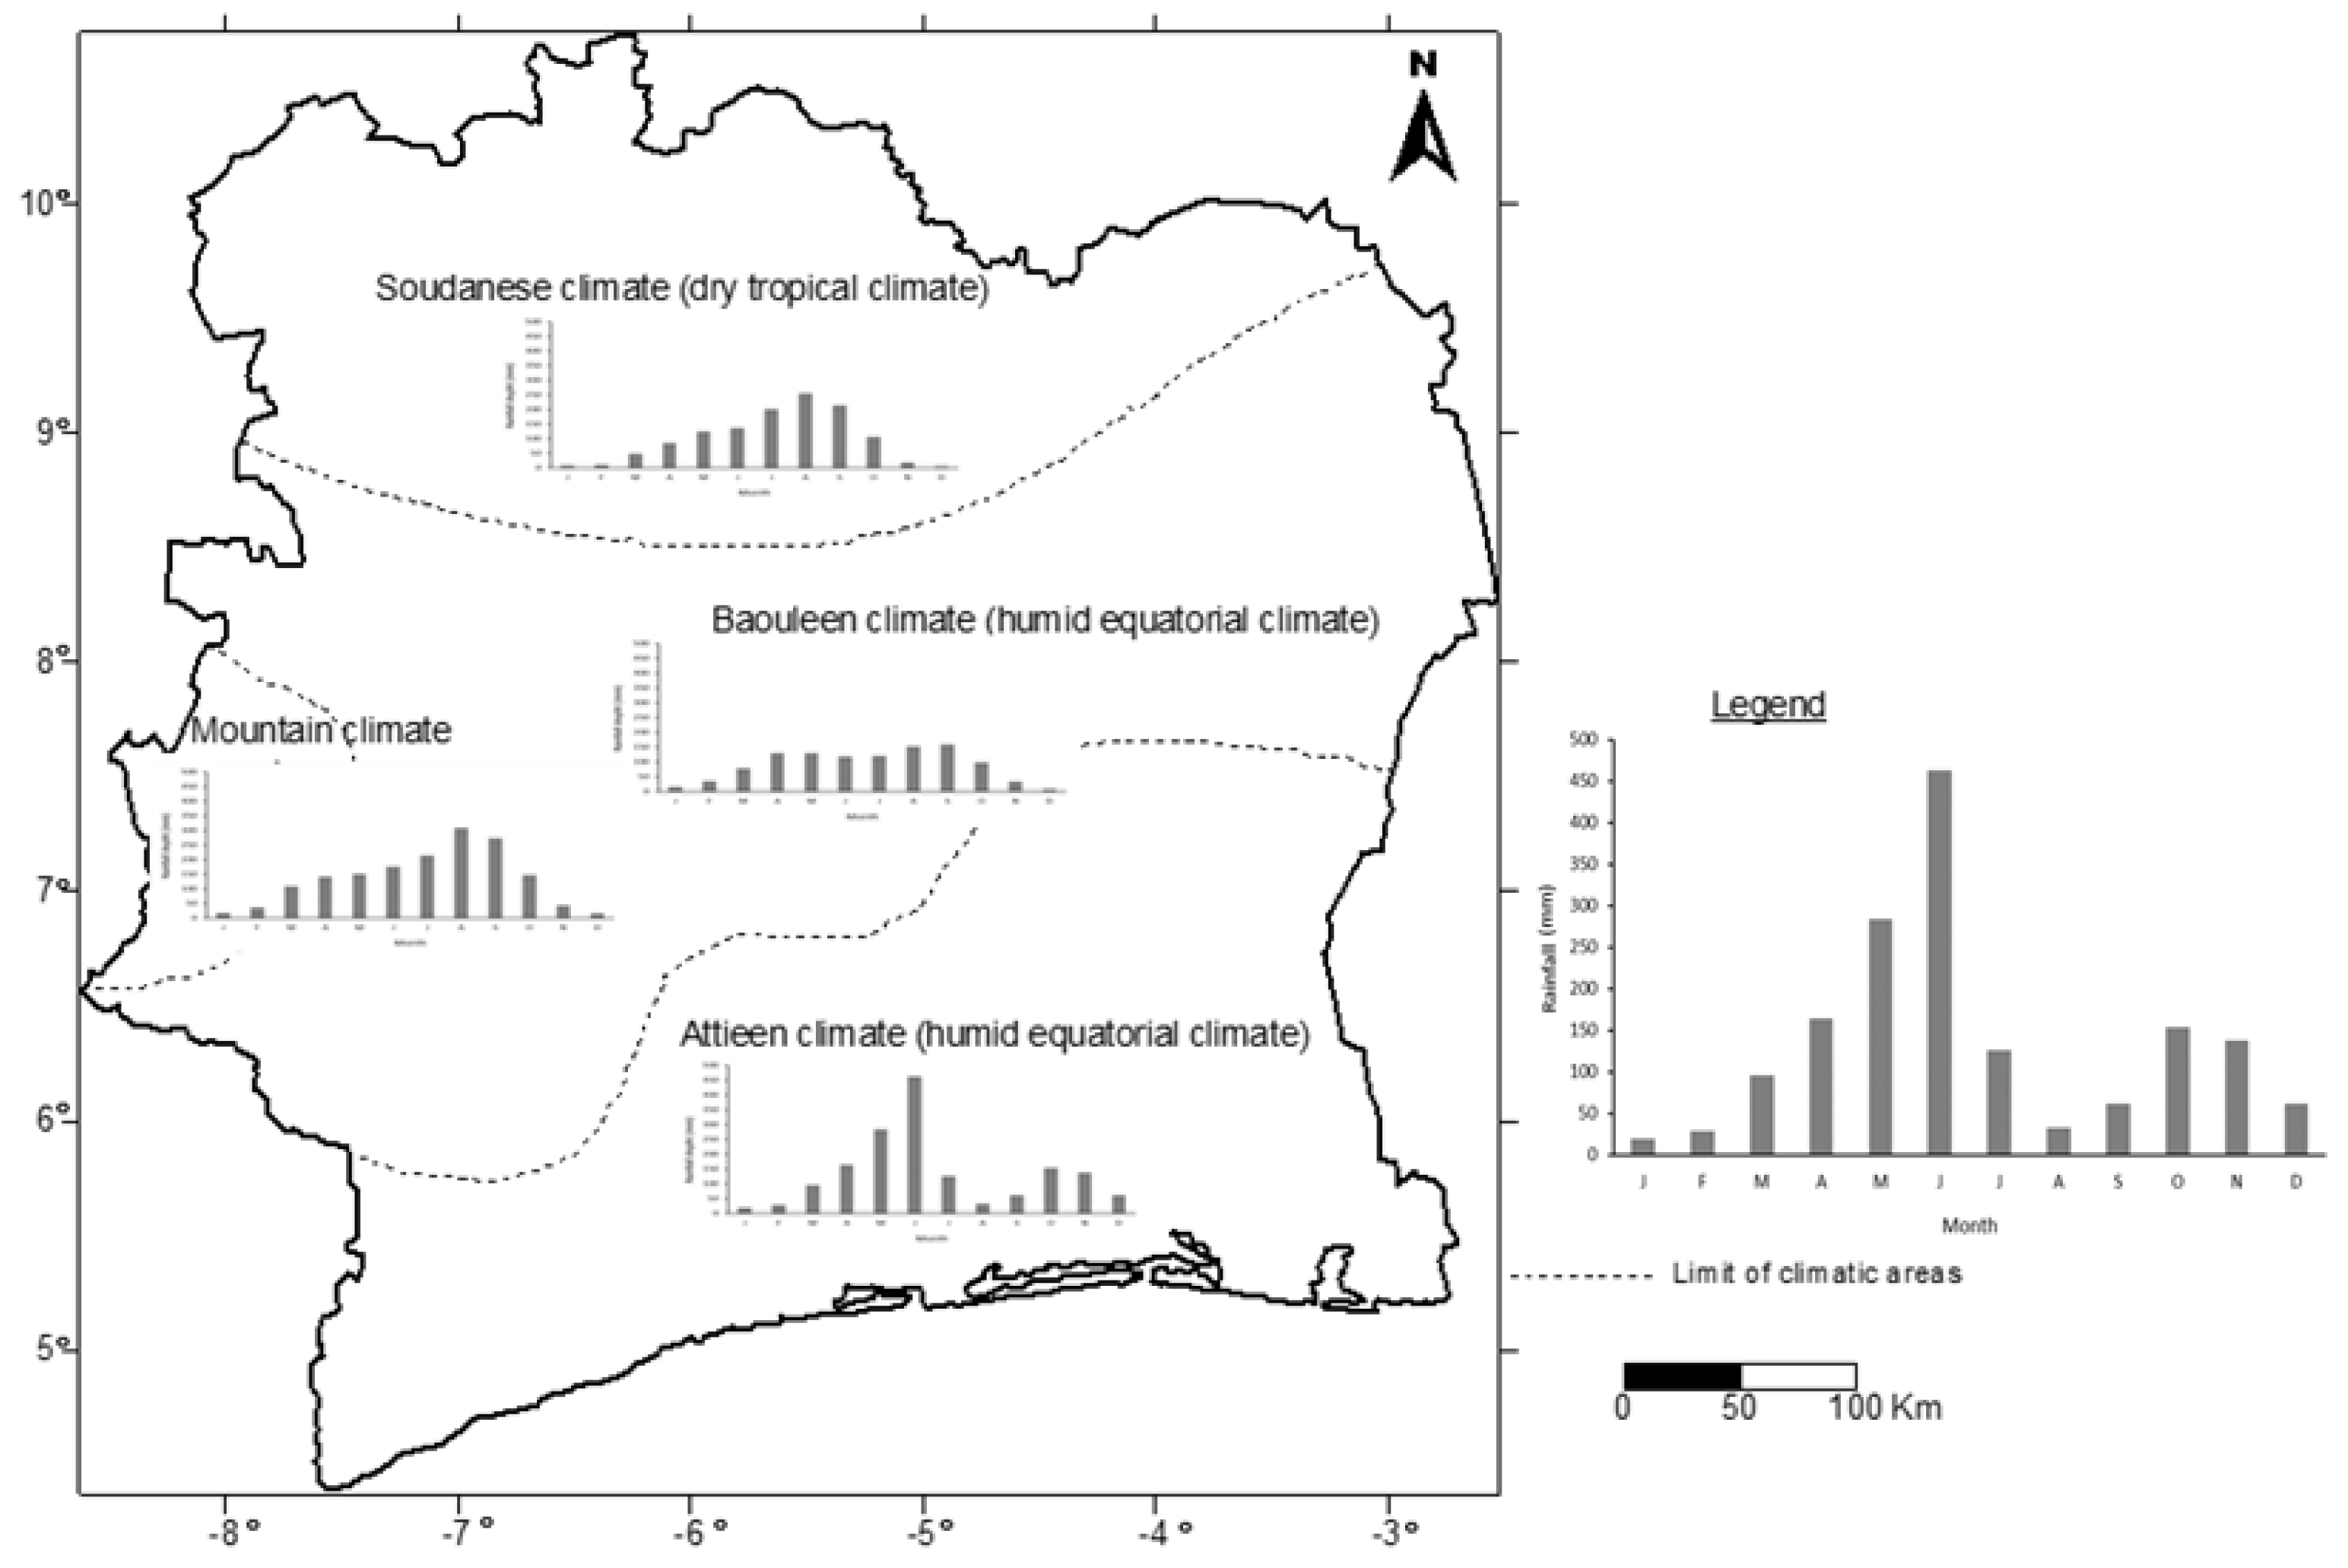
2.1. Study Area
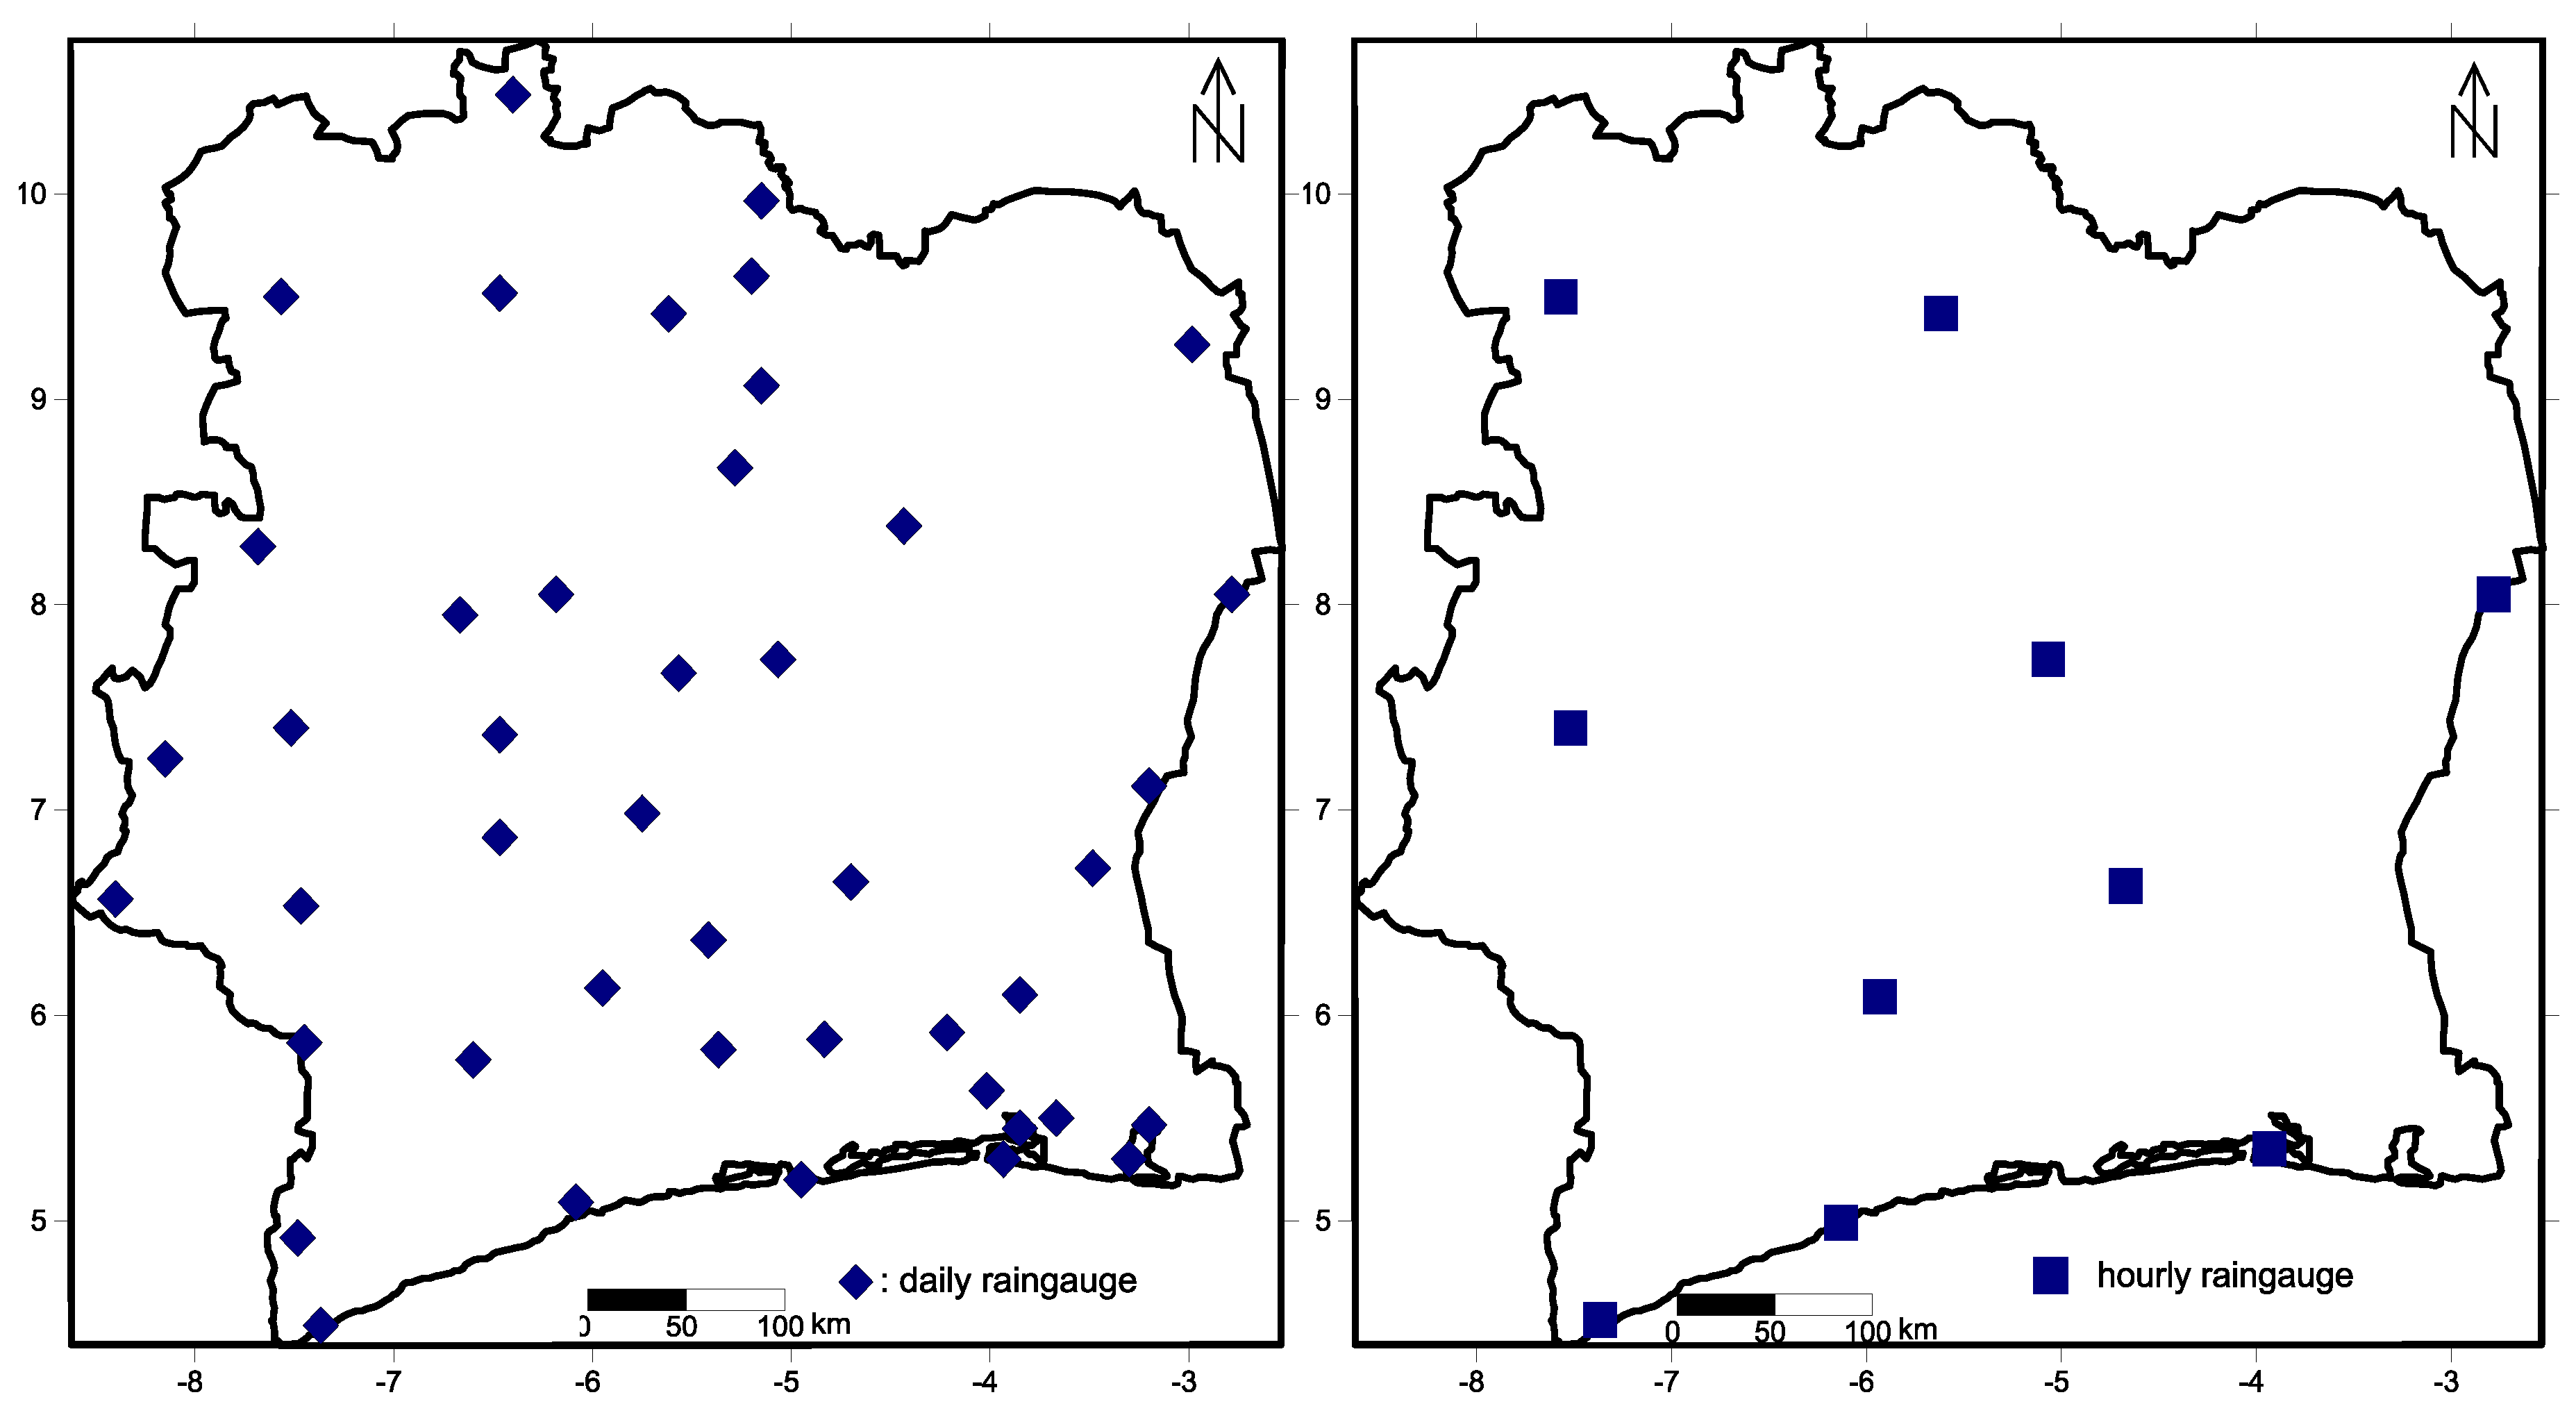
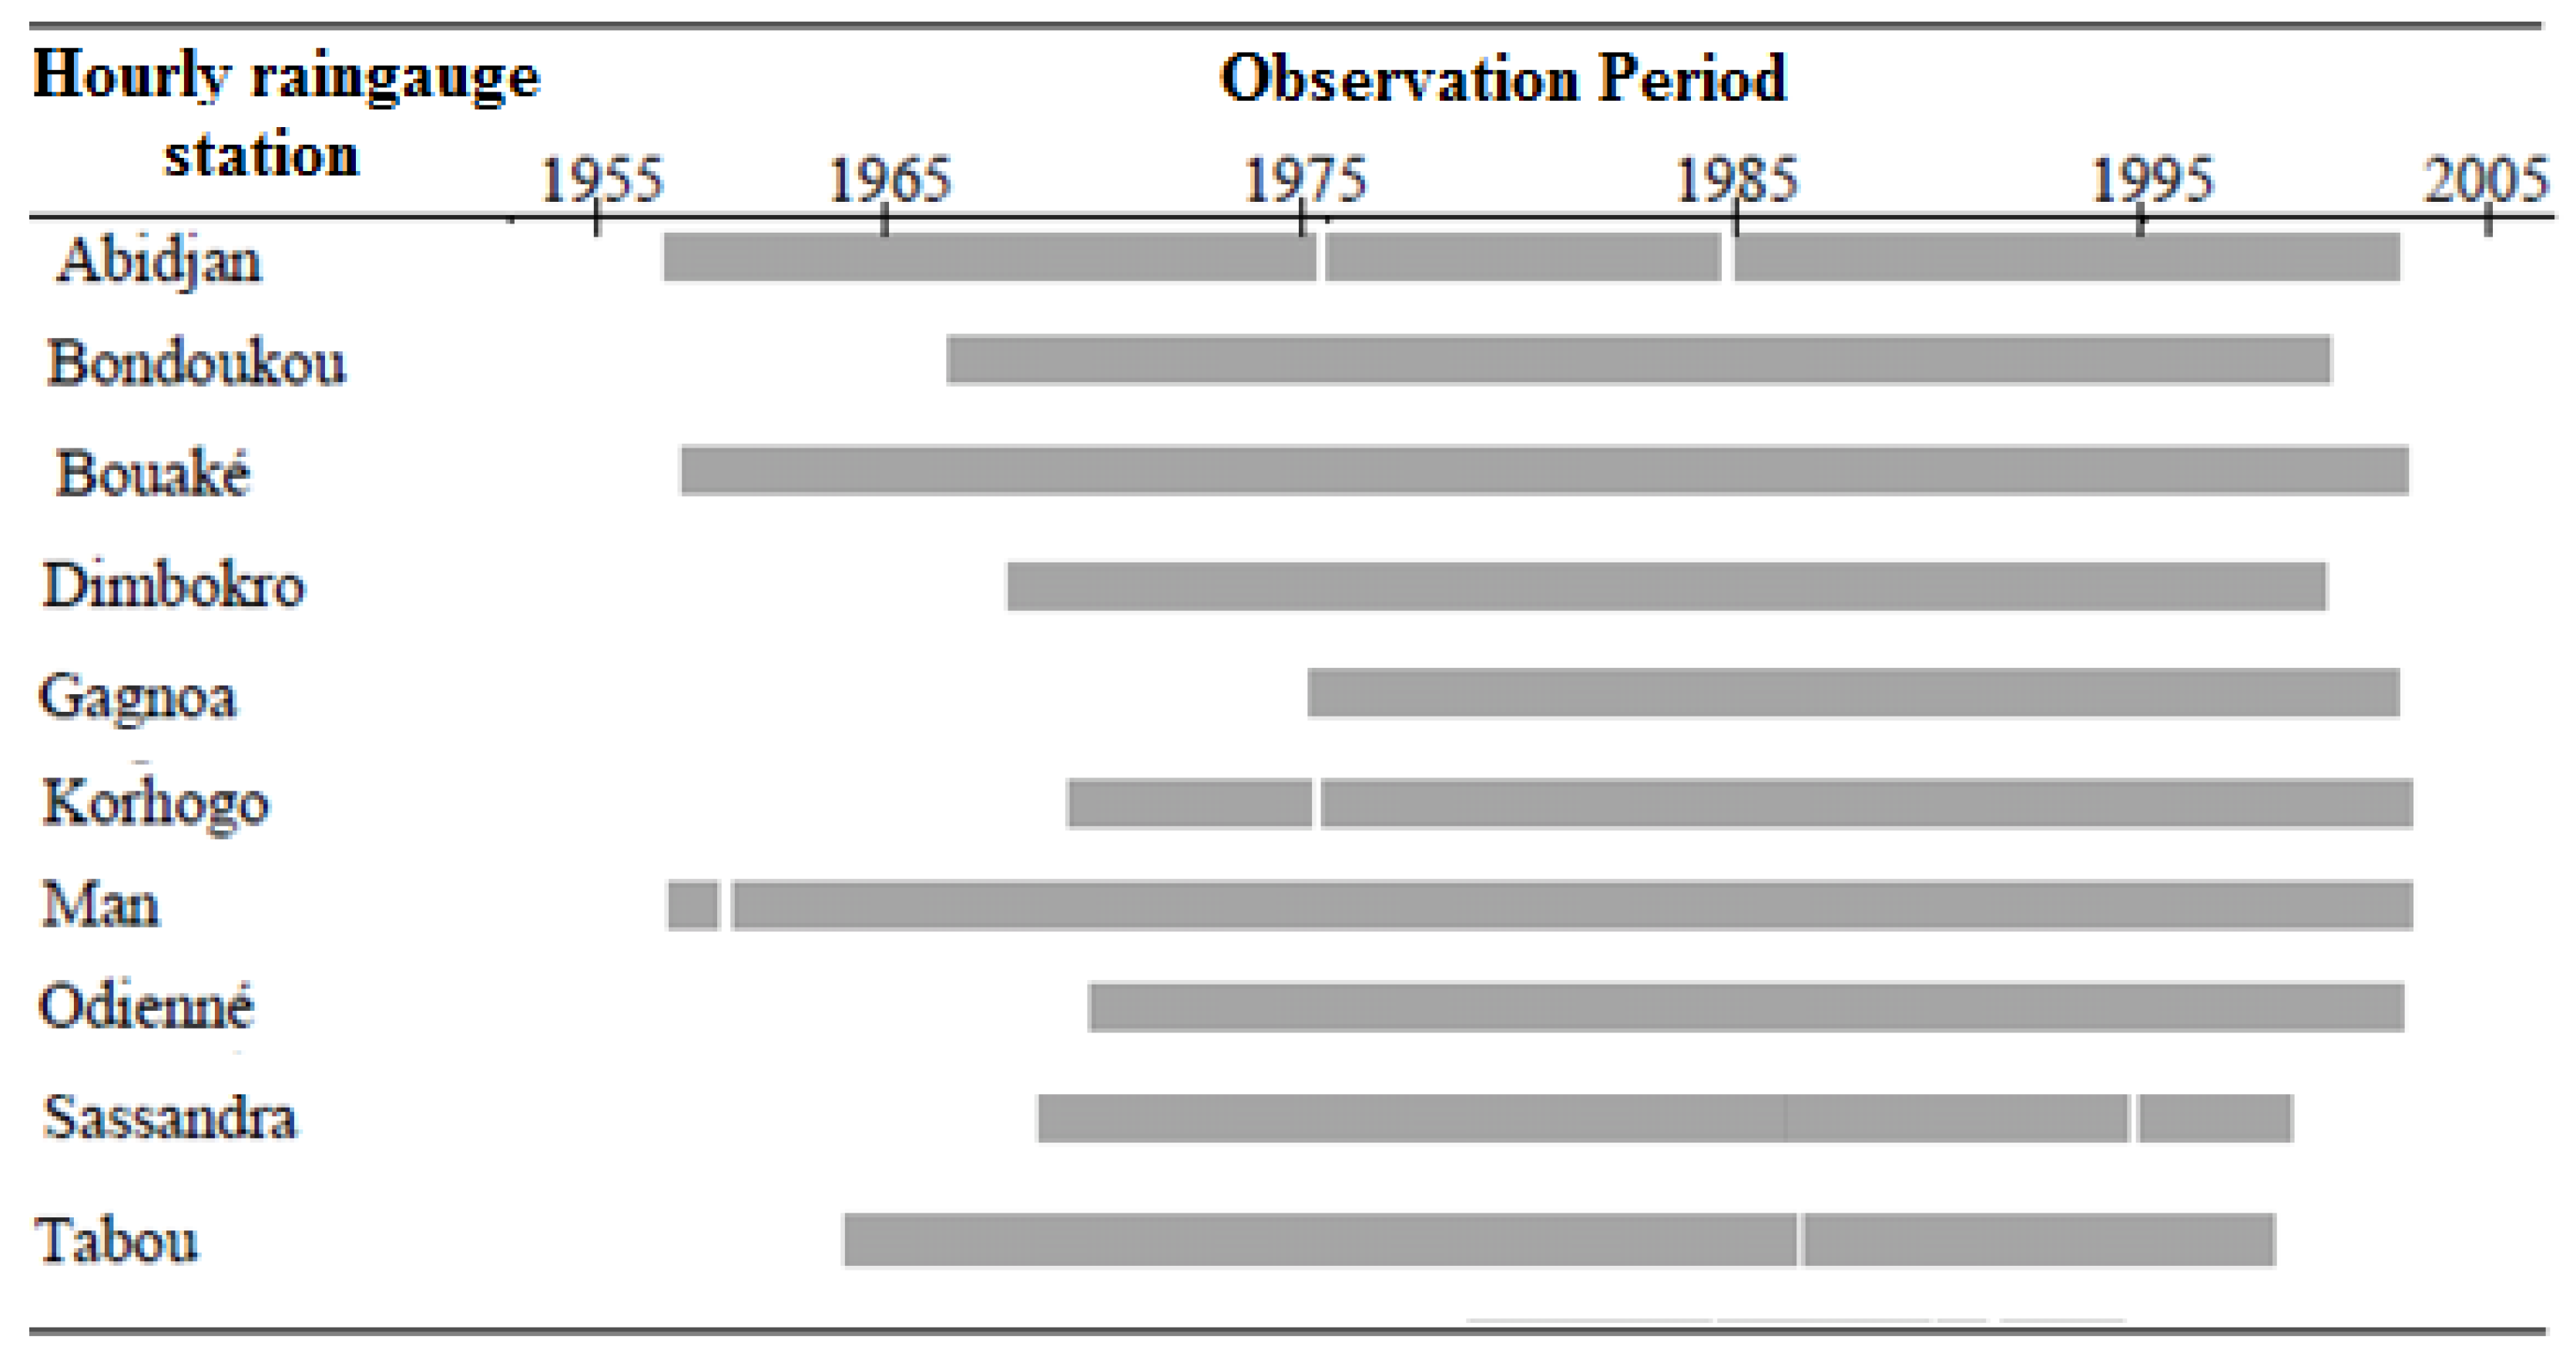
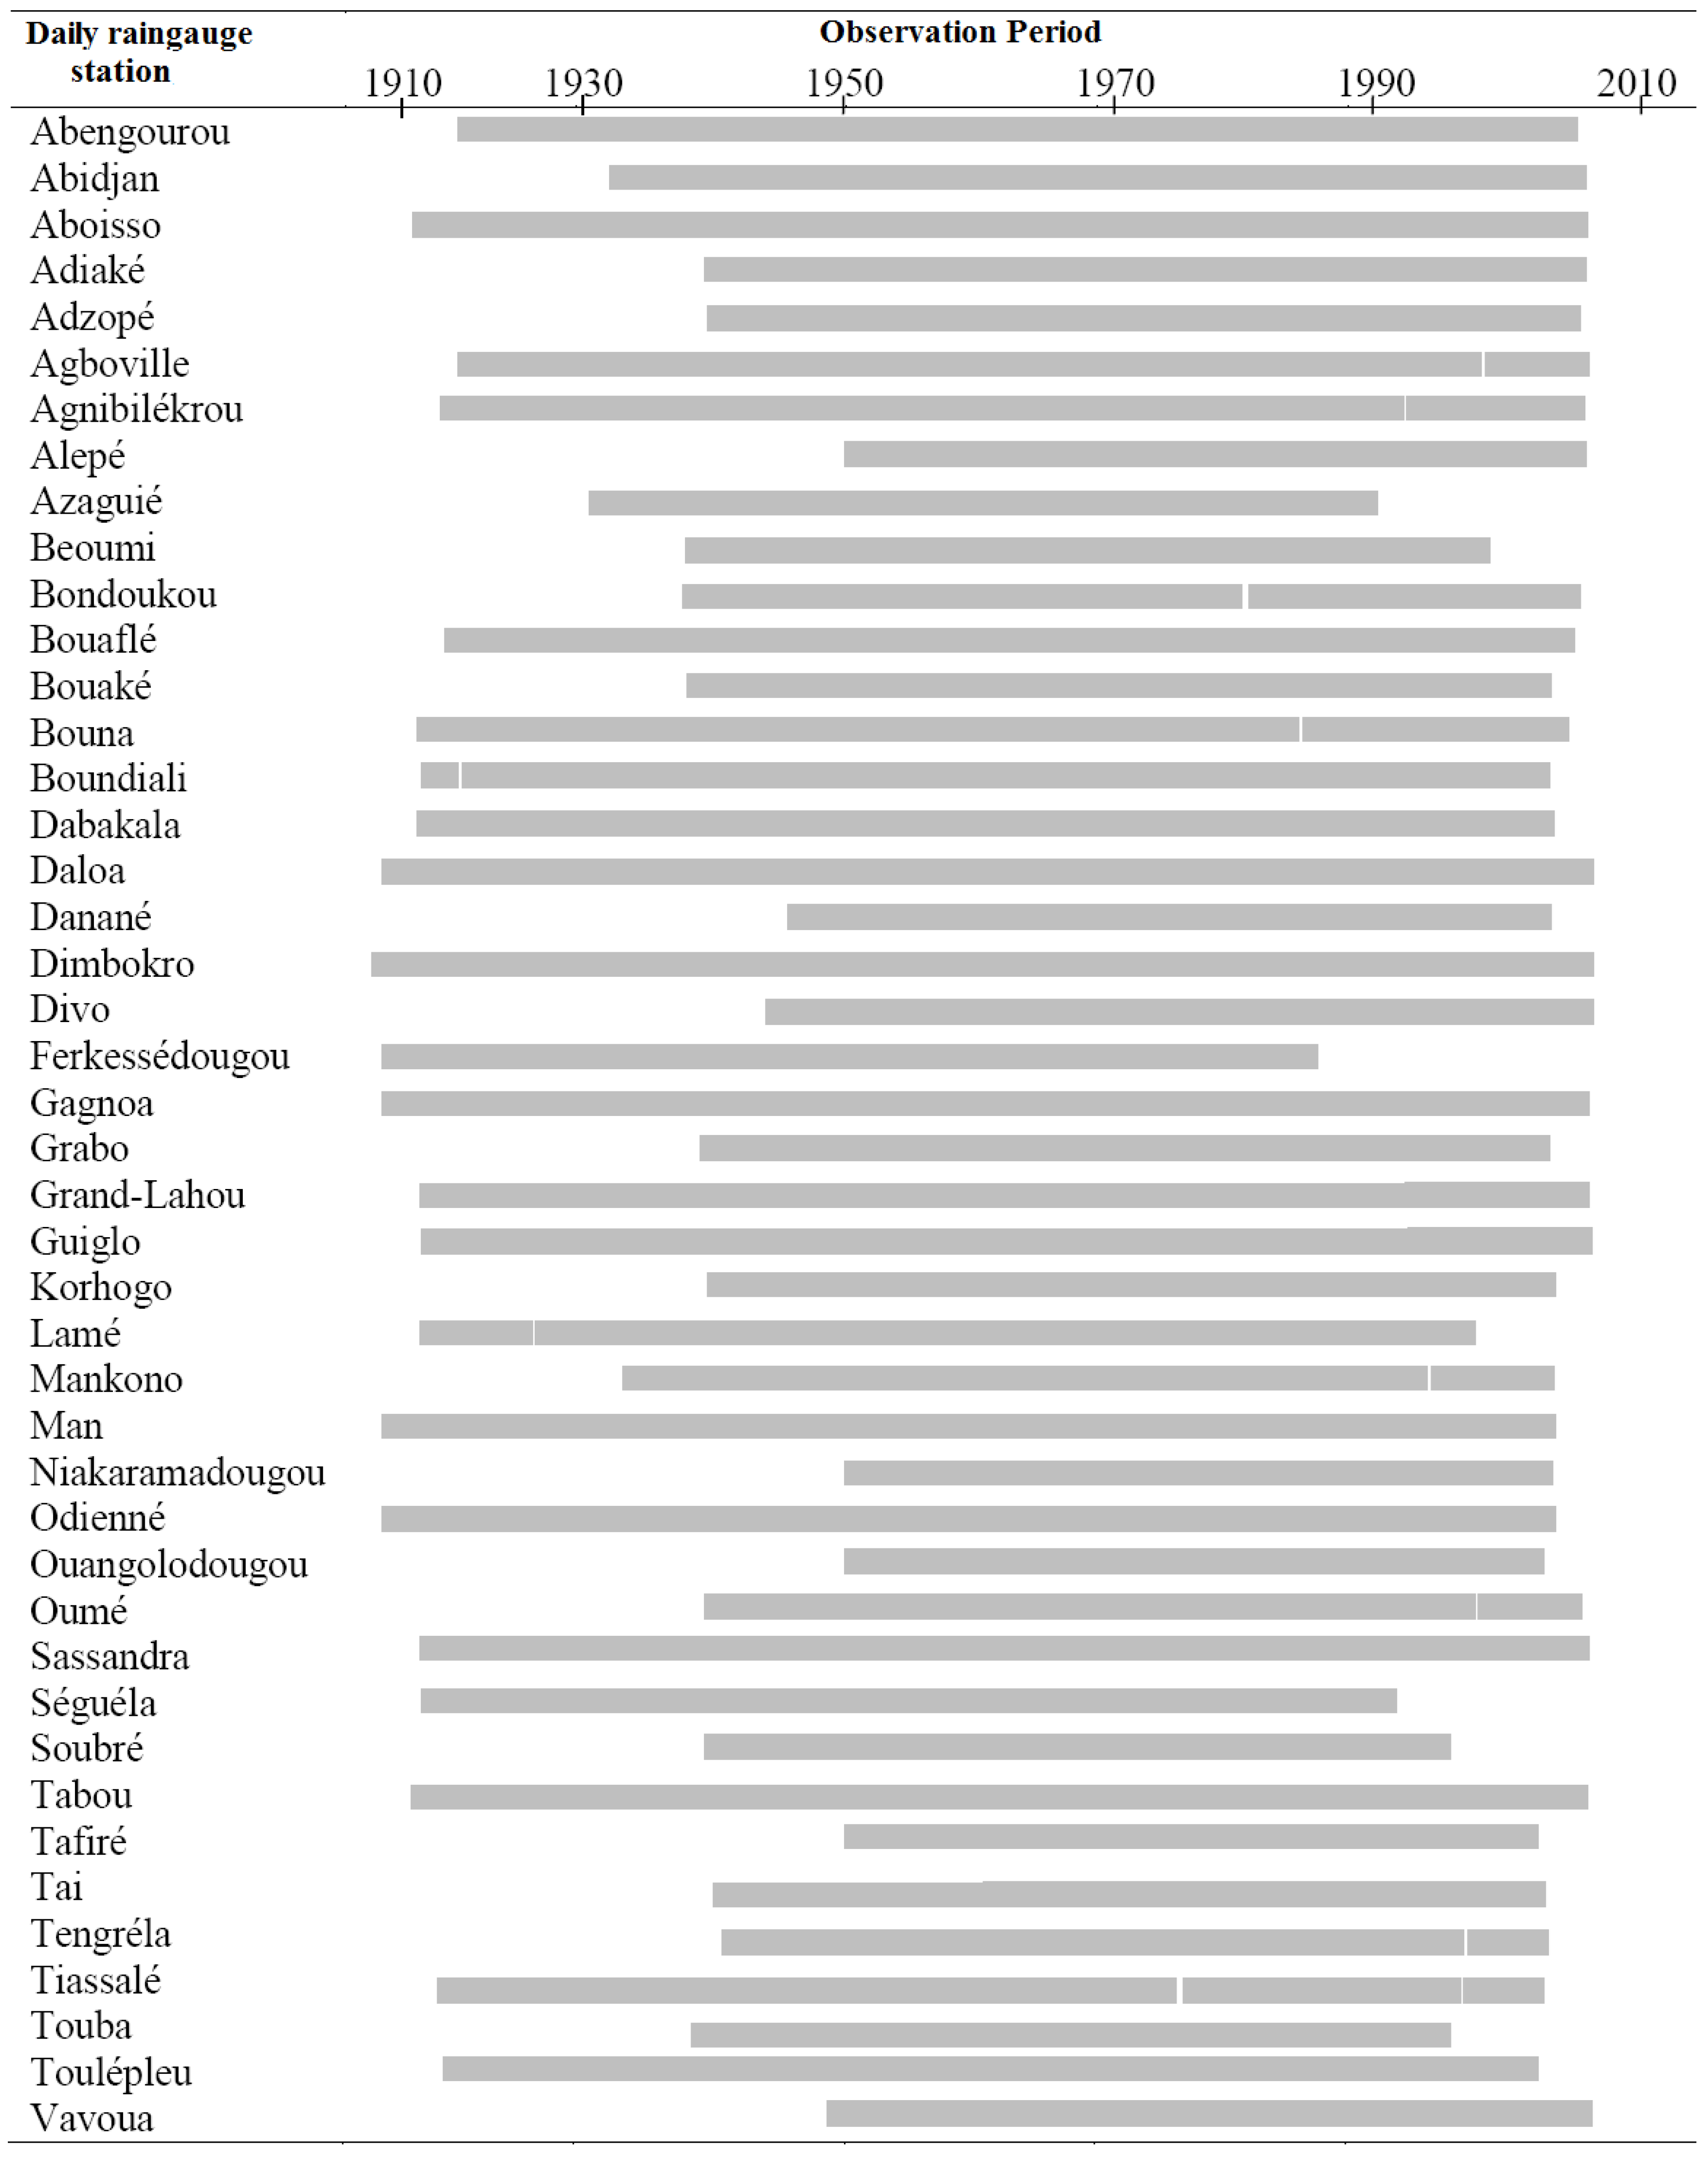
2.2. Datasets
2.3. Indices of Climate Extremes
2.4. Mann-Kendall Test and Linear Regression Method
3. Results
3.1. Trends in Daily Extremes Rainfalls
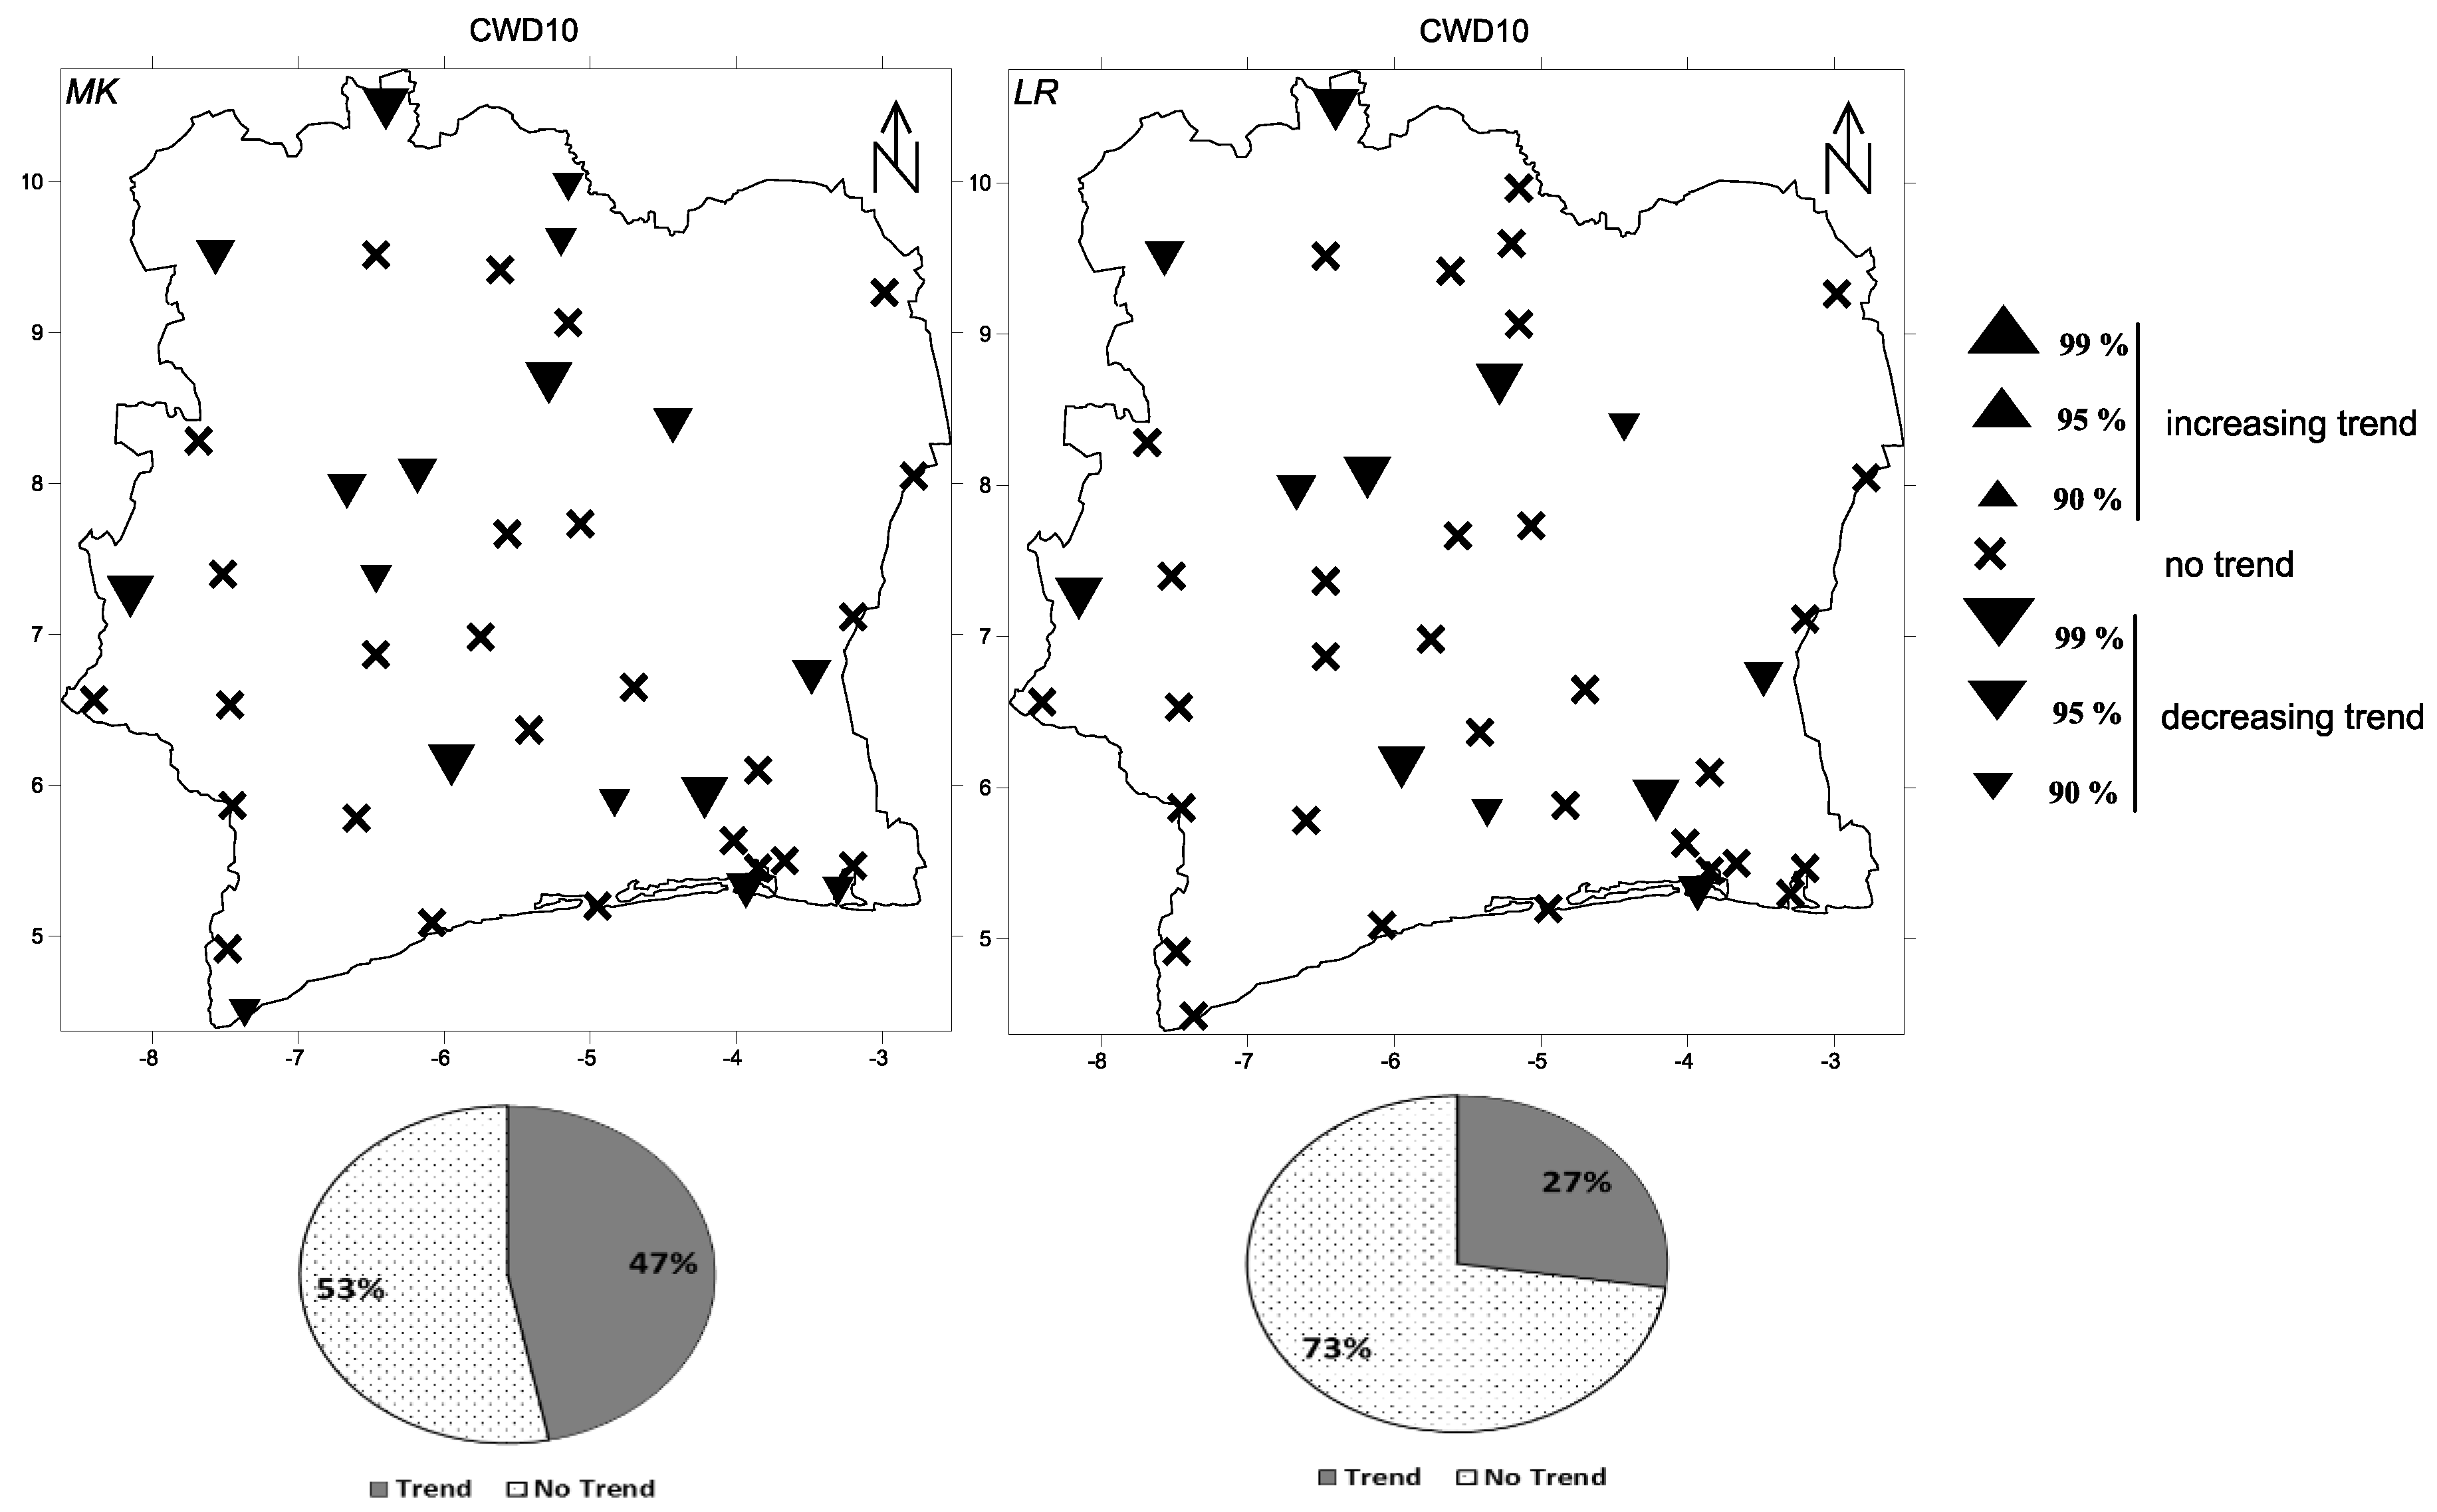
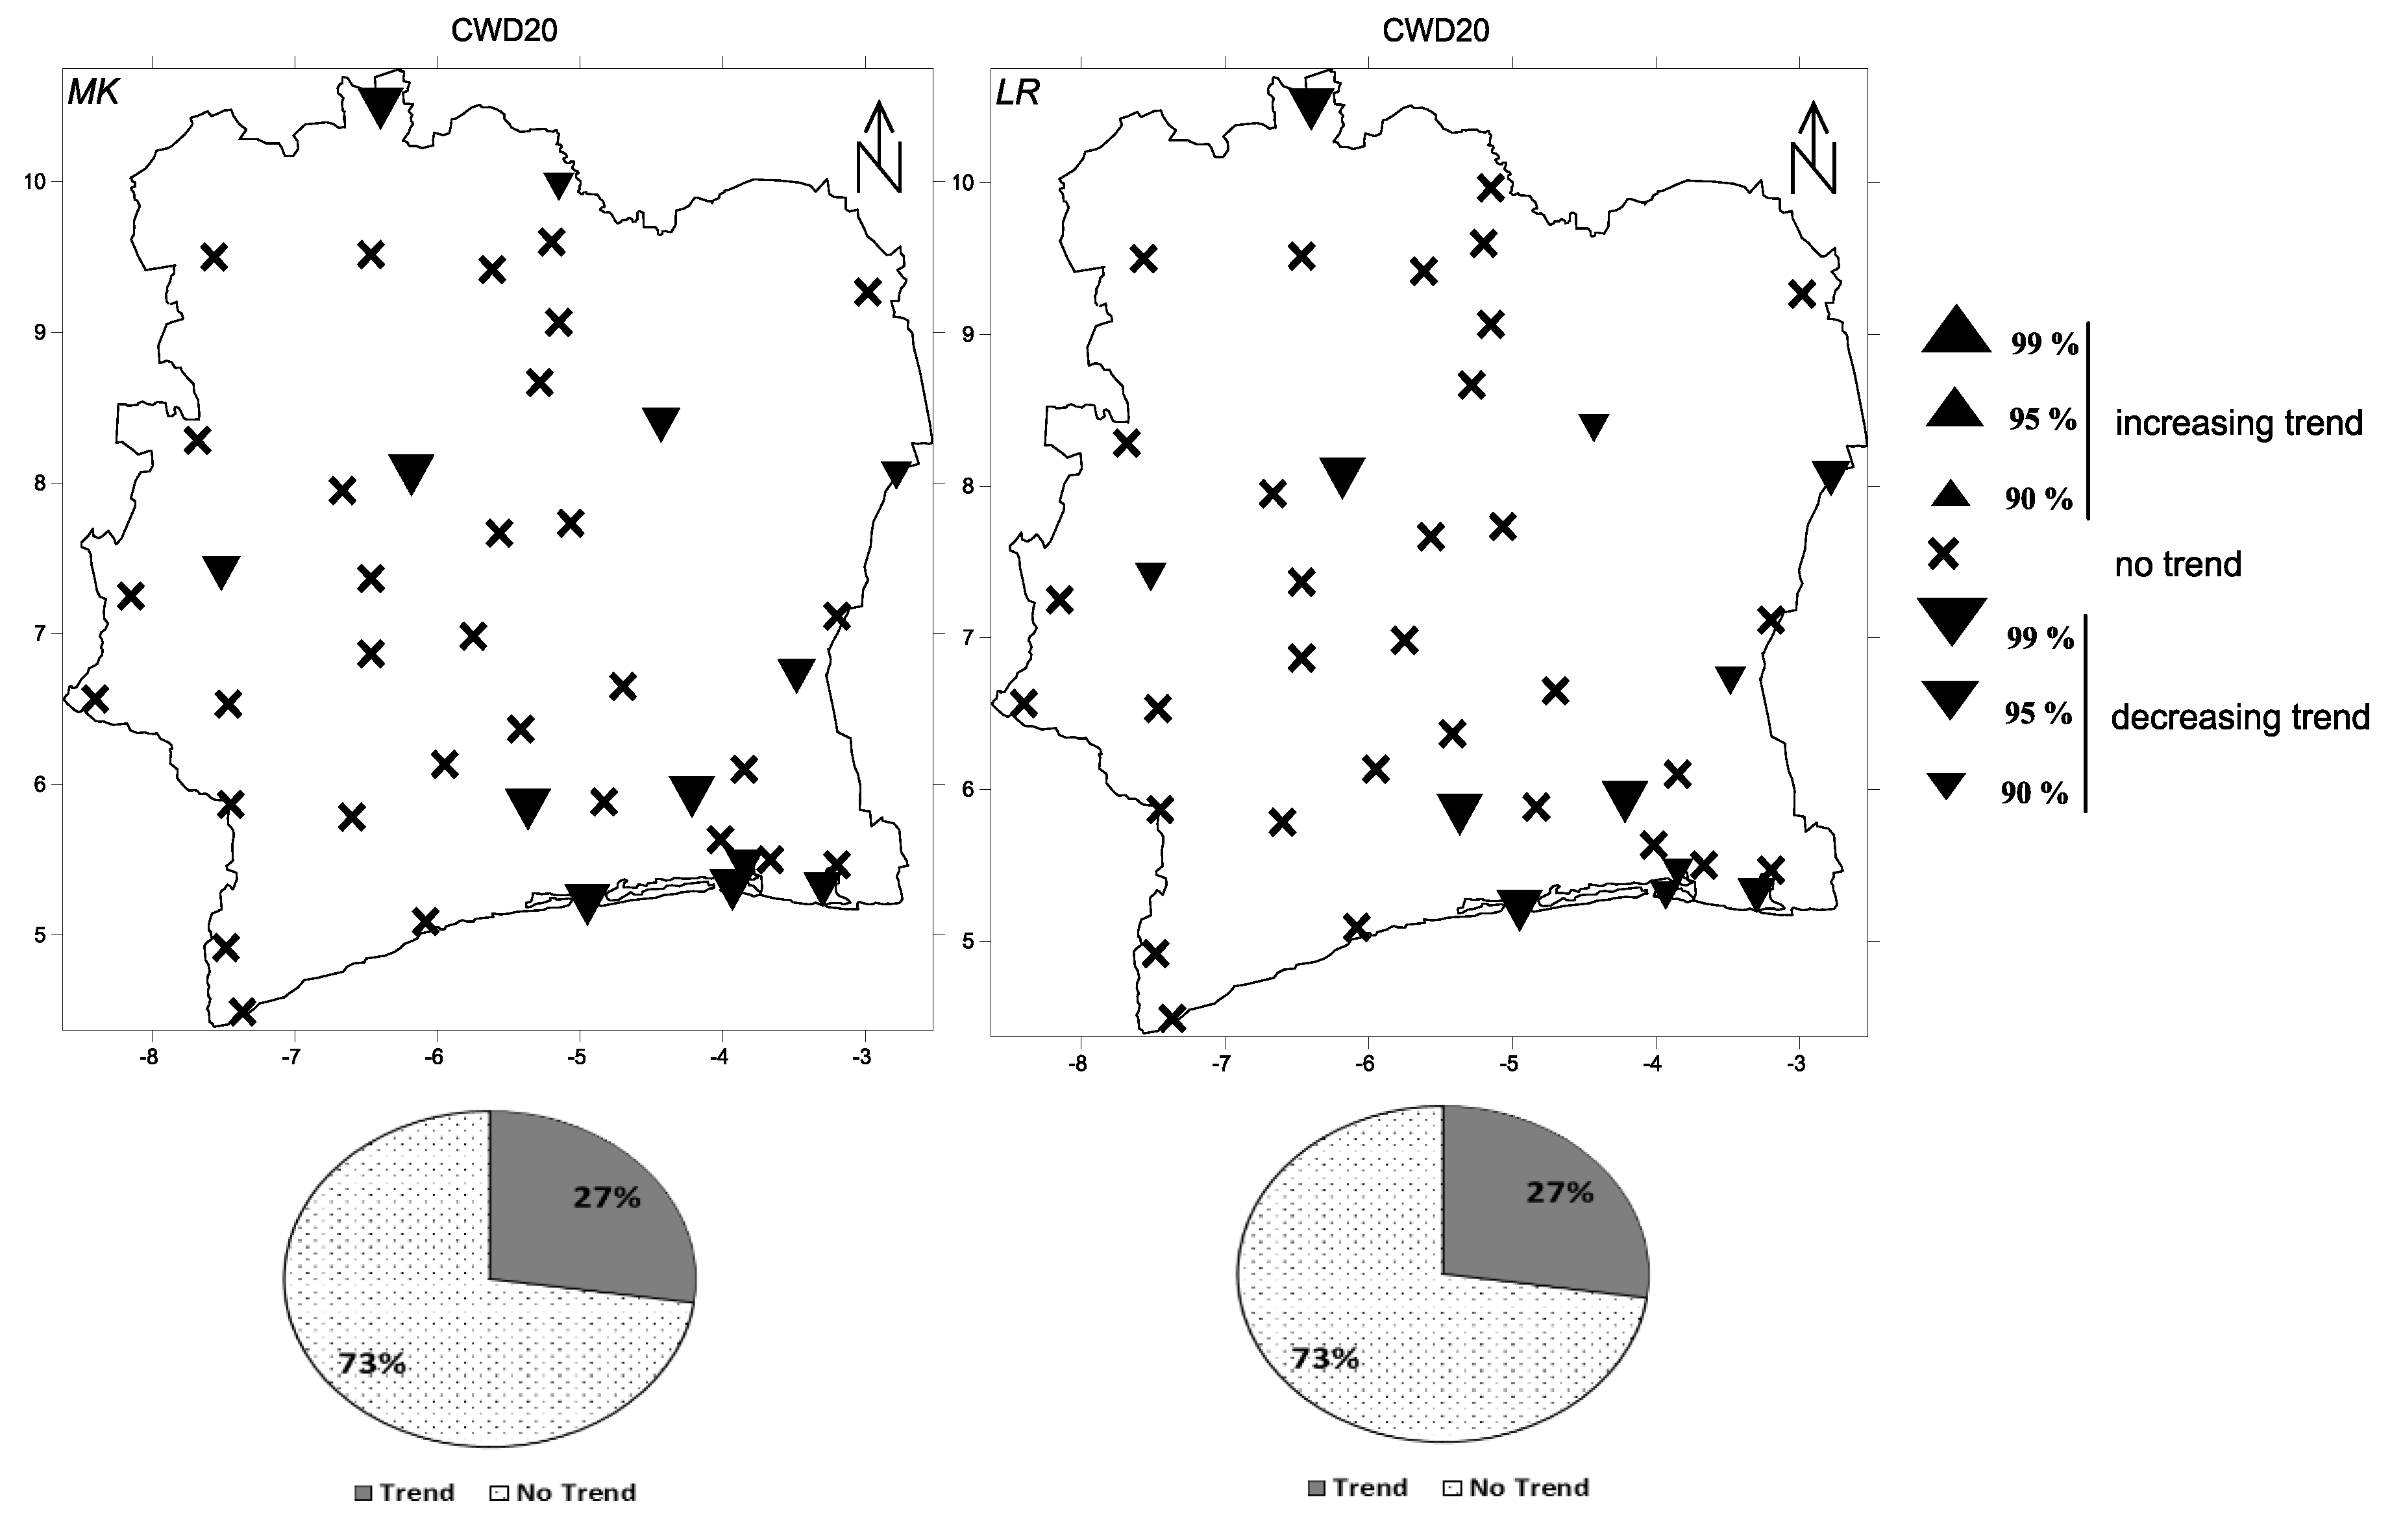
3.1.1. Consecutive Wet Days (Annual Scale)
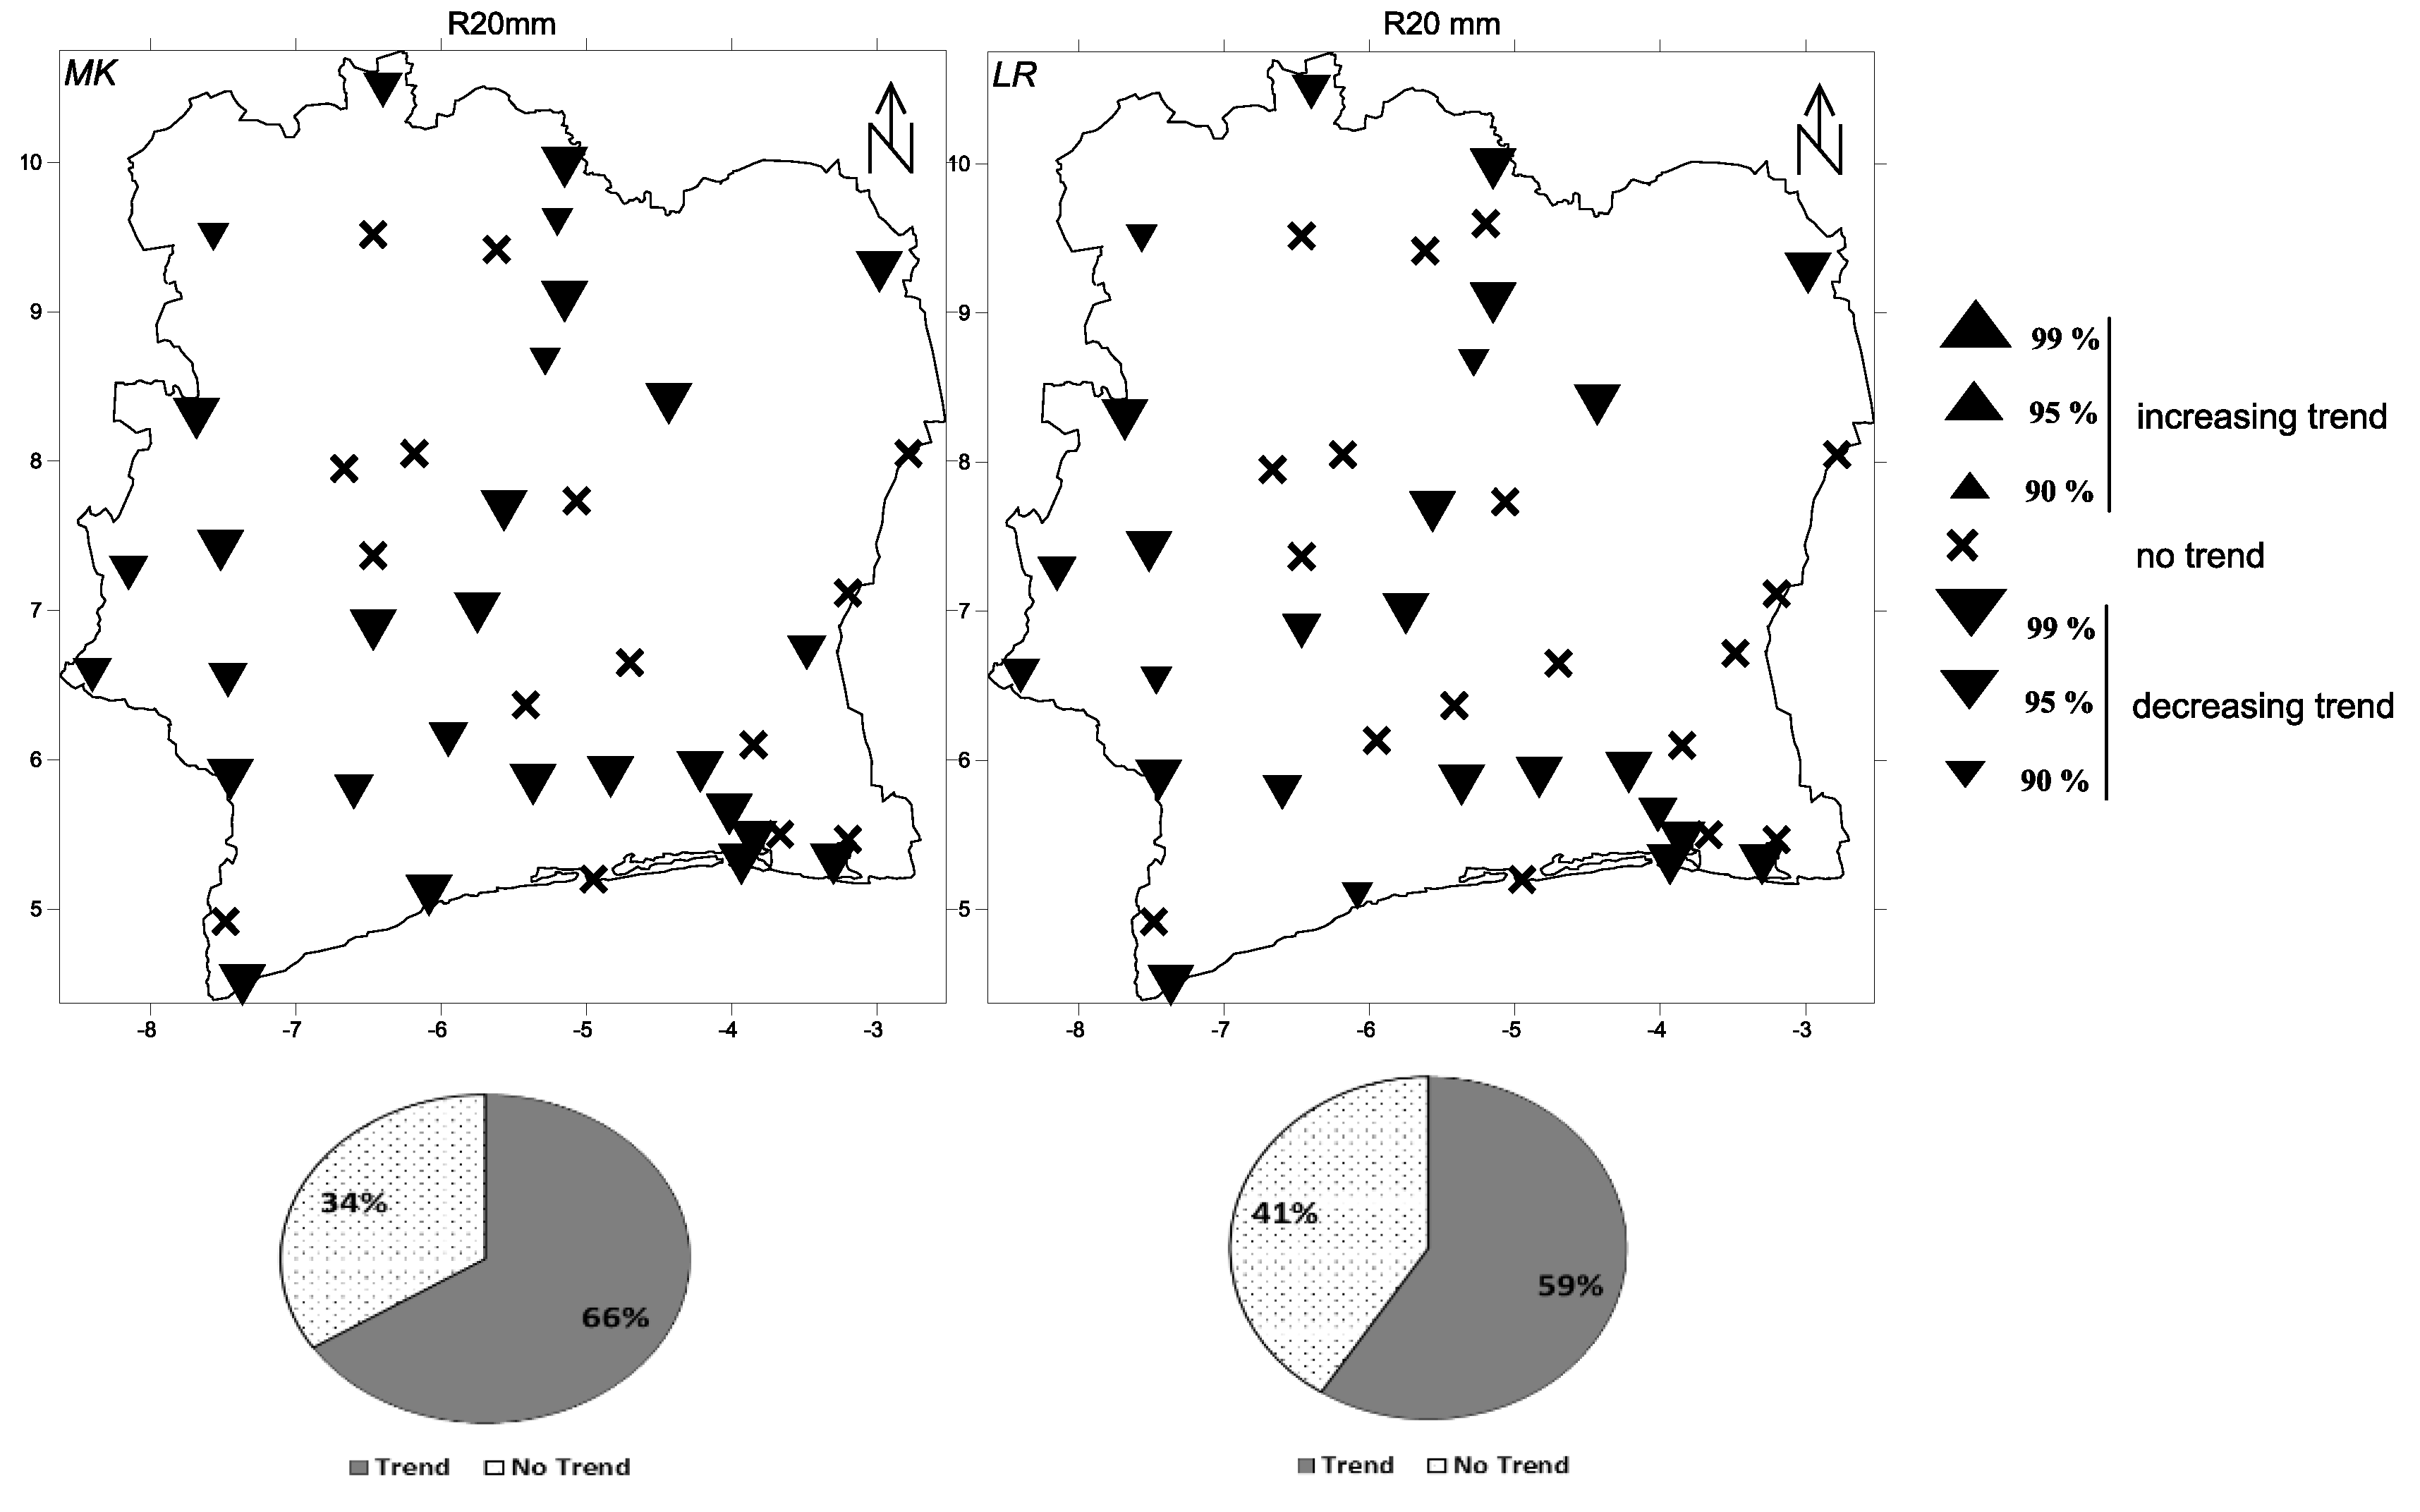
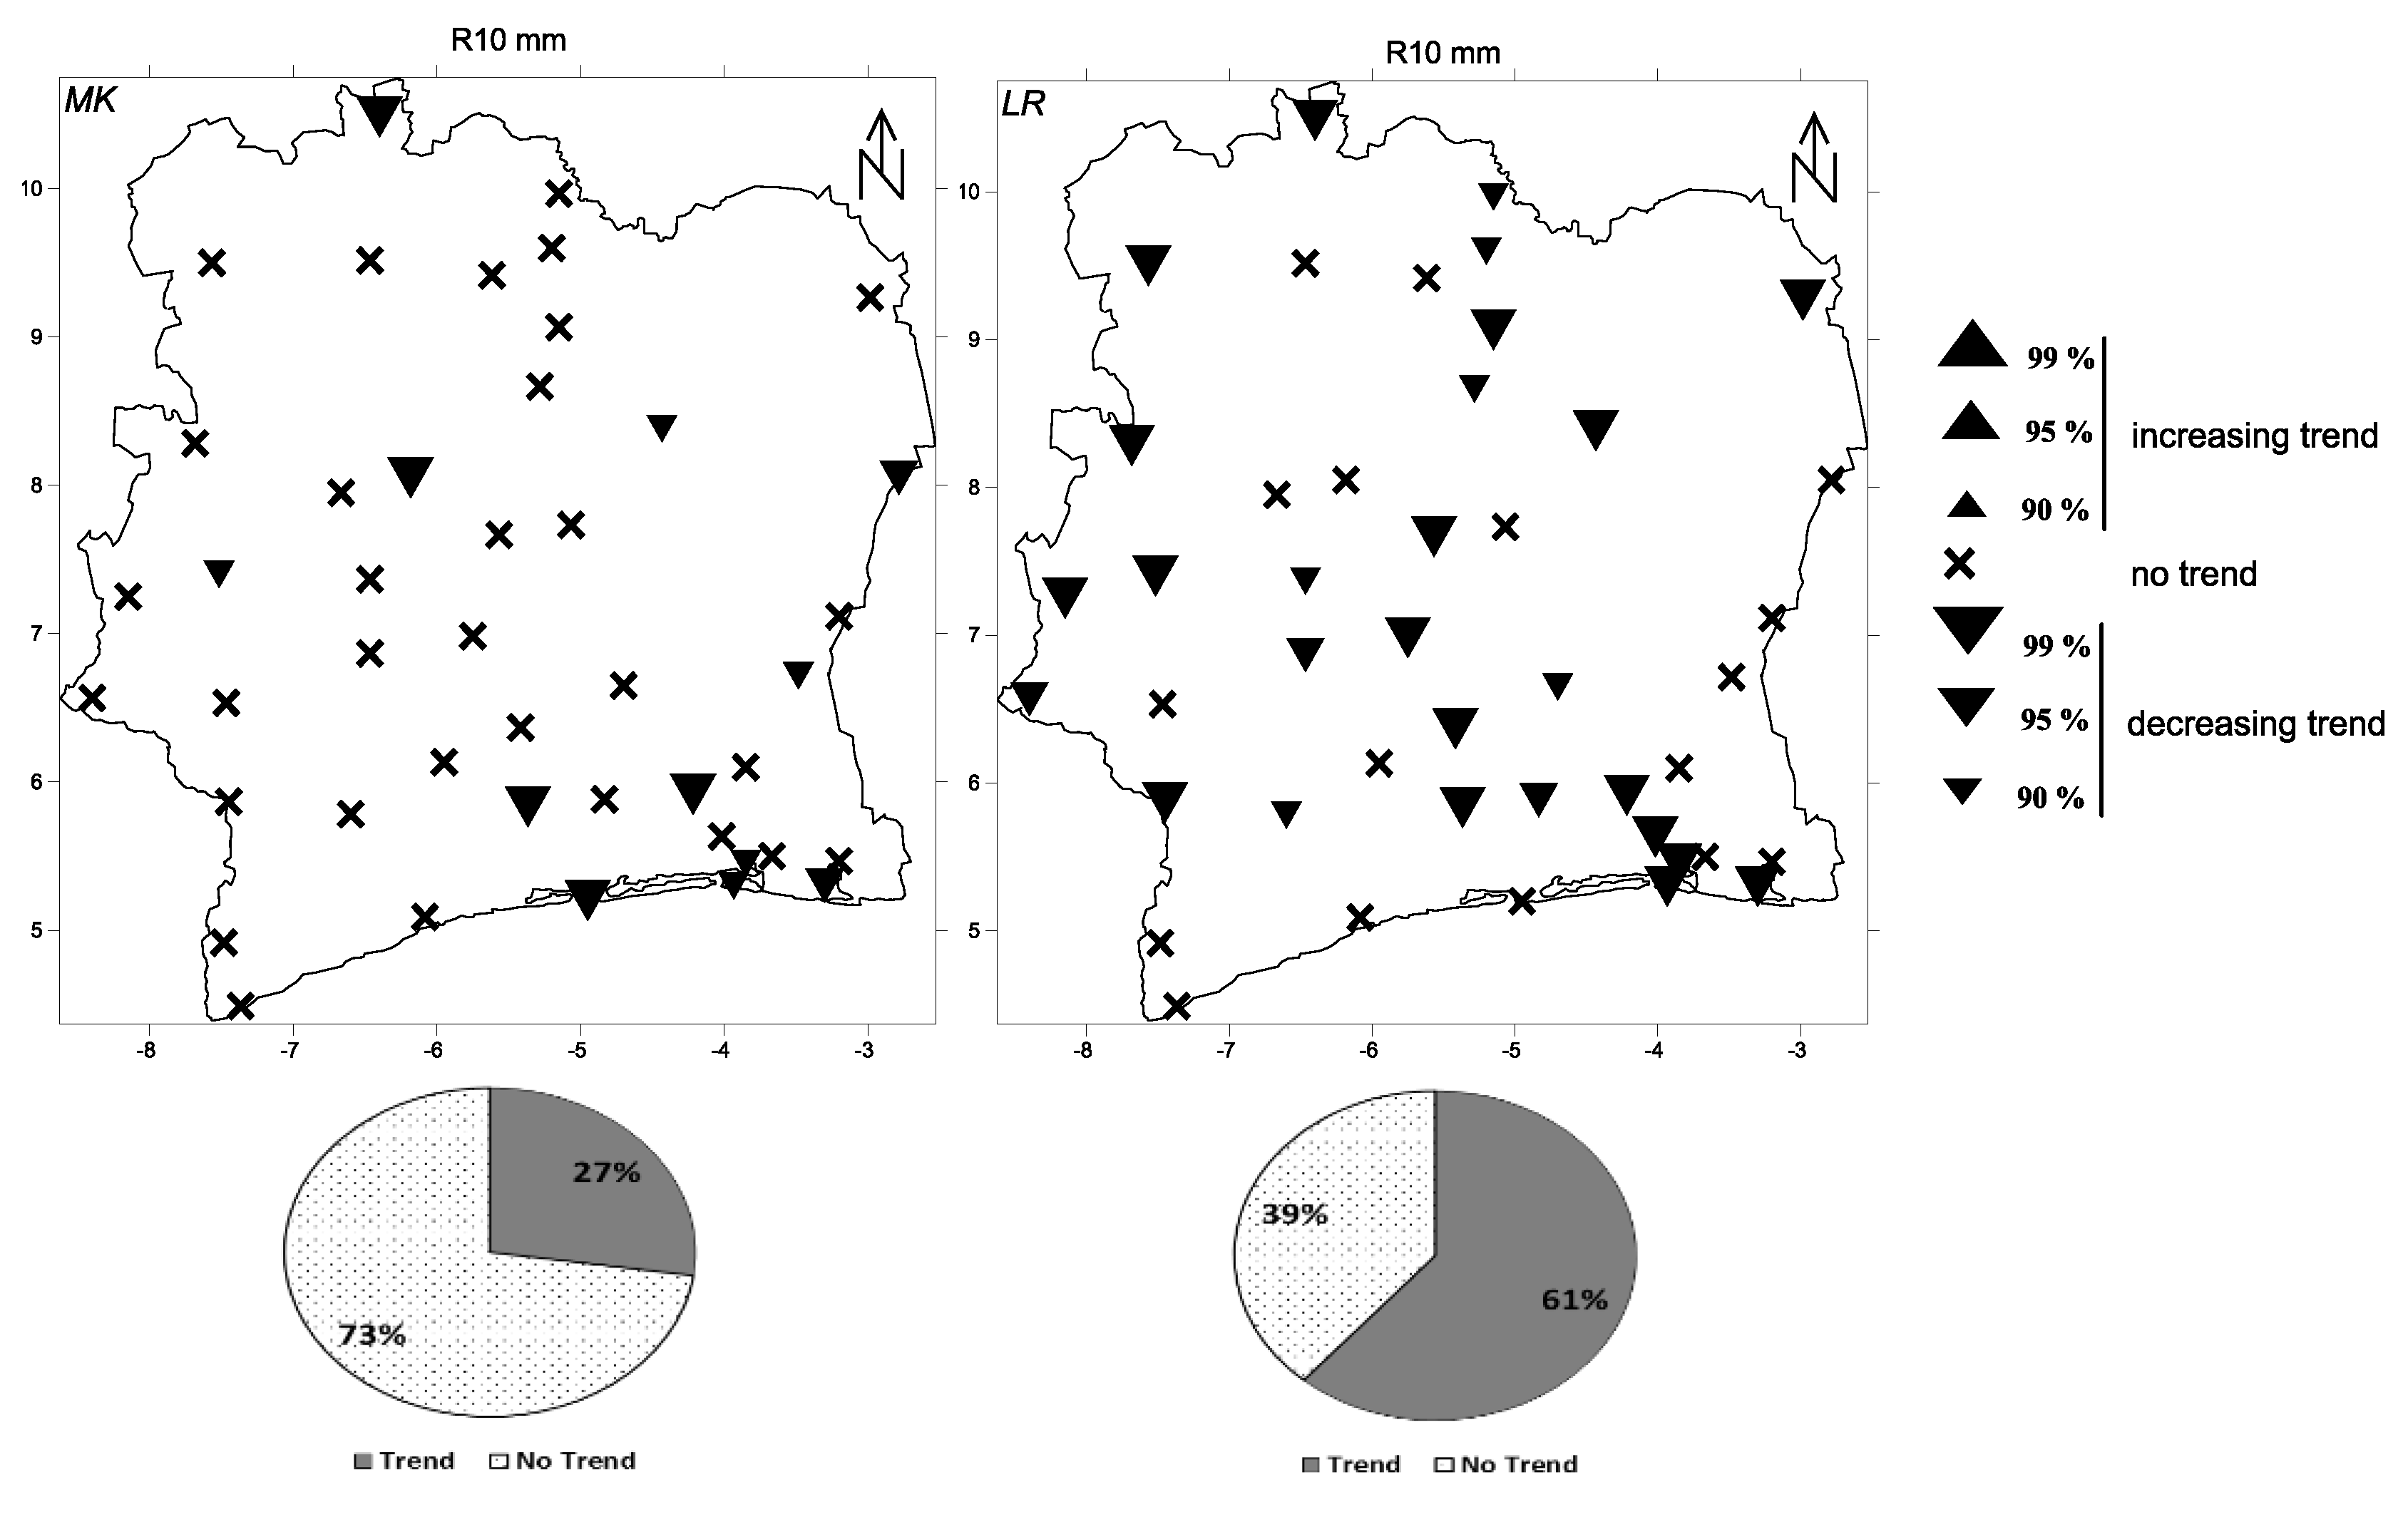
3.1.2. Number of Heavy Precipitation Days (Annual Scale)
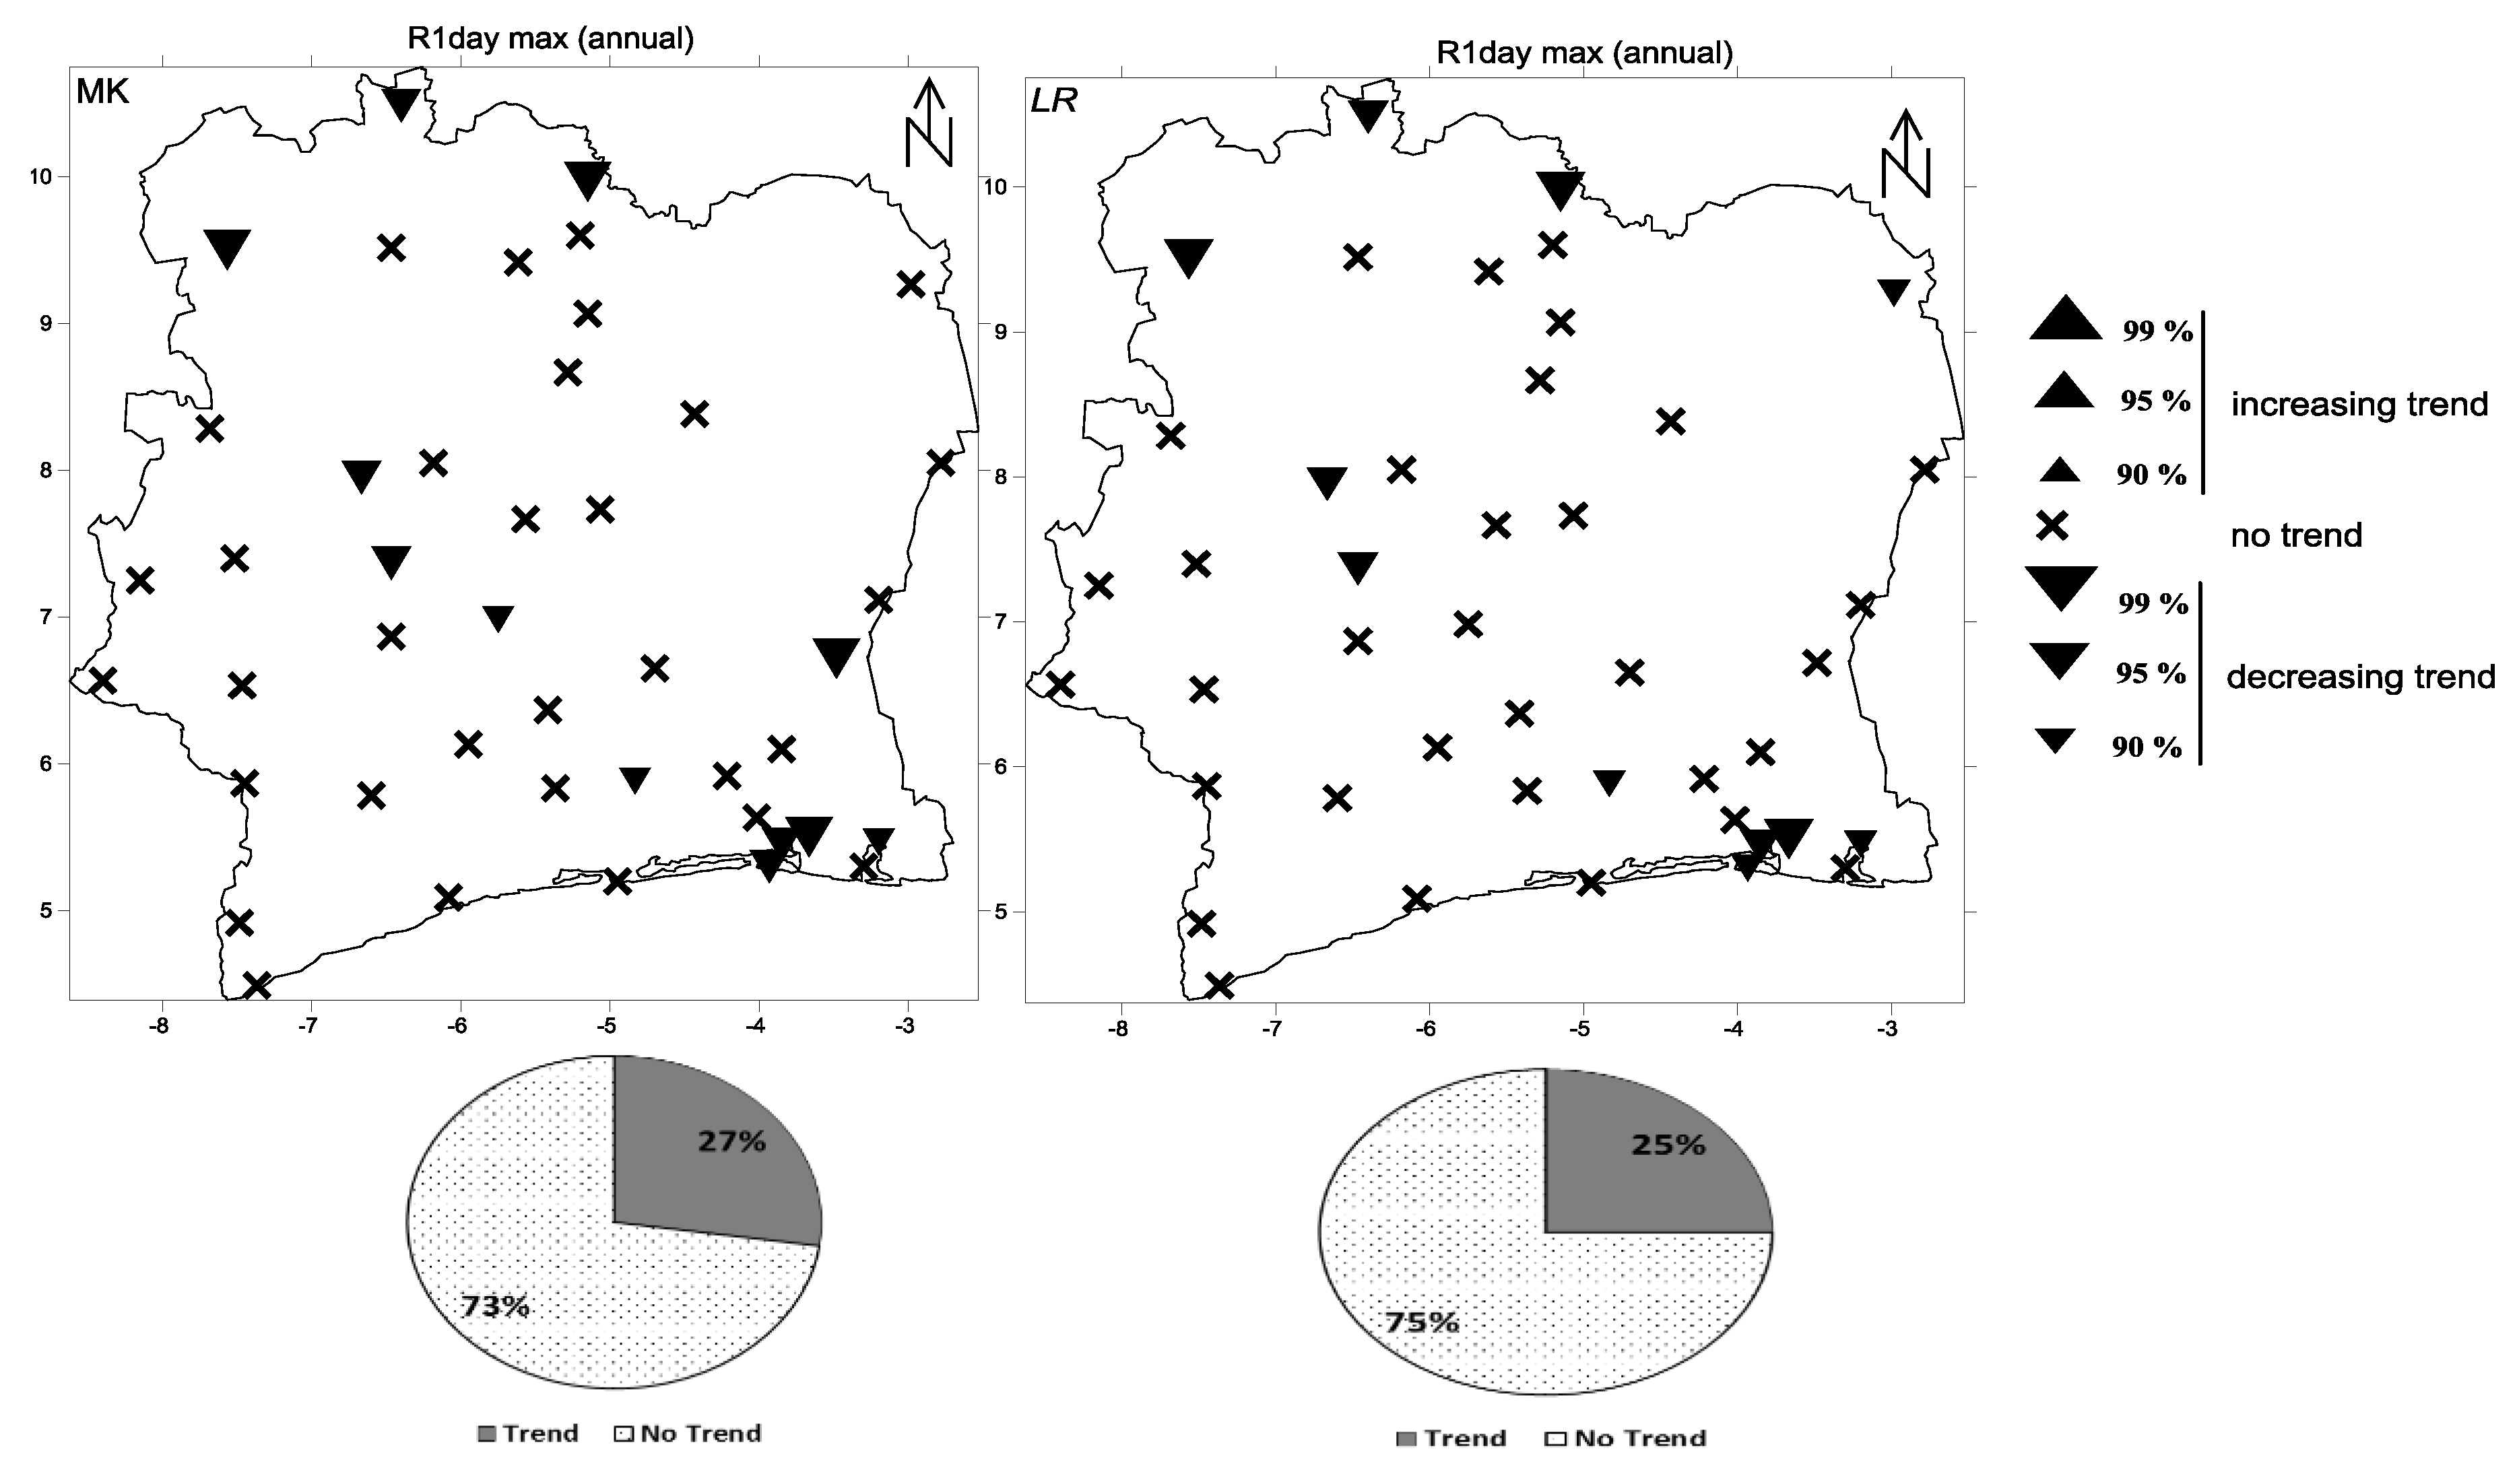
3.1.3. Maximum One-Day Precipitation (Annual Scale)
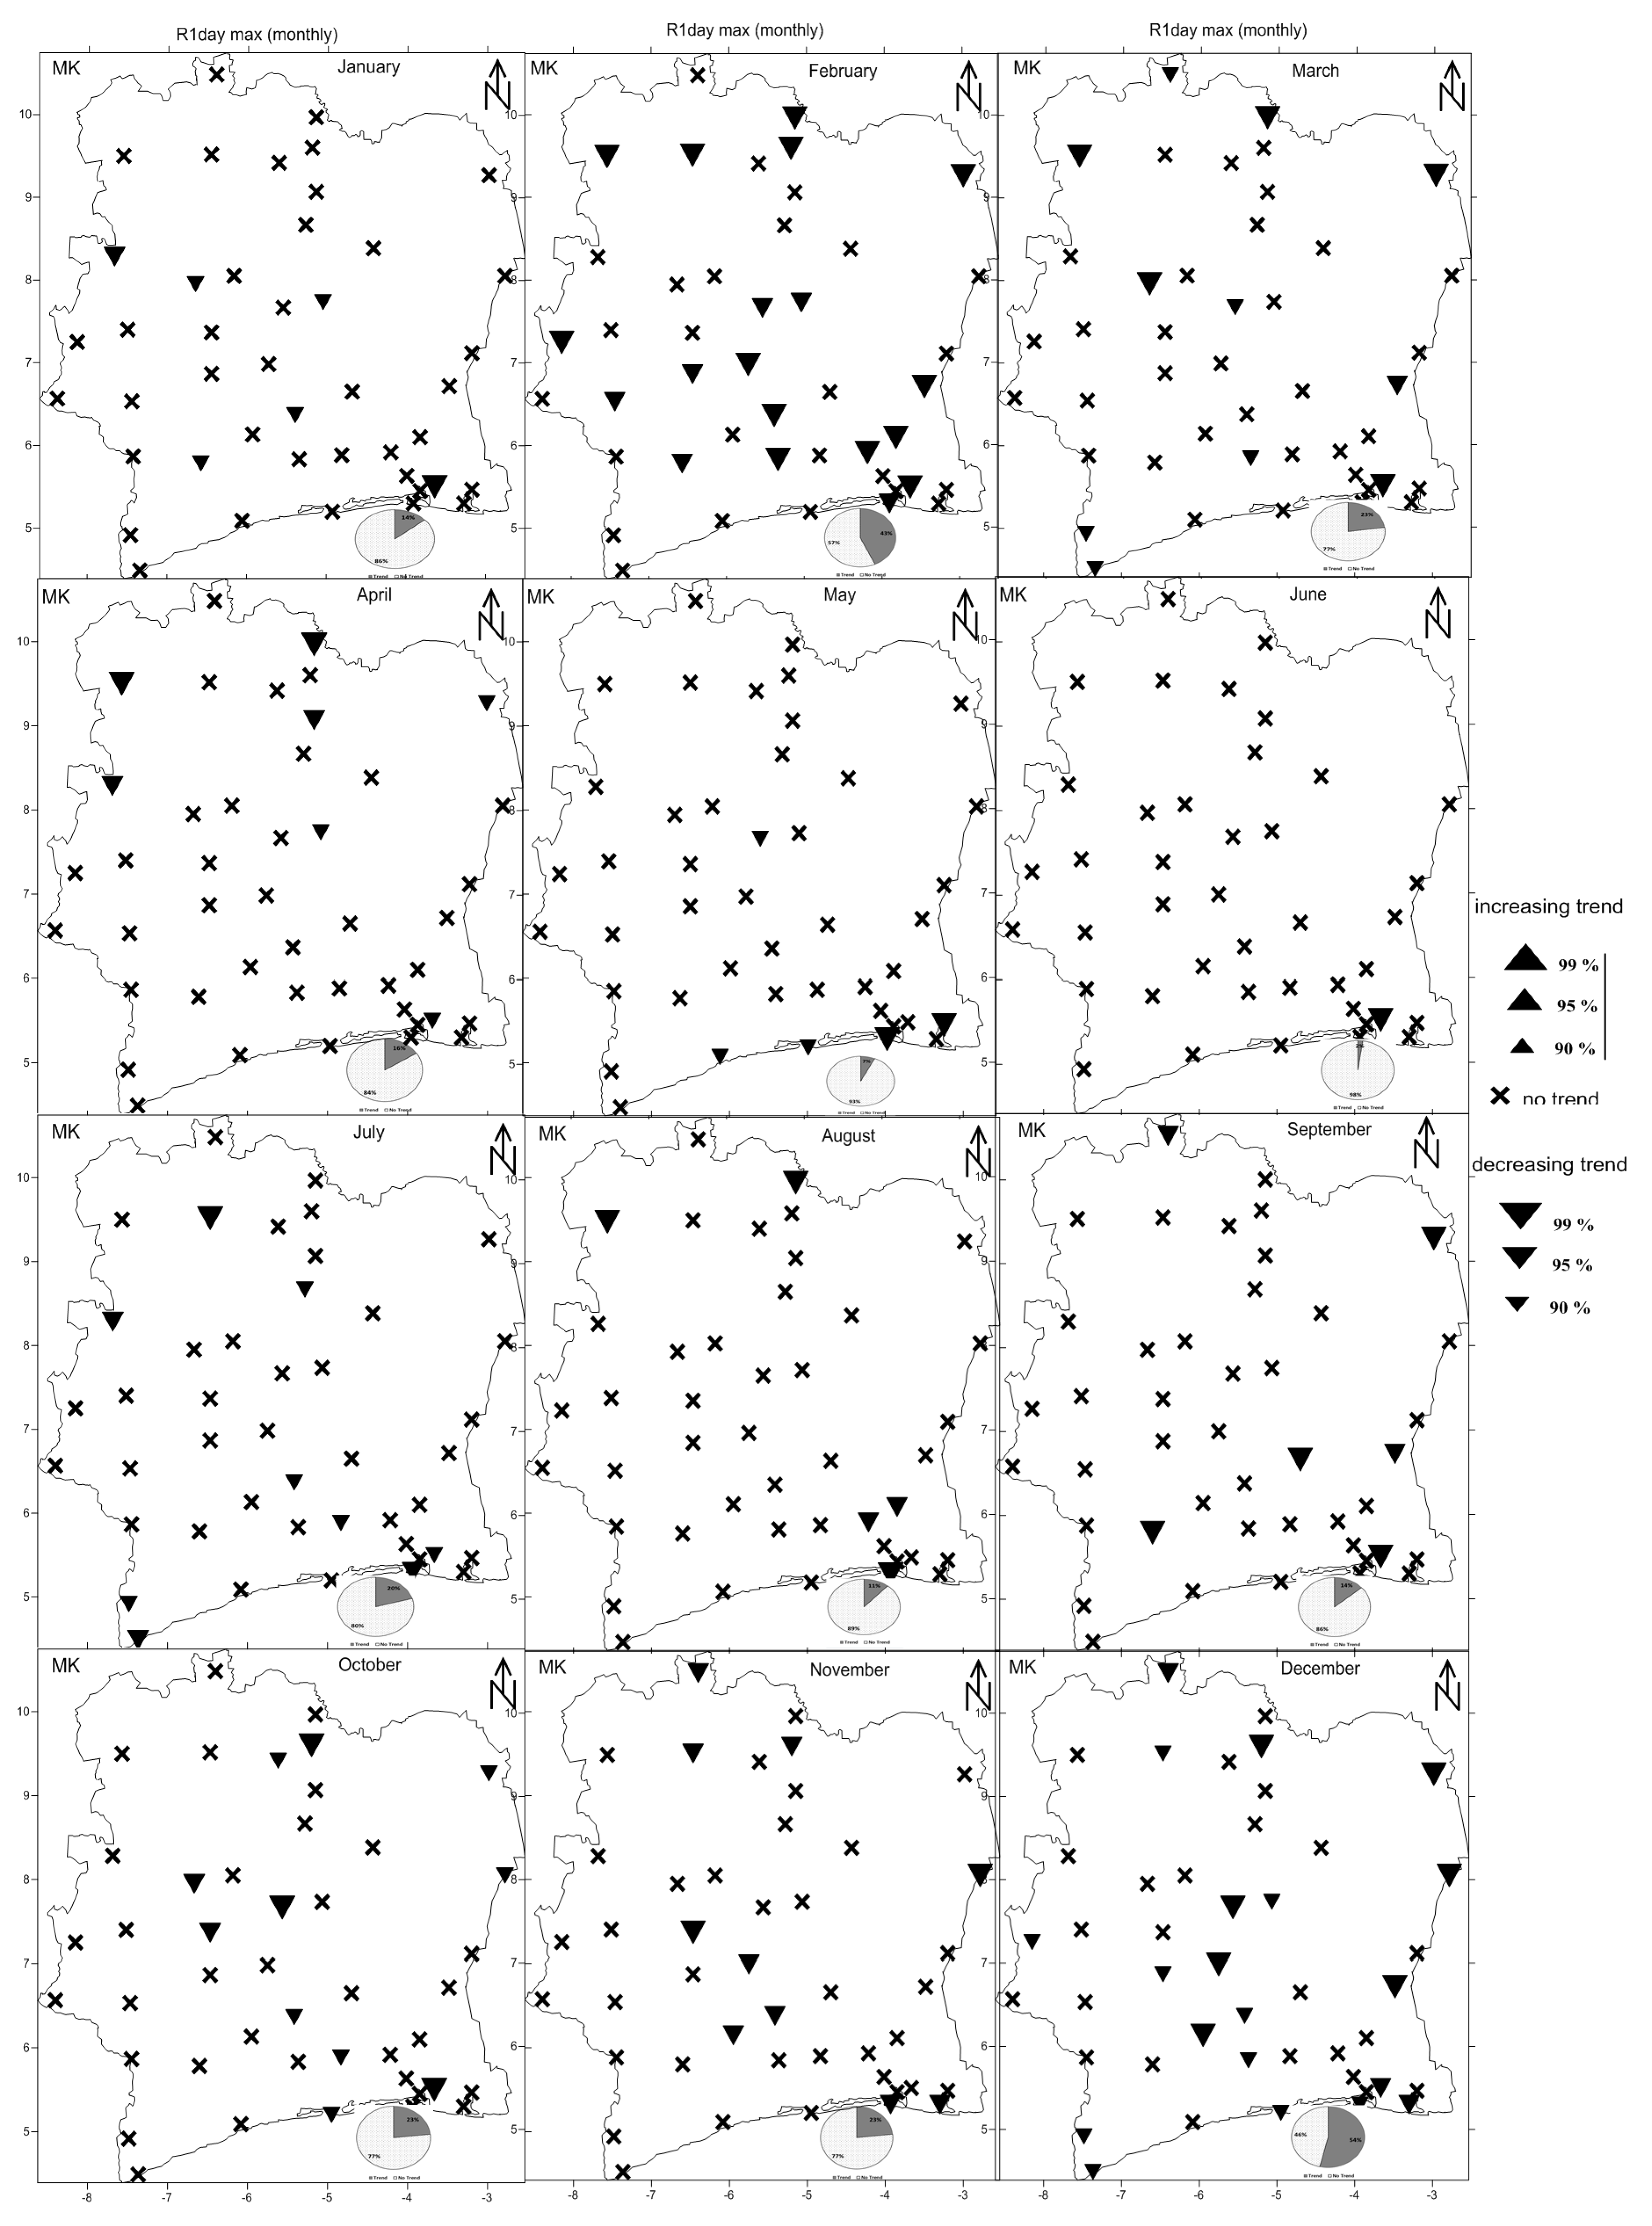
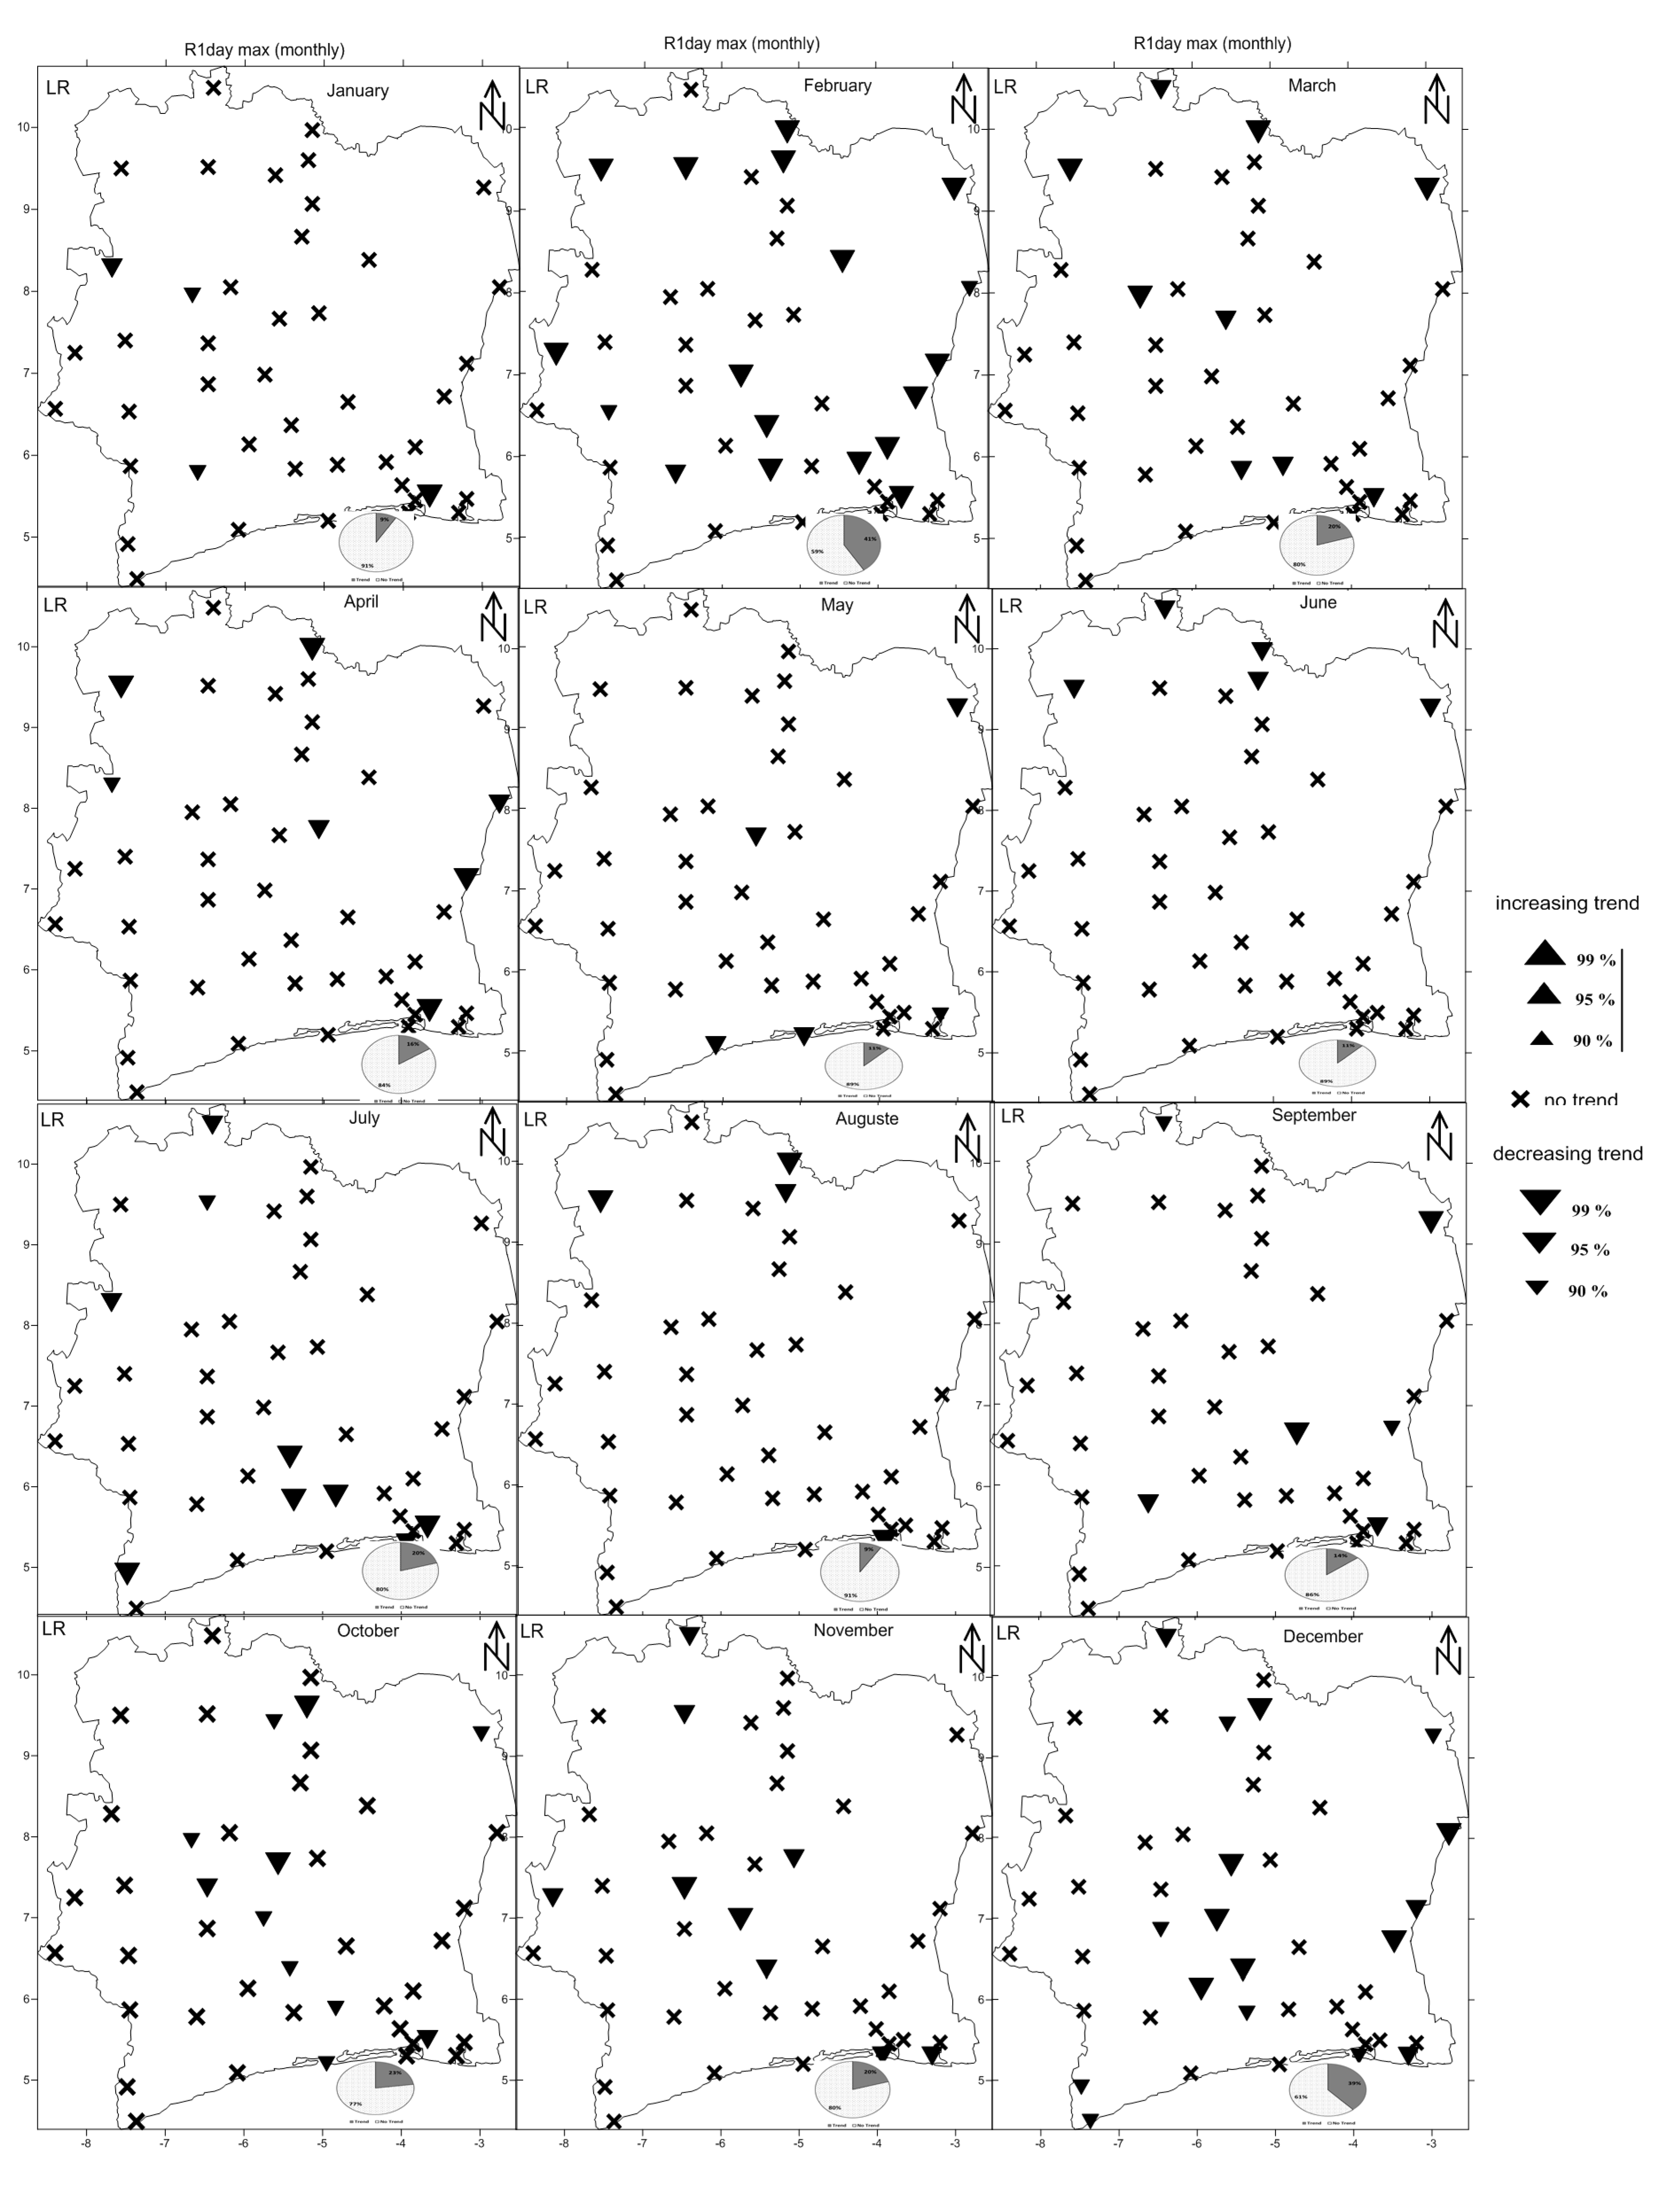
3.1.4. Maximum One-Day Precipitation (Monthly Scale)
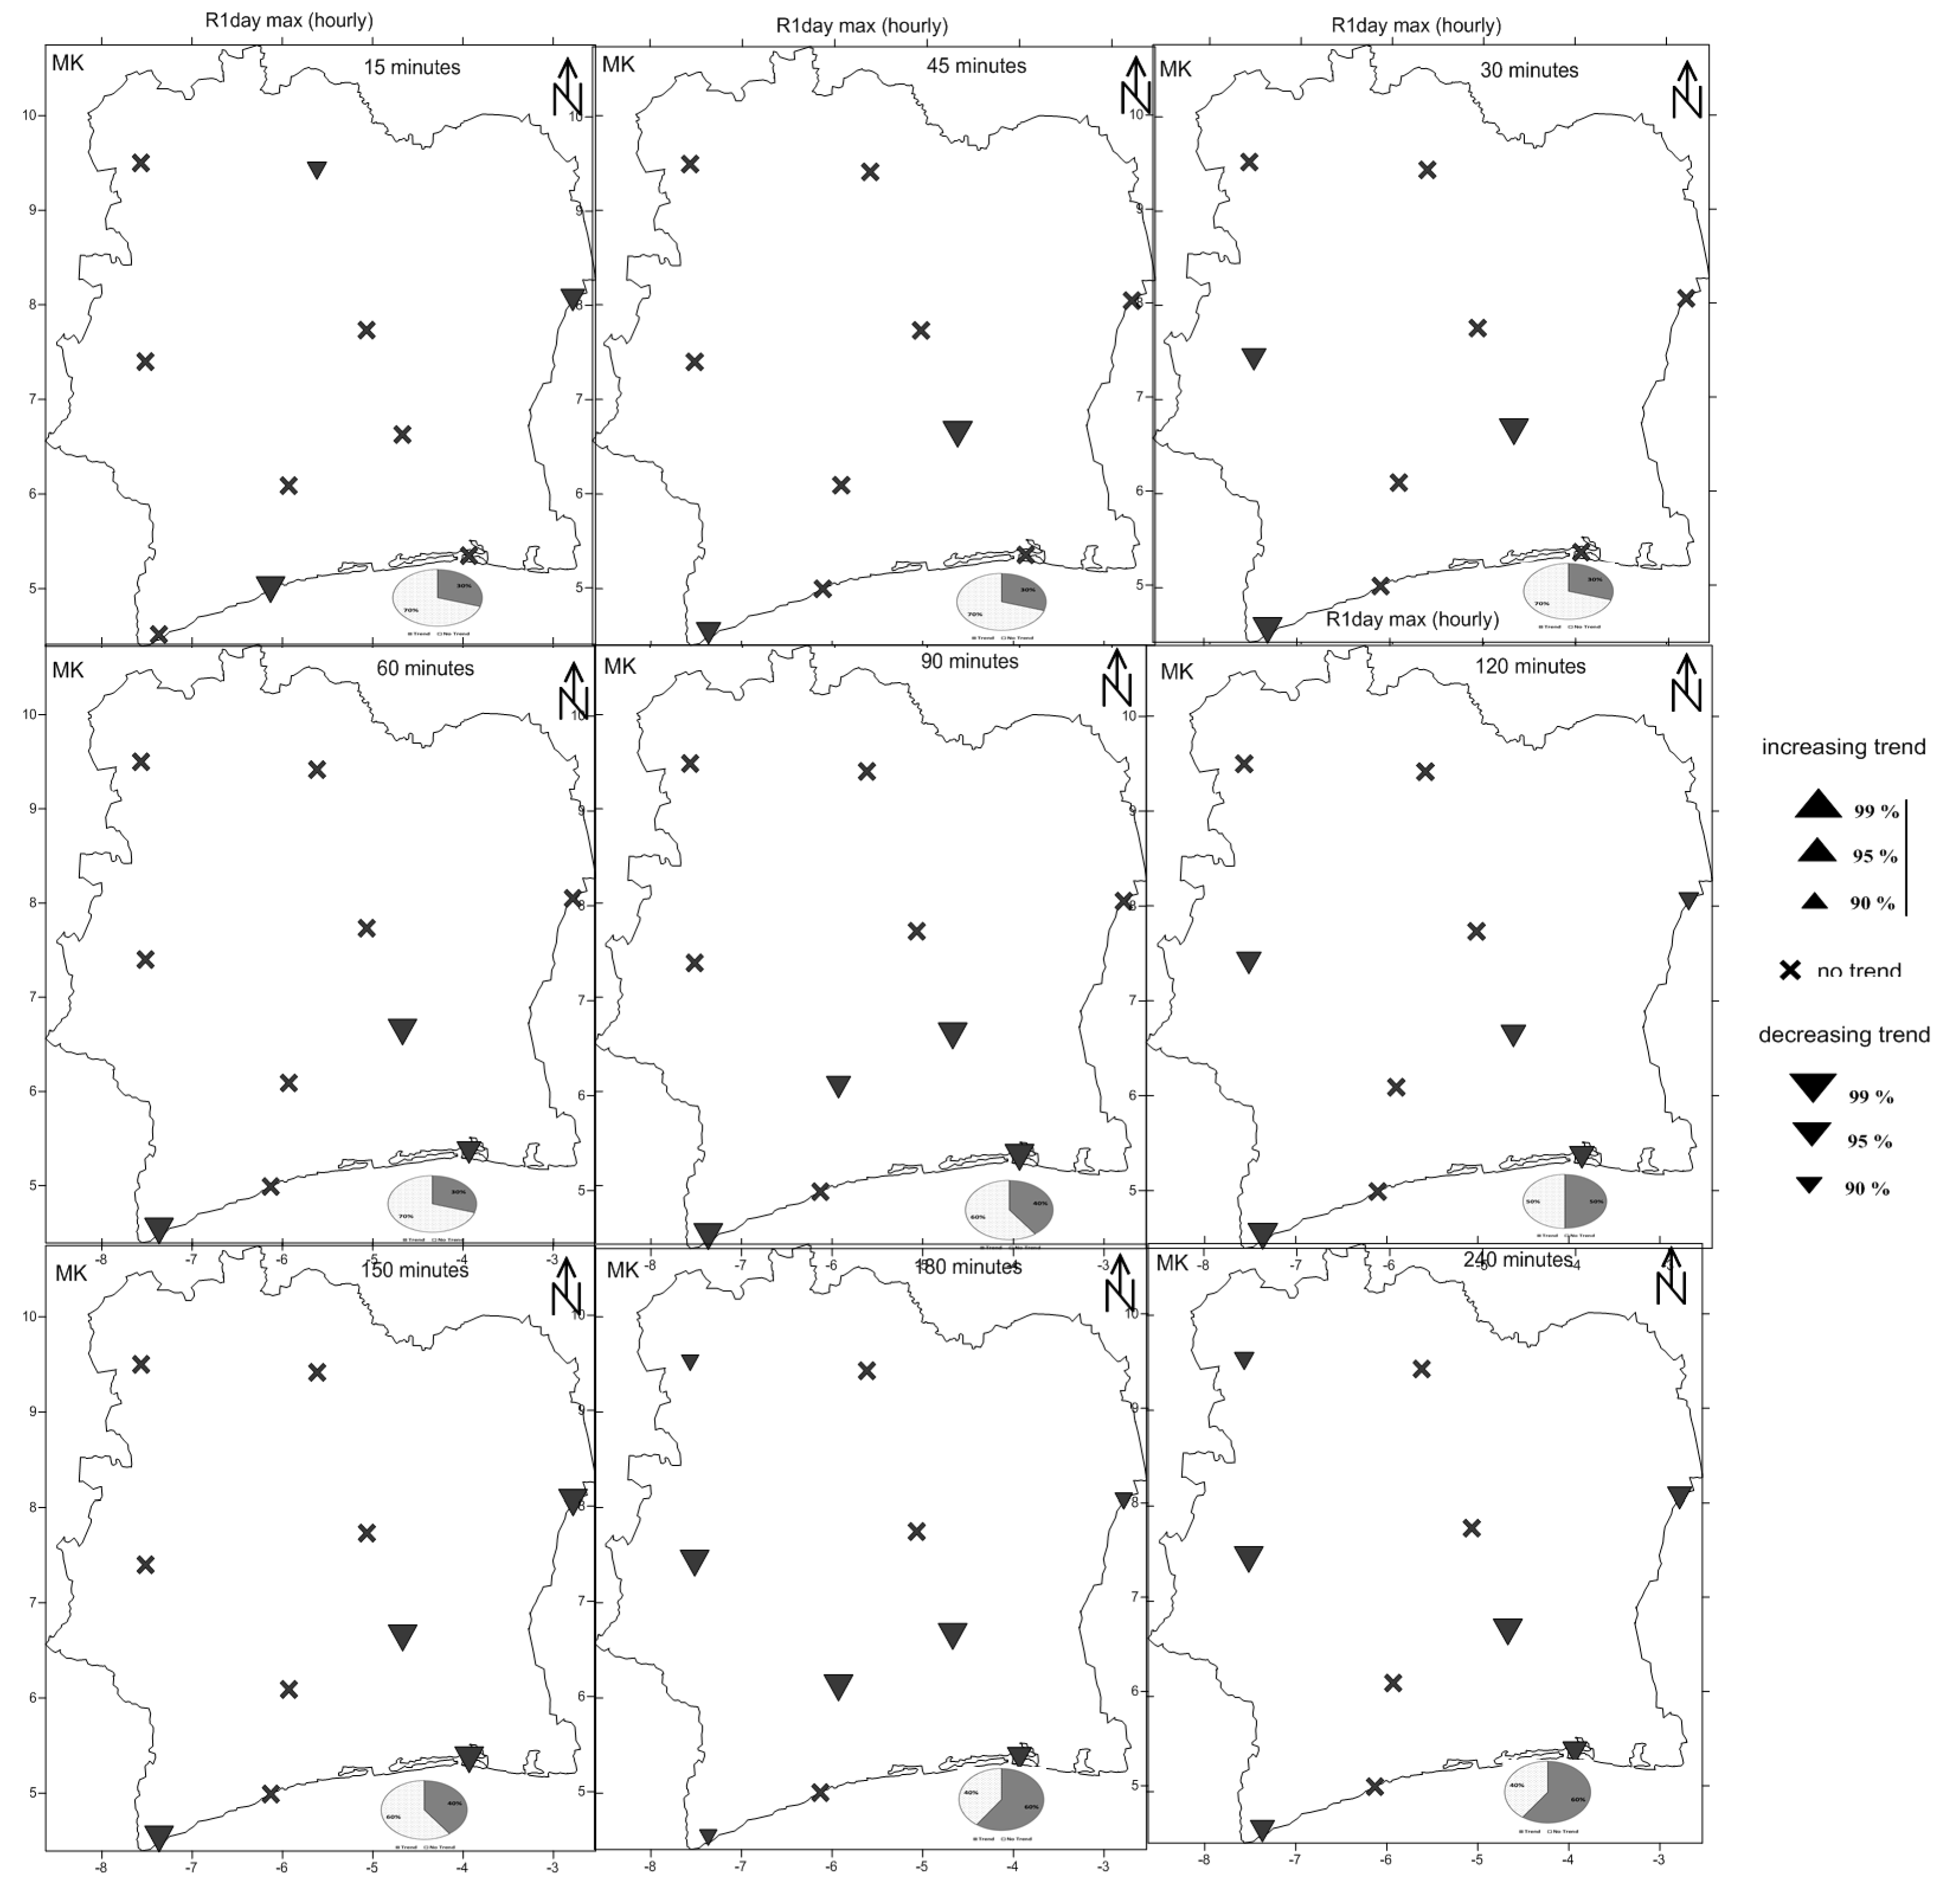
3.2. Trends in Sub-Hourly and Sub-Daily Extreme Rainfall
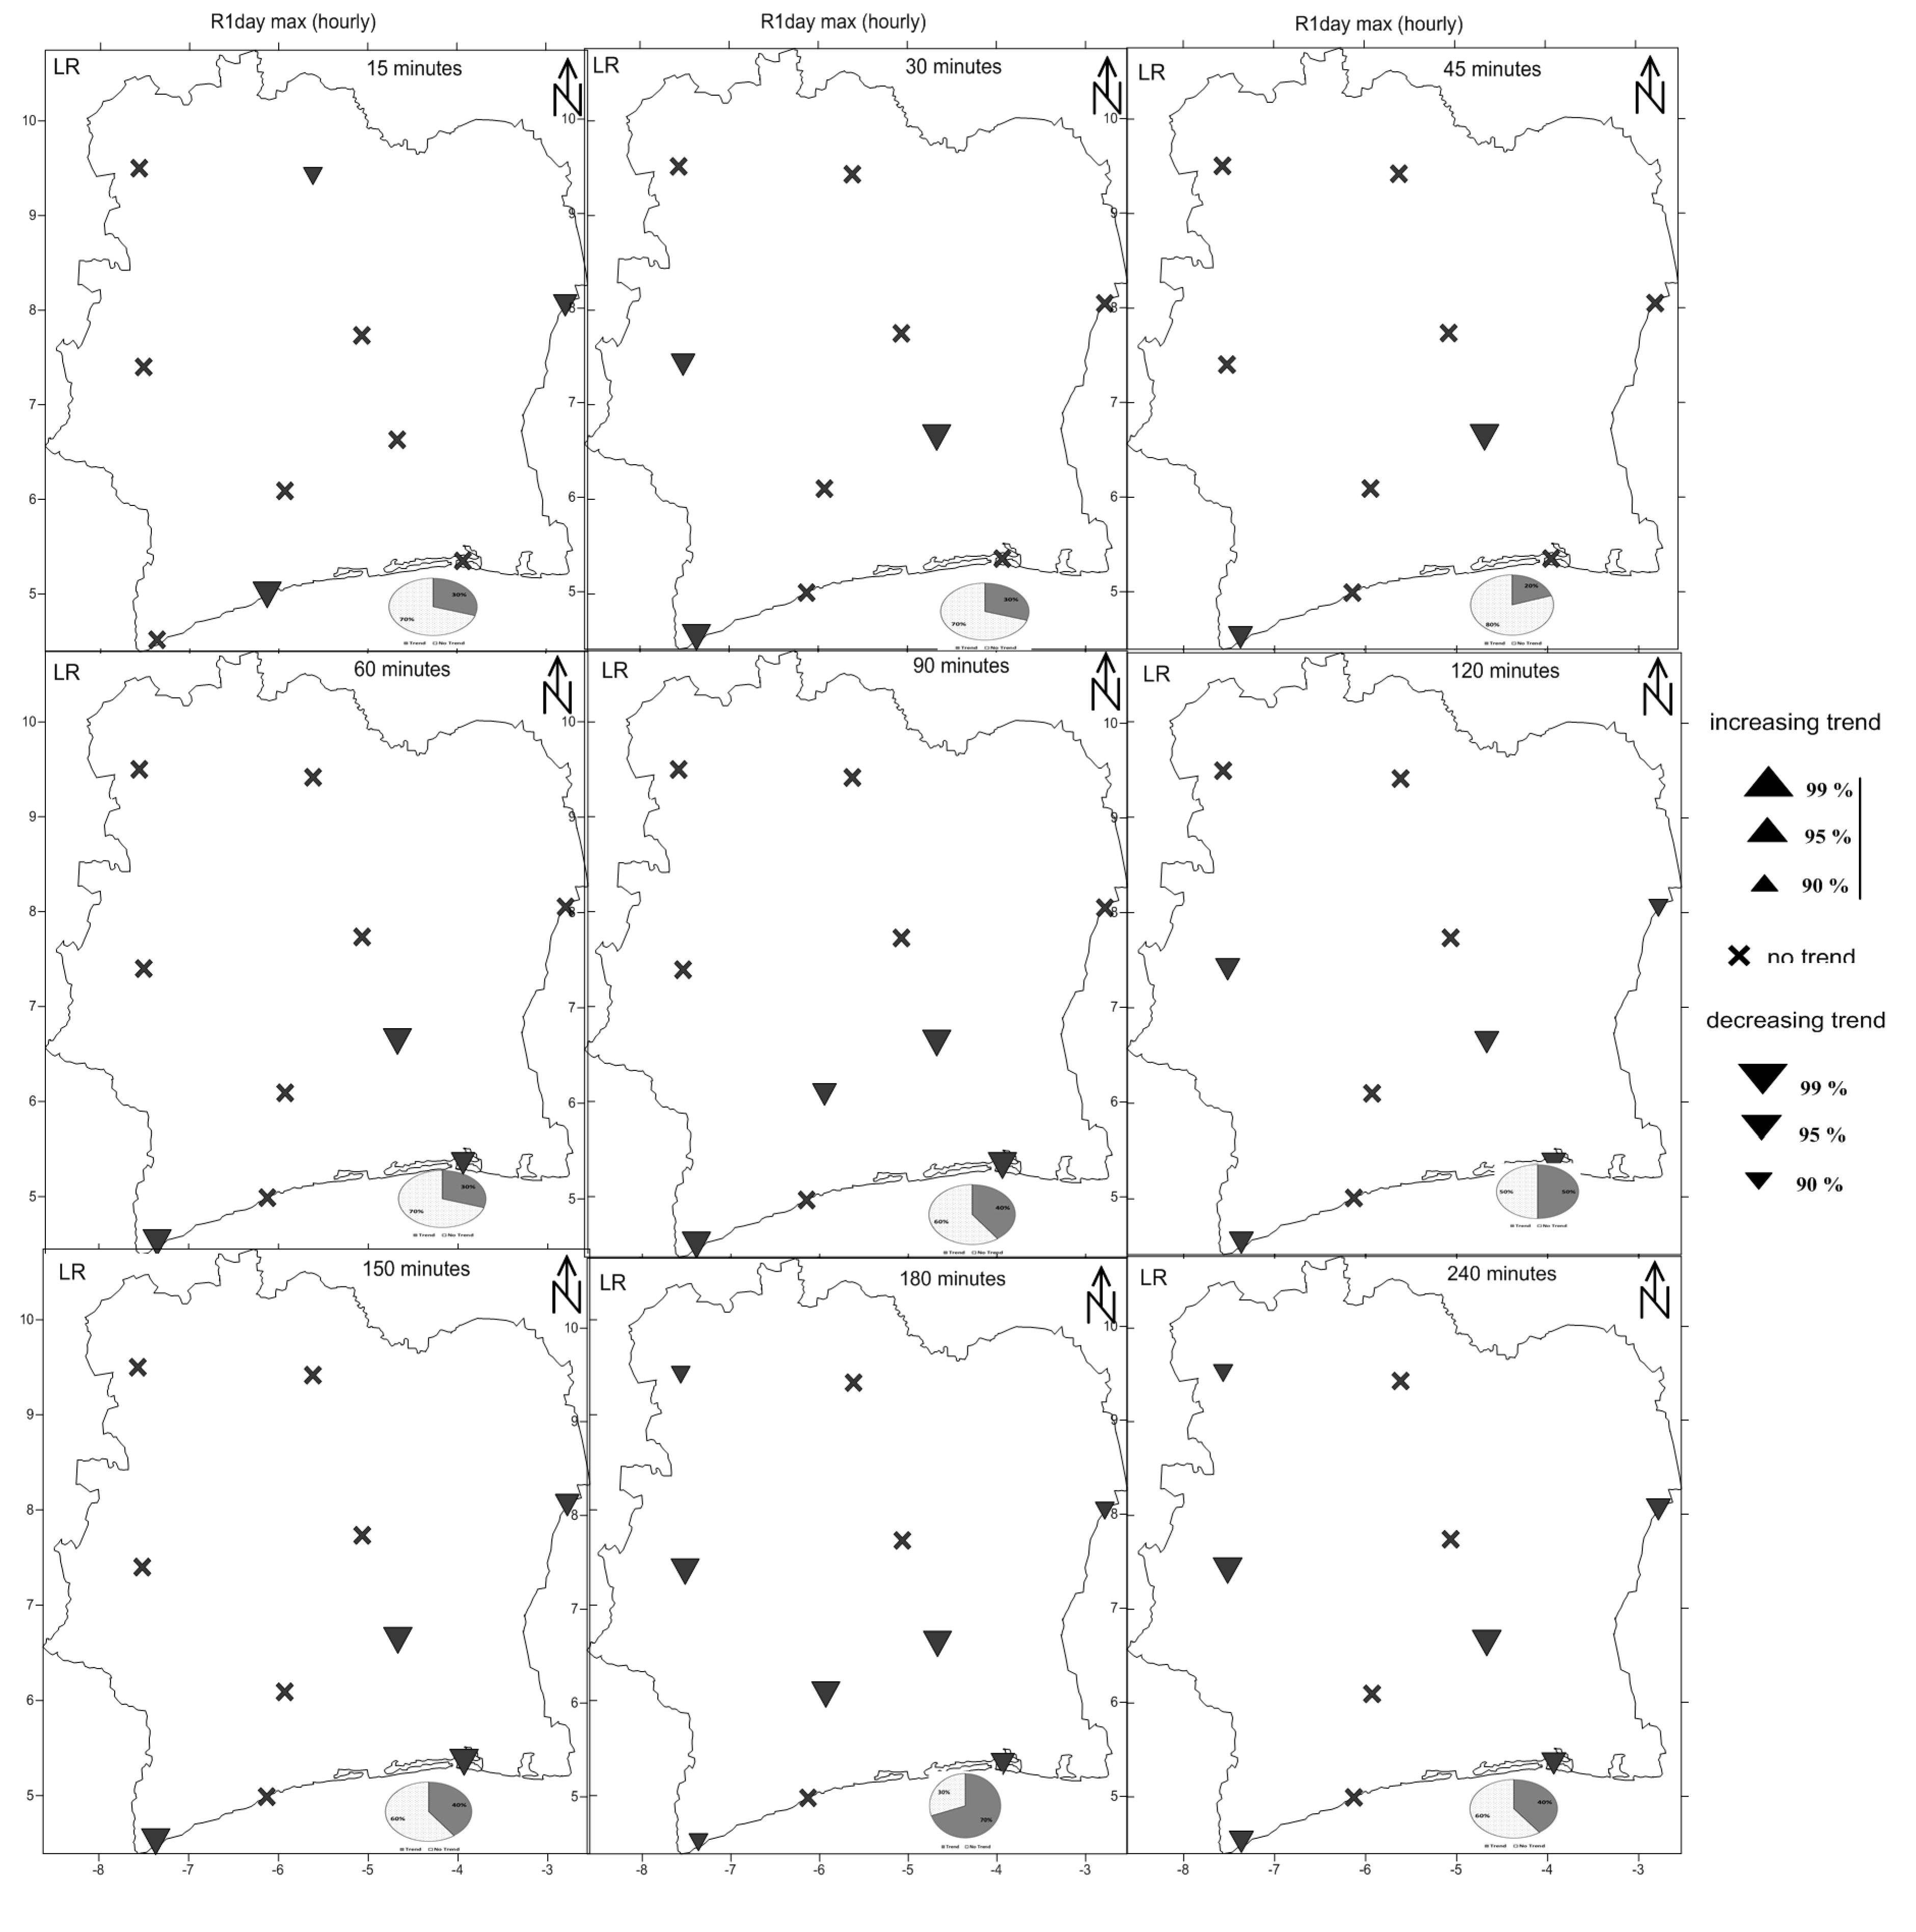
Maximum One-Day Precipitation (Sub-Hourly and Sub-Daily Scale)
4. Discussion
5. Conclusions
Acknowledgments
Author Contributions
Conflicts of Interest
References
- Chu, P.-S.; Chen, D.-J.; Lin, P.-L. Trends in precipitation extremes during the typhoon season in Taiwan over the last 60 years. Atmos. Sci. Lett. 2013, 15. [Google Scholar] [CrossRef]
- Easterling, D.R.; Meehl, G.A.; Parmesan, C.; Changnon, S.A.; Karl, T.R.; Mearns, L.O. Climate extremes: Observations, modeling and impacts. Science 2000, 289, 2068–2074. [Google Scholar] [CrossRef] [PubMed]
- Houghton, J.; Ding, T.Y.; Griggs, D.J.; Noguer, M.; Van der Linden, P.J.; Dai, X.; Maskell, K.; Johnson, C.A. Observed Climate Variability and Change. Climate Change 2001: The Science of Climate Change; Cambridge University Press: Cambridge, UK, 2001. [Google Scholar]
- Zhai, P.M.; Zhang, X.B.; Wang, H.; Pan, X.H. Trends in total precipitation and frequency of daily precipitation extremes over China. J. Clim. 2005, 18, 1096–1108. [Google Scholar] [CrossRef]
- Rajeevan, M.; Bhate, J.; Jaswal, A.K. Analysis of variability and trends of extreme rainfall events over India using 104 years of gridded daily rainfall data. Geophys. Res. Lett. 2008, 35. [Google Scholar] [CrossRef]
- Powell, E.J.; Keim, B.D. Trends in daily temperature and precipitation extremes for the Southeastern United States: 1948–2012. J. Clim. 2015, 28, 1592–1612. [Google Scholar] [CrossRef]
- Boers, N.; Donner, R.V.; Bookhagen, B.; Kurths, J. Complex network analysis helps to identify impacts of the El Niño Southern Oscillation on moisture divergence in South America. Clim. Dyn. 2014. [Google Scholar] [CrossRef]
- Tomassini, L.; Jacob, D. Spatial analysis of trends in extreme precipitation events in high-resolution climate model results and observations for Germany. J. Geophys. Res. 2009, 114. [Google Scholar] [CrossRef]
- Cantet, P. Impacts du Changement Climatique sur les Pluies Extrêmes par l’utilisation d’un Générateur Stochastique de Pluies. Ph.D. Thesis, Université Montpellier II, Montpellier, France, 2009. [Google Scholar]
- Sugahara, S.; Porfírio da Rocha, R.; Silveira, R. Non-stationary frequency analysis of extreme daily rainfall in Sao Paulo, Brazil. Int. J. Climatol. 2008, 29, 1339–1349. [Google Scholar] [CrossRef]
- Burić, D.; Luković, J.; Bajat, B.; Kilibarda, M.; Živković, N. Recent trends in daily rainfall extremes over Montenegro (1951–2010). Nat. Hazards Earth Syst. Sci. 2015, 15, 2069–2077. [Google Scholar] [CrossRef]
- Pal, I.; Al-Tabbaa, A. Trends in seasonal precipitation extremes—An indicator of “climate change” in Kerala, India. J. Hydrol. 2009, 367, 62–69. [Google Scholar] [CrossRef]
- Bielec, Z. Long terme variability of thunderstorms and thunderstorms precipitation occurrence in Cracow, Poland, in the period 1896–1995. Atmos. Res. 2001, 56, 161–170. [Google Scholar] [CrossRef]
- Griffiths, G.M.; Salinger, M.J.; Leleu, I. Trends in extreme daily rainfall across the South Pacific and relationship to the South Pacific convergence zone. Int. J. Climatol. 2003, 23, 847–869. [Google Scholar] [CrossRef]
- Salinger, M.J.; Griffiths, G.M. Trends in New Zealand daily temperature and rainfall extremes. Int. J. Climatol. 2001, 21, 1437–1452. [Google Scholar] [CrossRef]
- dos Santos, C.A.C. Recent changes in temperature and precipitation extremes in an ecological reserve in Federal District, Brazil. Rev. Bras. Meteorol. 2014, 29, 13–20. [Google Scholar] [CrossRef]
- de Lima, M.I.P.; Santo, F.E.; Ramos, M.A.; Trigo, R.T. Trends and correlations in annual extreme precipitation indices for mainland Portugal, 1941–2007. Theor. Appl. Climatol. 2015, 119, 55–75. [Google Scholar]
- Koning, A.; Franses, P.H. Are precipitation levels getting higher? Statistical evidence for the Netherlands. J. Clim. 2005, 18, 4701–7414. [Google Scholar]
- Re, M.; Barros, V.R. Extremes rainfalls in SE South America. Clim. Chang. 2009, 96, 119–136. [Google Scholar] [CrossRef]
- Collins, J.M. Temperature variability over Africa. J. Clim. 2011, 24, 3649–3666. [Google Scholar] [CrossRef]
- New, M.; Hewitson, B.; Stephenson, D.B.; Tsiga, A.; Kruger, A.; Manhique, A.; Gomez, B.; Coelho, C.A.S.; Masisi, D.N.; Kululanga, E.; et al. Evidence of trends in daily climate extremes over southern and west Africa. J. Geophys. Res. 2006, 111, D14102. [Google Scholar] [CrossRef]
- Ozer, A.; Ozer, P. Désertification au Sahel: Crise climatique ou anthropique? Bull. Séances l’Académie R. Sci. d’Outre-Mer 2005, 51, 395–423. [Google Scholar]
- Easterling, D.R.; Evans, J.L.; Groisman, P.Ya.; Karl, T.R.; Kunkel, K.E.; Ambenye, P. Observed variability and trends in extreme climate events: A brief review. Bull. Am. Meteorol. Soc. 2000, 81, 417–425. [Google Scholar] [CrossRef]
- Aguilar, E.; Aziz Barry, A.; Brunet, M.; Ekang, L.; Fernandes, A.; Massoukina, M.; Mbah, J.; Mhanda, A.; do Nascimento, D.J.; Peterson, T.C. Changes in temperature and precipitation extremes in western central Africa, Guinea Conakry, and Zimbabwe, 1955–2006. J. Geophys. Res. 2009, 114, D02115. [Google Scholar] [CrossRef]
- Ozer, P.; Hountondji, Y.C.; Laminou Manzo, O. Evolution des caractéristiques pluviométriques dans l’est du Niger de 1940 à 2007. GEO-ECO-Trop 2009, 33, 11–30. [Google Scholar]
- Donat, M.G.; Peterson, T.C.; Brunet, M.; King, A.D.; Almazroui, M.; Koli, R.K.; Al-Mulla, Y.A.; Youssouf, N.A.; Aly, A.A.; Nada, T.A.A.; et al. Changes in extreme temperature and precipitation in the Arab region: Long-term trends and variability related to ENSO and NAO. Int. J. Climatol. 2013, 34, 581–592. [Google Scholar] [CrossRef]
- Saidi, H.; Ciampittiello, M.; Dresti, C.; Ghiglieri, G. Observed variability and trends in extreme rainfall indices and Peaks-Over-Threshold series. Hydrol. Earth Syst. Sci. Discuss. 2013, 10, 6049–6079. [Google Scholar] [CrossRef]
- Ntegeka, V.; Willems, P. Climate Change Impact on Hydrological Extremes along Rivers and Urban Drainage Systems. III. Statistical Analysis of Historical Rainfall, ETo and River Flow Series Trends and Cycle; K.U. Leuven—Ydraulics Section & Royal Meteorological Institute of Belgium: Leuven, Belgium, 2008. [Google Scholar]
- Easterling, D.R.; Alexander, L.V.; Mokssit, A.; Detemmerman, V. CCI/CLIVAR Work shop to develop priority climate indices. Bull. Am. Meteorol. Soc. 2003, 8, 1403–1407. [Google Scholar] [CrossRef]
- Mann, H.B. Non parametric tests against trend. Econometrica 1945, 13, 245–259. [Google Scholar] [CrossRef]
- Kendall, M.G. Rank Correlation Methods, 4th ed.; Charles Griffin: London, UK, 1975. [Google Scholar]
- Mavromatis, T.; Stathis, D. Response of the water balance in Greece to temperature and precipitation trends. Theor. Appl. Climatol. 2011, 104, 13–24. [Google Scholar] [CrossRef]
- Yue, S.; Pilon, P.; Phinney, B.; Cavadias, G. The influence of autocorrelation on the ability to detect trend in hydrological series. Hydrol. Process. 2002, 16, 1807–1829. [Google Scholar] [CrossRef]
- Tabari, H.; Somee, B.S.; Zadeh, M.R. Testing for long-term trends in climatic variables in Iran. Atmos. Res. 2011, 100, 132–140. [Google Scholar] [CrossRef]
- Önöz, B.; Bayazit, M. Block bootstrap for Mann–Kendall trend test of serially dependent data. Hydrol. Process. 2012, 26, 3552–3560. [Google Scholar] [CrossRef]
- Wang, Y.Q.; Zhou, L. Observed trends in extreme precipitation events in China during 1961–2001 and the associated changes in large-scale circulation. Geophys. Res. Lett. 2005, 32, L09707. [Google Scholar] [CrossRef]
- Helsel, D.R.; Hirsch, R.M. Statistical Methods in Water Resources. In Studies in Environmental Science 49; Elsevier: New York, NY, USA, 1992. [Google Scholar]
- Interstate Technology & Regulatory Council. Groundwater Statistics and Monitoring Compliance, Statistical Tools for the Project Life Cycle. GSMC-1; Interstate Technology & Regulatory Council, Groundwater Statistics and Monitoring Compliance Team: Washington, DC, USA.
- Ozer, P.; Mahamoud, A. Recent extreme precipitation and temperature changes in Djibouti City (1966–2011). J. Climatol. 2013, 2013. [Google Scholar] [CrossRef]
- Ly, M.; Traore, S.B.; Agali, A.; Sarr, B. Evolution of some observed climate extremes in the West African Sahel. Weather Clim. Extrem. 2013, 1, 19–25. [Google Scholar]
- Mazvimavi, D. Investigating possible changes of extreme annual rainfall in Zimbabwe. Hydrol. Earth Syst. Sci. 2008, 5, 1765–1785. [Google Scholar] [CrossRef]
- Tarhule, A.; Woo, M. Changes in rainfall characteristics in northern Nigeria. Int. J. Climatol. 1998, 18, 1261–1271. [Google Scholar] [CrossRef]
- IPCC Special Report: Managing the Risks of Extreme Events and Disasters to Advance Climate Change Adaptation; Field, C.B.; Barros, V.; Stocker, T.F.; Dahe, Q. (Eds.) Cambridge University Press: Cambridge, UK, 2012.
- Sugiyama, M.; Shiogama, H.; Emori, S. Precipitation extreme changes exceeding moisture content increases in MIROC and IPCC climate models. Proc. Natl. Acad. Sci. USA 2010, 107, 571–575. [Google Scholar] [CrossRef] [PubMed]
- Folland, C.K.; Palmer, T.N.; Parker, D.E. Sahel rainfall and worldwide sea temperature 1901–1985. Nature 1986, 320, 602–607. [Google Scholar] [CrossRef]
- Koster, R.D.; Dirmeyer, P.A.; Guo, Z.; Bonan, G.; Chan, E.; Cox, P.; Gordon, C.T.; Kanae, S.; Kowalczyk, E.; Lawrence, D.; et al. Regions of strong coupling between soil moisture and precipitation. Science 2004, 305, 1138–1140. [Google Scholar] [CrossRef] [PubMed]
- Xue, Y.; Shukla, J. The influence of land-surface properties on Sahel climate. Part I: Desertification. J. Clim. 1993, 6, 2232–2245. [Google Scholar] [CrossRef]
- Wang, G.; Alo, C.A. Changes in Precipitation Seasonality in West Africa Predicted by RegCM3 and the impact of dynamic vegetation feedback. Int. J. Geophys. 2012, 2012. [Google Scholar] [CrossRef]
- Brou, T.Y.; Servat, E.; Paturel, J.E. Contribution à l’analyse des interrelations entre activités humaines et variabilité climatique : Cas du sud forestier ivoirien. Acad. Sci. 1998, 327, 833–838. [Google Scholar]
- Hirsch, R.M.; Alexander, M.B.; Smith, R.A. Selection of methods for the detection and estimation of trends in water quality. Water Resour. Res. 1991, 27, 803–813. [Google Scholar] [CrossRef]
- Yue, S.; Pilon, P. A comparison of the power of the t-test, Mann-Kendall and bootstrap tests for trend-detection. Hydrol. Sci. J. 2004, 49, 21–37. [Google Scholar] [CrossRef]


| Indicator | Indicator Name | Indicator Definitions | Units | Number of Stations | Scale |
|---|---|---|---|---|---|
| CWD10 | Consecutive wet days | Maximum number of consecutive days when precipitation ≥ 10 mm | days | 44 | annual |
| CWD20 | Consecutive wet days | Maximum number of consecutive days when precipitation ≥ 10 mm | days | 44 | |
| R1 day max (annual) | Maximum one-day precipitation | Highest precipitation amount in one-day period | mm | 44 | |
| R10 mm | Number of heavy precipitation days | Annual count when precipitation ≥ 10 mm | days | 44 | |
| R20 mm | Number of very heavy precipitation days | Annual count when precipitation ≥ 20 mm | days | 44 | |
| R1 day max (monthly) | Max 1 day precipitation amount | Monthly maximum 1 day precipitation | mm | 44 | monthly |
| R1 max (hourly) | Max 1 day precipitation amount | Hourly maximum 1 day precipitation | mm | 10 | sub-hourly and sub-daily |
© 2016 by the authors; licensee MDPI, Basel, Switzerland. This article is an open access article distributed under the terms and conditions of the Creative Commons Attribution (CC-BY) license (http://creativecommons.org/licenses/by/4.0/).
Share and Cite
Soro, G.E.; Noufé, D.; Goula Bi, T.A.; Shorohou, B. Trend Analysis for Extreme Rainfall at Sub-Daily and Daily Timescales in Côte d’Ivoire. Climate 2016, 4, 37. https://doi.org/10.3390/cli4030037
Soro GE, Noufé D, Goula Bi TA, Shorohou B. Trend Analysis for Extreme Rainfall at Sub-Daily and Daily Timescales in Côte d’Ivoire. Climate. 2016; 4(3):37. https://doi.org/10.3390/cli4030037
Chicago/Turabian StyleSoro, Gneneyougo Emile, Dabissi Noufé, Tié Albert Goula Bi, and Bernard Shorohou. 2016. "Trend Analysis for Extreme Rainfall at Sub-Daily and Daily Timescales in Côte d’Ivoire" Climate 4, no. 3: 37. https://doi.org/10.3390/cli4030037
APA StyleSoro, G. E., Noufé, D., Goula Bi, T. A., & Shorohou, B. (2016). Trend Analysis for Extreme Rainfall at Sub-Daily and Daily Timescales in Côte d’Ivoire. Climate, 4(3), 37. https://doi.org/10.3390/cli4030037