Article

Fluctuation of Groundwater Levels and Recharge Patterns in Northern Ghana

1
Division of Hydrologic Sciences, Desert Research Institute, 2215 Raggio Parkway, Reno, NV 89512, USA
2
Ghana Integrated Water, Sanitation, and Hygiene Project, World Vision Ghana, Savelugu, Ghana
3
Water, Sanitation, and Hygiene Learning Center, West Africa Region, World Vision International, PO Box 12713, Niamey, Niger
*
Author to whom correspondence should be addressed.
These authors contributed equally to this work.
Climate 2015, 3(1), 1-15; https://doi.org/10.3390/cli3010001
Submission received: 5 September 2014 / Accepted: 25 November 2014 / Published: 23 December 2014
(This article belongs to the Special Issue Changes in Precipitation and Impacts on Regional Water Resources)

Abstract

:
Evaluating groundwater levels and recharge patterns is part of sustainably managing the water supply and predicting the possibility of water shortages, especially in light of climate change, extreme events (floods/droughts), increasing population and development. In the northern region of Ghana, groundwater is increasingly relied upon as a source of potable water for rural populations, but seasonal and inter-annual fluctuations of groundwater levels and recharge patterns are not always known. The fluctuation of groundwater levels on a seasonal basis shows that groundwater levels at all sites increase in response to seasonal precipitation. On an annual basis, all sites show an overall net decline of groundwater levels over the study period, which may be associated with below-average departures of precipitation during five of the seven study years. The variability of recharge patterns among five sites is attributed to the spatio-temporal variability of precipitation and hydrogeologic site uniqueness. The overarching potential benefit of this study is to facilitate closing knowledge gaps and contribute to a foundation for a more robust evaluation of groundwater resources in the area, especially as more data become available.

1. Introduction

Evaluating groundwater levels and recharge patterns is part of sustainably managing the water supply and predicting the possibility of water shortages. In the northern region of Ghana, groundwater is increasingly relied upon as a source of potable water for rural populations, but seasonal and inter-annual fluctuations of groundwater levels and recharge patterns are not always known. The urgent need for potable water, combined with donor stipulations and the desires of governments to meet Millennium Development Goals, places emphasis on providing drinking water supplies through hand pump installations. Scientific studies of groundwater as a resource are not typically prioritized. Now, however, there are growing concerns in light of climate change, extreme events in the forms of floods and/or droughts, increasing population and development [1,2].
Despite increasing support for the scientific study of water resources, the topic remains difficult due to limited scientific data [3,4]. Understandably, available resources must be put towards securing access to potable water and food before environmental monitoring can take place. The overarching potential benefit of this study is to contribute to closing knowledge gaps by making information available. It is anticipated that this study will contribute to the foundation of a more robust evaluations of groundwater resources in the area.
A better understanding of groundwater levels and recharge patterns in northern Ghana is critical for development in the country and, as an analogue, for the continent of Africa. Lack of access to potable water and/or access to non-potable water are associated with adverse health effects and resulting impacts to educational outcomes and productivity, keeping developing nations from developing. Absence from school due to water-related illness contributes to substandard school performance [5,6]. Lost productivity due to water-related illness could be reduced by more than one-third in most areas [6] if potable water were accessible. It is clear that improved access to sustainable, potable water has socioeconomic benefits. A rise in the standard of living, however, compounded with a rise in population intensifies stress on environmental resources, especially groundwater.
Currently, Africa is home to nearly a billion people, with approximately half a billion more anticipated by 2050 [2]. The population of northern Ghana and Sub-Saharan Africa Africa (all developing countries) is growing rapidly, about 2.6% and 2.7% per year, respectively [7,8]. While community members in many locations in northern Ghana and across Africa have gained access to potable water, population growth and Millennium Development Goals demand ever-increasing access. Groundwater is an economically viable solution to meet the demands for potable water [9]. Beyond socioeconomic and human health benefits, the reasons for developing it include: the ease of installing hand pumps in remote locales; the availability during drought; the superior chemical and biological quality (compared with surface water sources); and the relative low price compared with methods of treating surface water [9,10]. In the latter case, for instance, the costs of treating water derived from surface sources are approximately twice those of groundwater for communities of less than 5000 people [9].
There may be undesired effects when fluctuations of groundwater levels and recharge patterns are not well understood. For instance, hand pump failure may occur when seasonal and inter-annual fluctuations of groundwater levels are not known. Boreholes drilled immediately after seasonal precipitation may be at depths where groundwater is not available throughout the year [11]. In this case, groundwater is not seasonably sustainable. Within the aquifer system, the consequences of groundwater fluctuation include alteration of groundwater flow regimes and changes in the volume and quality of groundwater resources available, while changes in precipitation, even at small scales, likely influence recharge patterns and the response of groundwater levels in aquifers [12]. When groundwater is pumped in excess of recharge, groundwater levels decline. In the case of hand pumps, it can become physically difficult to pump from increasingly lower depths, and there can be greater mechanical stress and wear on the hand pump parts, ultimately leading to mechanical failure [13].
Developing groundwater to provide access to potable water, while sustainably managing it as a resource, is a challenge; evaluating groundwater levels and recharge is critical as part of sustainably managing the water supply and predicting the possibility of water shortages. This study shows that an evaluation of groundwater levels and recharge can be made with limited field data and open-access gridded climate data. The study establishes that there is a seasonal fluctuation, in response to precipitation, and evaluates recharge values and patterns based on that response. Caveats are discussed, and suggestions for future work are made. It is noted that this study and the information from the study sites contribute to the foundation of a more robust evaluation of groundwater resources in the area, especially as more data become available.

2. Study Area Background

The four sites used in this study are approximately 20 to 65 km north of Tamale in the northern region of Ghana (Figure 1). Each site consists of a pressure transducer data logger (Schlumberger Mini Diver) deployed inside a community well. Savelugu, Kadia and District Assembly are hand pumps, while Kpataribogu is a solar-powered mechanized well that fills an overhead tank. Savelugu experiences the least pumping, since it is an ancillary hand pump in a location that relies on a piped network of water from a tank filled by a mechanized pump from a different well. Kadia and District Assembly are both hand pumps that the authors observe to be frequently in use. Since all sites are pumped during the day, the groundwater levels used in this study are those measured at 4 am.
These sites are part of an ongoing study, in collaboration with World Vision International’s Ghana Integrated Water, Sanitation and Hygiene Project (GI-WASH), to develop an understanding of groundwater under current aquifer conditions and to make limited predictions of sustainability under various future scenarios. Some climate models suggest a decrease of average annual precipitation, runoff (surface water) and recharge to groundwater by the middle of the 21st century across the larger Volta River Basin [14]. These decreases threaten smallholder, subsistence family farms, which form the backbone of the local economy. Unreliable precipitation and surface water resources may intensify stress on the development of groundwater resources as communities turn towards mechanized pump systems to deliver groundwater for agriculture and domestic use.
Figure 1. Location of the study sites in northern Ghana.
Climate 03 00001 g001
As a means of putting these four sites into a larger context, GI-WASH has drilled approximately 400 boreholes surrounding the study area. Long-term groundwater levels are not available at any other GI-WASH borehole location. The location of study sites is driven by pump location, which, in turn, is dictated by the local need for potable water. Thus, there exists a compromise with respect to location for the specific purpose of hypothesis testing. Nonetheless, since the inception of the study, the sites have provided valuable time series groundwater level data, since these measurements are not frequently collected in northern Ghana and West Africa, as a whole. The study area is not characterized by sharp topographical features. Land surface elevations range from 130 m above sea level (masl) to 207 masl with gradual rolling undulations in between. There are some shallow drainages that flow north or south, then generally westward to the White Volta River. Land surface elevation for each of the sites is recorded as: 158 masl at Savelugu; 161 masl at District Assembly; 134 masl at Kadia; and 153 masl at Kpataribogu. Kadia is the lowest, located in a shallower drainage, as compared with the other sites, which are relatively higher on topographical basin divides along the north (Kpataribogu) and south (Savelugu and District Assembly) of the study area. All groundwater levels are measured as meters below land surface (mbls).
The study sites lies entirely within the Voltaian Sedimentary Basin, which is designated as several units consisting of sandstone, shale, mudstone, sandy and pebbly beds, siltstones and arkose [15,16]. Borehole logs for the study sites indicate the predominance of sandstone, mudstone and arkosic sandstone with slight to moderate fracturing. The geology causes difficulties for drilling, with some attempts resulting in dry boreholes. Borehole depths range between 30 and 60 mbls, with an average depth of 40 mbls. The aquifer ranges from approximately 25 to 40 mbls, with the static water level averaging 10 mbls. Median yield is 13 L∙min−1, though it ranges from 4 to 1400 L∙min−1, with values occurring most commonly between 20 and 50 L∙min−1.
In the Voltaian Sedimentary Basin, much of the primary porosity of the sandstones is destroyed due to consolidation and cementation, so groundwater occurrence is associated with fractures under confined and semi-confined conditions [16,17]. For the purposes of water resource study, the fracture systems are treated as a continuum or an unconfined aquifer [18,19]. Recharge takes place via infiltration of precipitation through fractures and the rock matrix [9]. Values for hydrogeological parameters are reviewed in the Results and Discussion section.
The climate of northern Ghana is dominated by two seasonal subtropical air masses: wet-season precipitation from the Gulf of Guinea and dry air from the Sahara Desert. Figure 2 summarizes selected climate data [20]. In the study area, wet-season precipitation typically begins by the end of May, peaks in August and September and dwindles by October. Cooler temperatures occur during wet-season precipitation and warmer temperatures during February and March, when dry Sahara air dominates. Average annual precipitation is 1157 mm [20], but ranges from 900 to 1140 mm [7,21]. Though a south to north trend of decreasing precipitation is characterized for Ghana, the study sites are approximately 30 to 40 km along a south to north cross-section, which is not significant enough to apply a decreasing precipitation gradient.
Figure 2. Average monthly precipitation, minimum temperature (T Min), and maximum temperature (T Max) for the study area.
Climate 03 00001 g002
For this study, the time of interest is January 2006, to December 2012, with lapses due to data logger battery malfunction and initiation/discontinuation of sites. Precipitation data measured at Tamale are not complete for these study years, so data from the Global Precipitation Climatology Centre in Germany are used and summarized in Table 1 below [20]. These data are 1° by 1° resolution, with the bounding box for this study defined as 0° to 1°W and 9° to 10°N (Figure 1) and the centroid at 0.5°W and 9.5°N. No bias corrections are made, since insufficient observational data from the Tamale weather station are available for this procedure.
Table 1. Annual precipitation and departure from average.
YearTotal Precipitation (mm)Departure from Average
2006990−14%
200712709.8%
20081078−6.9%
20091045−9.7%
20101093−5.2%
20111106−4.4%
2012131213%

3. Results and Discussion

3.1. Seasonal and Inter-Annual Fluctuation of Groundwater Levels

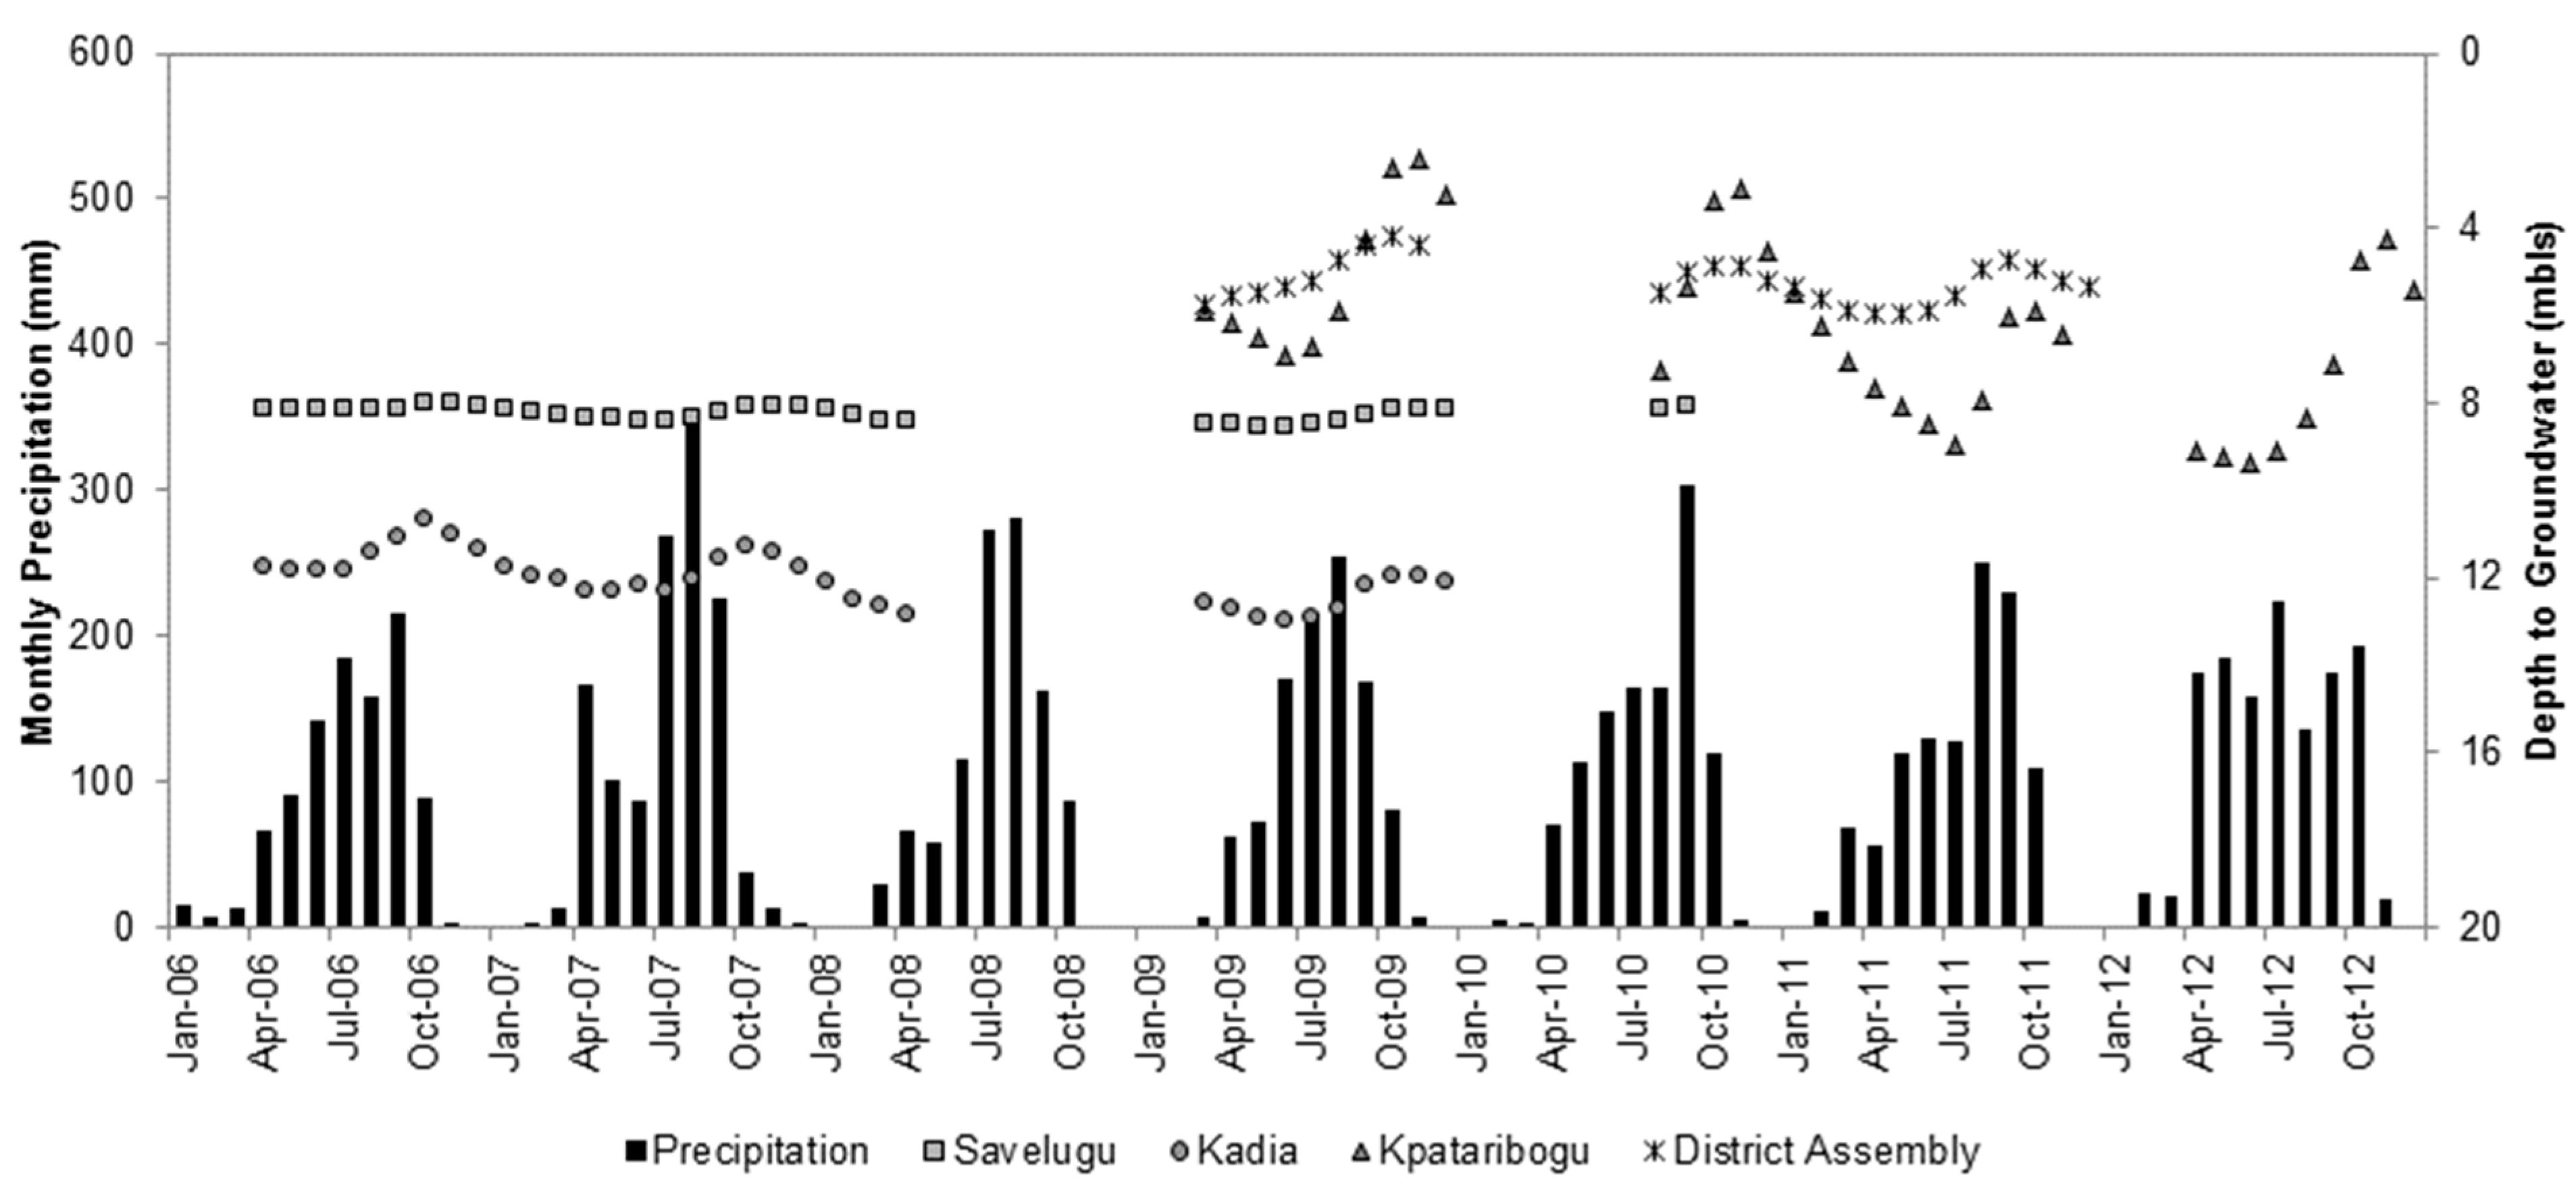
Figure 3 shows average monthly precipitation and average monthly depth to groundwater at each site between January 2006, and December 2012. The depth of groundwater ranges from about 2 mbls at Kpataribogu to 12 mbls at Kadia. Shallow unconfined aquifers, such as those found in the study area, are characterized by groundwater levels less than 50 mbls [1]. In these types of aquifers, the response of groundwater levels to precipitation can happen during a relatively short period [12]. At Savelugu, Kadia, Kpataribogu and District Assembly, groundwater levels increase in response to wet-season precipitation, are at their highest levels approximately two to four months following peak wet-season precipitation, then decrease into the dry season. Groundwater levels appear to be deepest below land surface between about April and June.
Figure 3. Average monthly precipitation (mm) and groundwater level response measured in meters below land surface (mbls) at the study sites.
Climate 03 00001 g003
All groundwater levels show responses to precipitation as increases, though hydrogeologic site uniqueness and spatio-temporal variation of precipitation (both are discussed in more detail later) lead to variation in the amount and timing of response. As compared with the other sites, Savelugu shows relatively small responses of 0.1 to 0.4 m, measured between the lowest point and the peak in the same season. Kadia and District Assembly show slightly larger responses between 1.0 and 1.6 m, respectively. The largest responses are observed at Kpataribogu, with the largest overall of 5.1 m in 2012. Relatively large fluctuations of groundwater are not unusual in aquifers with limited or low porosity [22]; in similar aquifer systems located in nearby Burkina Faso, groundwater level fluctuations between 1 and 9 m∙yr−1 are observed [23]. With respect to timing, increases appear to occur slightly later at Savelugu and Kadia, as compared to Kpataribogu and District Assembly.
The delay between peak precipitation and the response of groundwater suggests that some threshold of precipitation must be reached before the saturation of soil moisture and the rock matrix reaches the aquifer. 
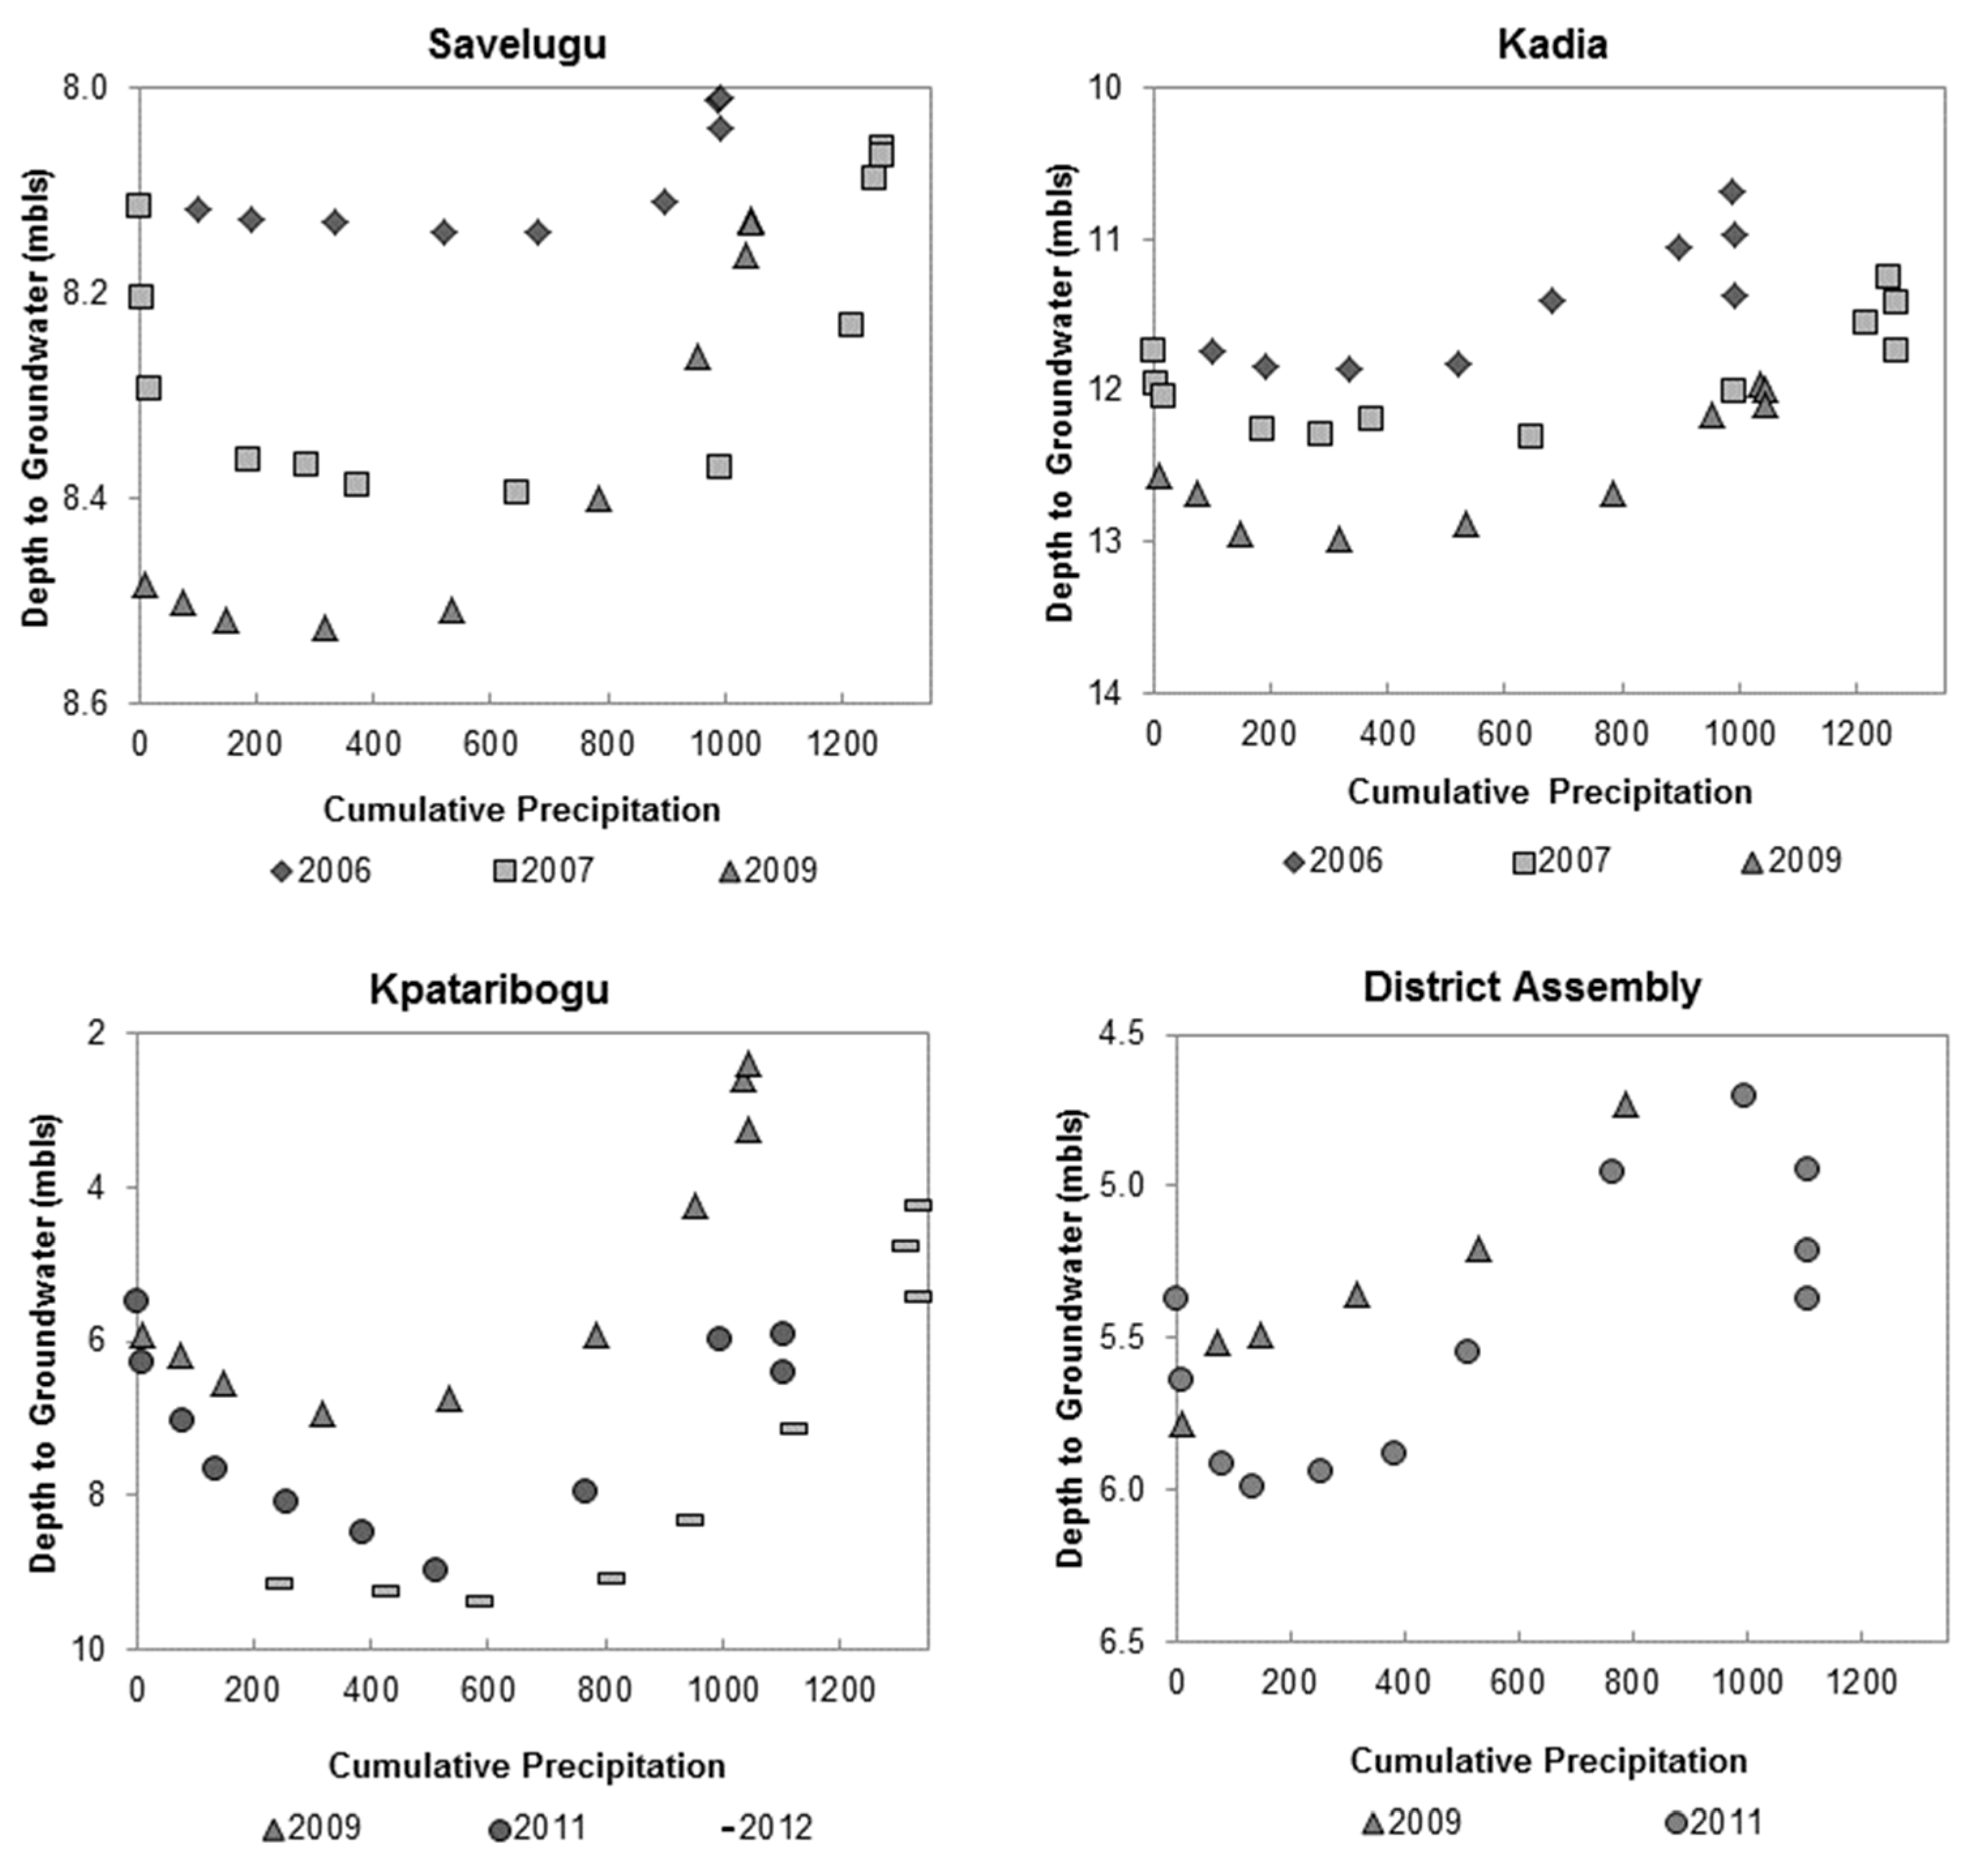
Figure 4 shows monthly groundwater levels in response to cumulative precipitation. Cumulative precipitation is summed for each month beginning in January and added to the sum of the previous month until December is reached. As a generalization across all sites, there is clustering of groundwater level values near zero on the x-axis, when little or no precipitation occurs. Groundwater levels remain relatively constant as precipitation accumulates, then increase more rapidly, almost linearly, after approximately 600 mm occurs. The linear increase breaks down after a maximum threshold of approximately 1000 mm is reached. After that volume, groundwater levels cluster together, remain constant or begin to decline, suggesting the movement of groundwater to other locations in the aquifer.
Variation of thresholds and the measured response of groundwater level on a site-by-site and inter-annual basis may be explained by the spatio-temporal variation of precipitation and hydrogeological site uniqueness. The 600-mm minimum threshold does not apply to District Assembly, for instance, and it does not apply all years at Savelugu and Kadia. Similarly, the maximum threshold of 1000 mm does not apply during 2007 at Savelugu and Kadia nor 2012 at Kpataribogu. Both the minimum and maximum precipitation thresholds are likely to be affected by the variability of precipitation and the saturation of soil moisture and the rock matrix. In similar hard-rock geological systems of India, a threshold of 335 mm∙yr−1 was observed before recharge took place [24].
As an example is the larger minimum precipitation threshold at Savelugu and Kadia during 2007. Below-average precipitation during 2006 may have contributed to drier conditions of soil moisture and the rock matrix. During 2007, no significant groundwater level response was observed until 1000 mm of precipitation accumulated. As 1250 mm of accumulated precipitation was exceeded, groundwater level remained steady at 8.1 mbls at Savelugu and 11.5 mbls at Kadia. Figure 3 shows the onset of above-average April 2007, precipitation, followed by above-average precipitation during August. At this point, the soil and rock matrix were likely to be saturated from April precipitation; any additional precipitation was forming runoff. Some of the worst flooding in decades was reported regionally across West Africa during 2007, with Ghana being particularly hard hit [25].
Despite the responses of increasing groundwater levels from precipitation each year, however, there is an overall net decline of groundwater levels over the course of the study. Negative departures from average precipitation occurring five of the seven study years (Table 1) may be linked with these decreases (Figure 3 and Figure 4). In the nearby Niger River basin, negative precipitation anomalies are observed with declining groundwater levels [26]. At Savelugu, the net groundwater level decline is about 0.4 m. The larger decline between 2006 and 2007 may be due to the larger negative precipitation departure during 2006 and is based on the assumption that the 2008 depth to groundwater falls in between those recorded for 2007 and 2009.
Figure 4. Cumulative monthly precipitation and monthly groundwater level. Cumulative monthly precipitation is summed for each month beginning in January and added to the sum of the previous month until December is reached. The monthly groundwater level is measured as meters below land surface (mbls) at the study sites.
Climate 03 00001 g004
At Kadia, the net decline is 0.9 m, and while the overall decline is greater at Kadia compared to Savelugu, it is difficult to determine if there is annual variation similar to Savelugu. District Assembly shows a decline of about 0.5 m between 2009 and 2011. Kpataribogu shows the largest decline of 3 m, observed between 2009 and 2012. While all sites show a decline of groundwater levels, the decline may be slightly greater at Kpataribogu, due to the mechanized pump extraction in excess of recharge. As more data become available, inter-site and inter-annual comparisons can be made to support or exclude this possibility.
Interestingly, the difference in depth to the groundwater level at Kpataribogu measured between 2011 and 2012 is relatively smaller, suggesting that above-average precipitation during 2012 may be contributing to some recovery of the system. This was not necessarily the case in 2007, when above-average precipitation during two months was associated with flooding. Whereas in 2007, excess precipitation formed runoff, in 2012, precipitation distributed more evenly between April and October may have allowed more substantial recharge to the groundwater system. In semi-arid areas of Africa, precipitation-fed recharge may occur only a few years each decade [27]. This phenomenon has also been observed in semi-arid areas of India with a similar geology [24]. As more groundwater level data become available from these study sites, it may be possible to evaluate what precipitation conditions lead to more and less substantial recharge to the aquifer and what type of temporal buffering (storage) the system may offer to offset the effects of drought and mechanized pump extraction.

3.2. Recharge Patterns

In shallow unconfined aquifers where groundwater levels respond to precipitation, the water table fluctuation (WTF) method can be used to calculate recharge. The WTF method is preferred because it is not restricted by the mechanisms by which water flows through the unsaturated zone (preferential pathways); it is best applied to a shallow water table; it can be applied to a fractured rock system; and, it is best in cases of short-term water level rise in response to a series of storms [23]. This study uses the equation
Q p r e c = S y Δ ϕ mod Δt
where Qprec is the rate of recharge from precipitation in m d1; Sy is the specific yield of the aquifer; Δϕmod is the modified rise in the groundwater level in m; and Δt is observation period in days [28]. Measuring precipitation, the response of groundwater levels and recharge over one year, the equation is modified to:
R = S y × Δh
where Qprec is rewritten as R for recharge in mm∙yr−1; Sy remains the specific yield of the aquifer; and Δh is the measured increase of groundwater level in mm [29].
Specific yield, Sy, is a dimensionless storage term that accounts for the release of water by gravity from the aquifer. Values of Sy vary according to geological material, soil, depth of groundwater and fracture size in the case of fractured aquifers [
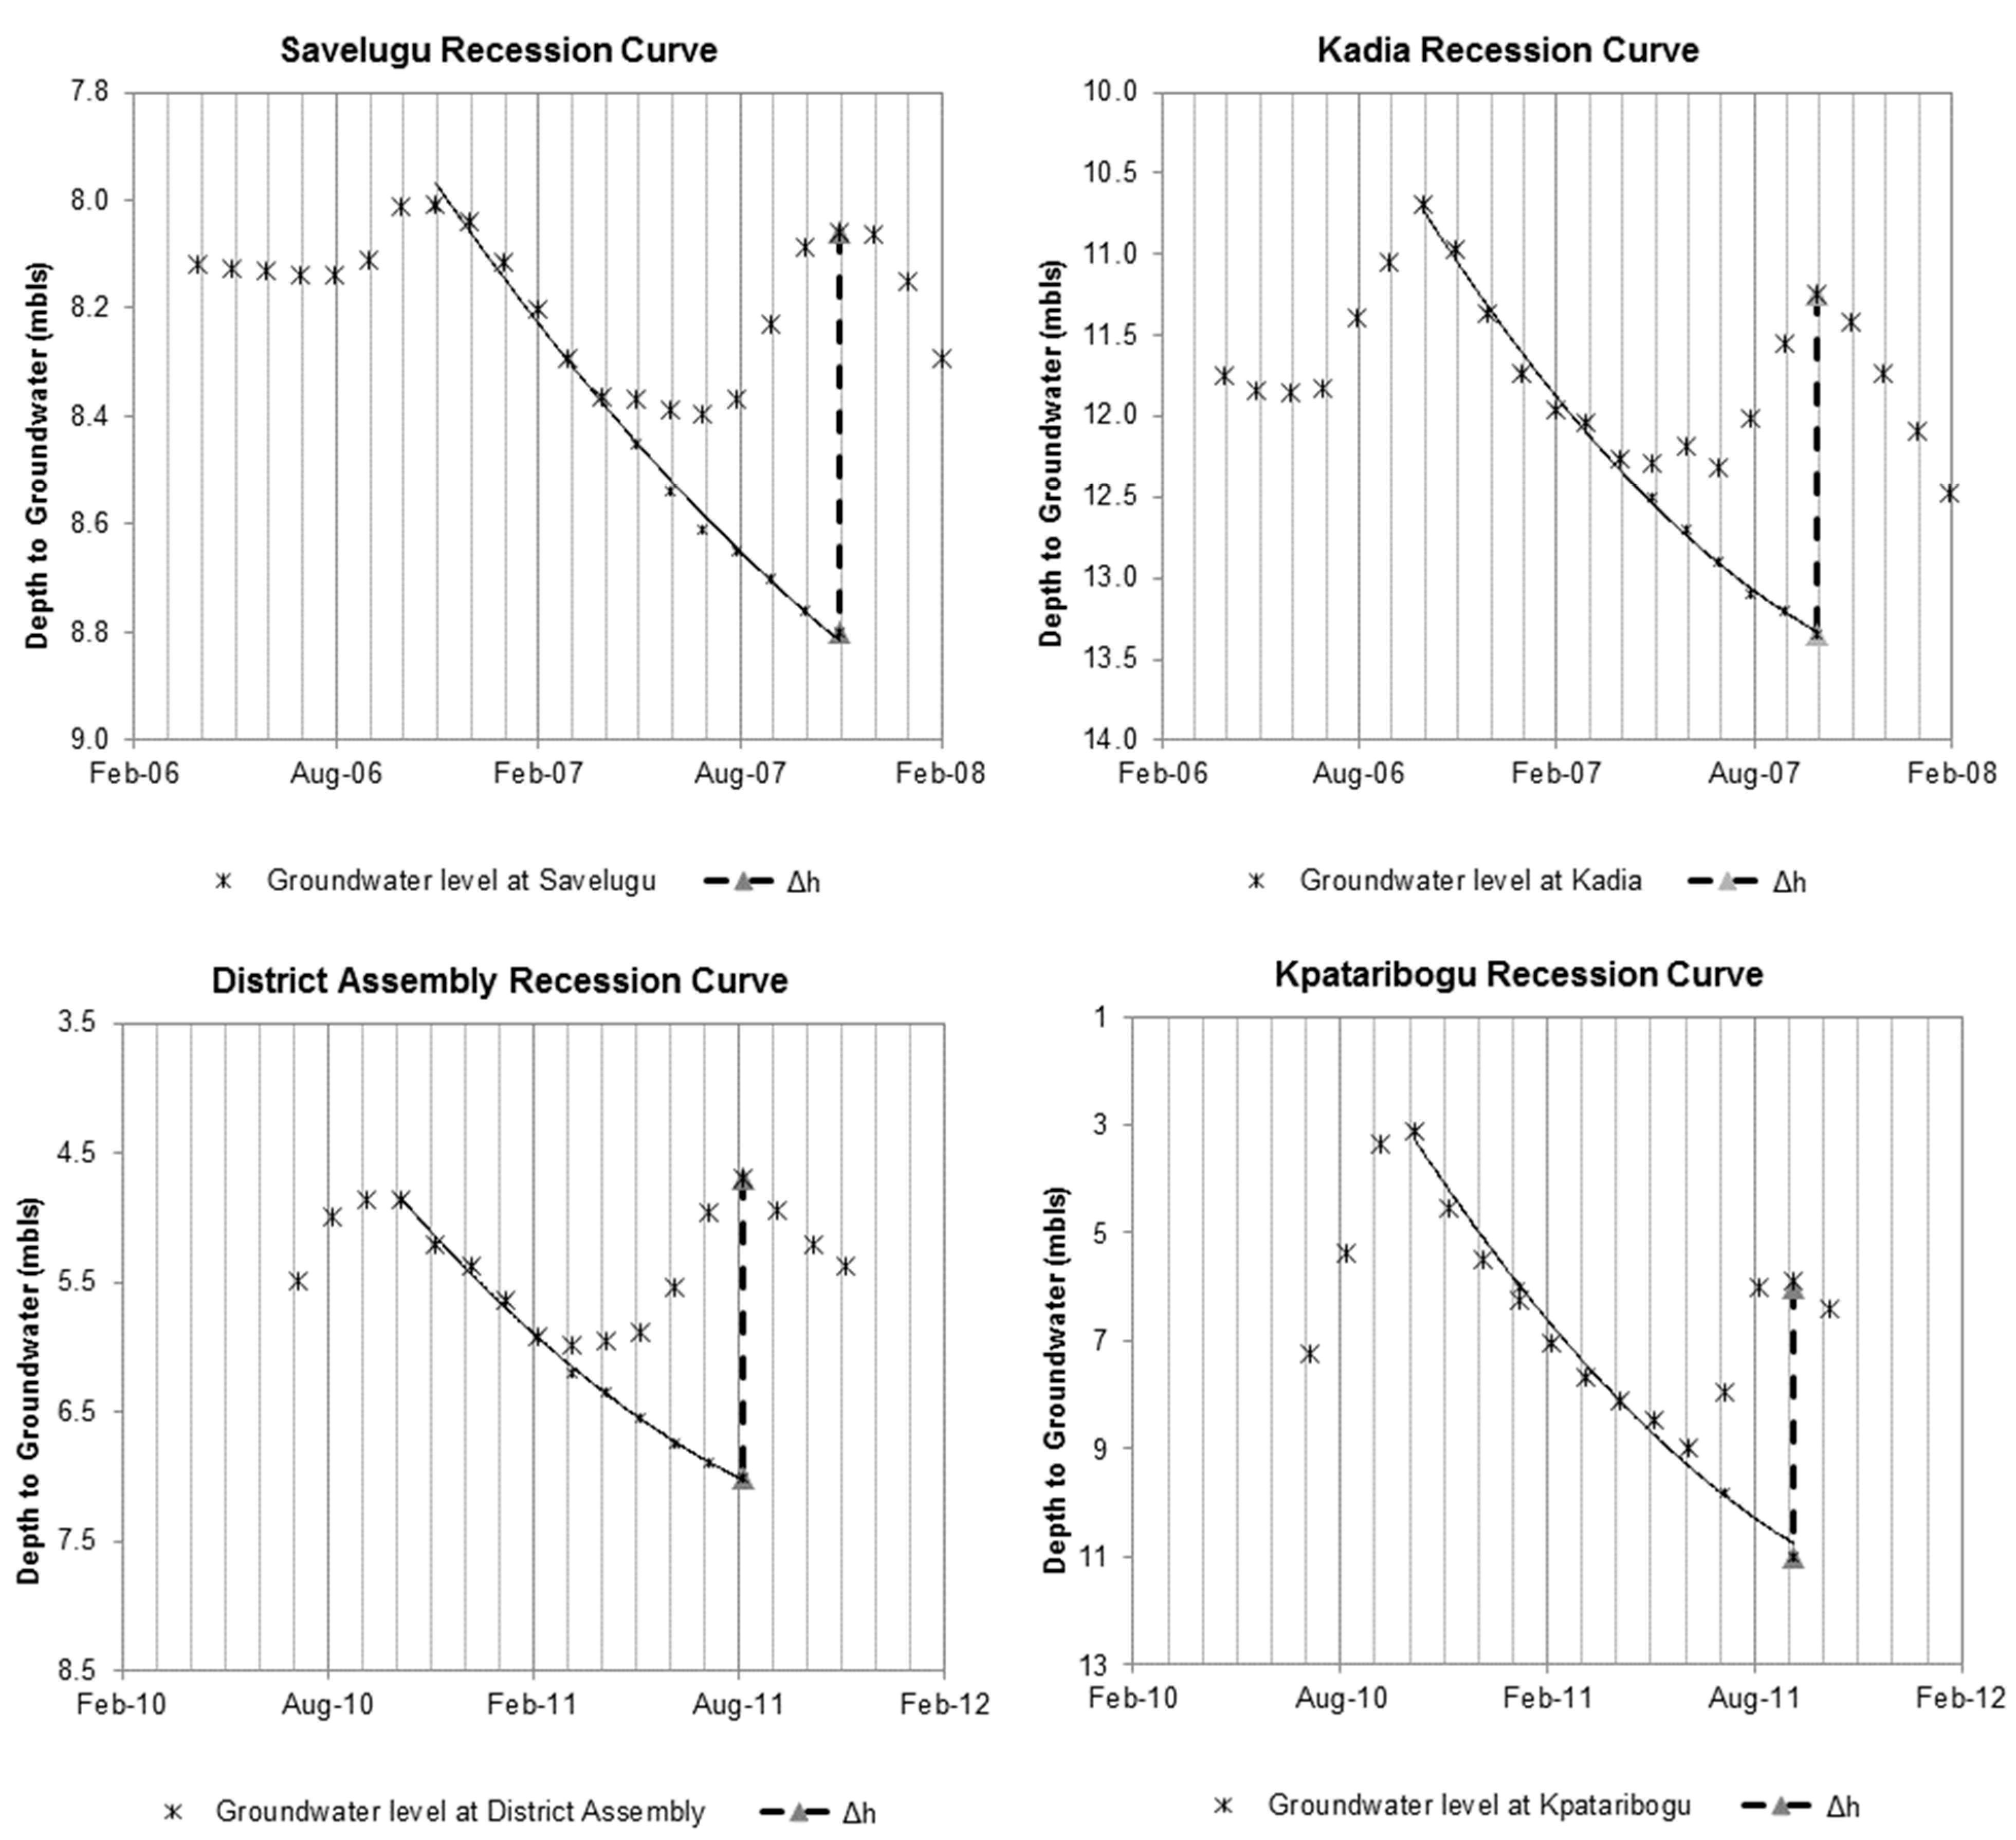
23]. The increase of groundwater level, Δh, is measured as the difference between the peak in response to precipitation and the low point of the extrapolated antecedent recession curve [23]. Figure 5 shows extrapolated antecedent recession curves for Savelugu, Kadia, District Assembly and Kpataribogu, giving Δh values of 0.7, 2.1, 5.0 and 2.3 m, respectively.
The variation of Δh between sites and years is attributed in part to hydrogeologic site uniqueness, which includes variation of Sy. There is a near absence of, or very few, reliable estimates of aquifer storage for Africa [2]. A review of Sy from the literature gives values ranging from 0.02 to 2.1 for fractured sandstones in similar fractured sandstone aquifer systems in Mali [30] and Utah [31]. Applying the full range of S
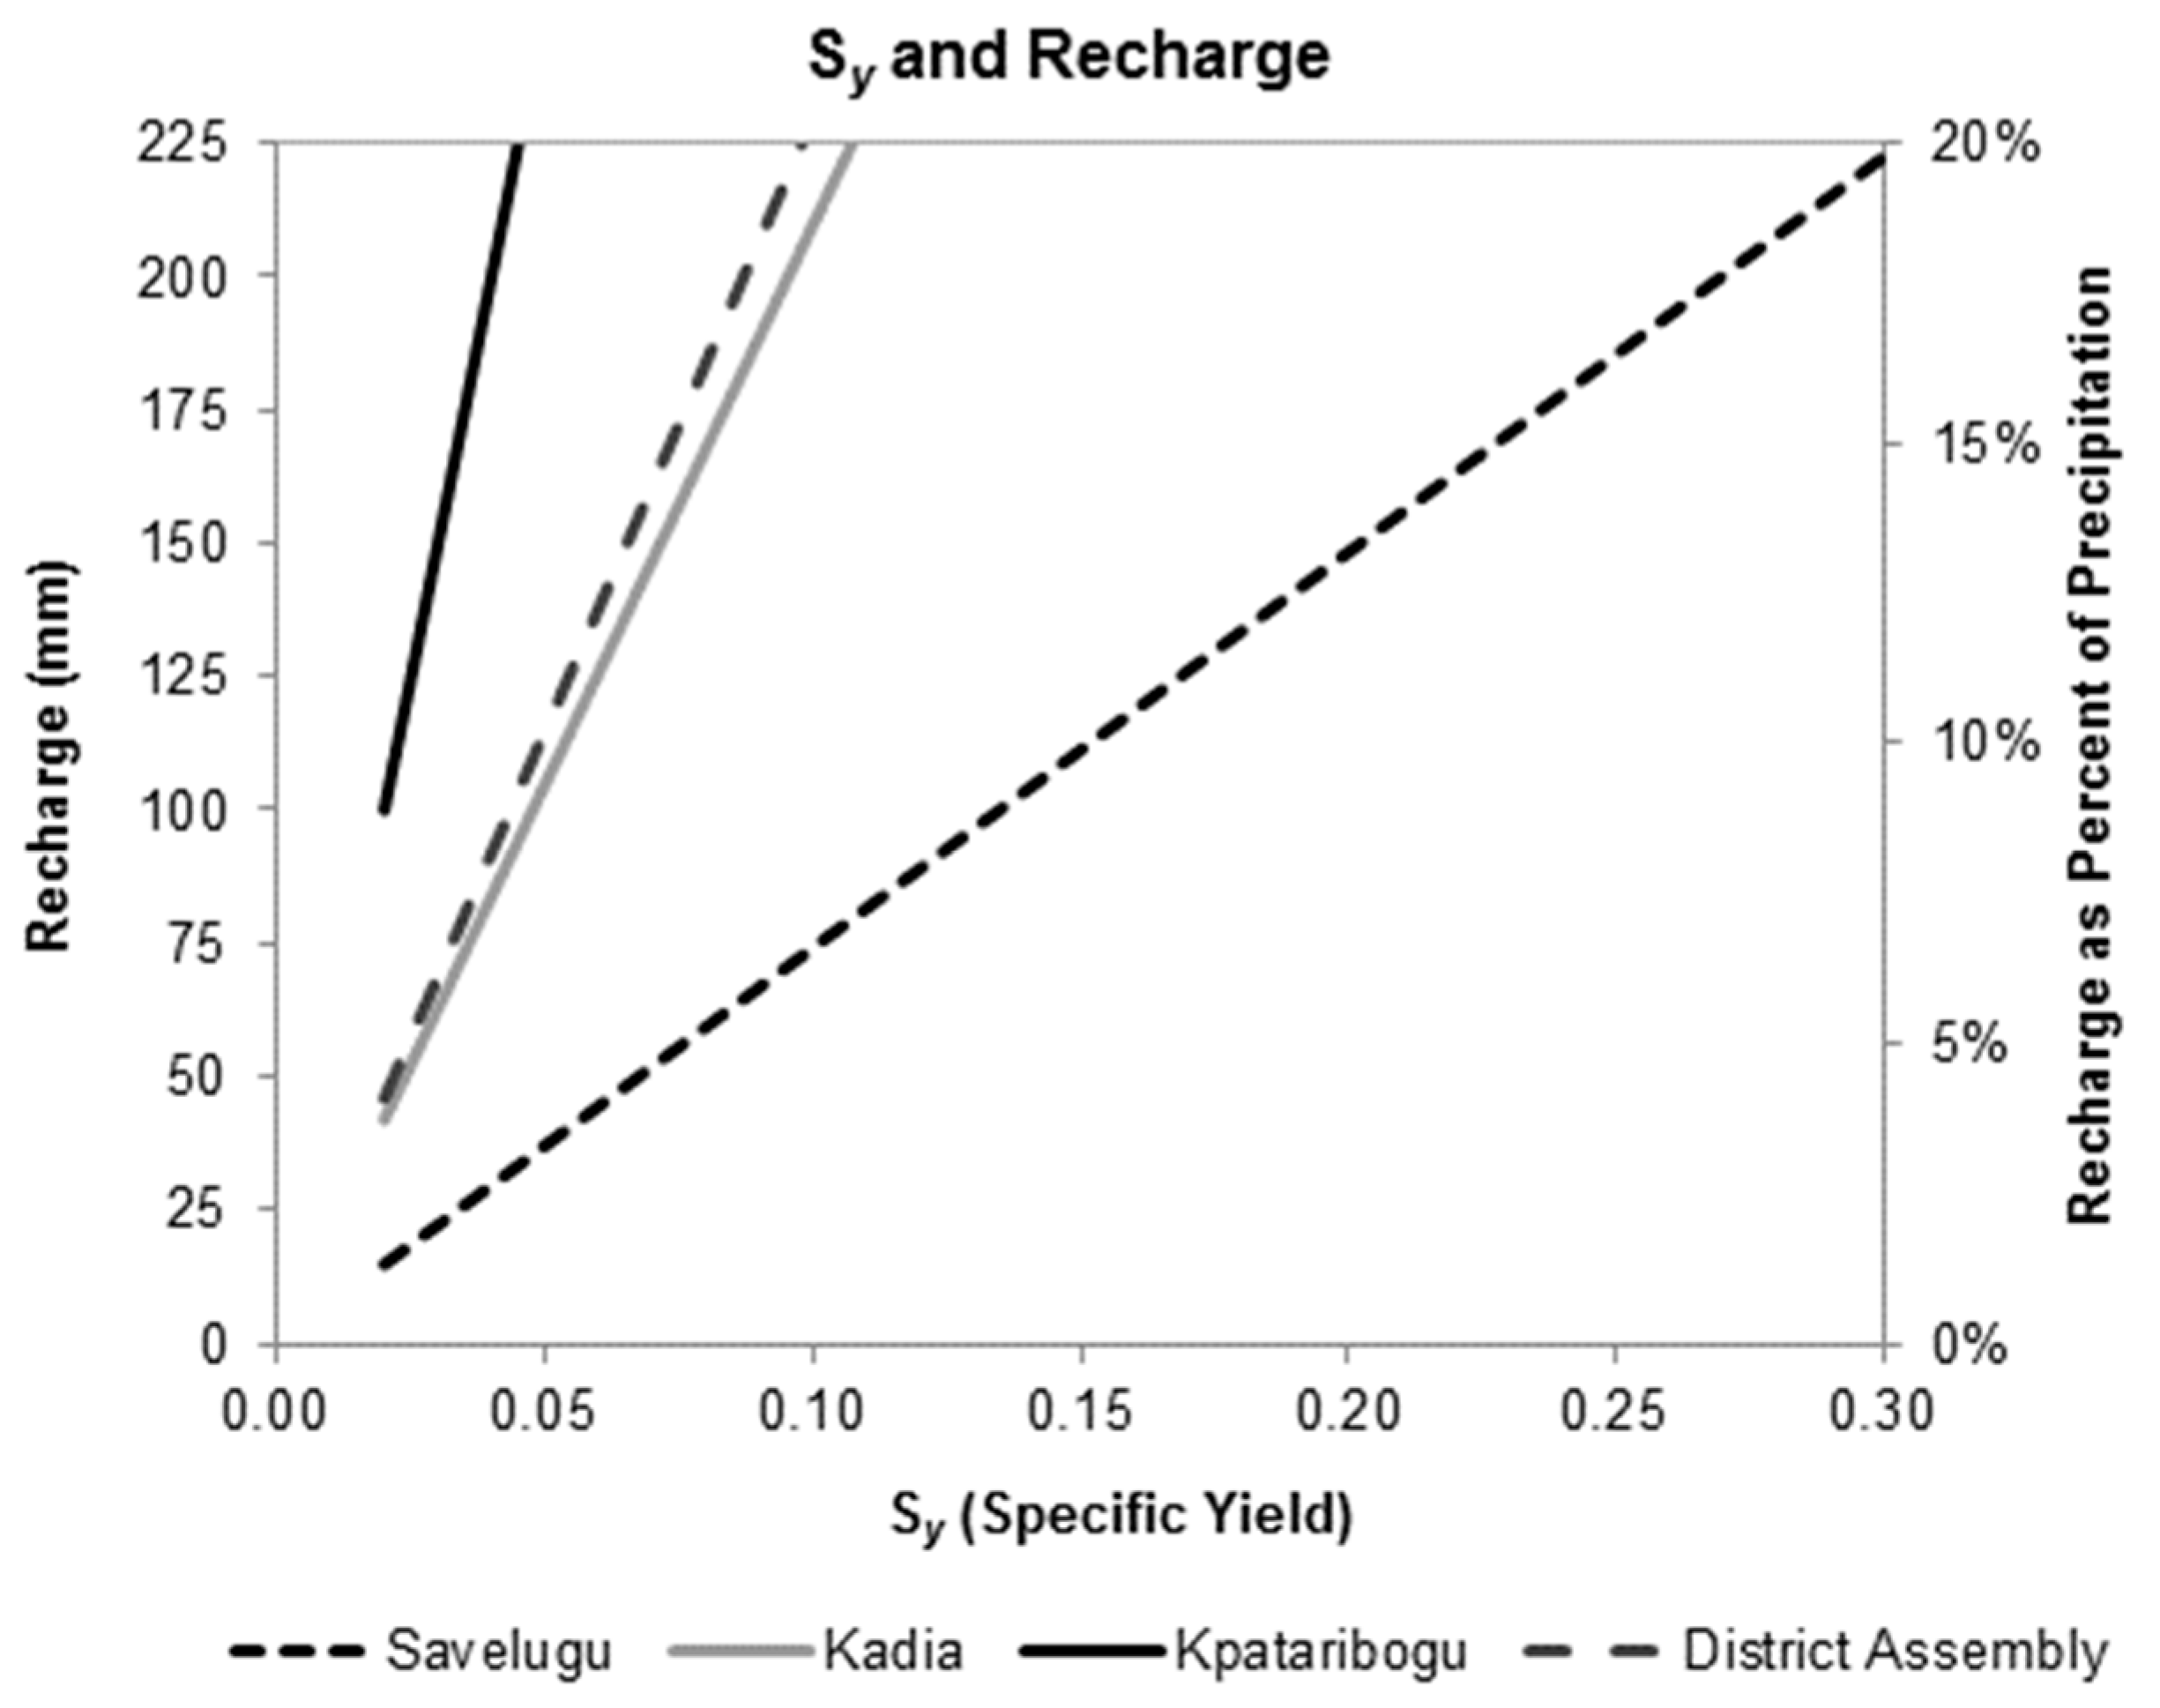
y values, however, gives estimates of recharge that far exceed the total amount of annual precipitation. The maximum observed recharge for fractured sandstone is 20% of average annual precipitation or 225 mm [31]. Using that value as an upper-limit constricts values of Sy from: 0.02 to 0.3 at Savelugu, 0.02 to 0.11 at Kadia, 0.02 to 0.05 at Kpataribogu and 0.02 to 0.10 at District Assembly. Figure 6 shows the range of recharge estimates based on these Sy values.
Besides hydrogeologic site uniqueness, the differences of Δh are also attributed to spatio-temporal variation of precipitation. A study of spatio-temporal precipitation patterns in a 9 by 9-km grid near Tamale yielded coefficient of variation values from 0.25 to 0.4 and concluded that reliable point precipitation is “extremely difficult to determine” [21]. Supporting this is a slight increase in groundwater levels during June, 2007, at Kadia in response to above-average April precipitation; there is a slight response during May at Savelugu (Figure 3). It is plausible that more April precipitation occurred at Kadia compared to Savelugu.
Figure 5. Extrapolated antecedent recession curves to determine Δh for recharge calculations at the study sites.
Climate 03 00001 g005
On a site-by-site basis, a vast matrix of information is generated by the observation of groundwater levels, precipitation data, consideration of Sy values and resultant recharge patterns. When the sites are viewed as a continuum, however, more reasonable recharge estimates emerge. Savelugu may be a reasonable representation of the study area continuum. At Kadia, Kpataribogu and District Assembly, hydrogeological conditions are such that the response to precipitation is greater and more rapid, as observed by larger increases of the groundwater levels’ shorter lag times, respectively. Until more sites can be included in this study, it cannot be assumed that conditions at these three sites are representative of the area. Studies made in other areas of northern Ghana and parts of Burkina Faso give estimates that approximately 3.7% to 5% of average annual precipitation recharges groundwater by infiltration through the soil and rock matrix [7,9,19]. Figure 5 shows that, with the exception of Savelugu, these estimates are low, given the groundwater level responses observed and Sy values used in this study. At Kadia, Kpataribogu and District Assembly, more than 3.7% to 5% of average annual precipitation forms recharge.
Figure 6. Range of recharge estimates for study sites using values of Sy (specific yield).
Climate 03 00001 g006
Additionally, Savelugu may be a reasonable representation of the study area continuum, because it is a hand pump and experiences the least amount of pumping. Both District Assembly and Kadia are sites that the authors have observed as being frequently pumped. It is currently unclear if Kpataribogu, a mechanized pump, is experiencing extraction in excess of recharge. Conditions at Savelugu are more likely to represent recharge patterns and more conservative estimates of recharge of the study area continuum.

3.3. Caveats and Potential Benefits

Several caveats and potential benefits are noted for this study. One caveat is the limitation of the dataset (groundwater levels are sporadically available from a few sites, causing difficulty for making inter-site and inter-annual comparisons with groundwater levels in this study). Furthermore, the gridded precipitation data cannot account for spatio-temporal variability; however, even a 9 by 9 km precipitation network could not. The implementation of precipitation gauges at each individual study site is ideal. Finally, while the gross surficial geology of the study area is understood, more localized sub-surface geologic investigations are lacking. The same is true with respect to localized hydrogeologic parameters.
The overarching potential benefit of any study is to contribute to closing knowledge gaps. In this study, evaluating seasonal fluctuations of groundwater levels, for instance, helps the sustainability of the wells in the area. Drillers can now ensure that wells and pumps are at depths sufficient enough, so as to avoid hand pump failure due to declining groundwater levels during the dry season. Evaluating inter-annual fluctuations of groundwater levels helps to determine groundwater storage and the quantity available. For instance, the study sites may reveal the system’s capacity (or lack thereof) to provide the resource despite groundwater level declines due to several years of negative departures of precipitation. Conversely, the sites may show what precipitation conditions lead to the recovery of the system, following the notion that precipitation-fed recharge may occur only a few years each decade. A more thorough evaluation of recharge patterns with respect to the onset/distribution of precipitation and the frequency of extreme events will become increasingly critical, since the changes of precipitation patterns are future climate projections for many tropical and semi-tropical areas [1,32].
In the interest of closing knowledge gaps, the sites in this study are actively used community wells and may provide information as to extraction patterns. Currently, extraction volumes from hand pumps are not known, and many studies use manufacturer’s specifications of hand pump yield. With borehole log information, it may be possible to evaluate true hand pump yield and understand community usage patterns. The added benefit of including Kpataribogu in the study will provide insight into the potential effects on the groundwater system as more communities move towards mechanized groundwater pumping systems with storage tanks and distribution pipes in the community. Though water quality is beyond the scope of this study, the hand pump at Kadia is connected to a treatment system for the removal of naturally-occurring arsenic. Another interesting study could assess whether seasonal and inter-annual variations in arsenic concentrations are correlated with recharge patterns.

4. Conclusions

Evaluating the fluctuation of groundwater levels on a seasonal basis shows that groundwater levels at all sites increase in response to wet-season precipitation. In some cases, the increases are large, such as at Kpataribogu. On an annual basis, all sites show an overall net decline of groundwater levels over the study period. The decline may be associated with below-average departures of precipitation during five of the seven study years. A recommendation for future studies is to evaluate what precipitation conditions lead to more and less substantial recharge to the aquifer and what type of temporal buffering (storage) the system may offer to offset the effects of drought and mechanized pump extraction. Furthermore, if communities do turn towards mechanized pump systems to deliver groundwater for agriculture and domestic use, it would be valuable to determine if there is a trend of changing land use from smallholder family farms to irrigated agriculture.
Employing the WTF method and using groundwater and Sy values show the variability of recharge patterns between the sites. The variability of recharge patterns is attributed to the spatio-temporal variability of precipitation and hydrogeologic site uniqueness. At three of the four sites, recharge appears to be rapid and is calculated to be a greater percentage of total annual precipitation than some estimates reported in the literature. At the remaining site, recharge resembles estimates reported in the literature, which is approximately 5% of precipitation. Another recommendation for future studies is to characterize hydrogeologic site uniqueness, via driller’s borehole logs (when available) and pump test data, which lead to increased or decreased areas of recharge. Evaluating groundwater levels and recharge patterns is part of sustainably managing the water supply and predicting the possibility of water shortages. As a final recommendation, it would be ideal to expand the study to include more sites across a larger area, taking more of a regional approach. A better understanding of groundwater levels and recharge patterns in northern Ghana is critical for development in Ghana and, as an analogue, for the continent of Africa, as there is increasing demand due to population growth and development.

Acknowledgments

The authors wish to thank the field staff at World Vision International’s Ghana Integrated Water, Sanitation and Hygiene Project and the various communities in which the study is taking place. Funding for the project was provided by the Conrad N. Hilton Foundation.

Author Contributions

Alexandra Lutz is the main and corresponding author. Solomon Minyila is the co-author and contributed to the design, implementation and maintenance of the study. Bansaga Saga and Samuel Diarra contributed to the design, implementation and maintenance of the study. Braimah Apambire and James Thomas contributed to the analysis and interpretation of results.

Conflicts of Interest

The authors declare no conflict of interest.

References

  1. MacDonald, A.; Calow, R.; MacDonald, D.; Darling, G.; Dochartaigh, B. What impact will climate change have on rural groundwater supplies in Africa? Hydrol. Sci. J. 2009, 64, 690–703. [Google Scholar]
  2. Taylor, R.; Koussis, A.; Tindimugaya, C. Groundwater and climate in Africa—A review. Hydrol. Sci. J. 2009, 54, 655–664. [Google Scholar] [CrossRef]
  3. United Nations. The Millenium Development Goals Report. Available online: http://www.un.org/millenniumgoals/reports.shtml (accessed on 2 June 2014).
  4. Baisch, J. Data shortage in Africa. Desalination 2008, 248, 524–529. [Google Scholar] [CrossRef]
  5. United Nations Development Programme. Human Development Report. Available online: http://hdr.undp.org/en/reports/global/hdr2006/ (accessed on 05 June 2014).
  6. United Nations Children’s Fund. The State of the World’s Children 2006: Excluded and Invisible. Available online: http://www.unicef.org/sowc06/fullreport/full_report.php (accessed on 11 June 2014).
  7. Martin, N.; van de Giesen, N. Spatial distribution of groundwater production and development potential in the Volta River basin of Ghana and Burkina Faso. Water Int. 2005, 30, 239–249. [Google Scholar] [CrossRef]
  8. World Bank. World Bank Open Data: Free and Open Access to Data about Development in Countries Around the Globe. Available online: http://data.worldbank.org/ (accessed on 06 December 2014).
  9. Gyau-Boakye, P. Sources of rural water supply in Ghana. Water Int. 2001, 26, 96–104. [Google Scholar] [CrossRef]
  10. Dapaah-Siakwan, S.; Gyau-Boakye, P. Hydrogeologic framework and borehole yield in Ghana. Hydrogeol. J. 2000, 8, 405–416. [Google Scholar] [CrossRef]
  11. Harvey, P. Borehole Sustainability in Rural Africa: An analysis of routine field field data. In Proceedings of the 2004 WEDC International Conference, Vientiane, Laos, 25–28 October 2004.
  12. Apaydin, A. Response of groundwater to climate variation: fluctuations of groundwater level and well yields in the Halacli aquifer (Cankiri, Turkey). Environ. Monit. Assess. 2009. [Google Scholar] [CrossRef]
  13. Gleitsmann, B.; Kroma, M.; Steenhuis, T. Analysis of a rural water supply project in three communities in Mali: Participation and sustainability. Nat. Resour. Forum 2007, 31, 147–150. [Google Scholar] [CrossRef]
  14. McCartney, M.; Forkuor, G.; Sood, A.; Amisigo, B.; Hattermann, F.; Muthuwatta, L. The Water Resource Implications of Changing Climate in the Volta River Basin, 2012. Available online: http://www.iwmi.cgiar.org/Publications/IWMI_Research_Reports/PDF/PUB146/RR146.pdf (accessed on 18 June 2014).
  15. Kesse, G. The Mineral and Rock Resources of Ghana; Balkema: Rotterdam, The Netherlands, 1985. [Google Scholar]
  16. Kortatsi, B. Groundwater utilization in Ghana. Int. Assoc. Hydrol. Sci. 1994, 149–156. [Google Scholar]
  17. Acheampong, S.; Hess, J. Origin of the shallow groundwater system in the southern voltaian sedimentary basin of Ghana: an isotopic approach. J. Hydrol. 2000, 233, 37–53. [Google Scholar]
  18. Van der Sommen, J.; Geinaert, W. On the continuity of aquifer systems on the crystalline basement of Burkina Faso. In Estimation of Natural Groundwater Recharge; Simmers, I., Ed.; Reidel: Dordrecht, Netherlands, 1988; pp. 29–45. [Google Scholar]
  19. Ricolvi, J. Selected case studies, Burkina Faso. In Water Resources of Hard Rock Aquifers in Arid and Semi-Arid Zones; Llyod, J., Ed.; United Nations Educational, Scientific, and Cultural Organization: Paris, France, 1999; pp. 262–275. [Google Scholar]
  20. Schneider, U.; Becker, A.; Finger, P.; Meyer-Christoffer, A.; Rudolf, B.; Ziese, M. GPCC Full Data Reanalysis Version 6.0 at 1.0°: Global Precipitation Climatology Centre Monthly Land-Surface Precipitation from Rain-Gauges Built on GTS-Based and Historic Data; Global Precipitation Climatology Centre: Berlin, Germany, 2011. [Google Scholar]
  21. Friesen, J. Spatio-Temporal Patterns of Rainfall in Northern Ghana. Master’s Thesis, Faculty of Mathematics and Natural Sciences, University of Bonn, Bonn, Germany, 2002. [Google Scholar]
  22. Healy, R.; Cook, P. Using groundwater levels to estimate recharge. Hydrogeol. J. 2002, 10, 91–109. [Google Scholar] [CrossRef]
  23. Diluca, C.; Muller, W. Evaluation Hydrogeologique des Projets d’Hyraulique en Terrains Cristallins du Bouclier Ouest Africain; Cooperation Technique Project No. 82.2060.0; Bundesanstalt fur Geowissenschaft und Rohstoffe: Hanover, Germany, 1985. [Google Scholar]
  24. Panda, D.; Mishra, A.; Kumar, A. Quantification of trends in groundwater levels of Gujarat in western India. Hydrol. Sci. J. 2012, 57, 1325–1336. [Google Scholar]
  25. International Federation of Red Cross and Red Crescent Societies. Early Warning Early Action the Experience of West African Floods 2007–2008. Available online: http://www.climatecentre.org/downloads/ (accessed on 11 June 2014).
  26. Mahé, G. Surface/groundwater interactions in the Bani and Nakambe Rivers, tributaries of the Niger and Volta Basins, West Africa. Hydrol. Sci. J. 2009, 54, 704–712. [Google Scholar]
  27. Edmunds, M. Palaeoclimate and groundwater evolution in Africa—Implications for adaptation and management. Hydrol. Sci. J. 2009, 44, 781–792. [Google Scholar] [CrossRef]
  28. Sibanda, T.; Nonner, J.; Uhlenbrook, S. Comparison of groundwater recharge estimation methods for the semi-arid Nyamandhlovu area, Zimbabwe. Hydrogeol. J. 2009, 17, 1427–1441. [Google Scholar] [CrossRef]
  29. Crosbie, R.; Binning, P.; Kalma, J. A time series approach to inferring groundwater recharge using the water table fluctuation method. Water Resour. Res. 2005, 41. [Google Scholar] [CrossRef]
  30. Guerre, A. Synthese Des Connaissances Sur Les Ressources En Eau Souterraine Dans La Zone De L’ex-Programme D’hydraulique Villageoise Mali-Suisse; Programme D’Appui Institutionnel au Sectuer Eau, Cooperation Suisse au Developpement: City, Country, 2002. [Google Scholar]
  31. Heilweil, V.; Freethey, G.; Wilkowske, C.; Stolp, B.; Wilberg, D. Geohydrology and Numerical Simulation of Ground-Water Flow in the Central Virgin River Basin of Iron and Washington Counties, Utah; Department of Natural Resources,US Geological Survey for State of Utah: Salt Lake City, Utah, 2000. [Google Scholar]
  32. Intergovernmental Panel on Climate Change. Climate Change 2013: The Physical Science Basis. Available online: http://www.ipcc.ch/report/ar5/wg1/ (accessed on 15 May 2014).

