Jointly Modeling Autoregressive Conditional Mean and Variance of Non-Negative Valued Time Series

Business School, Dublin City University, 9 Dublin, Ireland
Econometrics 2019, 7(4), 48; https://doi.org/10.3390/econometrics7040048
Submission received: 9 August 2019
/
Revised: 9 December 2019
/
Accepted: 10 December 2019
/
Published: 16 December 2019
Abstract
:This paper considers observation driven models with conditional mean and variance dynamics for non-negative valued time series. The motivation is to relax the restriction imposed on the higher order moment dynamics in standard multiplicative error models driven only by the conditional mean dynamics. The empirical fit of a zero inflated mixture distribution is assessed with trade duration data with a large fraction of zero observations. All authors have read and agreed to the published version of the manuscript.
Keywords:
multiplicative error model; non-negative valued time series; conditional variance dynamics; zero-inflated mixture distributionJEL Classification:
C22; C58; C511. Introduction
Non-negative valued time series arise naturally in economic and finance data such as volatility and duration between trades. Dynamic specification of such series must ensure that predicted values remain non-negative. A commonly used specification is the multiplicative error model (Engle 2002b; Engle and Russell 1998). The multiplicative error model belongs to the class of observation driven models where the dynamics is driven by the lagged values of the observed data (Cox 1981). Although several variations of the multiplicative error model have been proposed (Bhogal and Variyam 2019; Brownlees et al. 2012; Pacurar 2008), the literature to date has focused mostly on modeling the dynamics of the conditional mean (first moment) process as an autoregression.
In one of the early studies that started this literature, Engle and Russell (1998) showed the close connection between the conditional mean autoregressive multiplicative error model with exponential distribution and the Gaussian generalized autoregressive conditional heteroskedasticity (GARCH) model. It is therefore somewhat surprising that less attention has been paid to the dynamics of higher order conditional moments in multiplicative error models. One reason might be that the multiplicative error model imposes a strong proportionality restriction on the higher order moments. For example, the conditional variance is a constant proportion of the square of the conditional mean in standard multiplicative error models (Engle 2002b, p. 429). Such strong restrictions may not only result in poor fit to the data but also raise difficulties in introducing conditional variance dynamics that is consistent with such restrictions.
This paper considers alternative specifications for non-negative time series that relax this proportionality restriction. There are three main departures of the proposed specification from the standard multiplicative error specification. First, the conditional mean dynamics is specified in (natural) logs rather than levels. Second, the specification introduces time-varying conditional variance dynamics. Third, the specification can accommodate non-negative series with a large number of zero values. The first and third features have been considered in the literature (Blasques et al. 2018; Harvey and Ito 2020; Hautsch et al. 2014). As described in more detail below, the proposed specification combines these three features to relax the proportionality restriction.
Section 2 considers two approaches to relaxing the proportionality restriction. The first approach is to introduce conditional variance dynamics in a multiplicative error specification. The difficulty is that the multiplicative error model constrains the type of conditional variance dynamics that remains consistent with the proportionality restriction. One way to get around this compatibility constraint is to let the variance parameter of the innovation distribution follow an autoregression. A similar approach was taken in Hansen (1994) to model higher order conditional moment (in his case third moment) dynamics. As in Hansen (1994), for this approach we need to specify a flexible non-negative valued distribution with a ‘free’ variance parameter. As shown in Section 2.1 the Gamma distribution, also used in Engle and Gallo (2006) for a multiplicative error model, is a tractable convenient distribution for this purpose.
The second approach is to consider an additive specification. The multiplicative specification can be transformed into an additive specification in logs. Proponents of the multiplicative error model argue against specifying the dynamics in logs (Engle 2002b, p. 429). The log transformation does not apply to non-negative series that may be exactly zero. Even for positive valued series, very small positive values may result in ‘inlier’ problems with very large negative log values. Furthermore if the object of interest is the level of series not its log, we need to specify an analytically ‘convenient’ distribution whose moments of the exponential transformations are tractable. Against these objections, however, there are also some important advantages of the log specification (Harvey and Ito 2020). The non-negativity constraint imposes parametric restrictions on the level dynamics and makes it difficult, for example, to include additional exogenous regressors that may not always take positive values. There is no difficulty (in principle) in including such additional exogenous regressors in a log additive specification.
For the purpose of this paper, another important advantage of the log specification is that the conditional variance dynamics can be introduced without being constrained by the proportionality restriction as in the multiplicative model. In order to accommodate zero valued observations, Section 2.2 considers a zero inflated mixture distribution for the innovations together with a log additive specification for the strictly positive part. The dynamics in this model are driven by two independent innovations. One is a binary indicator for the zero or positive value observation that follows a stationary two-state Markov chain. The other is the innovation that determines the size of the positive value outcome in log space. The conditional mean and variance dynamics for the strictly positive part can be specified using any of the widely used specifications.
Section 3 applies the proposed specifications to trade duration data with a large fraction of zero observations. To motivate the need of relaxing the proportionality restriction, Section 3.1 considers an informal but simple diagnostic that indicates that the proportionality restriction may not hold in the data. Section 3.2 compares the empirical fit of the proposed specifications with the standard multiplicative error model. The overall fit as measured by the information criteria favor the proposed specifications over the standard multiplicative error model. Difficulties with formally testing the presence or absence of conditional heteroskedasticity is discussed. As a further check of the appropriateness of the proposed specifications, Section 3 carries out conditional moment restriction tests to assess the adequacy of the proposed conditional mean and variance specifications.
2. Model Specifications
The standard multiplicative error model for a non-negative time series with autoregressive conditional mean takes the form (Engle 2002a; Engle and Russell 1998)
is the deterministic (seasonal or diurnal) component and is the deseasonalized series. The model is driven by the non-negative innovation term with unit mean and constant variance . The autoregressive conditional mean specification (1b) can be generalized to have more than one lag. The one lag specification is used in the majority of empirical applications. To keep the discussion simple, in what follows the simplest one lag specification is used in all model specifications considered in this paper.
The conditional moments of implied by this baseline multiplicative error model can be written
where the subscript indicates moments conditional on information available at i. typically consists of observable data up to observation . All higher order () conditional moments of are a constant proportion of powers of the conditional mean . In particular, the conditional variance is proportional to the square of the conditional mean (Engle 2002a, p. 429). This constancy of the squared coefficient of conditional variation,
is a restriction imposed not just by the baseline model but many of the multiplicative model specifications considered in the extensive literature on non-negative time series models as reviewed in Bhogal and Variyam (2019); Pacurar (2008).
This proportionality restriction may not adequately capture the conditional dynamics of time series leading to, for example, the well known problem of over- or under-dispersion. One of the few exceptions with time-varying conditional squared coefficient of variation is the parameter driven ratio of gamma model of Ghysels et al. (2004).
The main objective of this paper is to explore alternative specifications with time-varying conditional coefficient of variation. One approach is to consider the class of parameter driven models with additional random innovation terms in the conditional dynamics as in Ghysels et al. (2004). However, likelihood evaluation of parameter driven models requires integrating out the unobserved latent innovation terms. As this is rarely analytically feasible, estimation requires numerically approximating the likelihood which cannot only be inaccurate but computationally expensive. This paper therefore restricts attention to the class of observation driven models.
A natural approach to model time-varying conditional coefficient of variation is to specify time-varying conditional variance dynamics in addition to the conditional mean dynamics (1b). However, in a multiplicative error model the conditional variance is determined by the conditional mean due to the proportionality restriction
2.1. Time-Varying Variance Parameter
The expression (2) for suggests that one way to have a time-varying coefficient of variation is to make the variance parameter v of the innovation time-varying instead of the conditional variance of the observed series .
A GARCH type specification for a time-varying variance parameter can take the form
where the conditional innovation process is . is specified to depend on rather than to decouple its dynamics from that of . To ensure , we restrict the parameters to be positive. The conditional variance of the observed series is . Though is no longer a constant proportion of the squared conditional mean , the dynamics of the two conditional processes are not completely decoupled. (The terminology GARCH ‘type’ is used for (3) because it is the conditional variance of the innovation process . However, as shown above itself is not the conditional variance of the observed series .)
Any of a variety of alternative GARCH type specifications (Bollerslev 2010) could be used for instead of (3). For example, an EGARCH type model would specify the dynamics of as in
This specification ensures without further restrictions on the parameters . The conditional variance of under (4) is
There are two approaches to estimating the parameters in (3) or the parameters in (4). The first is the method of moments approach based on the conditional moment restrictions and with
This is a semiparametric estimator in that it does not require us to specify a parametric distribution for the innovation term . However, since the models (1a) and (3) or (1a) and (4) have six parameters to estimate we need to specify at least four additional moment conditions of the form or where denotes some function of variables in the information set .
The alternative approach is maximum likelihood estimation where we specify a parametric distribution for . A particularly convenient distribution for specifications (3), (4) is the gamma distribution with log-density parametrized as
where is the gamma function, and . The gamma distribution for multiplicative error models was considered in Engle and Gallo (2006).
2.2. Conditional Autoregression in Logs
The approach in Section 2.1 maintains the multiplicative error specification (1a). Although specifications (3) or (4) can make the conditional coefficient of variation time-varying, the first two conditional moments of the observed series are not fully decoupled due to the multiplicative error specification (1a).
If the observed series were strictly positive , the multiplicative specification can be made additive by the (natural) log transformation.
One important advantage of the log specification is that it frees us from the positivity constraints of each component , , . For example, this allows more freedom in how to specify the log deterministic component of the model including use of additional exogenous regressors. However, the main difficulty with the log specification is that it cannot handle boundary values . Many empirical applications of models of this type deal with data that have nontrivial fraction of observations such as the one considered in Section 3.
The zero observations can be dealt with by considering a distribution that is a mixture of a mass at zero and a distribution with strictly positive support. Such zero inflated or zero augmented distributions have been used in (static or cross-sectional) count data models (Liu et al. 2019). Applications of zero inflated mixture distributions to dynamic models of non-negative time series data are Hautsch et al. (2014) and Blasques et al. (2018). These two applications consider conditional autoregressive specifications in conditional mean or location parameter. The proposal in this subsection is to consider a specification with both conditional mean and variance dynamics.
In what follows let denote the observed diurnally adjusted variable, previously denoted . The proposed model for the observed variable is
, an indicator for strictly positive values, is assumed to follow a two-state Markov chain or with transition probability . Under state , is a draw from the zero mass. For state , is a draw from a distribution with strictly positive support. To ensure , the conditional dynamics under state is specified in terms of with mean and variance . For full generality, (5b) includes a GARCH-in-mean type term for some smooth function . To keep the model simple, in the empirical application in Section 3.
The log specification for the conditional mean was considered in Bauwens and Giot (2000). Their Log-ACD model applies only to strictly positive valued series (as it depends on ). The Log-ACD model takes the form
As with the other multiplicative error models, this model has constant squared coefficient of conditional variation v.
Model (5) is an observation driven model with two (statistically) independent innovations (discrete) and (continuous on strictly positive support). One interpretation of this model is an economy hit by two types of news or shocks, major () or regular (). If x is duration between trades, a major shock may require immediate action such as submitting a market order with . For a regular shock, can be interpreted as the strength or quality of shock with indicating ‘good’ news and indicating ‘bad’ news.
Because and are assumed independent, the log-likelihood function is separable in transition probabilities and the parameters of the strictly positive part. This separability can both be a curse or blessing. If there is dependence between the two, the model is mis-specified and estimates are likely to be biased or inconsistent. On the other hand, separability means that mis-specification of the conditional dynamics on the strictly positive part (to be discussed below) does not affect the Markov transition probability estimates. This robustness property in addition to simplicity of estimation is an important reason to consider the independence or separability assumption at least in the initial assessment of empirical fit. Furthermore, as illustrated in Section 3, the standard multiplicative error model (1) can be extended to account for zero valued outcomes by replacing (1a) with . The zero augmented model of Hautsch et al. (2014) does not have this separability property because of the unit conditional mean restriction in the multiplicative error specification.
For a sample of n observations, denote the vector of observed states and the vector of observed series. The joint log-likelihood function with parameter vector can be written
where . The first two terms in the log-likelihood depends only on the transition probabilities while the last term does not.
The first term depending on the initial observation is the ergodic distribution of the Markov chain. If we ignore this term, or condition on the first observation, the maximum likelihood estimates of the transition probabilities are available in simple closed form as , where is the number of observations with followed by . (Algebraic details are provided in the supplementary file). Because the initial condition becomes negligible for large sample sizes, I use these conditional estimates in the empirical application in Section 3. (The estimated transition probabilities from numerically maximizing the full likelihood including the first term is numerically practically the same as the conditional estimates for the data used in Section 3).
For the strictly positive part (5b) a number of autoregressive dynamic specifications can be considered for the conditional mean and variance . In contrast to the multiplicative specification, there is no proportionality restriction that constrains the dynamics of and . For the log-duration conditional mean , I consider a dynamic specification similar to that used in Hautsch et al. (2014) that depends on .
with stationarity condition . If this process is initialized at the unconditional mean , separability no longer holds as depends on the ergodic distribution of the Markov chain. To maintain separability, one can instead initialize the process at the sample mean of log positive durations. (In the empirical analysis of Section 3 I initialize at the unconditional mean evaluated at under the separability assumption.)
For conditional variance dynamics, I consider two specifications. The first is a GARCH type specification
with stationarity condition . The second is an exponential GARCH (EGARCH) type specification
with stationarity condition . Because both specifications depend on the same comment regarding separability and unconditional mean initialization as for the specification applies.
In relation to the two observation driven studies that use zero inflated distribution, both Hautsch et al. (2014); Blasques et al. (2018) focus on the conditional mean dynamics with constant conditional second moments. The mixture weight in Hautsch et al. (2014) follows dynamics specified in terms of log odds ratio and in Blasques et al. (2018) the mixture weight is a static (fixed) parameter. The dynamics in Blasques et al. (2018) is specified in terms of the location parameter of a zero inflated negative binomial distribution, an approach similar to Section 2.1 applied to the location parameter instead of the dispersion or variance parameter.
The r-th conditional moment of the observed variable is
Because the strictly positive part (5b) is specified in terms of , we need to make distributional assumptions to obtain moments of the level of . Under gaussianity , and is log-normal with moments
and squared coefficient of conditional variation
An alternative tractable distribution is the gamma distribution. If follows a gamma distribution with parameters , such that and , then and where is the digamma function and . The values , such that is a standardized log-gamma distribution are found by numerically solving the equations and . For the log-gamma case, for and the conditional moments of are
with squared coefficient of conditional variation
3. Empirical Application
3.1. Data
As an application of jointly modeling the conditional dynamics of mean and variance this section uses duration between trades as the non-negative variable . This is the type of data used in one of the earliest application (Engle and Russell 1998).
The sample is taken from one trading day (30 August 2017) on the Nasdaq TotalView-ITCH data feed. A record in the ITCH data feed is a message broadcast to all Nasdaq market participants. On 30 August 2017 there were 189,765,868 messages with 8428 unique ticker symbols. Of the five ticker symbols with the largest number of messages, I use two tickers AAPL (Apple Inc) and SPY (SPDR S&P 500 trust) for analysis. (The other three tickers are IWM, QQQ, GILD.) AAPL is a common stock while SPY is one of the largest exchange traded fund.
The following filter is applied to the raw data. All messages before the market open 9:30 and after market hours 16:00 are removed. Trades are then identified as messages of type E or C (for order executed messages). Each message has a time stamp recorded as an integer for nanoseconds since midnight and is the difference between the two time stamps.
The raw duration data were then diurnally adjusted by running a regression on dummy variables for every 10 minute interval between 9:30 and 16:00. The duration data show the well-known inverted U-shape where duration tends to be short near the beginning and end of market hours and (relatively) long during the middle of the trading day. The online supplementary file shows the diurnal pattern of duration data from the fitted regressions.
An alternative diurnal adjustment method that is commonly used is the smoothing cubic spline (Engle and Russell 1998). The supplementary file compares the regression method with the smoothing cubic spline. The two trends are quite similar near the beginning and end of the trading day when trading activity is high (short duration) and somewhat differ in the middle of the day when trading activity is low (long duration).
The diurnally adjust series is obtained by dividing the raw duration by the fitted values from either the fitted regression of smoothed spline. The resulting sample size for analysis is 36,441 for AAPL and 27,877 for SPY. By comparison the sample analyzed in Engle and Russell (1998) was trade duration data for IBM over the three months 1 November 1990 to 31 January 1991 for a sample size of 58,942. Table 1 compares the summary statistics of the diurnally adjusted data using the regression method and smoothing cubic spline.
A striking feature of the data is the large fraction of zero durations in the sample, about 40% for AAPL and 54% for SPY. The median duration for both tickers is approximately zero in this sample. As the resolution of the time stamps is nanoseconds, one might expect much less messages with the same time stamp. However, keep in mind that the time stamps are stored as (large) integers and that most trades are executed by an algorithm.
To test whether the zero durations occur randomly, the runs test (Wald and Wolfowitz 1940) was performed on the indicator series . As shown in Table 1 the test rejects the null of randomness at conventional sizes. (The test statistic would be the same regardless of the diurnal adjustment method as long as the adjusted series remain non-negative. However, CS30 returns negative values at the end of the trading day for AAPL as can be seen in the supplementary file. This explains the discrepancy in the value in Table 1).
The estimated Markov transition probabilities, however, do not indicate strong dependence of each state. The estimated probability of observing two consecutive zero durations is for AAPL and for SPY.
Figure 1 shows the autocorrelation functions of duration and its square . Though the autocorrelations are not strong (all below 0.1), they tend to be persistent and die out slowly. The autocorrelations of SPY is weaker than those of AAPL both for the level and squared durations. A noticeable feature of the autocorrelations of the squared durations is the spikes at various lags.
As can be seen in Table 1, there is little difference between the regression and spline adjusted series. The supplementary file compares the autocorrelations of the regression and spline adjusted series. The autocorrelations for AAPL are somewhat lower for the spline adjusted series than for the regression adjusted series. The autocorrelations for SPY are visually indistinguishable. The following analysis is primarily based on the regression adjusted series. However, as the regression adjusted series may not have completely removed deterministic time series dependence for AAPL, parameter estimates in Section 3.2 are also reported for the spline adjusted series in the supplementary file.
The motivation for jointly modeling the conditional dynamics of the first two moments was to relax the constant conditional coefficient of variation restriction in standard autoregressive duration models. Developing a nonparametric test for such a restriction would be useful but is beyond the scope of this paper. Instead I use a less formal but easy to compute visual diagnostic. The first two conditional moments , are approximated by a linear projection of , on variables in . Figure 2 plots the estimated first two conditional moments from a regression on a constant and , …, , , …, for every ten minute intervals with lags. (A summary of the fitted regressions for each ten minute interval are presented in the supplementary file.)
Under the proportionality restriction, the dots should lie on a straight line through the origin with positive slope. Figure 2 indicates that the slope is flat for both tickers and negatively sloped for SPY. The inverse relation between the two estimated conditional moments for SPY is indicative of volatile durations during active trading with short durations.
3.2. Estimation
For dynamic models of duration it is important not to confound the conditional autoregressive dynamics with the deterministic intraday seasonality in (1a). Engle and Russell (1998) jointly estimate the deterministic component and the autoregressive dynamics of . Because the models considered in this paper have a large number of autoregressive parameters to estimate for the conditional mean and variance process, I exploit the block diagonality of information matrix to split the parameter vector into components that are variation free. This keeps the dimension of the parameter vector to estimate from a single observed series to a reasonably small number for each sub-vector.
As explained in Section 3.1, the raw data are diurnally adjusted by a regression on time of day indicators. I also exploit the separability, conditional on the initial observation, of the Markov chain transition probability parameters from the parameters of the autoregressive processes as indicated in Section 2.2. To further economize on the number of parameters to estimate the conditional variance-in-mean term in (5b) is excluded by restricting .
The baseline model is the standard multiplicative error model (1) with unit exponential distribution denoted MEM in the tables. The parameters are restricted to be positive and (stationarity condition). I also consider the multiplicative error model with (1a) replaced with denoted MEMZ where follows the two-state Markov chain described in Section 2.2. Comparing the fit of MEM and MEMZ would indicate the importance of accounting for the presence of zero values in the series. (I have also tried a version of MEMZ with (1b) replaced with (6) with all parameters constrained to be positive. However, the estimates for and were both essentially at the zero boundary resulting in a singular Hessian for the computation of standard errors. I therefore use the standard conditional mean specification (1b) for MEMZ.)
I consider three specifications with conditional autoregression in logs with zero inflated distribution discussed in Section 2.2. The model (5) with constant conditional variance is denoted LNZ. The model with GARCH type time-varying conditional variance (7) is denoted LNZ-G and the model with EGARCH type time-varying conditional variance (8) is denoted LNZ-E.
LNZ is a restricted (nested) version of the two more general specifications LNZ-G and LNZ-E. However, against the LNZ-G alternative the restrictions are at the boundary of parameter space where the ’s are restricted to be non-negative. This is a well-known problem in the GARCH literature and the usual test statistic (such as the likelihood ratio) has a non-standard distribution under the null (Andrews 2001; Francq and Zakoïan 2009; Silvapulle and Sen 2004). Conducting a formal statistical test for the nullity of GARCH parameter in this application is beyond the scope of this paper and left for future research.
As an informal method to compare the in-sample fit of the five models considered above, I use the likelihood based information criteria. Sin and White (1996) have obtained conditions for information criteria to consistently select the model with lower average Kullback-Leibler information for dependent and heterogeneous processes. The models may be non-nested or mis-specified (and the information criteria may not select the ‘correct’ model but only the model with lower information). Checking under what conditions these conditions may be satisfied for the class of models considered in this paper is beyond the scope of this paper. I therefore use an information criterion as an informal measure of goodness-of-fit for these models.
Table 2 and Table 3 show the maximum likelihood estimates for the five models using the series diurnally adjusted with the regression method. The Markov chain transition probability estimates are the same as those in Table 1. Standard errors in parentheses are based on the QML covariance (except for the transition probabilities), the so-called ‘sandwich’ estimator that is robust to mis-specified distributional assumption.
The estimates for MEM and MEMZ are similar to those reported for other duration data in the literature (Engle and Russell 1998). The estimated measure of conditional mean persistence is very close to the non-stationary boundary of one. This is consistent with the persistent sample autocorrelations of durations in Figure 1. The estimated is larger and smaller for MEMZ compared to MEM. And this difference is larger for SPY which has a larger fraction of zeros than for AAPL.
For each ticker symbol, the conditional mean process parameter estimates are similar across the three specifications LNZ, LNZ-G, LNZ-E with the same signs. , a measure of persistence of the conditional mean process, is positive and consistent with the sample autocorrelations in Figure 1. , the association with the previous news term , is somewhat weaker for the specifications with time-varying conditional variance than the baseline with fixed conditional variance particularly for SPY.
The GARCH parameter estimates for LNZ-G are restricted to be positive to ensure . A measure of persistence in the conditional variance process based on the GARCH specification (7) is which is estimated to be for AAPL and for SPY. The weaker second moment dependence in SPY is consistent with the sample autocorrelations for the squared durations in Figure 1. Given the large sample size, the GARCH parameters are estimated precisely with tight confidence intervals.
The conditional variance (7) of LNZ-G depends on the size of but not its sign. LNZ-E relaxes this restriction and depends on both the size and sign of . The sign effect parameter is positive and precisely estimated for both tickers indicating higher volatility after news that increases mean duration than news that decreases mean duration. indicates that volatility tends to be higher after a zero duration trade than a positive duration trade. The latter result is consistent with the hypothesis that high activity (low duration) is associated with high volatility. The measure of volatility persistence for LNZ-E is again higher for AAPL than for SPY as was the case with LNZ-G specification.
The maximized log-likelihood values are larger for the Gaussian log specifications LNZ, LNZ-G, LNZ-E models than for the multiplicative error model unit exponential MEM, MEMZ. The various information criteria which penalize models with a larger number of parameters still favor the LNZ, LNZ-G, LNZ-E models over MEM, MEMZ. The log-likelihood for MEMZ is lower than that of MEM despite having two additional transition probability parameters. The two models are not nested since there are no restrictions on the transition probabilities (which must add up to one) that yield the MEM specification as a special case. This indicates misspecification of the zero inflated mixture of the unit exponential multiplicative error model for this data set. Comparing LNZ, LNZ-G, LNZ-E models the information criteria ranks them in that order (high to low) for both AAPL and SPY.
As mentioned in Section 3.1, the regression adjusted duration series may not have completely removed the deterministic dependence especially for AAPL. The supplementary file reports maximum likelihood estimates for the cubic spline adjusted duration series. They show that the estimates are practically the same. For AAPL, the estimated is somewhat smaller and larger for the cubic spline compared to the regression adjusted series. The measure of persistence is practically the same: 0.998 (regression) versus 0.997 (cubic spline). (persistence measure for the conditional mean process (6)), (persistence measure for the conditional variance process (7)), (persistence measure for the conditional variance process (8)) are also practically the same.
3.3. Conditional Moment Tests
The in-sample estimates discussed above indicate better fit for the log specifications in Section 2.2 than the multiplicative error models. As discussed above, the test for constant conditional variance for the LNZ-G model is non-standard due to the null hypothesis being on the boundary of the parameter space.
Ideally, a (pseudo) out-of-sample comparison would provide additional evidence regarding the importance of time-varying condition variance specification. Unfortunately, however, I only have access to data for one trading day and cannot perform an out-of-sample test.
As an alternative complementary in-sample specification test, I carry out the conditional moment tests of Newey (1985); Wooldridge (1991). The restrictions of interest are r conditional moments of the form for an vector . For any matrix of instruments , termed ‘misspecification indicators’ by Wooldridge (1991), the law of iterated expectations imply the q unconditional moment restrictions
under the null hypothesis . The test is to check whether the sample analogue of (9) is close to zero. The conditional moment test can be made robust to certain misspecifications. For example, the conditional mean test may be robust to misspecified conditional variance and the test for conditional variance may be robust to misspecification of higher order moments provided the first two moments are correctly specified under the null (Wooldridge 1991).
Instead of the regression form of Wooldridge (1991) I use the test in Hautsch (2012, 5.6.5) based on the long-run covariance to account for potential serial correlation and heteroskedasticity in the sample moments. It appears important to correct for potential serial correlation as some of the moment conditions appear to be persistent with a large bandwidth selected for the long-run covariance.
The ‘art’ in implementing a conditional moment test is how to choose the relevant moments and instruments for the test. This depends on which aspects of the model specification we want to test. For this application, I consider two types of tests. The first is designed to test the whether the conditional mean (6) is correctly specified. This test would be robust to misspecification of the conditional variance process. For the conditional mean test, I set
and use two sets of instruments . The first set is the ‘placebo’ set where
This is called a placebo set because we do not expect the test to reject the moment restrictions for these instruments as the conditional mean specification (6) controls for both and .
The second set uses where
and do not always add up to one since for . This is a slightly modified version of the lagged sign bias variables used in Engle and Ng (1993). The conditional mean specification (6) does not control for the sign of . As the conditional mean also depends on the conditional variance for the Gaussian model, the test may not reject if controls for the sign of as in the LNZ-E specification (8).
The second type of test is to test the conditional variance specifications (7) and (8) assuming the conditional mean (6) is correctly specified. Thus these tests are valid provided the first type of test is not rejected. For the conditional second moment test, I set
and consider two sets of instruments and . These two instrument sets are chosen to see if one of the conditional variance specification (7) or (8) can ‘encompass’ the other non-nested specification. One expects LNZ-G to pass the test with instruments and LNZ-E to pass the test with instruments . The tests of interest are the LNZ-G specification with instruments and the LNZ-E specification with instruments .
The results of these conditional moment tests are presented in Table 4. The top two blocks are the results for the conditional mean tests. The test using placebo instruments and lagged sign bias instruments give similar results for both tickers and bandwidth selection method. The conditional mean specification is rejected for MEMZ and LNZ with large test statistic values. LNZ-E and LNZ-G also reject for AAPL though the test statistic values are smaller than those for MEMZ/LNZ. For the conditional mean tests, MEM does not reject but LNZ-G/LNZ-E do for AAPL but it is the opposite for SPY.
The conditional variance tests are reported in the bottom two blocks of Table 4. The multiplicative specifications MEM/MEMZ are rejected for both instrument sets with large test statistic values. The constant conditional variance specification LNZ is near the borderline of accept/reject at conventional test sizes. For either ticker neither the LNZ-G nor LNZ-E specifications are rejected using either of the instruments.
These conditional moment test results indicate the importance of controlling for autoregressive conditional variance at least for this data sample. Accounting for zero inflation alone (with constant conditional variance) does not appear to be an adequate specification.
4. Concluding Remarks
This paper considered conditional autoregressive specifications for non-negative time series with both conditional mean and variance dynamics. A proposed parsimonious specification with zero inflated mixture distribution appears to provide a reasonable fit to financial trade duration data with a large fraction of zero durations. The application focused on modeling duration between trades, that is, autoregressive conditional duration models. However, the proposed specifications can be generally applied to any non-negative valued time series.
It remains to be seen how important it is to relax the proportionality restriction imposed by the standard multiplicative error specifications for other non-negative time series data such as number of shares traded. As the empirical analysis was limited to a sample one trading day, it is also of interest to see how the proposed specifications perform in a longer sample. In particular, various (pseudo) out-of-sample diagnostics could be used to examine the importance of relaxing the proportionality restriction.
Another important area for future work is to devise a model free, or nonparametric, test of the proportionality restriction of the first two conditional moments. One can also consider specifications that relax the proportionality restriction with parameter driven models following the lead in Ghysels et al. (2004).
The empirical fit of zero inflated mixture distribution for samples that do not have excessive fraction of zero observations is also worth exploring. It is not the fraction of zero observations per se that is important. Rather it is the dependence in zero observations that the Markov chain model tries to capture. Although there is a temptation to generalize the model by including adding lags or dependence between the Markov chain and the strictly positive part of the distribution, the exercise has been to focus on the importance of jointly modeling the conditional mean and variance dynamics with a parsimonious specification.
There are several theoretical loose ends that need to be worked on. The properties (consistency and asymptotic gausssianity) of the maximum likelihood estimator need to be established for the proposed class of models. As mentioned in Section 3.2 the test for constant conditional variance for the LNZ-G specification is non-standard. It remains to be established whether the approach used for the GARCH volatility models (Andrews 2001; Francq and Zakoïan 2009; Silvapulle and Sen 2004) can be extended to the LNZ-G type models. Another result of interest is whether the consistency conditions for information criteria established by Sin and White (1996) can be verified for the class of models proposed in this paper.
Supplementary Materials
The following is available online at https://www.mdpi.com/2225-1146/7/4/48/s1.
Funding
This research received no external funding.
Conflicts of Interest
The authors declare no conflict of interest.
References
- Andrews, Donald W. K. 1991. Heteroskedasticity and Autocorrelation Consistent Covariance Matrix Estimation. Econometrica 59: 817–58. [Google Scholar] [CrossRef]
- Andrews, Donald W. K. 2001. Testing When a Parameter is on the Boundary of the Maintained Hypothesis. Econometrica 69: 683–734. [Google Scholar] [CrossRef] [Green Version]
- Bauwens, Luc, and Pierre Giot. 2000. The Logarithmic Acd Model: An Application to the Bid-Ask Quote Process of Three NYSE Stocks. Annales d’Economie et de Statistique 60: 117–49. [Google Scholar] [CrossRef]
- Bhogal, Saranjeet Kaur, and Ramanathan Thekke Variyam. 2019. Conditional duration models for high-frequency data: A review on recent developments. Journal of Economic Surveys 33: 252–73. [Google Scholar] [CrossRef] [Green Version]
- Blasques, Francisco, Vladimír Holý, and Petra Tomanová. 2018. Zero-Inflated Autoregressive Conditional Duration Model for Discrete Trade Durations with Excessive Zeros. unpublished work. [Google Scholar]
- Bollerslev, Tim. 2010. Glossary to ARCH (GARCH). In Volatility and Time Series Econometrics: Essays in Honour of Robert F. Engle. Oxford: Oxford University Press, pp. 137–64. [Google Scholar]
- Brownlees, Christian T., Fabrizio Cipollini, and Giampiero M. Gallo. 2012. Multiplicative Error Models. In Handbook of Volatility Models and Their Applications. Hoboken: Wiley, Chp. 9. pp. 225–47. [Google Scholar]
- Cox, D.R. 1981. Statistical Analysis of Time Series: Some Recent Developments. Scandinavian Journal of Statistics 8: 93–115. [Google Scholar]
- Engle, Robert F. 2002a. Dynamic Conditional Correlation: A Simple Class of Multivariate Generalized Autoregressive Conditional Heteroskedasticity Models. Journal of Business & Economic Statistics 20: 339–50. [Google Scholar]
- Engle, Robert F. 2002b. New Frontiers for ARCH Models. Journal of Applied Econometrics 17: 425–46. [Google Scholar] [CrossRef] [Green Version]
- Engle, Robert F., and Giampiero M. Gallo. 2006. A multiple indicators model for volatility using intra-daily data. Journal of Econometrics 131: 3–27. [Google Scholar] [CrossRef] [Green Version]
- Engle, Robert F., and Victor K. Ng. 1993. Measuring and Testing the Impact of News on Volatility. Journal of Finance 48: 1022–82. [Google Scholar] [CrossRef]
- Engle, Robert F., and Jeffrey R. Russell. 1998. Autoregressive Conditional Duration: A New Model for Irregularly Spaced Transaction Data. Econometrica 66: 1127–62. [Google Scholar] [CrossRef]
- Francq, Christian, and Jean-Michel Zakoïan. 2009. Testing the Nullity of GARCH Coefficients: Correction of the Standard Tests and Relative Efficiency Comparisons. Journal of the American Statistical Association 104: 313–24. [Google Scholar] [CrossRef] [Green Version]
- Ghysels, Eric, Christian Gouriéroux, and Joann Jasiak. 2004. Stochastic volatility duration models. Journal of Econometrics 119: 413–33. [Google Scholar] [CrossRef]
- Hansen, Bruce E. 1994. Autoregressive Conditional Density Estimation. International Economic Review 35: 705–30. [Google Scholar] [CrossRef]
- Harvey, Andrew, and Ryoko Ito. 2020. Modeling time series when some observations are zero. Journal of Econometrics 214: 33–45. [Google Scholar] [CrossRef]
- Hautsch, Nikolaus. 2012. Econometrics of Financial High-Frequency Data. Berlin: Springer. [Google Scholar]
- Hautsch, Nikolaus, Peter Malec, and Melanie Schienle. 2014. Capturing the Zero: A New Class of Zero-Augmented Distributions and Multiplicative Error Processes. Journal of Financial Econometrics 12: 89–121. [Google Scholar] [CrossRef] [Green Version]
- Liu, Lei, Ya-Chen Tina Shih, Robert L. Strawderman, Daowen Zhang, Bankole A. Johnson, and Haitao Chai. 2019. Statistical Analysis of Zero-Inflated Nonnegative Continuous Data: A Review. Statistical Science 34: 253–79. [Google Scholar] [CrossRef]
- Newey, Whitney K. 1985. Maximum Likelihood Specification Testing and Conditional Moment Tests. Econometrica 53: 1047–70. [Google Scholar] [CrossRef]
- Newey, Whitney K., and Kenneth West. 1994. Automatic Lag Selection in Covariance Matrix Estimation. Review of Economic Studies 61: 631–53. [Google Scholar] [CrossRef]
- Pacurar, Maria. 2008. Autoregressive Conditional Duration Models in Finance: A Survey of the Theoretical and Empirical Literature. Journal of Economic Surveys 22: 711–51. [Google Scholar] [CrossRef]
- Silvapulle, Mervyn J., and Pranab Kumar Sen. 2004. Constrained Statistical Inference. Hoboken: Wiley, ISBN 0-471-20827-2. [Google Scholar]
- Sin, Chor-Yiu, and Halbert White. 1996. Information criteria for selecting possibly misspecified parametric models. Journal of Econometrics 71: 207–25. [Google Scholar] [CrossRef]
- Wald, Abraham, and Wolfowitz Wolfowitz. 1940. On a Test Whether Two Samples are from the Same Population. Annals of Statistics 11: 147–62. [Google Scholar] [CrossRef]
- Wooldridge, Jeffrey. 1991. Specification testing and quasi-maximum-likelihood estimation. Journal of Econometrics 48: 29–55. [Google Scholar] [CrossRef] [Green Version]
Figure 1.
Autocorrelation functions for duration between trades. The dashed lines are for the raw (unadjusted) durations and the solid line for diurnally adjusted durations (by the regression method) for two tickers AAPL and SPY in Nasdaq ITCH. (top two panels) for the level of durations and (bottom two panels) for squared durations. The shaded area is the bands.
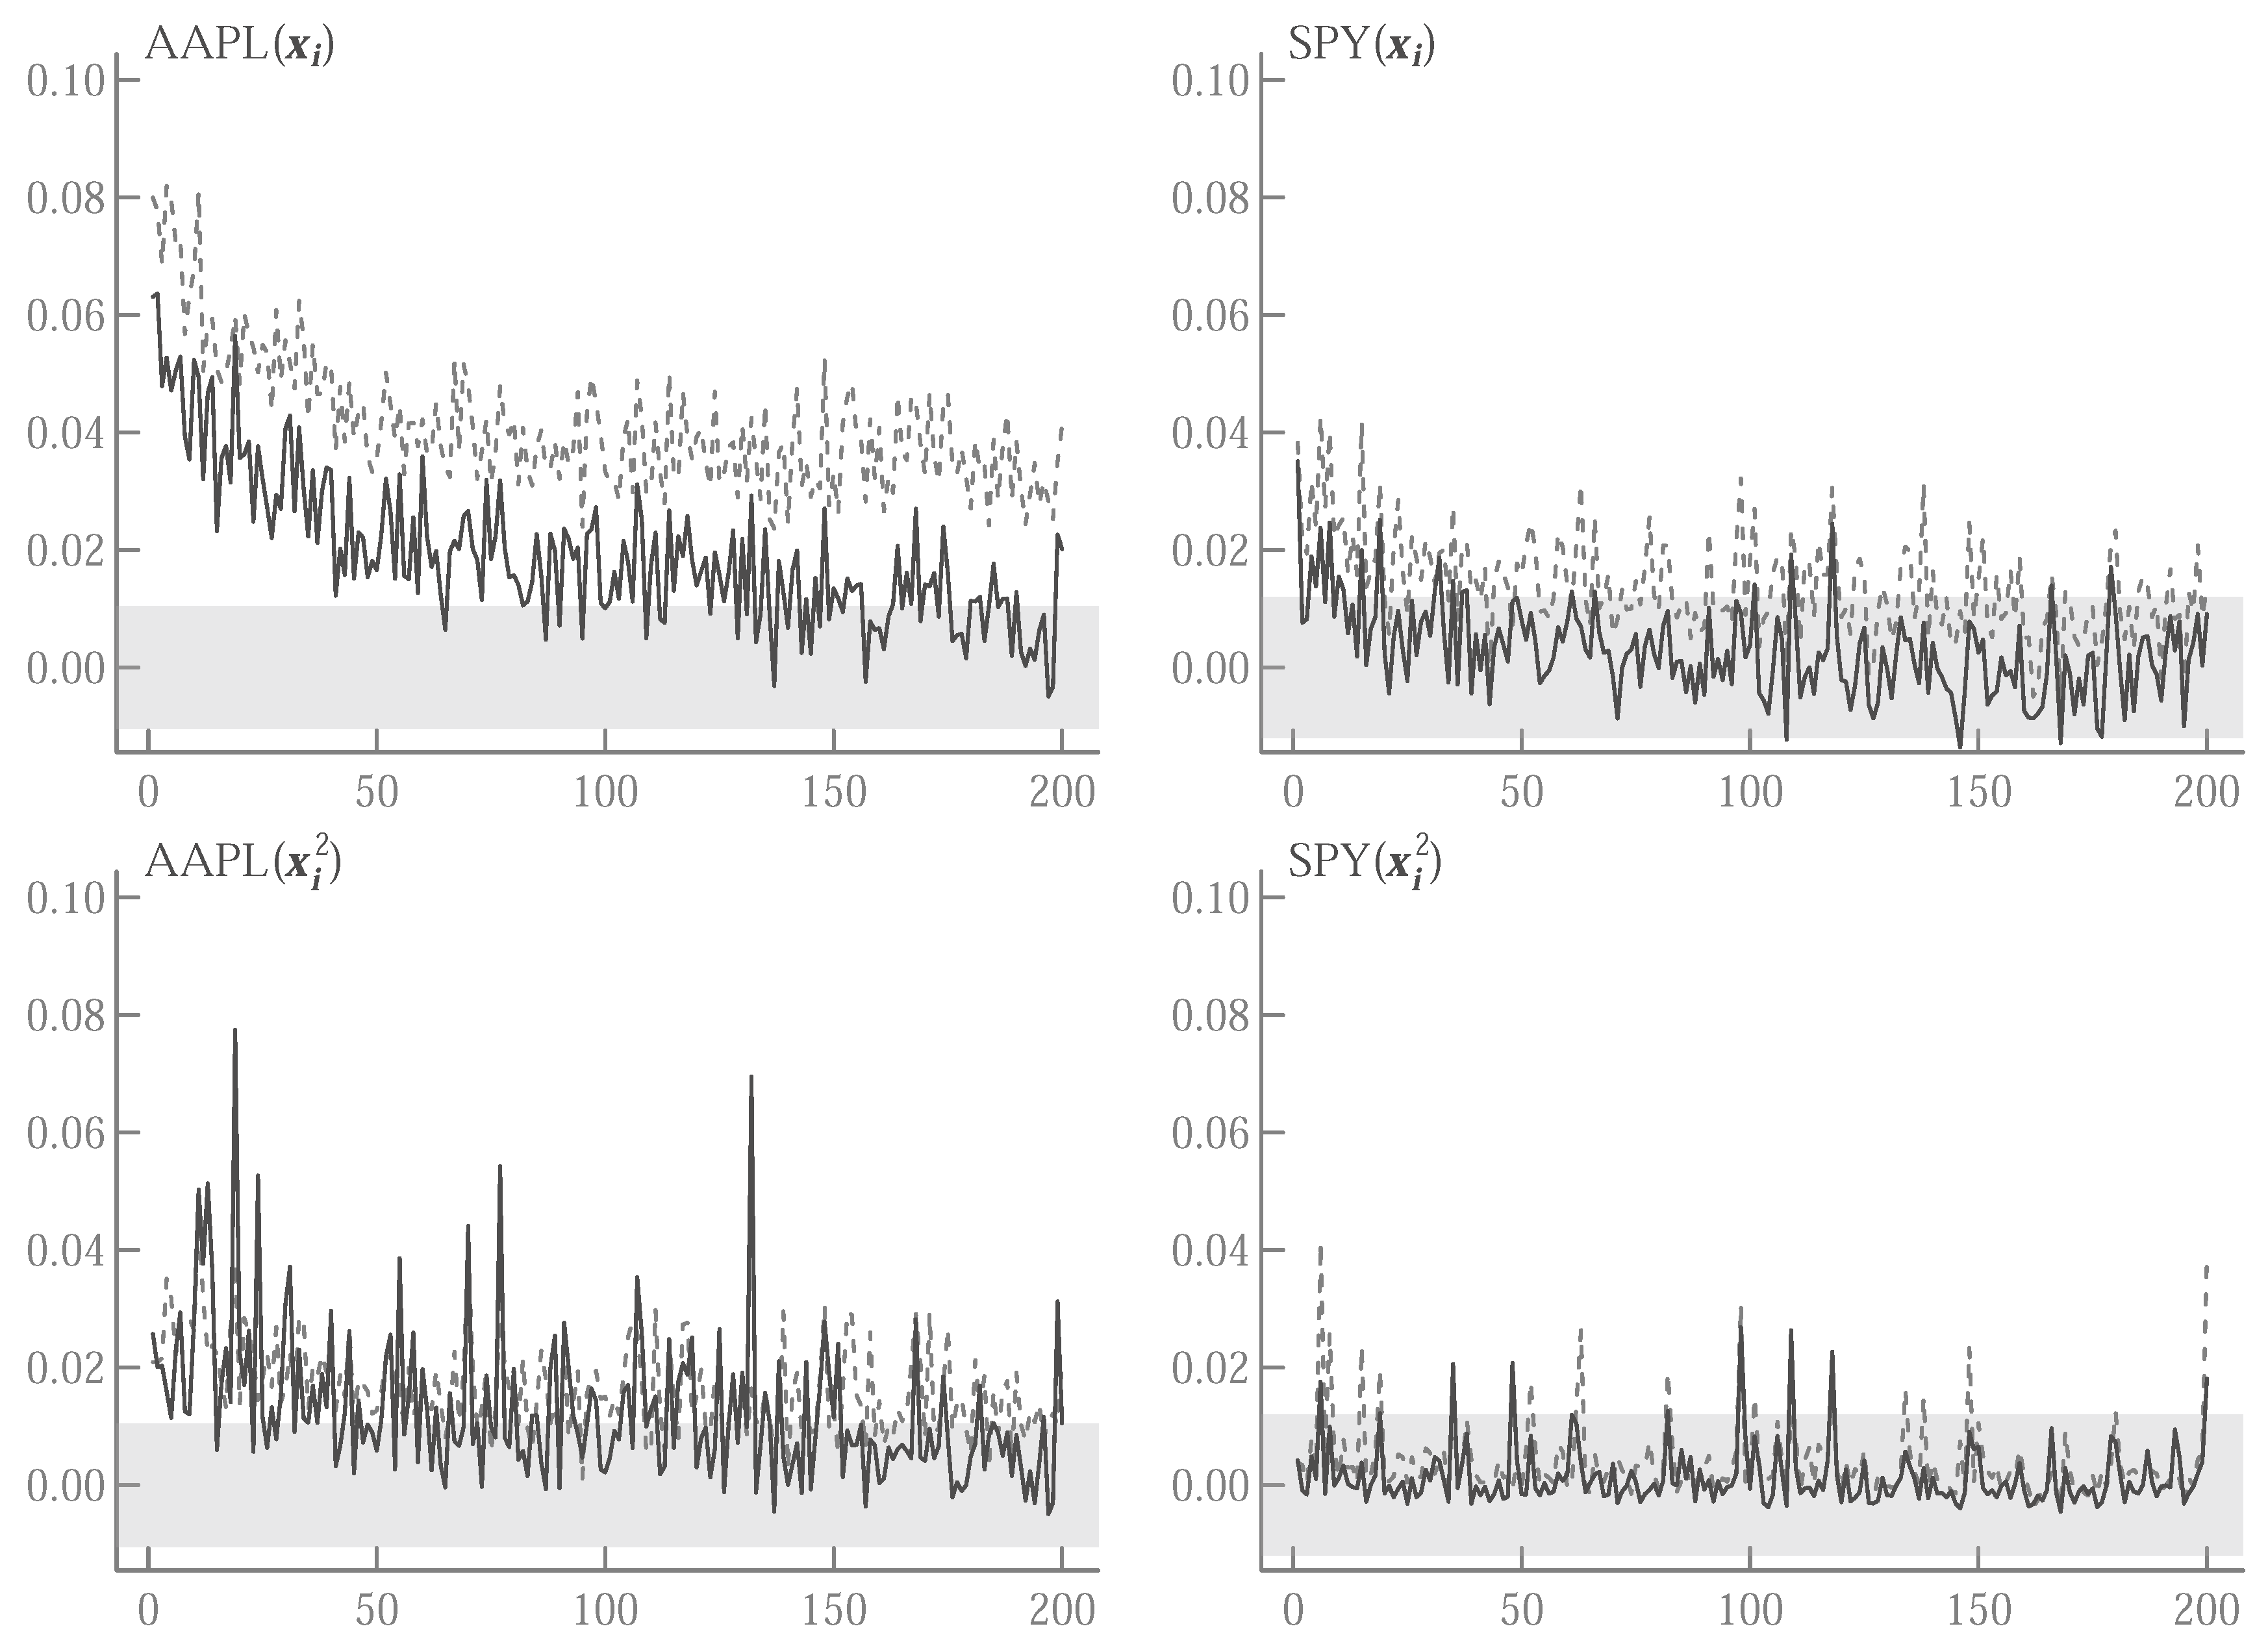
Figure 2.
Time variation of first two conditional moments of diurnally adjusted duration. The first two conditional moments are estimated by the least squares projections of on a constant and , …, , , …, for lags and for non-overlapping ten minute intervals between 9:30 and 16:00 on 2017-08-30. The estimated conditional standard deviation is plotted againts the conditional mean . Each point in the figure is an estimate from a ten minute interval. The dashed line is the fitted regression line through these points.


Table 1.
Summary statistics of diurnally adjusted duration . ‘Reg’ is from the regression on ten minute interval indicators, ‘CS10’ is the smoothing cubic spline with knots every ten minutes, ‘CS30’ with knots every 30 min. n is the number of observations between 9:30 and 16:00 on 30 August 2017, is the median, is the standard deviation, is the fraction of zero durations. is the z-score for the runs test for the null hypothesis that the indicator for non-zero duration is with p-values in square brackets. is the conditional maximum likelihood estimate for the Markov transition probability with standard errors in parentheses. is the sample (Pearson) correlation with ‘Reg’.
| AAPL | SPY | |||||
|---|---|---|---|---|---|---|
| Reg | CS10 | CS30 | Reg | CS10 | CS30 | |
| n | 36,331 | 36,331 | 36,331 | 27,877 | 27,877 | 27,877 |
| mean | 1.00 | 1.00 | 1.00 | 1.00 | 0.99 | 0.99 |
| 0.00 | 0.00 | 0.00 | 0.00 | 0.00 | 0.00 | |
| 2.66 | 2.57 | 2.85 | 3.35 | 3.26 | 3.31 | |
| max | 56.68 | 54.35 | 185.52 | 101.59 | 106.94 | 98.32 |
| 0.40 | 0.40 | 0.40 | 0.54 | 0.54 | 0.54 | |
| [0.000] | [0.000] | [0.000] | [0.000] | [0.000] | [0.000] | |
| 0.54 | 0.54 | 0.53 | 0.38 | 0.38 | 0.38 | |
| (0.004) | (0.004) | (0.004) | (0.004) | (0.004) | (0.004) | |
| 0.36 | 0.36 | 0.36 | 0.45 | 0.45 | 0.45 | |
| (0.003) | (0.003) | (0.003) | (0.004) | (0.004) | (0.004) | |
| 0.94 | 0.88 | 0.98 | 0.99 | |||
Table 2.
Maximum likelihood parameter estimates for AAPL duration ( observations). The (common to all models) estimated transition probabilites are = 0.539 (0.004) and = 0.361 (0.003) with standard errors in parentheses. MEM is the multiplicative error model (1) with unit exponential (), MEMZ is the zero augmented MEM, LNZ is the log duration model (5) and (6) with and constant conditional variance, LNZ-G is LNZ with Gaussian generalized autoregressive conditional heteroskedasticity (GARCH) (1,1) (7), LNZ-E is LNZ with EGARCH(1,1) (8). QML standard errors in parentheses. is the log-likelihood value per observation and , , are the Akaike, Bayesian (Schwarz), Hannan-Quinn information criterion, respectively.
| MEM | MEMZ | LNZ | LNZ-G | LNZ-E | |||
|---|---|---|---|---|---|---|---|
| 0.008 | 0.056 | −0.269 | −0.238 | −0.205 | |||
| (0.002) | (0.006) | (0.044) | (0.042) | (0.042) | |||
| 0.074 | 0.092 | 0.690 | 0.669 | 0.684 | |||
| (0.009) | (0.008) | (0.041) | (0.043) | (0.043) | |||
| 0.924 | 0.906 | −0.408 | −0.385 | −0.409 | |||
| (0.010) | (0.008) | (0.036) | (0.035) | (0.035) | |||
| 0.853 | 0.873 | 0.877 | |||||
| (0.017) | (0.015) | (0.015) | |||||
| 15.360 | 1.181 | 0.059 | |||||
| (0.115) | (0.430) | (0.018) | |||||
| 0.089 | 0.198 | ||||||
| (0.017) | (0.021) | ||||||
| 0.299 | 0.082 | ||||||
| (0.174) | (0.006) | ||||||
| 0.860 | 0.104 | ||||||
| (0.040) | (0.018) | ||||||
| 0.925 | |||||||
| (0.011) | |||||||
| −0.849 | −1.515 | −0.590 | −0.584 | −0.582 | |||
| 1.699 | 3.030 | 1.180 | 1.169 | 1.164 | |||
| 1.700 | 3.031 | 1.181 | 1.172 | 1.166 | |||
| 1.699 | 3.030 | 1.180 | 1.170 | 1.165 |
Table 3.
Maximum likelihood parameter estimates for SPY duration ( observations). The (common to all models) estimated transition probabilites are = 0.384 (0.004) and = 0.449 (0.004) with standard errors in parentheses. MEM is the multiplicative error model (1) with unit exponential (), MEMZ is the zero augmented MEM, LNZ is the log duration model (5) and (6) with and constant conditional variance, LNZ-G is LNZ with GARCH(1,1) (7), LNZ-E is LNZ with EGARCH(1,1) (8). QML standard errors in parentheses. is the log-likelihood value per observation and , , are the Akaike, Bayesian (Schwarz), Hannan-Quinn information criterion, respectively.
| MEM | MEMZ | LNZ | LNZ-G | LNZ-E | |||
|---|---|---|---|---|---|---|---|
| 0.024 | 0.179 | −0.151 | −0.148 | −0.121 | |||
| (0.007) | (0.030) | (0.039) | (0.038) | (0.038) | |||
| 0.037 | 0.134 | 0.934 | 0.871 | 0.883 | |||
| (0.007) | (0.021) | (0.046) | (0.046) | (0.046) | |||
| 0.942 | 0.858 | −0.428 | −0.389 | −0.406 | |||
| (0.011) | (0.021) | (0.039) | (0.038) | (0.038) | |||
| 0.835 | 0.850 | 0.852 | |||||
| (0.015) | (0.015) | (0.015) | |||||
| 13.424 | 2.206 | 0.172 | |||||
| (0.163) | (0.376) | (0.046) | |||||
| 0.155 | 0.353 | ||||||
| (0.014) | (0.029) | ||||||
| 1.798 | 0.110 | ||||||
| (0.266) | (0.011) | ||||||
| 0.693 | 0.251 | ||||||
| (0.035) | (0.032) | ||||||
| 0.829 | |||||||
| (0.024) | |||||||
| −0.964 | −1.468 | −0.831 | −0.826 | −0.825 | |||
| 1.928 | 2.936 | 1.663 | 1.654 | 1.651 | |||
| 1.929 | 2.938 | 1.665 | 1.657 | 1.654 | |||
| 1.929 | 2.937 | 1.664 | 1.655 | 1.652 |
Table 4.
Conditional moment tests. The null hypothesis under test is . MEM is the multiplicative error model (1) with unit exponential (), MEMZ is the zero augmented MEM, LNZ is the log duration model (5) and (6) with and constant conditional variance, LNZ-G is LNZ with GARCH(1,1) (7), LNZ-E is LNZ with EGARCH(1,1) (8). and indicate how the bandwidth was selected for the long-run covariance matrix used in the computation of the statistic. uses the nonparametric procedure of (Newey and West (1994)) and is the AR(1) based bandwidth of (Andrews (1991)). p-values in square brackets.
| AAPL | SPY | |||||||
|---|---|---|---|---|---|---|---|---|
| [-val] | [-val] | [-val] | [-val] | |||||
| , | ||||||||
| MEM | 0.24 | [0.888] | 0.42 | [0.811] | 63.85 | [0.000] | 66.62 | [0.000] |
| MEMZ | 134.14 | [0.000] | 247.40 | [0.000] | 32.47 | [0.000] | 40.45 | [0.000] |
| LNZ | 74.42 | [0.000] | 134.16 | [0.000] | 69.81 | [0.000] | 110.31 | [0.000] |
| LNZ-G | 16.51 | [0.000] | 16.63 | [0.000] | 1.08 | [0.583] | 1.15 | [0.563] |
| LNZ-E | 23.00 | [0.000] | 28.73 | [0.000] | 4.79 | [0.091] | 5.47 | [0.065] |
| , | ||||||||
| MEM | 10.11 | [0.039] | 10.01 | [0.040] | 70.17 | [0.000] | 74.67 | [0.000] |
| MEMZ | 148.55 | [0.000] | 275.39 | [0.000] | 37.17 | [0.000] | 47.10 | [0.000] |
| LNZ | 78.59 | [0.000] | 156.46 | [0.000] | 72.63 | [0.000] | 121.73 | [0.000] |
| LNZ-G | 21.11 | [0.000] | 20.11 | [0.000] | 2.22 | [0.696] | 2.34 | [0.674] |
| LNZ-E | 28.05 | [0.000] | 32.92 | [0.000] | 5.47 | [0.242] | 6.48 | [0.166] |
| , | ||||||||
| MEM | 185.52 | [0.000] | 192.12 | [0.000] | 163.57 | [0.000] | 167.92 | [0.000] |
| MEMZ | 285.97 | [0.000] | 311.37 | [0.000] | 72.65 | [0.000] | 72.52 | [0.000] |
| LNZ | 7.49 | [0.058] | 10.48 | [0.015] | 6.22 | [0.101] | 7.59 | [0.055] |
| LNZ-G | 0.10 | [0.991] | 0.11 | [0.991] | 0.11 | [0.991] | 0.11 | [0.991] |
| LNZ-E | 0.73 | [0.866] | 0.80 | [0.850] | 0.28 | [0.964] | 0.28 | [0.964] |
| , | ||||||||
| MEM | 193.96 | [0.000] | 193.70 | [0.000] | 111.43 | [0.000] | 112.49 | [0.000] |
| MEMZ | 286.87 | [0.000] | 288.54 | [0.000] | 46.36 | [0.000] | 46.47 | [0.000] |
| LNZ | 7.47 | [0.024] | 10.32 | [0.006] | 5.99 | [0.050] | 7.24 | [0.027] |
| LNZ-G | 0.10 | [0.950] | 0.10 | [0.950] | 0.04 | [0.979] | 0.04 | [0.979] |
| LNZ-E | 0.63 | [0.729] | 0.69 | [0.707] | 0.13 | [0.938] | 0.13 | [0.938] |
© 2019 by the author. Licensee MDPI, Basel, Switzerland. This article is an open access article distributed under the terms and conditions of the Creative Commons Attribution (CC BY) license (http://creativecommons.org/licenses/by/4.0/).
Share and Cite
MDPI and ACS Style
Kawakatsu, H. Jointly Modeling Autoregressive Conditional Mean and Variance of Non-Negative Valued Time Series. Econometrics 2019, 7, 48. https://doi.org/10.3390/econometrics7040048
AMA Style
Kawakatsu H. Jointly Modeling Autoregressive Conditional Mean and Variance of Non-Negative Valued Time Series. Econometrics. 2019; 7(4):48. https://doi.org/10.3390/econometrics7040048
Chicago/Turabian StyleKawakatsu, Hiroyuki. 2019. "Jointly Modeling Autoregressive Conditional Mean and Variance of Non-Negative Valued Time Series" Econometrics 7, no. 4: 48. https://doi.org/10.3390/econometrics7040048
Note that from the first issue of 2016, this journal uses article numbers instead of page numbers. See further details here.