Generalized Binary Time Series Models

1
Faculty of Statistics, TU Dortmund University, D-44221 Dortmund, Germany
2
Mathematical Institute, University of Mannheim, D-68131 Mannheim, Germany
*
Author to whom correspondence should be addressed.
Econometrics 2019, 7(4), 47; https://doi.org/10.3390/econometrics7040047
Submission received: 21 June 2019
/
Revised: 1 December 2019
/
Accepted: 9 December 2019
/
Published: 14 December 2019
(This article belongs to the Special Issue Discrete-Valued Time Series: Modelling, Estimation and Forecasting)
Abstract
:The serial dependence of categorical data is commonly described using Markovian models. Such models are very flexible, but they can suffer from a huge number of parameters if the state space or the model order becomes large. To address the problem of a large number of model parameters, the class of (new) discrete autoregressive moving-average (NDARMA) models has been proposed as a parsimonious alternative to Markov models. However, NDARMA models do not allow any negative model parameters, which might be a severe drawback in practical applications. In particular, this model class cannot capture any negative serial correlation. For the special case of binary data, we propose an extension of the NDARMA model class that allows for negative model parameters, and, hence, autocorrelations leading to the considerably larger and more flexible model class of generalized binary ARMA (gbARMA) processes. We provide stationary conditions, give the stationary solution, and derive stochastic properties of gbARMA processes. For the purely autoregressive case, classical Yule–Walker equations hold that facilitate parameter estimation of gbAR models. Yule–Walker type equations are also derived for gbARMA processes.
1. Introduction
Categorical time series data are collected in many fields of applications and the statistical research focusing on such data structures evolved considerably over the last years. As an important special case, binary time series that correspond to categorical data with two categories, occur in many different contexts. Often, binary time series are obtained from binarization of observed real-valued data. Such processes are considered, e.g., in Kedem and Fokianos (2002). In Figure 1, we show three real data examples of binary time series from different fields of research. For example, in Figure 1a, the eruption duration of the Old Faithful Geyser in the Yellowstone National Park is binarized using a threshold. It is coded with a value of one if an eruption lasts for longer than three minutes and zero if it is shorter. In economics, the two states of recessions and economic growth are of interest, as discussed, e.g., in Bellégo (2009). One example of a recession/no-recession time series is shown in Figure 1b, where for every quarter it is shown if Italy is in a recession, indicated by zero, or not, indicated by one. Recently, there is great interest in the air pollution in European cities, where an exceedance of the threshold of 50 g/m PM (fine dust) causes a fine dust alarm. The resulting sequence of states of no exceedance corresponding to zero and exceedance corresponding to one is shown in Figure 1c. Further examples can be found, e.g., in geography, where sequences with the two states of dry and wet days are considered, e.g., in Buishand (1978). In biomedical studies, binary time series occur in the case, where the participants keep daily diaries of their disease. For example, in clinical trials, as in Fitzmaurice et al. (1995), the binary self assessment of participants of their arthritis is collected, where poor is indicated by zero and good by one. In natural language processing, the occurrence of vowels as a sequence can be of interest, as considered in Weiß (2009b), where a text is binarized by detecting a consonant or no consonant/vowel as the two states. The binarization of a time series by a threshold, as, e.g., in the PM example, or by categorizing the time series into two states, as, e.g., in dry and wet days, indeed simplifies the real valued time series to a binary version. As mentioned in Kedem (1980), nevertheless, the transformation keeps the random mechanism from which the data are generated. For the example of PM data, it might often be of more interest, whether a certain threshold is crossed (or not) instead of the actual amount. In general, the rhythm within the binarized time series contains a great amount of information of the original data.
As discussed in Kedem (1980), binary Markov chains are typically used for modelling the dependence structure due to their great flexibility. However, the number of parameters to estimate from the data grows exponentially with the order of the Markov model leading to over-parametrization (see, e.g., McKenzie (2003)).
To avoid the estimation of a large number of parameters, Jacobs and Lewis (1983) proposed the class of (new) discrete autoregressive moving-average (NDARMA) models for categorical time series. More precisely, for processes with discrete and finite state space, a parsimonious model is suggested. The idea is to choose the current value for randomly either from the past values of the time series or from one of the innovations with certain probabilities, respectively. This random selection mechanism is described by independent and identically distributed (i.i.d) random vectors with
where denotes the multinomial distribution with parameter 1 and probability vector with , and such that . Then, the NDARMA(p,q) model equation is given by
where is an i.i.d. process taking values in a discrete and finite state space . Since for each time point t only one entry in the random vector is realized to be one while all others become zero, the value of takes either one of the values of for or one of the error terms for . This sampling mechanism assures that the time series takes values in the state space , such that, e.g., for a binary time series with , the process stays binary. In contrast to the real-valued ARMA model, the lagged time series values and errors are not weighted according to the model coefficients and summed-up since only one of them is actually multiplied with one and all the others with zero based on the realization of .
The model parameters are the probabilities of the multinomial distribution, summarized in the parameter vector P, where all entries of P lie in the unit interval and sum-up to one. In comparison to Markov Chains, NDARMA models maintain the nice interpretable ARMA-type structure and have a parsimonious parameterization. Furthermore, NDARMA models fulfill certain Yule–Walker-type equations, as shown in Weiß and Göb (2008).
In Figure 2, one realization of an NDARMA(1,0) process, denoted by NDAR(1),
with binary state space is shown. NDAR(1) models are probably the simplest members of the NDARMA class, but Figure 2 nicely illustrates the limited flexibility of the whole NDARMA class. The sampling mechanism of choosing the predecessor with some probability tends to generate long runs of the same value in particular when the parameter is large. A switching from one state to the other, e.g., from to , can only occur, e.g., if the error term is selected (with probability ) and the error term takes the value . Hence, the NDARMA class does not allow systematically selecting the opposite value of for .
As for the NDARMA class all model parameters are restricted to be non-negative, which explains in particular why the NDARMA class can model exclusively non-negative autocorrelations in the data. For the example of a NDAR(1) process, the autocorrelation at lag one is equal to , such that any alternating pattern that corresponds to negative model parameters as, e.g., observed in Figure 1a, cannot be captured. For a more detailed discussion of the properties of NDARMA models, we refer also to Jacobs and Lewis (1983) or Weiß (2009a). To increase its flexibility, Gouveia et al. (2018) proposed an extension of the NDARMA model class by using a variation function, but the resulting models do also not allow for negative model parameters and, hence, no negative dependence structure. Hence, whenever negative dependence structure is present in binary time series data, the NDARMA model is not suitable. In fact, in all three data examples of Figure 1, a straightforward estimation based on Yule–Walker estimators leads to at least some negative coefficients, such that NDAR models turn out to be not applicable.
To address this lacking flexibility of the NDARMA model class, we propose a simple and straightforward extension of the original idea of Jacobs and Lewis (1983) that allows also negative serial dependence. The resulting generalized binary ARMA (gbARMA) model class maintains the nicely interpretable model structure. Furthermore, no additional parameters are required to handle the negative dependence, preserving the parsimonious parameterization as well. In Figure 3, a realization of a gbARMA(1,0) process, denoted as gbAR(1), is shown. As a straightforward extension of an NDAR(1) model in Figure 2, gbAR(1) models allow for negative serial dependence. In fact, the range of the autocorrelation at lag one is extended from for NDAR(1) to for gbAR(1) models.
To allow for negative autocorrelation up to some limited extend, Kanter (1975) proposed the binary ARMA model class, where he applied the modulo 2 operator in an ARMA-type model equation. Using the modulo operation assures to stay in the binary state space, but the nice interpretability of the dependence structure in the model is lost since the past values of the time series are summed up prior to the modulo operation, see also McKenzie (1981). We follow a different path in this paper and propose a much simpler operation that enables modeling a systematic change of the state from one time point to the other.
The idea of allowing for negative serial dependence resulting in the gbARMA class is as follows: a negative model parameter (and hence a negative autocorrelation ) in binary time series data corresponds to the time series systematically changing from one state to the other over time. Hence, the natural idea to incorporate negative serial dependence in the binary NDAR(1) Model (Equation (2)) is to replace by as
holds. This leads to the model equation
This process has negative autocorrelation at lag one. Note that, in comparison to Equation (2), as here, we have to use its absolute value as the probability to select the . Altogether, for , we can define the generalized binary AR(1) (gbAR(1)) process by the model equation
Note that Equation (4) extends the parameter space from for NDAR(1) models to for gbAR(1) models. Further, note that, for identification of the model, we have to assume . Using indicator variables, Equation (4) can be compactly written as
with , , and .
In Figure 3, a realization of a gbAR(1) process with negative parameter is shown, where the time series tends to take systematically the opposite state of the predecessor. The corresponding autocorrelation plot reflects the negative serial dependence leading to an alternating pattern. Runs of the same state can only occur, when the error term is selected (with probability ) and the error term takes the same value as , that is, . The empirical autocorrelations for the Old Faithful Geyser data can be found in Figure 4a, where the pronounced alternating behavior clearly indicates negative linear dependence to be present in the data.
The idea of allowing for a negative model coefficient by replacing by in gbAR(1) processes (Equation (5)) can be also employed for each parameter in pth order gbAR processes, where each , may be replaced by in the model equation.
The paper is organized as follows. In Section 2, generalized binary AR processes of order are defined, where we also give stationarity conditions and state the stationary solution. Further, stochastic properties are derived that include formulas for the transition probabilities, the marginal distribution, and Yule–Walker equations. As a real data example, we illustrate the applicability of our model class to the geyser eruption data in Section 1. In Section 3, we present several simulation experiments. First, in Section 3.1, for the example of a gbAR(2) model, we illustrate the generality of the resulting gbAR model class in comparison to natural competitors including AR, NDAR, and Markov models of order two, respectively. In Section 3.2, we examine the estimation performance of Yule–Walker estimators in the gbAR models in Section 3.2.1. In Section 3.2.2, we investigate the benefit of using the parsimonious gbAR models in comparison to Markov models and their robustness in cases where the model is mis-specified. By adding a moving-average part to gbAR models in Section 4, ARMA-type extensions of gbAR models leading to gbARMA processes are discussed. We conclude in Section 5. All proofs are deferred to Appendix A.
2. The Generalized Binary Autoregressive (gbAR) Model Class
We define now generalized binary AR(p) (gbAR(p)) models for binary data based on the notation of NDAR(p) models by adopting the idea of replacing by for a negative parameter as in Equations (5) and (6) separately for all or some of the lagged values . To be most flexible, each parameter corresponding to the lagged value , is allowed to be either positive or negative, that is, , respectively.
2.1. gbAR Models
The parameter vector contains the probabilities of the multinomial distribution that controls the selection mechanism of NDAR models. As we allow now for , , i.e., the parameters can be negative, P has to be modified to serve again as a parameter vector of probabilities. This is achieved by taking entry-wise absolute values and we define
where such that . This enables us to give the definition of the generalized binary AR model of arbitrary order .
Definition 1
(Generalized binary AR processes). Let be a stationary process taking values in . Let be a binary error process such that is independent of with mean and variance . Let be the parameter vector with as in Equation (7) such that with the one vector of length . Further, let
be iid random vectors, which are independent of and . Then, the process is said to be a generalized binary AR process of order p (gbAR(p)), if it follows the recursion
with and for .
By rewriting the random variables , in the defining model (Equation (8)), the model can be represented in the spirit of Equation (5). However, the benefit of the representation in Equation (8) is that only one random variable is multiplied with the lagged value , whereas is an additional random variable that accounts for the switching that leads to negative model coefficients.
2.2. Stochastic Properties of gbAR Models
Before calculating moments of the binary time series process itself, we first consider the expectation of the random variables related to the multinomial selection mechanism. Noting that , we have
This enables us to compute the stationary mean of the process, directly leading to
If all parameters are non-negative, the above formula becomes due to and , leading then to the well-known formula for the mean of NDAR(p) models. Otherwise, we have for gbAR(p) models in contrast to NDAR(p) models (see, e.g., Weiß (2009a)).
For the familiar stationary condition imposed on the model parameters that all roots of the characteristic polynomial lie outside the unit circle, i.e., if
holds, the stationary solution of the gbAR(p) model can be derived. Note that the condition in (10) is equivalent to , such that the error has to be selected with strictly positive probability by the multinomial distribution. If the stationarity condition in Equation (10) holds, a moving-average representation of the gbAR(p) process can be derived.
For constructing the stationary solution of the gbAR time series, we follow the common approach based on a multivariate representation of the model, as in (Lütkepohl 2005, Chap. 11.3.2). Precisely, the gbAR(p) model can be written as a p-dimensional gbVAR(1) process with the following matrices and vectors, such that the first entry of is equal to the gbAR(p) process. We define
To obtain a vector autoregressive representation for , we have to define several matrices that contain the random variables of the multinomial distribution. Precisely, for , let
be matrices, where denotes the -dimensional zero matrix. Based on the notation introduced above, gbVAR(p) processes can be represented as a vector-valued gbAR model of first order (gbVAR(1)) as follows
where is the one vector of length p. The above notation enables us to state a moving-average representation of gbAR(p) processes as follows.
Theorem 1
(Moving-average representation of gbAR processes). Let be a stationary gbAR(p) process, that is fulfills Equation (10). Then, we have
- (i)
- For , the gbAR(1) model has a gbMA(∞)-type representation (in -sense), that is,where and since in .
- (ii)
- For , the gbAR(p) model has a gbMA(∞)-type representation (in -sense), that is,since in . Here, is the first unit vector and is the one vector of length p. The notation used here is obtained from that used in Section 4.2 for the special case of .
Hence, the process can be represented as an infinite weighted sum of the error terms. However, in comparison to classical AR or NDAR processes, an additional term appears that takes control of potential negative parameters and, consequently, allows for negative dependence to be modeled. This term vanishes if all parameters are positive.
The second-order dependence structure of gbAR processes coincides with that of AR or NDAR processes in the sense that the same Yule–Walker equations for hold. However, note again that the parameter space for gbAR models is considerably larger than for NDAR models allowing for negative parameters leading to more flexibility. The Yule–Walker equations link the model parameters to the autocovariances of the process. Hence, they can be used for estimating the model parameters by the same well-known Yule–Walker estimators. A link between the autocovariances, the model coefficients, and the mean and variance of the error terms is established by the Yule–Walker equation for , respectively.
Theorem 2
(Yule Walker Equations). Let be a stationary gbAR(p) process.
- (i)
- For all , we have
- (ii)
- For , we have
The next Lemma states some basic properties of the marginal distribution of gbAR processes and their transition probabilities. Since the time series has a binary state space, these conditional probabilities allow quantifying the probability to reach a certain state from the past values. In their derivation, the multinomial selection mechanism plays a crucial role and, in the stated formulas, the Kronecker delta indicates if a past value has actually impact on the outcome of the time series or not.
Lemma 1
(Marginal, joint and transition probabilities of gbAR processes). Let be a stationary gbAR(p) model and set . Then, the following properties hold:
- (i)
- (ii)
- (iii)
- (iv)
Comparing the results in Lemma 1 with (Weiß 2009a, Lemma 11.2.1.3) established for NDARMA(p,q) processes, the main difference is in Part (iii). The marginal distribution of the NDARMA process is equal to the marginal distribution of the error term process, but this does not hold for gbAR processes. Instead, the marginal distribution of gbAR processes depends on an additional term that results from the absolute values of the negative parameters.
In the following example, let us conclude this section with a more detailed look at the gbAR(1) model and a real data example.
Example 1
(gbAR(1) process). Let be a gbAR(1) process with parameter vector , and . The iid error term process follows the distribution such that and . Then, the model equation equals
At each time point t, if , either the predecessor with probability or the error term with probability is selected by a multinomial distributed random variable to determine . In the case of , either with probability or the error term with probability is selected. That is, as for each t, either or is equal to one and the other is zero, it holds
For positive values of , the gbAR(1) model coincides with the NDAR(1) model. A corresponding realization is shown in Figure 2, where for large values of mainly the predecessor is chosen and long runs of the same value occur. Figure 3 shows one realization of a gbAR(1) process with negative value of . The time series switches its states from zero to one and vice versa at most time points.
The transition probability to move from state at time to state at time t is given by
The probability of the process taking the value depends on two terms. First, the probability of choosing the error term is multiplied by the probability of the error term taking the same value as , e.g., with . If the probability of choosing the predecessor is added, it depends on its value and the sign of α. If, for example , then the probability of choosing is just added if its value is the contrary of , such that the Kronecker delta is equal to one. This leads to the representation of Equation (16) as
Example 2
(Eruption duration of the Old Faithful Geyser). The binarized eruption duration of the Old Faithful Geyser is illustrated in Figure 1a. Its empirical autocorrelation, as shown in Figure 4a, clearly indicates that there is negative serial dependence present in the data such that a gbAR(p) process appears to be appropriate. The order selection using the AIC criterion leads to a model of order with . This selection is confirmed by an inspection of the partial autocorrelation in Figure 4b. Parameter estimation is based on the Yule–Walker Equation (14) leading to the estimated parameter vector and the fitted model
The sample mean of the binary time series is equal to since long eruptions of the geyser arise more often than short eruption duration. The first parameter is indeed estimated to be negative and the second one to be positive. From , an error term is chosen with probability . In Figure 1a, a change from zero to one or vice versa can be observed in many time steps, whereas the run of ones in the time series correspond in most cases to choosing an error term. The error term distribution is calculated by Equation (9) with .
To measure the predictive power of the estimated model, we use ROC curves and the corresponding area under the curve (AUC). The ROC concept indicates a good predictive performance whenever the resulting curve is “far away” above the diagonal leading to an AUC larger than 0.5. Note that the diagonal corresponds to the case of independent observations, where no prediction based on past values is meaningful. For the one step ahead prediction, the transition probability of Lemma 1 (ii) is used by plugging in the estimated probabilities.
Comparing the predictor to the realized values in the sample leads to the ROC curve shown in Figure 5, where the corresponding AUC becomes . Hence, as the ROC curve is “far away” above the diagonal and the AUC is larger than 0.5, the prediction performance of the gbAR model turns out to be considerably better than that of a model that relies on independent observations. By allowing for negative model parameters, gbAR models appear to be suitable for this real data example that shows negative serial dependence.
For further improvement, the Yule–Walker estimates might serve as starting values for a maximum likelihood estimation (MLE) based on the conditional log-likelihood function
where (see also (Weiß 2018, (B.6))). However, the resulting parameter estimates differ only slightly from the Yule–Walker estimates , leading to virtually the same ROC and AUC.
To shed some light on the potential improvement of MLE in comparison to Yule–Walker estimation, we fit a gbAR(2) model to subsamples of length of the binarized Old Faithful Geyser data. The parameter estimates for Yule–Walker estimates and MLE are shown in Table 1. The results differ only slightly and decrease with increasing subsample sizes.
3. Generality of the gbAR Model Class and Estimation Performance
In this section, we investigate the generality of the gbAR model class in comparison to obvious competitors in Section 3.1 and address the estimation performance in different setups and in comparison to parameter-intensive Markovian models in Section 3.2.
3.1. Illustration of the Generality of gbAR Models
By construction of the gbAR model and in contrast to NDAR models, negative parameters are allowed such that negative autocorrelation is possible. Hence, the proposed gbAR model class clearly generalizes the NDAR model class. In this section, we aim to shed some light on the question how much more general the gbAR model actually is in comparison to other AR-type models such as AR, NDAR, and binAR models, as well as Markov models. For this purpose, we consider such models of order and study their generality. That is, we compare the parameter ranges of these four model classes as well as the possible ranges of pairs of autocorrelation . Precisely, we compare the flexibility of gbAR(2), NDAR(2), binAR(2), and AR(2) processes (even if they model continuous data) and second-order Markov chains. For all four autoregressive-type models, the autocorrelations depend on the model parameters as follows
For the gbAR(2), AR(2), and NDAR(2) processes, it holds .
For a stationary AR(2) process, the range of possible coefficients is restricted to and such that and . For a stationary NDAR(2) and binAR(2) process, the parameter range is restricted by with and in the binAR(2) process (for further details, see Weiß (2009b)). For a gbAR(2) model, the restrictions read with .
The parameter ranges of AR, NDAR, binAR and gbAR models of order two, respectively, are illustrated and compared in Figure 6a and the corresponding range of pairs of autocorrelations is shown in Figure 6b.
The parameter range as well as the range of autocorrelation pairs for the gbAR(2) model is considerably larger than those of an NDAR(2) model. The range of the classical AR model is again larger, but this is an unfair comparison as the AR model has been proposed for continuous data and is not suitable for binary data at all. In Figure 6b, the areas of AR(2), NDAR(2), and binAR(2) models are hyperboloid-shaped and, as shown in Jacobs and Lewis (1983), the autocorrelations of the NDAR(2) model take just positive values. In contrast to NDAR(2) processes, the binAR(2) process captures an additional area that corresponds to negative serial dependence. The range of autocorrelation pairs for the gbAR(2) is not hyperboloid-shaped, but forms a triangle. The range of this triangle comes actually close to the range of the AR(2) model, although the comparison with the AR(2) model is indeed unfair as the latter has been proposed for continuous data and the gbAR(2) for binary data. Compared to NDAR(2) processes, the extension allowing also for negative parameters leads to a much larger range of possible autocorrelation pairs than just the mirrored half parable. This is explained by the four times larger possible range for the model parameters of gbAR(2) processes in comparison to NDAR(2) processes, as shown in Figure 6a. In summary, by allowing for negative model parameters in gbAR models, we can get a considerably more flexible model class in comparison to NDAR models that is suitable to capture a wider range of dependence structures of binary time series data. In Figure 7, the possible range of autocorrelation pairs of gbAR(2) processes and Markov chains of order two are shown together. Recall that the gbAR(2) model is a parsimonious member of the class of Markov chains of order two and hence less flexible. Interestingly, with respect to pairs of autocorrelations of lags one and two, the possible range for the gbAR(2) model is only slightly smaller than that of a Markov chain of order two. Moreover, the largest range shown for the (continuous) AR(2) models in Figure 6b (in black) cannot be attained by Markov chains of order two. Hence, gbAR(2) models can to cover a large portion of the possible range of autocorrelation pairs of lags one and two of second-order Markov chains. However, keep in mind that for a pth-order Markov chain, parameter have to be estimated. For example, parameters need to be specified for a second-order Markov chain, whereas gbAR(2) processes only require three parameters.
3.2. Simulations
In this simulation study, we addressed two things. First, as shown in Section 3.2.1, we investigated the estimation performance of Yule–Walker estimators for gbAR models of different orders and sample sizes. Second, as shown in Section 3.2.2, we studied the flexibility of the gbAR model class and compared the prediction performance to Markovian models in the case where the estimated model was correctly specified as a gbAR model and in the case where the underlying model was a Markovian model that does not belong to the class of gbAR models.
3.2.1. Estimation Performance
To study the estimation performance of Yule–Walker estimators in gbAR models, we considered three different specifications of gbAR(p) processes with and sample sizes . Precisely, we considered the following gbAR data generating processes (DGPs):
- (DGP1)
- gbAR(1) with , , and .
- (DGP2)
- gbAR(2) with , , , and .
- (DGP3)
- gbAR(3) with , , , , and .
The model parameters summarized in P were estimated based on Yule–Walker Equation (14) and the error term distribution using Equation (9). Note that, in all setups, we considered gbAR models that make use of the extended parameter space by including negative parameters in the model. For each DGP, we simulated 1000 replications to calculate the mean squared error (MSE) to measure the estimation performance.
Table 2 summarizes the simulation results for all DGPs and all considered sample sizes. The estimation performance is generally good, as confirmed by rather small MSEs. It turns out that, as expected, in all considered setups, the estimation performance improves with increasing the sample size. It is interesting to note that, relative to the estimation of the other quantities, the estimation of the mean of the error terms is generally less precise. This can be explained by the fact that the error terms do enter the time series only in the case when it is actually selected which happens only with probabilities , and for the three DGPs, respectively. A comparison of the estimation performance of the gbAR models of different orders shows that the estimation performance declines with increasing order, which is of course plausible as the number of parameters gets larger, leading to more estimation uncertainty.
3.2.2. Robustness of gbAR Model Class
The class of gbAR(p) models form a parsimoniously parametrized subclass in the class of Markovian models of order p. To study the benefit of this newly proposed class of binary models, we wanted to compare the gbAR(p) model to Markov chains which are mostly used for binary data.
First, let us consider the case of an underlying gbAR model. Since gbAR(p) processes have a Markov chain representation, a comparison in terms of the transition probabilities becomes suitable. From Lemma 1 (ii), the transition probabilities of gbAR models compute to
First, for , we simulated from the gbAR(p) models defined for DGP1-3 in Section 3.2.1 realizations of different sample sizes to estimate the transition probabilities of: (a) a pth-order Markov chain and (b) a gbAR(p) process. For gbAR models, the true transition probabilities are given by Equation (18) and can be estimated by replacing the model parameters by the corresponding estimators. Then, the MSE is calculated model-wise and over all transition probabilities. For all three DGPs with model orders , the simulation results are stated in Table 3. By “MSE gbAR(p)”, we denote the mean squared error by evaluating the difference between the estimated transition probability and the truth over all possible transition probabilities from a gbAR(p) process. Equivalently, “MSE MC” denotes the corresponding difference between the estimated transition probability and the truth of a Markov model over all possible transition probabilities.
The MSEs are calculated over 1000 replications and show clearly that the estimated gbAR(p) transition probabilities have smaller MSEs for all sample sizes and orders in comparison to the MSEs of the Markov chain fits. This indicates that, in the case of an underlying gbAR(p) process, fitting the the more parsimonious model to the data leads to better estimation performance than fitting a Markov chain.
Next, we considered the situation where the underlying model is a Markov chain of order p that does not belong to the subclass of gbAR(p) models. In general, the -dimensional transition probability matrix Q of a Markov chain of order p is defined by
where
For the simulations, we had to make sure that the used specifications of Q are such that the resulting model is not a member of the gbAR class. For a set of specified transition probabilities, it is actually easy to check whether the resulting model is a gbAR model, by checking whether Equation (18) hold true.
It turns out that the class of gbAR(1) models and the class of binary Markov chains of order 1 coincide. Hence, for the simulations study, we chose transition probabilities such that Equation (18) does not hold for . Precisely, we set
Using such transition probabilities summarized in Q, binary time series were generated. Again, a gbAR(p) process and a pth order Markov chain were fitted. In Table 4, the MSE estimation performance for the different DGPs is summarized. Interestingly, although the corresponding gbAR fits (for ) do actually estimate the wrong models, with respect to MSE over all transition probabilities, their estimation performances for small sample sizes are superior to those of Markov chains that estimate the correct models. However, for large sample sizes, the estimated Markov models outperform the mis-specified gbAR model fits. As it is estimating the true model, this pattern was expected. In summary, for time series with small sample size, where the true underlying DGP is indeed a Markov chain and not a gbAR(p) process, the parsimonious gbAR model might be a good approximation, leading potentially to more precise estimates of the transition probabilities although the model is mis-specified.
4. Further Extension: The Generalized Binary ARMA Class
In this section, we extend the gbAR model class and give a definition of generalized binary ARMA (gbARMA) models that additionally contain a moving average part in their model equations. In the spirit of the gbAR model as an extension of the NDAR model class, we allow also for negative parameters in the moving-average part of the model.
First, we provide the definition of the gbARMA(p,q) model, derive its stationary solution, and state some basic properties of marginal, joint, and transition probabilities of gbARMA(p,q) processes. We conclude this section with an example of a gbARMA(1,1) process.
4.1. gbARMA Models
To be most flexible, the gbARMA model class allows additionally for negative parameters to capture negative dependence structure also in the moving average part. As before, we assume for identification reasons. In the gbARMA(p,q) model class, the parameters and are allowed to be either positive or negative, e.g., for and . To modify the parameter vector , again such that it contains the probabilities, we define
Definition 2
(Generalized binary ARMA processes). Let be a stationary process which takes values in . Let be a binary error process such that is independent of with mean and variance . Let be the parameter vector with as in Equation (21) such that . Further, let
be iid random vectors, which are independent of and . Then, the process is said to be a generalized binary ARMA(p,q) process, if it follows the recursion
with , and analogous definitions for and .
The model parameters are contained in the vector P with entries for , and for . Note that, as holds, no random variable is contained in the model equation.
With probability , a predecessor is chosen, whereas, with probability , the process takes the value of an error term , where it follows that .
4.2. Stochastic Properties of gbARMA Models
When dealing with possibly negative parameters also in the moving-average part of gbARMA models, the idea of Equation (4) is employed also for the lagged error terms. Hence, this allows modeling negative dependence in the moving average part as well. In the multinomial distribution, all values of the parameter vector P have to be considered in absolute value, thus we have to use as defined in Equation (21). For the expectation of gbARMA processes, two additional sums show up in comparison to the NDARMA case. Precisely, we have
The construction of the stationary solution of the gbARMA time series is similar to the construction of the gbAR(p) process introduced in Section 2.1 and (Lütkepohl 2005, Chap. 11.3.2). The vector representation of the process is equipped with a moving average part and thus the dimension of the corresponding random matrices becomes . Precisely, the gbARMA(p,q) model can be written as a -dimensional gbVAR(1) process with the following matrices and vectors, such that the first entry of is equal to the gbARMA(p,q) process. We define
To obtain a vector autoregressive representation for , we define directly matrices that contain the random variables of the multinomial distribution. Precisely, for , let
be matrices, where
are , and matrices, respectively, and . Based on the notation introduced above, gbARMA(p,q) processes can be represented as a vector-valued gbAR model of first order (gbVAR(1)) as follows
with being the one vector of length .
To derive a suitable stationarity condition for the process, we know from Lütkepohl (2005) that it corresponds to the characteristic polynomial of the parameter matrix .
From the block structure of , the polynomial can be reduced to the determinant of the block matrices and . Hence, a gbARMA(p,q) process is stationary if the roots of the characteristic polynomial of the autoregressive part lie outside the unit circle, that is, if
holds. The assumption is fulfilled whenever an error term has a positive probability, such that there exists a for some . Therefore, the sum over all probabilities of choosing a predecessor fulfills . Without any restriction, we assume that is strictly positive for a stationary gbARMA process, i.e., .
For a stationary gbARMA(p,q) process, a moving average representation can be derived using the above defined vectors and matrices.
Theorem 3
(Moving Average representation of gbARMA processes). Let be a stationary gbARMA(p,q) process with gbVAR(1) representation (Equation (23) ). Then, it follows that
where in and is the first unit vector.
The univariate moving average representation is obtained from the multivariate formula by multiplying it with the first unit vector because of .
Considering the autocorrelation structure, Jacobs and Lewis (1983) and Weiß (2011) showed that the NDARMA(p,q) model fulfils a set of Yule–Walker type equations which was also derived by Möller and Weiß (2018) for the GenDARMA class of categorical processes. The following result shows that this property is maintained for the gbARMA class.
Theorem 4
(Yule–Walker-type equations). Let be a stationary gbARMA(p,q) process. Set for . Define coefficients recursively by
Then, the autocovariance function for lags is obtained by
The autocovariances of the NDARMA and GenDARMA processes can only be positive, whereas the Yule–Walker type equations of gbARMA processes allow for possibly negative model parameters for and .
For the generalized binary ARMA model, formulas for the marginal, joint and transition probabilities can be calculated, extending the results from Lemma 1.
Lemma 2
(Marginal, joint, and transition probability of gbARMA processes). Let be a stationary gbARMA(p,q) process. Then, the following properties hold:
- (i)
- (ii)
- Defining then it follows
- (iii)
- (iv)
The flexibility of gbARMA models obtained by allowing for negative parameters shows also in the transition probabilities and in the joint and marginal distributions. Hence, more complex structures can be captured since systematic changes in the error terms are allowed as well.
We conclude this section with an example of a gbARMA(1,1) model.
Example 3
(gbARMA(1,1) process). Let be a stationary gbARMA(1,1) process. Then, the process follows the recursion
Four sign combinations of parameter pairs are possible and the corresponding model equations are given as follows:
Whereas for identification purposes only takes positive values, the predecessors and are systematically switched if the corresponding model parameters are negative, respectively.
For a stationary gbARMA(1,1) process, the moving average representation fulfills the following equation:
From the stationarity assumption, we have , and .
The moving average representation consists of three parts. There first is a sum over all terms for the potential case of . This part accounts for the choosing a predecessor and its switching. Since is strictly positive, the second is a sum over all error terms without any modification occurs. In the third sum, the random variable appears for controlling the case of .
5. Conclusions
By extending the NDARMA model class of Jacobs and Lewis (1983) to allow for negative parameters in the binary state space, the generalized binary ARMA model remains parsimonious, but it becomes more flexible to allow for negative model parameters and, hence, negative dependence structure in the data. The extension of the model to a more general parameter space enables the application to real data without having that many restrictions as in the NDARMA model class. Although the extension leads to additional terms in the model equation, the Yule–Walker equations still provide a direct way to estimate the model parameters.
We discuss stationarity conditions for gbARMA models and derive the stationary solution. The resulting moving average representation shows an additional term, compared to most MA(∞)-type representations. These additional terms control for the switching of the states.
An illustration of autocorrelation pairs of four different models of order 2 shows a comparison of the captured dependence structure of the time series models. It reveals that the proposed gbARMA model can capture a wide range of negative and positive dependence structures. A second-order Markov chain is shown to capture only a slightly larger range of negative dependence structure that gbAR(2) models. Hence, by allowing for negative parameters, the proposed extension of the NDARMA model class leads to a new model class that allows capturing a wide range of dependence structures in binary time series data, while maintaining a parsimonious parametrization. Moreover, in small sample sizes, parsimonious gbAR models might turn out to be beneficial in cases where the model is actually mis-specified as they may provide a sufficient approximation to the true model.
Author Contributions
Both authors contributed to the methodology, investigation, writing and formal analysis. The software was written by L.R. and the supervision and conceptualization was given by C.J.
Funding
This research was financially supported by the Eliteprogramme for Postdocs of the Baden—Württemberg Stiftung.
Acknowledgments
Large parts of this research were conducted while Carsten Jentsch held a position at the University of Mannheim, where he was financially supported by the German Research Foundation DFG via the Collaborative Research Center SFB 884 “Political Economy of Reforms” (Project B6).
Conflicts of Interest
The authors declare no conflict of interest.
Appendix A
Appendix A.1. Proof of Theorem 1
Proof.
By recursively inserting the model equation, the process can be expressed as
Since the random variables take values in and the process is also binary with mean , the convergence of the first part follows directly in quadratic mean (in sense), that is,
Part follows from Theorem 3 by setting . Its proof can be found in Appendix A.2. □
Appendix A.2. Proof of Theorem 3
Proof.
The convergence is shown by using the p-norm for a matrix A, which is induced by the vector norm, that is,
For , we get
Since the entries of lie in , it follows that and the expectation is given by with only positive values in . Consequently, the term vanishes for and as result we get the gbVMA representation. □
Appendix A.3. Proof of Theorem 2 and 4
Proof.
For a stationary gbARMA process, it follows
The above equation leads in the Yule–Walker equations of Theorem 2 since and for .
We now have to consider the covariance of the error terms and the time series. Therefore, we define the variable . For , it follows and, for , we have
For , we get
By defining , the recursion of Theorem 4 follows.
Part of Theorem 2 is directly obtained by inserting the model equation and by using the property of multinomial choosing only one entry of equal to one and all others to zero, such that
□
Appendix A.4. Proof of Lemma 1 and 2
Proof.
(i) The conditional probability is an immediate consequence from the model equation and multinomial distribution of the random variables and .
(ii) With the independence assumption on the error terms and Part , the conditional probability without conditioning on the current error term is:
(iii) Consider the probability that the time series is in state at time point t and note that .
Then, by rearranging the terms on the last right side, we get
(iv) Consider the joint probability of the error term and time series at time point t. We get
By inserting Part (iii) into the equation above, we get
Using the properties of the parameters, the joint distribution of the time series and error term is given by
□
References
- Bellégo, Christophe, and Laurent Ferrara. 2009. Forecasting Euro-Area Recessions Using Time-Varying Binary Response Models for Financial. Working Paper. Paris, France: Banque de France, vol. 259. [Google Scholar]
- Buishand, T. Adri. 1978. The Binary DARMA(1,1) Process as a Model for Wet-Dry-Sequences. Technical Note 78-01. Wageningen: Department of Mathematics, Statistics Division, Agricultural University Wageningen. [Google Scholar]
- Fitzmaurice, Garrett M., and Stuart R. Lipsitz. 1995. A Model for Binary Time Series Data with Serial Odds Ratio Patterns. Journal of the Royal Statistical Society: Series C (Applied Statistics) 44: 51–61. [Google Scholar] [CrossRef]
- Gouveia, Sónia, Tobias A. Möller, Christian H. Weiß, and Manuel G. Scotto. 2018. A full ARMA model for counts with bounded support and its application to rainy-days time series. Stochastic Environmental Research and Risk Assessment 32: 2495–514. [Google Scholar] [CrossRef]
- Jacobs, Patricia A., and Peter A. W. Lewis. 1983. Stationary Discrete Autoregressive-Moving Average Time Series Generated By Mixtures. Journal of Time Series Analysis 4: 19–36. [Google Scholar] [CrossRef]
- Kanter, Marek. 1975. Autoregression for discrete processes mod 2. Journal of Applied Probability 12: 371–75. [Google Scholar] [CrossRef]
- Kedem, Benjamin. 1980. Binary Time Series. In Lecture Notes in Pure and Applied Mathematics. New York: Marcel Dekker, Inc. [Google Scholar]
- Kedem, Benjamin, and Konstantinos Fokianos. 2002. Regression Models for Time Series Analysis. Hoboken: Whiley & Sons. [Google Scholar]
- Lütkepohl, Helmut. 2005. New Introduction to Multiple Time Series Analysis. Berlin/Heidelberg: Springer. [Google Scholar]
- McKenzie, Eddie. 1981. Extending the correlation structure of exponential autoregressive moving average processes. Journal of Applied Probability 18: 181–89. [Google Scholar] [CrossRef]
- McKenzie, Eddie. 2009. Discrete variate time series. Handbook of Statistics 21: 573–606. [Google Scholar]
- Möller, Tobias A., and Christian H. Weiß. 2018. Generalized Discrete ARMA Models. unpublished manuscript. [Google Scholar]
- Weiß, Christian H., and Rainer Göb. 2008. Measuring serial dependence in categorical time series. Advances in Statistical Analysis 92: 71–89. [Google Scholar] [CrossRef]
- Weiß, Christian H. 2009a. Categorical Time Series Analysis and Application in Statistical Quality Control. Berlin: de-Verlag im Internet GmbH. [Google Scholar]
- Weiß, Christian H. 2009b. Properties of a class of binary ARMA models. Statistics 43: 131–38. [Google Scholar] [CrossRef]
- Weiß, Christian H. 2011. Generalized choice models for categorical time series. Journal of Statistical Planning and Inference 141: 2849–62. [Google Scholar] [CrossRef]
- Weiß, Christian H. 2018. An Introduction to Discrete-Valued Time Series. Chichester: John Wiley & Sons, Inc. [Google Scholar]
Figure 1.
Three real data examples of binary time series: (a) binarized eruption duration of the Old Faithful Geyser over 299 eruptions; (b) quarterly detected binarized recession/no-recession time series of Italy from Quarter 1 in 1960 to Quarter 1 in 2017 (229 time points); and (c) binarized fine dust (PM) data from Stuttgart, Germany recorded daily from 3 March 2016 to 31 July 2018 over 881 days.

Figure 2.
Realization of an NDAR(1) process (Equation (2)) with parameter vector and error distribution and corresponding autocorrelation function (ACF).
Figure 2.
Realization of an NDAR(1) process (Equation (2)) with parameter vector and error distribution and corresponding autocorrelation function (ACF).

Figure 3.
Realization of a gbAR(1) process (Equation (4)) with parameter vector and error distribution and the corresponding autocorrelation function (ACF).
Figure 3.
Realization of a gbAR(1) process (Equation (4)) with parameter vector and error distribution and the corresponding autocorrelation function (ACF).
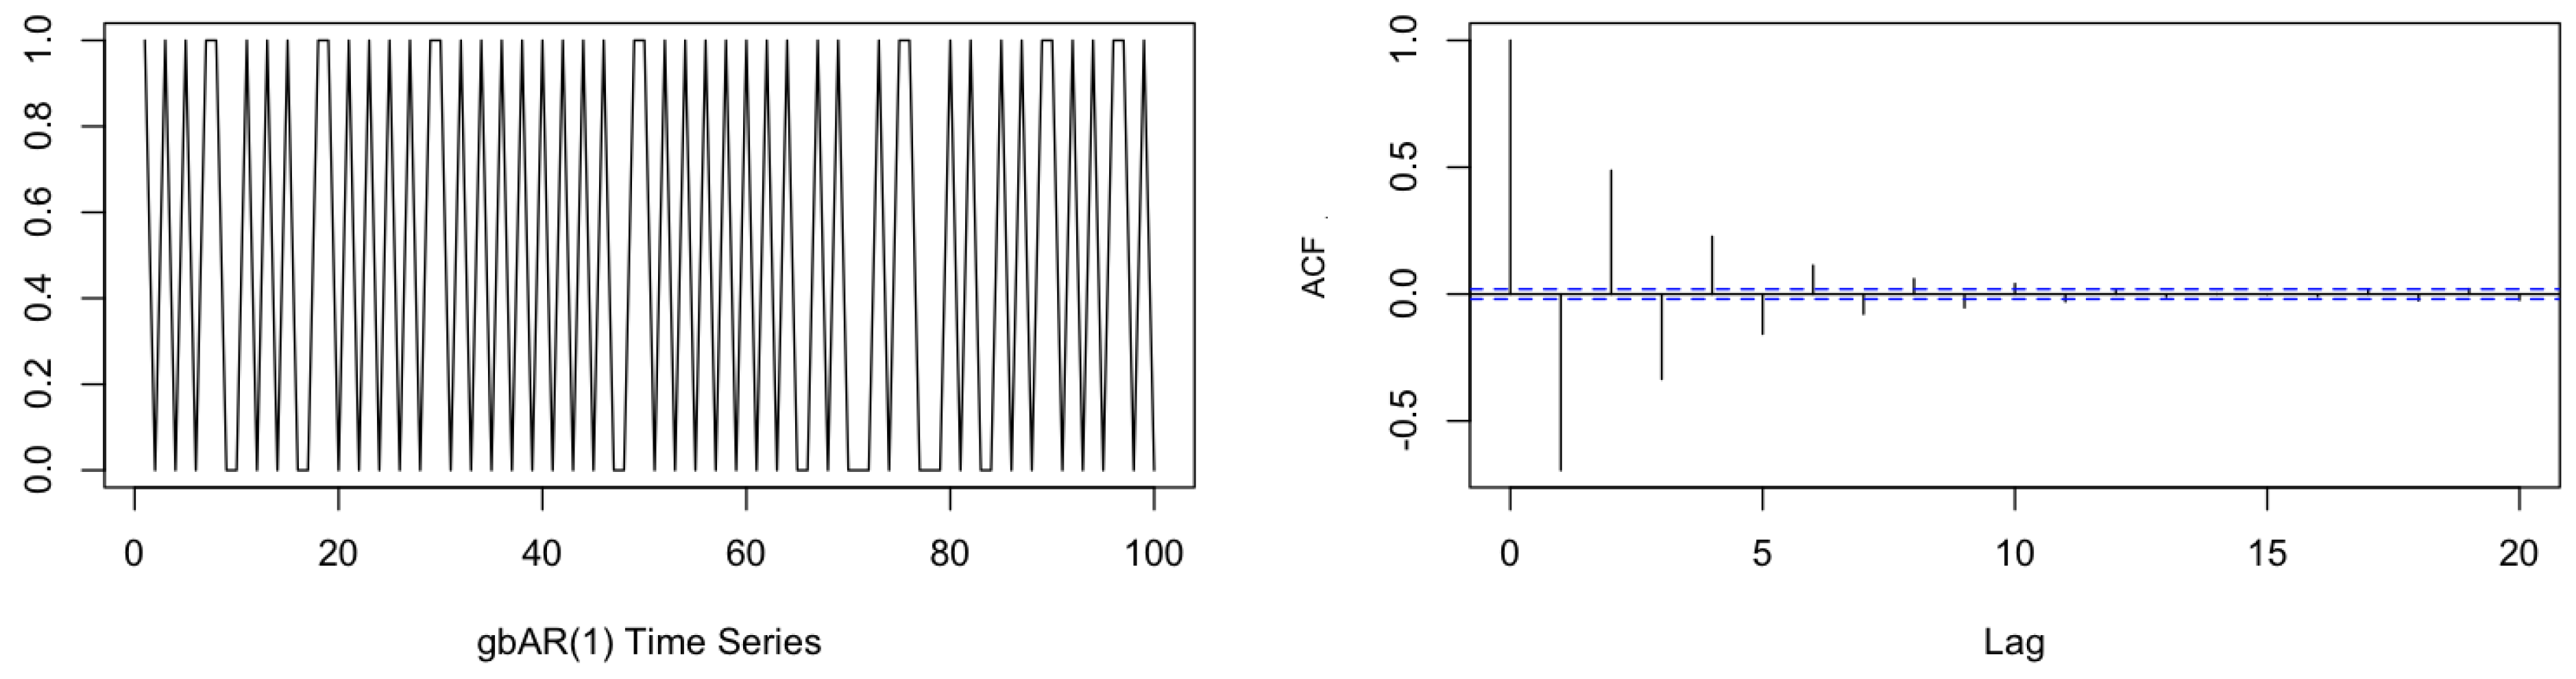
Figure 4.
Autocorrelation (ACF) and partial autocorrelation (pACF) of the Old Faithful Geyser data.
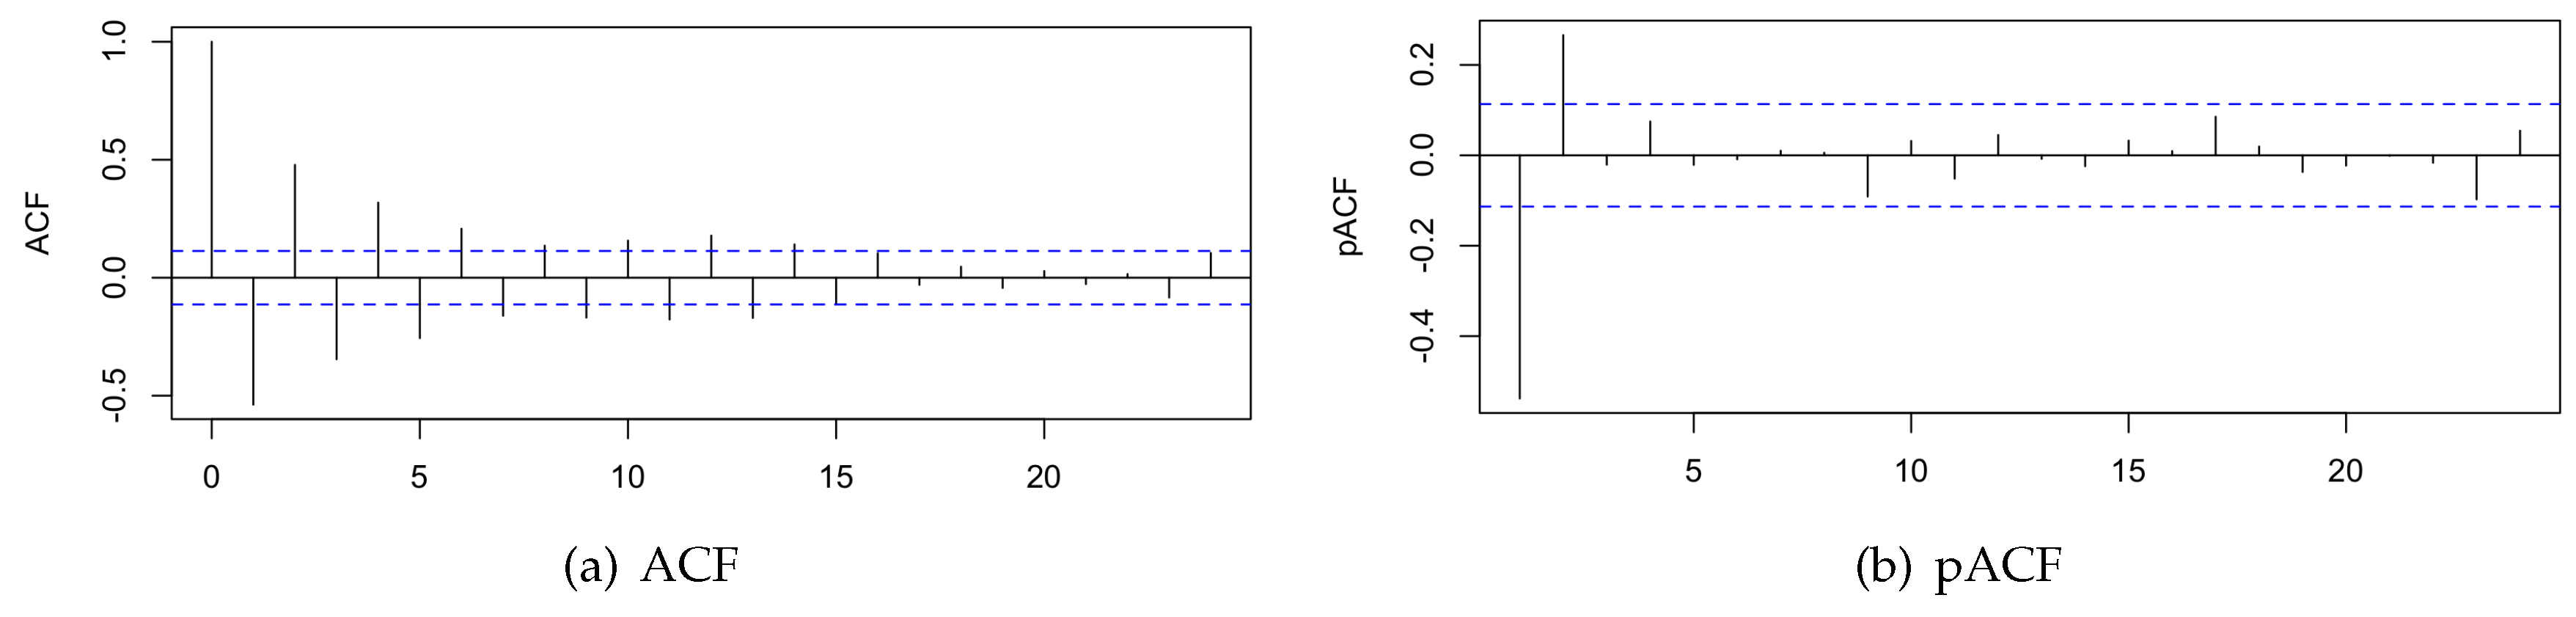
Figure 5.
ROC curves based on Yule–Walker estimation (black) and MLE (red) of a gbAR(2) model fitted to the binarized Old Faithful Geyser eruption duration leading to an in both cases.
Figure 5.
ROC curves based on Yule–Walker estimation (black) and MLE (red) of a gbAR(2) model fitted to the binarized Old Faithful Geyser eruption duration leading to an in both cases.

Figure 6.
Comparison of (a) parameter ranges of and (b) pairs of autocorrelations for AR(2) (black), gbAR(2) (red), binAR(2) (blue), and NDAR(2) (green) models.
Figure 6.
Comparison of (a) parameter ranges of and (b) pairs of autocorrelations for AR(2) (black), gbAR(2) (red), binAR(2) (blue), and NDAR(2) (green) models.
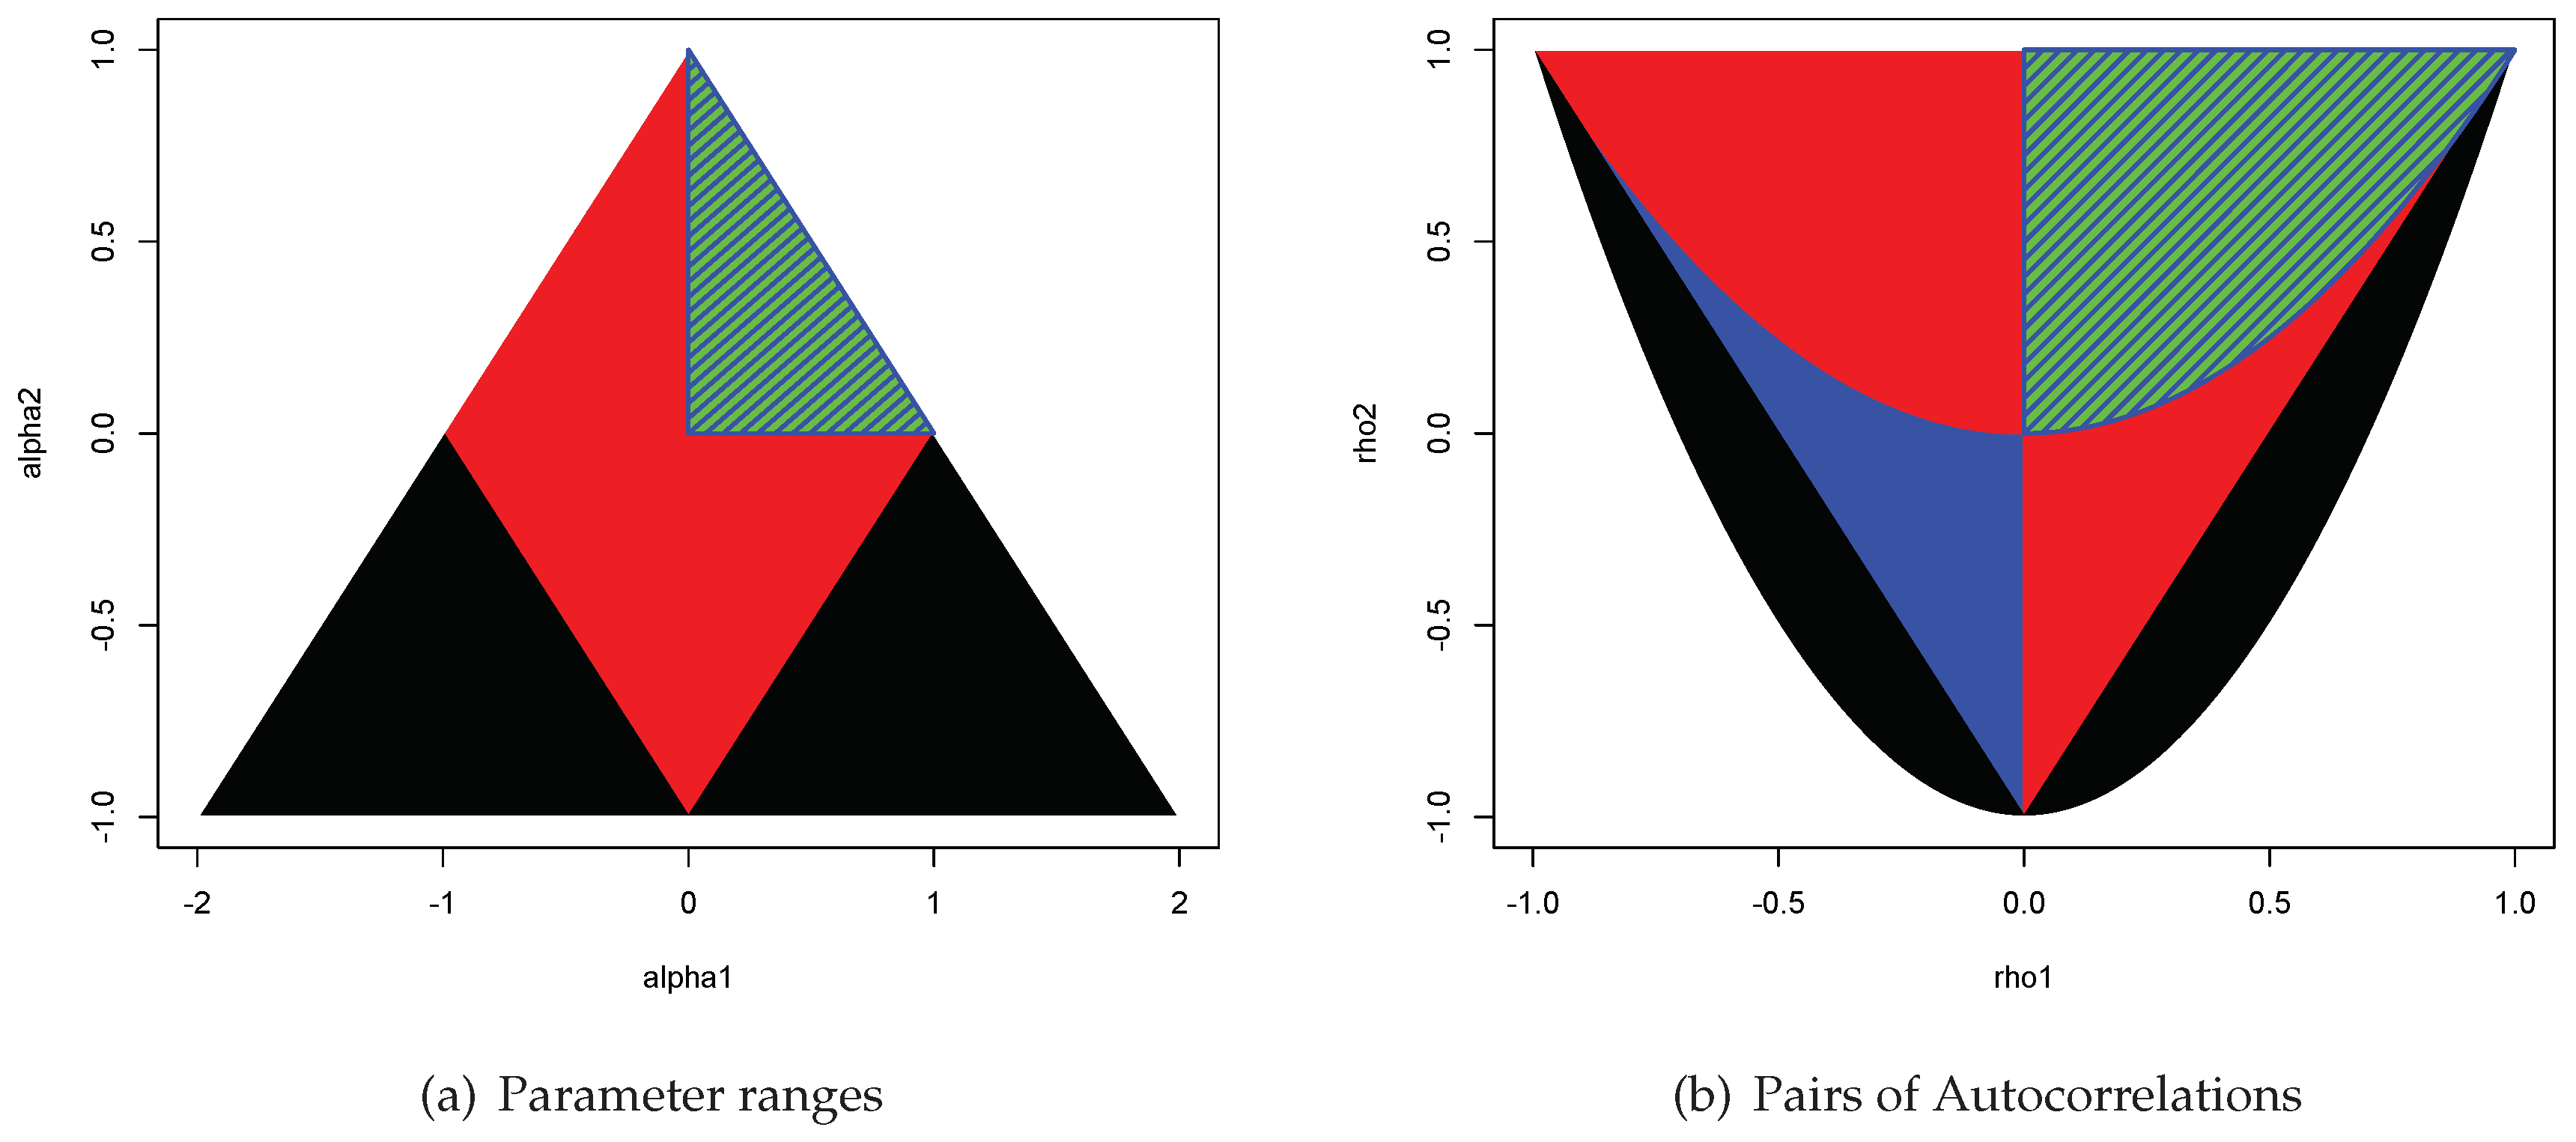
Figure 7.
Autocorrelation pairs of the gbAR(2) process (red) compared to the pairs of autocorrelation of a second-order Markov chain (blue).
Figure 7.
Autocorrelation pairs of the gbAR(2) process (red) compared to the pairs of autocorrelation of a second-order Markov chain (blue).


Table 1.
Comparison of (a) Yule–Walker and (b) MLE parameter estimates based on subsamples of length of the binarized Old Faithful Geyser data.
Table 1.
Comparison of (a) Yule–Walker and (b) MLE parameter estimates based on subsamples of length of the binarized Old Faithful Geyser data.
| (a) Yule–Walker | |||
| T | |||
| 50 | −0.5819 | 0.1444 | 0.2738 |
| 100 | −0.4610 | 0.2675 | 0.2715 |
| 150 | −0.3748 | 0.3382 | 0.2871 |
| 200 | −0.3738 | 0.3440 | 0.2822 |
| 250 | −0.4048 | 0.2625 | 0.3328 |
| 299 | −0.3949 | 0.2659 | 0.3393 |
| (b) MLE | |||
| T | |||
| 50 | −0.5556 | 0.1812 | 0.2632 |
| 100 | −0.4546 | 0.2822 | 0.2632 |
| 150 | −0.3658 | 0.3511 | 0.2830 |
| 200 | −0.3706 | 0.3514 | 0.2780 |
| 250 | −0.4004 | 0.2723 | 0.3259 |
| 299 | −0.3935 | 0.2711 | 0.3353 |
Table 2.
Estimation performance for several Yule–Walker parameter estimates with respect to mean squared errors for three different DGPs over 1000 Monte Carlo replications.
Table 2.
Estimation performance for several Yule–Walker parameter estimates with respect to mean squared errors for three different DGPs over 1000 Monte Carlo replications.
| T | MSE of | MSE of | MSE of | MSE of | MSE of | MSE of | |
|---|---|---|---|---|---|---|---|
| DGP1 | 100 | 0.00271 | 0.00022 | 0.03140 | 0.00271 | ||
| 200 | 0.00133 | 0.00011 | 0.01464 | 0.00133 | |||
| 500 | 0.00051 | 0.00004 | 0.00543 | 0.00051 | |||
| 1000 | 0.00025 | 0.00002 | 0.00262 | 0.00025 | |||
| DGP2 | 100 | 0.00684 | 0.00588 | 0.00191 | 0.04877 | 0.01007 | |
| 200 | 0.00338 | 0.00314 | 0.00107 | 0.02689 | 0.00521 | ||
| 500 | 0.00136 | 0.00124 | 0.00044 | 0.01169 | 0.00219 | ||
| 1000 | 0.00068 | 0.00064 | 0.00020 | 0.00555 | 0.00108 | ||
| DGP3 | 100 | 0.01079 | 0.01253 | 0.00900 | 0.00416 | 0.10187 | 0.02212 |
| 200 | 0.00502 | 0.00525 | 0.00386 | 0.00200 | 0.08931 | 0.01044 | |
| 500 | 0.00194 | 0.00198 | 0.00143 | 0.00082 | 0.05859 | 0.00374 | |
| 1000 | 0.00097 | 0.00087 | 0.00065 | 0.00040 | 0.03913 | 0.000178 |
Table 3.
Comparison of the estimation performance of gbAR(p) model fits and Markov chain fits of order p for for three different gbAR-DGP1-3 with respect to the mean squared difference of estimated transition probabilities to the truth over 1000 Monte Carlo replications.
Table 3.
Comparison of the estimation performance of gbAR(p) model fits and Markov chain fits of order p for for three different gbAR-DGP1-3 with respect to the mean squared difference of estimated transition probabilities to the truth over 1000 Monte Carlo replications.
| T | MSE gbAR(1) | MSE MC | MSE gbAR(2) | MSE MC | MSE gbAR(3) | MSE MC |
|---|---|---|---|---|---|---|
| 100 | 0.01887 | 0.02690 | 0.02647 | 0.02674 | 0.03302 | 0.06942 |
| 200 | 0.01288 | 0.02399 | 0.01889 | 0.01904 | 0.02333 | 0.04935 |
| 500 | 0.00788 | 0.02256 | 0.01125 | 0.01191 | 0.01536 | 0.02940 |
| 1000 | 0.00529 | 0.02168 | 0.00775 | 0.00852 | 0.01074 | 0.02024 |
Table 4.
Comparison of a gbAR Model and Markov chain by its difference of the transition probabilities to the truth from an underlying Markov Process.
Table 4.
Comparison of a gbAR Model and Markov chain by its difference of the transition probabilities to the truth from an underlying Markov Process.
| T | MSE gbAR(1) | MSE MC | MSE gbAR(2) | MSE MC | MSE gbAR(3) | MSE MC |
|---|---|---|---|---|---|---|
| 100 | 0.03183 | 0.03310 | 0.02563 | 0.02784 | 0.02771 | 0.03216 |
| 200 | 0.02219 | 0.02365 | 0.01894 | 0.01951 | 0.02276 | 0.02202 |
| 500 | 0.01420 | 0.01610 | 0.01371 | 0.01242 | 0.01960 | 0.01380 |
| 1000 | 0.00980 | 0.01216 | 0.01132 | 0.00882 | 0.01838 | 0.00977 |
© 2019 by the authors. Licensee MDPI, Basel, Switzerland. This article is an open access article distributed under the terms and conditions of the Creative Commons Attribution (CC BY) license (http://creativecommons.org/licenses/by/4.0/).
Share and Cite
MDPI and ACS Style
Jentsch, C.; Reichmann, L. Generalized Binary Time Series Models. Econometrics 2019, 7, 47. https://doi.org/10.3390/econometrics7040047
AMA Style
Jentsch C, Reichmann L. Generalized Binary Time Series Models. Econometrics. 2019; 7(4):47. https://doi.org/10.3390/econometrics7040047
Chicago/Turabian StyleJentsch, Carsten, and Lena Reichmann. 2019. "Generalized Binary Time Series Models" Econometrics 7, no. 4: 47. https://doi.org/10.3390/econometrics7040047
Note that from the first issue of 2016, this journal uses article numbers instead of page numbers. See further details here.