Article

Fractional Unit Root Tests Allowing for a Structural Change in Trend under Both the Null and Alternative Hypotheses

1
Wang Yanan Institute for Studies in Economics, Deartment of Statistics, MOE Key Laboratory of Econometrics and Fujian Key Laboratory of Statistical Science, Xiamen University, Xiamen 361005, China
2
Department of Economics, Boston University, Boston, MA 02215, USA
*
Author to whom correspondence should be addressed.
Econometrics 2017, 5(1), 5; https://doi.org/10.3390/econometrics5010005
Submission received: 17 November 2016 / Revised: 28 December 2016 / Accepted: 3 January 2017 / Published: 8 January 2017
(This article belongs to the Special Issue Unit Roots and Structural Breaks)

Abstract

:
This paper considers testing procedures for the null hypothesis of a unit root process against the alternative of a fractional process, called a fractional unit root test. We extend the Lagrange Multiplier (LM) tests of Robinson (1994) and Tanaka (1999), which are locally best invariant and uniformly most powerful, to allow for a slope change in trend with or without a concurrent level shift under both the null and alternative hypotheses. We show that the limit distribution of the proposed LM tests is standard normal. Finite sample simulation experiments show that the tests have good size and power. As an empirical analysis, we apply the tests to the Consumer Price Indices of the G7 countries.
JEL Classification:
C22

1. Introduction

Non-stationarity in economic time series is a pervasive feature. In order to carry proper inference, it is important to find the exact features that lead to this non-stationarity. A unit root process is a well-known example of non-stationary processes, and testing for a unit root against stationarity has been a topic of substantial interest from both theoretical and empirical perspectives. Perron (1989) [1], however, showed that the Dickey and Fuller (1979) [2] type unit root test is biased in favor of a non-rejection of the unit root null hypothesis when the process is trend stationary with a structural change in slope. Perron (1989, 1990) [1,3] proposed testing procedures in which a structural break is allowed under both the null and alternative hypotheses. Later, Christiano (1992) [4] and Zivot and Andrews (1992) [5] criticized the assumption that the date of the structural break is known a priori. In succeeding research, Zivot and Andrews (1992) [5], Perron (1997) [6], and Vogelsang and Perron (1998) [7] treated the break date as unknown and proposed testing procedures for a unit root. In much work, especially that of Zivot and Andrews (1992) [5], it was common to allow for a structural break only under the alternative hypothesis, not under the null hypothesis of a unit root. This is very restrictive, and can lead to misleading results. Recent advances in testing for and estimating a structural break in a trend function have made possible the development of unit root tests that allow for a change in trend under both the null and alternative hypotheses. Perron and Zhu (2005) [8] established the consistency, rate of convergence, and limiting distribution of the parameter estimates when there is a break in a trend function with or without a concurrent level shift. Perron and Yabu (2009) [9] suggested a testing procedure for structural changes in the trend function of a time series without any prior knowledge of whether the noise component is stationary or has an autoregressive unit root. Building on this work, Kim and Perron (2009) [10] proposed unit root testing procedures which allow for a structural change under both the null and alternative hypotheses; see also Carrion-i-Silvestre et al. (2009) [11] for an extension to the case with multiple changes.
Fractional processes with the order of integration d 0 . 5 are also non-stationary. Standard unit root tests often reject the null hypothesis when the true process is fractionally integrated with d ( 0 . 5 , 1 ) . This can lead to the misleading conclusion that the process of interest is stationary. This motivated researchers to introduce unit root tests which are powerful against the alternative hypothesis of a fractional process. Robinson (1991) [12] derived a Lagrange Multiplier (LM) test for fractional white noise disturbances in a linear regression, while Robinson (1994) [13] proposed tests for unit root, and actually any real values of d in both the frequency and the time domain. Tanaka (1999) [14] suggested an LM test in the time domain, and showed that it is locally best invariant and uniformly most powerful. Dolado et al. (2002) [15] introduced a Wald-type unit root test against the alternative of fractional integration. This test is based on the Dickey and Fuller (1979) [2] type test using an auxiliary regression with a consistent estimate of the integration order. Lobato and Velasco (2007) [16] established a Wald-type test which is more efficient and is asymptotically equivalent to the LM test. Recently, Cho et al. (2015) [17] suggested combining the test of Kwiatkowski et al. (1992) [18] and a unit root test to test the null of integer integration, i.e., I ( 0 ) or I ( 1 ) against the alternative of fractional integration, i.e., I ( d ) , d ( 0 , 1 ) . In this line of work, the process of interest has been limited to either a random walk or a purely fractional process. Lobato and Velasco (2007) [16] considered short-run dynamics in the process. Dolado et al. (2008) [19] extended the work of Dolado et al. (2002) [15] and Lobato and Velasco (2007) [16] to incorporate some deterministic components; for instance, a constant and a linear trend function.
Our main contribution is to extend the LM test for a fractional unit root to allow for a structural change in a trend function under both the null and alternative hypotheses. This extension has some advantages, as follows: (i) it imposes a symmetric treatment of the nature of the deterministic trend under both the null and alternative hypotheses; (ii) it does not require long memory to be distinguished from structural change;1 (iii) the power of fractional unit root tests can be substantially improved when a break is actually present. We consider linear trend models in which a structural change in slope occurs with or without a concurrent level shift.
The rest of this paper is organized as follows. In Section 2, we first introduce fractional processes and the Lagrange Multiplier test of Tanaka (1999) [14] along with preliminary results to be used subsequently. In Section 3, the LM tests are generalized to allow for a structural break in trend under both the null and alternative hypotheses. Extensions to processes with short-run dynamics are discussed in Section 4. The results of simulation experiments about the size and power of the tests are presented in Section 5. As an empirical application, we test for a fractional unit root in the Consumer Price Indices (CPIs) of the G7 countries in Section 6. Concluding remarks are provided in Section 7. All mathematical proofs are relegated to the Appendix A.

2. Lagrange Multiplier Test

For an integer d = 1 , 2 , , the operator Δ d = ( 1 L ) d denotes the differencing operator with the usual lag operator L; i.e., L X t X t 1 , Δ X t = X t X t 1 , Δ 2 X t = ( 1 2 L + L 2 ) X t = X t 2 X t 1 + X t 2 , and so on. For a non-integer real number d > 1 , the difference operator Δ d = ( 1 L ) d is defined by means of the binomial expansion
Δ d = k = 0 d k ( L ) k = k = 0 π k ( d ) L k ,
where
d k d ! k ! ( d k ) ! = d × ( d 1 ) × × ( d k + 1 ) k × ( k 1 ) × × 2 × 1 ,
π k ( d ) ( 1 ) k d k = s = 1 k s 1 d s = Γ ( k d ) Γ ( k + 1 ) Γ ( d ) ,
with Γ ( · ) the gamma function, so that π k ( d ) = ( k d 1 k ) and π 0 ( d ) = 1 . Recall that x ! Γ ( x + 1 ) , x = 0 , 1 , , and for k = 1 , 2 , , 0 < x < 1 , Γ ( x k ) is defined as Γ ( x ) = ( x 1 ) Γ ( x 1 ) = = ( x 1 ) ( x k ) Γ ( x k ) . To define a fractional process, we use the notation of Robinson (2005) [29]. Let { η t , t = 0 , ± 1 , } be a short-memory zero-mean covariance stationary process, with spectral density that is bounded and bounded away from zero. For d ( 0 . 5 , 0 . 5 ) ,
ζ t = Δ d η t , t = 0 , ± 1 , ,
is covariance stationary and invertible. The truncated version of ζ t is defined as
ζ t # = ζ t 1 t 1 , t = 0 , ± 1 , ,
where 1 A is the indicator function for the event A. For an integer m 0 ,
u t = Δ m ζ t # , t = 0 , ± 1 ,
is called a type I I ( m + d ) process. Let D [ 0 , 1 ] be the space of functions on [ 0 , 1 ] which are right continuous and have left limits, equipped with the Skorohod topology. Let p denote convergence in probability and d convergence in distribution. Denote by [ a ] the integer part of a R . The order of integration is d 0 = d + m , with d ( 0 . 5 , 0 . 5 ) and m { 0 , 1 } .2
Remark 1.
Marinucci and Robinson (1999) [30] defined type I and type II fractional Brownian motions with d ( 0 . 5 , 0 . 5 ) on D [ 0 , 1 ] , respectively, as follows:
B I ( t ) = 1 Γ ( d + 1 ) 0 [ ( t s ) d ( s ) d ] d B ( s ) + 0 t ( t s ) d B ( s ) , B I I ( t ) = 1 Γ ( d + 1 ) 0 t ( t s ) d B ( s ) ,
where B ( · ) denotes the standard Brownian motion. Furthermore, Robinson (2005) [29] and Davidson and Hashimzade (2009) [31] pointed out that asymptotic results vary depending on the definition of fractional Brownian motions considered, which requires one to design simulation experiments in accordance with the particular type used.
Now we consider a fractional unit root test. Under the null hypothesis, { u t } is a unit root process; that is, H 0 : d 0 = 1 (i.e., d = 0 and m = 1 ). The alternative hypothesis can be either one-sided ( H 1 : d 0 > 1 or H 1 : d 0 < 1 ) or two-sided ( H 1 : d 0 1 ). Robinson (1994) [13] and Tanaka (1999) [14] considered the Lagrange Multiplier test in the frequency and time domain. It is well known that the LM test is locally best invariant. Further, Tanaka (1999) [14] showed that the LM test is locally uniformly most powerful invariant because it achieves the power envelope of all the invariant tests against local alternatives. The test statistic suggested in Tanaka (1999) [14] is
LM = T 6 π 2 k = 1 T 1 1 k ρ k ,
where ρ k = ( j = k + 1 T Δ u j k Δ u j ) / j = 1 T ( Δ u j ) 2 is the kth order autocorrelation of the residuals Δ u t . Local alternatives to the null hypothesis are often considered in the literature, with the integration order defined as d 0 = 1 + δ T 1 / 2 with δ fixed, often referred to as Pitman drifts. We state the limiting distribution of the LM test under local alternatives, as it will be relevant for subsequent derivations.
Lemma 1 (Theorem 3.1 in Tanaka (1999) [14]).
Under the assumption that u t is generated by (3) with d 0 = 1 + δ T 1 / 2 and δ fixed, it holds that, as T , LM d N ( δ π 2 / 6 , 1 ) .

3. Deterministic Components Allowing for a Structural Change

In this section, we extend the LM test for a fractional unit root to allow for a structural change in trend with or without a concurrent level shift. We consider the time series of interest y t as consisting of a deterministic component ( f t ) and fractionally integrated errors. The data-generating process (DGP) is specified as
y t = f t + u t .
For u t , we impose E ( u t ) = 0 and the following assumption.
Assumption 1.
u t is a type I I ( m + d ) process which is defined in (1)–(3). Moreover, the short-memory zero-mean covariance stationary process η t is assumed to be independent and identically distributed ( i . i . d . ) with zero mean and finite variance.
The i . i . d . assumption on the short-memory process η t will be relaxed later to allow for short-run dynamics. The unit root null hypothesis corresponds to the case with m = 1 and d = 0 , which implies that u t is a weighted sum of η t .

3.1. Change in Mean

We first consider the case where y t experiences a level shift at an unknown time T b . The DGP is specified as
y t = μ 1 + μ b C t + u t , μ b 0 ,
where C t is a dummy variable for a level shift defined by:
C t = 0 if t T b , 1 if t > T b ,
where T b = [ T λ b ] is the true break date with the corresponding true break fraction λ b ( 0 , 1 ) .
Theorem 1 (Change in Mean).
Under Assumption 1, suppose that the process { y t } is generated under the null hypothesis of (4). Consider the Lagrange Multiplier test LM M defined by:
LM M = T 6 π 2 t = 1 T log Δ Δ y t Δ y t t = 1 T Δ y t 2 .
Under the null hypothesis H 0 : d 0 = 1 , it holds that as T , LM M d N ( 0 , 1 ) .
Theorem 1 implies that Tanaka’s (1999) [14] LM test is robust to the presence of a level shift. In the following subsection, we consider the LM test in the context of trending series.

3.2. Slope and Intercept Change in Trending Series

We now introduce a deterministic time trend in the models. We follow the notation in Kim and Perron (2009) [10] (henceforth KP) from which we will use some relevant results. The DGPs are specified as
  • Model A0: (Deterministic time trend without a structural change)
    y t = μ 1 + β 1 t + u t ,
  • Model A1: (Level shift)
    y t = μ 1 + μ b C t + β 1 t + u t ,
  • Model A2: (Joint broken trend)
    y t = μ 1 + β 1 t + β b B t + u t ,
    where B t is a dummy variable for a slope change in trend given by
    B t = 0 if t T b , t T b if t > T b ,
  • Model A3: (Locally disjoint broken trend)
    y t = μ 1 + μ b C t + β 1 t + β b B t + u t .
Following KP, we can rewrite Models A1–A3 as follows:
y t = z ( T b ) t ϕ + u t = z t , 1 ϕ 1 + z ( T b ) t , 2 ϕ 2 + u t ,
where z t , 1 = ( 1 , t ) , ϕ 1 = ( μ 1 , β 1 ) ,
z ( T b ) t , 2 = C t B t ( C t , B t ) , ϕ 2 = μ b for Model A 1 β b for Model A 2 ( μ b , β b ) for Model A 3 .
In matrix notation, the models defined previously can be specified as Y = Z T b ϕ + U , where Y = [ y 1 , , y T ] , Z T b = [ z ( T b ) 1 , , z ( T b ) T ] , ϕ = ( ϕ 1 , ϕ 2 ) , and U = [ u 1 , , u T ] .
Consider first Model A0, where no structural change is allowed. By taking first differences, we can rewrite (5) as follows:
Δ y t = β 1 + Δ u t = β 1 + Δ 1 d 0 η t 1 t 1 .
The ordinary least squares (OLS) estimate of β 1 is β ^ 1 = T 1 t = 1 T Δ y t , which is consistent under both H 0 and H 1 .3 We define Δ y t ˜ = Δ y t β ^ 1 , the OLS residuals from the regression model (8).
Theorem 2 (Linear Trend).
Under Assumption 1, suppose that the process { y t } is generated under the null hypothesis of (5). Consider the Lagrange Multiplier test LM T defined by:
LM T = T 6 π 2 t = 1 T log Δ Δ y t ˜ Δ y t ˜ t = 1 T Δ y t ˜ 2 .
Under the null hypothesis H 0 : d 0 = 1 , it holds that as T , LM T d N ( 0 , 1 ) .
In what follows, the aim is to devise Lagrange Multiplier tests allowing for a slope change in trend with or without a concurrent level shift. The following assumption is essential to that effect.
Assumption 2.
β b 0 and λ b ( π , 1 π ) for some π ( 0 , 1 / 2 ) .
Assumption 2 ensures that there is a single slope change in trend, and that the pre- and post-break samples are not asymptotically negligible, which is a standard assumption needed to derive useful asymptotic results. Model A1 (level shift only) will be revisited later.
The break date can be estimated by using a global least-squares criterion:
T ^ b = arg min T 1 Λ Y ( I P T 1 ) Y ,
where P T 1 is the matrix that projects on the range space of Z T 1 ; i.e., P T 1 = Z T 1 ( Z T 1 Z T 1 ) 1 Z T 1 and Λ = [ π T , ( 1 π ) T ] , 0 < π < 1 / 2 . Note that Z T 1 is the same as Z T b , except T b is replaced with a generic break date T 1 . Perron and Zhu (2005) [8] (henceforth, PZ) established the consistency, rate of convergence, and limiting distribution of parameter estimates when the error is an I ( 1 ) process. With Z T ^ b constructed using the estimate T ^ b , the OLS estimate of ϕ is ϕ ^ = ( Z T ^ b Z T ^ b ) 1 Z T ^ b Y , and the resulting sum of squared residuals is, for an estimated break fraction λ ^ s = T ^ b / T (the subscript s refers to the fact that we consider a static regression; a dynamic regression with lagged dependent variables will be considered later):
S ( λ ^ s ) = t = 1 T u ^ t 2 = t = 1 T ( y t z ( T ^ b ) t ϕ ^ ) 2 = Y ( I P T ^ b ) Y ,
where P T ^ b is the projection matrix associated with X T ^ b . The rate of convergence of λ ^ s for Models A2 and A3 is λ ^ s λ b = O p ( T 1 / 2 ) with I ( 1 ) errors (see Theorem 3 in PZ). Chang and Perron (2016) [33] derived the consistency and rate of convergence of λ ^ s when the noise component is a fractional process with the differencing parameter d 0 ( 0 . 5 , 0 . 5 ) ( 0 . 5 , 1 . 5 ) . Specifically, for Models A2 and A3, λ ^ s λ b = O p ( T 1 / 2 + d ) if m = 1 and d ( 0 . 5 , 0 . 5 ) . With the consistent estimates ( λ ^ s , μ ^ 1 , μ ^ b , β ^ 1 , β ^ b ) , we can construct the detrended process { y ˜ t } , and the Lagrange Multiplier test statistic LM T , λ ^ s is given by
LM T , λ ^ s = T 6 π 2 t = 1 T log Δ Δ y ˜ t Δ y ˜ t t = 1 T Δ y ˜ t 2 .
The convergence rate of the estimate λ ^ s is not fast enough to guarantee that LM T , λ ^ s has the standard normal limit under H 0 . KP faced a similar issue in dealing with unit root tests. They introduced a heuristic explanation of the issue involved, which we briefly review. Let λ ^ = T ^ b / T denote an estimate of the break fraction such that λ ^ λ b = O p ( T ϰ ) for some ϰ 0 . The detrended series { y ˜ t } is given by
Y ˜ = M ^ z Y = M ^ z Z ( T b ) ϕ + M ^ z U = M ^ z Z ( T b ) 2 ϕ 2 + M ^ z U ,
where Z ( T b ) and Z ( T b ) 2 are matrices stacking { z ( T b ) t } and { z ( T b ) t , 2 } , respectively, and the idempotent matrix M ^ z = I P ^ z = I Z ( T ^ b ) [ Z ( T ^ b ) Z ( T ^ b ) ] Z ( T ^ b ) . It is obvious that M ^ z Z ( T b ) 2 ϕ 2 = 0 only if the true break date is used in M ^ z . In finite samples, λ ^ λ b in general; thereby, M ^ z Z ( T b ) 2 ϕ 2 will not be zero. It turns out that a fast rate of convergence for the estimate of the break date is needed for the effect of M ^ z Z ( T b ) 2 ϕ 2 on the Lagrange Multiplier test to become negligible asymptotically. The following proposition provides a sufficient condition under which LM T , λ ^ d N ( 0 , 1 ) under H 0 .
Proposition 1.
Suppose that the process { y t } is generated under the null hypothesis of Model A2 or A3, and that Assumptions 1 and 2 hold. Then, it holds that, as T , LM T , λ ^ d N ( 0 , 1 ) if λ ^ λ b = o p ( T 1 / 2 ) .
Proposition 1 implies that the estimate of the break fraction should converge at a rate faster than T 1 / 2 . As shown above, λ ^ s does not satisfy this condition. Hence, we need to consider alternative ways to accelerate the rate of convergence of the estimate of the break fraction. KP suggested two possible approaches. The first is based on minimizing the sum of squared residuals (SSR) of a dynamic regression model. This method is similar to that in Hatanaka and Yamada (1999) [34]. The relevant dynamic regressions are specified as follows:
y t = α y t 1 + ν 1 D ( T b ) t + ν 2 1 t T b + z ( T b ) t ϕ + u t , ( Model A 2 ) y t = α y t 1 + ν D ( T b ) t + z ( T b ) t ϕ + u t , ( Models A 1 and A 3 )
where D ( T b ) t = 1 for t = T b + 1 and 0 otherwise. Under the null hypothesis, we obtain an estimate of the break fraction λ ^ d which has a faster rate of convergence, such that λ ^ d λ b = O p ( T 1 ) for Models A2 and A3 (see Proposition 1 in KP). Let LM T , λ ^ d denote the Lagrange Multiplier test statistic with λ ^ d replacing λ ^ s . It is worth noting that, as discussed by Hatanaka and Yamada (1999) [34] and KP, the estimate λ ^ d has a negative bias in finite samples, especially for Model A3. As we shall see, this will affect the finite sample properties of the tests.
The second approach is to use a trimmed data set using a window whose length depends on the sample size and which contains the estimated break date. The trimmed series then consists of the original one with the data points in the window excluded. KP showed that the rate of convergence of λ ^ s can be increased with the trimmed data set. Suppose that the estimate of the break fraction satisfies λ ^ λ b = O p ( T a ) for some 0 < a < 1 , and the trimming window has length 2 w ( T ) with w ( T ) c 1 T δ , c 1 > 0 , and 1 < a < δ < 0 . With this specification, the length of the window is negligible in the limit compared to the sample size T, but is still large enough to include the true break date asymptotically. Following KP’s suggestion, one proceeds as follows:
  • Estimate the break fraction λ ^ s from the original data set and form a window that ranges from T l T ( λ ^ s w ( T ) ) to T h T ( λ ^ s + w ( T ) ) .
  • A trimmed data set is constructed by removing the original data from T l + 1 to T h and then shifting down the data after the window by D ( T ) = y T h y T l . After the trimming and connecting procedures, we now have a new series { y t * } , for t = 1 , , T * ( T 2 w ( T ) T ) , defined by:
    y t * = y t if t T l , y t + T h T l D ( T ) if t > T l .
  • Test the null hypothesis H 0 : d 0 = 1 using T l as the break date (i.e., λ ^ t r = T l / T * ). The Lagrange Multiplier test statistic is then given by
    LM T , λ ^ t r = T 6 π 2 t = 1 T log Δ Δ y ˜ t * Δ y ˜ t * t = 1 T Δ y ˜ t * 2 ,
    where y ˜ t * is the detrended version of y t * using the estimate of the break date T l (or break fraction λ ^ t r ).
Remark 2.
If the window contains either end of the data, then the process { y t * } turns out to be Model A0 (no structural break), and the statistic in Theorem 2 should be applied to the trimmed data { y t * } .
The trimmed process { y t * } will satisfy the properties of Model A2 regardless of the specification of the original data { y t } , which implies that we can use a common limit distribution. The following proposition states the limiting distribution of the Lagrange Multiplier test based on the trimmed data, which is the same as would be obtained if the break date was known in Model A2.
Proposition 2.
Suppose that the process { y t } is generated under the null hypothesis of Model A2 or A3, and that Assumptions 1 and 2 hold. Then, it holds that as T , LM T , λ ^ t r d N ( 0 , 1 ) .
As shown in KP, under the null hypothesis of a unit root, the estimate of the break fraction λ ^ t r = T l / T * converges in probability to the true break fraction at some rate greater than T. Hence, the sufficient condition in Proposition 1 is satisfied, so that the proof of Proposition 2 is trivial and omitted.
In concluding this section, we consider the case where there is a change in mean; that is, μ b 0 , as in Models A1 and A3. In Model A1, we assume that there is a level shift only; that is, μ b 0 and β b = 0 . Under the null hypothesis, a stochastic trend generated by the I ( 1 ) error process tends to dominate a level shift. Hence, we cannot estimate the break fraction λ b consistently, because the magnitude of the level shift is asymptotically negligible. In finite samples, we can ignore the level shift if the magnitude of the break is small. Then, Model A1 can be treated as Model A0, and we can follow the testing procedure pertaining to Theorem 2. However, a loss of power is inevitable if a large change in mean is ignored.
On the other hand, the level shift can be specified as an increasing function of the sample size; i.e., μ b = c 2 T 1 / 2 + α for some c 2 > 0 and α > 0 . As addressed in Harvey et al. (2001) [35], PZ, and KP, this specification provides better approximations of the properties of the tests in finite samples when the level shifts are not very small. The models with μ b = c 2 T 1 / 2 + α are labeled as Models A1b and A3b, respectively.
Proposition 3.
Suppose that the process { y t } is generated under the null hypothesis of Model A1b or A3b. Then, LM T , λ ^ diverges as T .
Although the rate of convergence of the estimate of the break fraction is faster than in the case of a change in slope (see Proposition 7 in KP), Proposition 3 states that the LM tests cannot obtain the standard normal limiting distribution. Hence, the LM test LM T , λ ^ , using the critical values from the standard normal distribution, suffers from some liberal size distortions, even when | μ b | is large.4

3.3. Using a Pre-Test for a Break in Slope

The results of Theorem 2 and Proposition 2 show that the limit distribution of the test is the same whether there is a break in slope introduced as a regressor or not, even when the DGP specifies that no break is present. Hence, unlike the case of testing for a unit root as in KP, theoretically there is no need to carry a pre-test to improve the power of the test. However, Chang and Perron (2016) [33] considered Models A2 and A3 with fractionally integrated errors and showed that the so-called spurious break issue occurs with the order of fractional integration d 0 ( 0 , 0 . 5 ) ( 0 . 5 , 1 . 5 ) . This extended the results on Nunes et al. (1995) [36], who considered the unit root case. This means that under both the null and alternative hypotheses, if a break in slope is not present and one is allowed in the regression, the fitted model will with large probability suggests the presence of a break. This could have an effect on both the size and power of the test. On one hand, the slope change regressor may induce added liberal size distortions in finite samples because of the overfit. On the other hand, since when no break exists in the DGP it is a superfluous regressor, power maybe be reduced. Hence, it may be the case that in finite samples it is beneficial to use a pre-test for a change in slope and try to choose between models (5) and (7). Since a test for a change in mean will be inconsistent, there is no point in trying to distinguish between models (5) and (6) or between model (4) and the corresponding one without the change in mean.
Iacone et al. (2013) [37] suggested a sup-Wald type test ( SW ) for Model A2. In particular, it is robust to any order of fractional integration d 0 located in an interval [ 0 , 1 . 5 ) excluding the boundary case 0.5. More precisely, given their recommended choice for the bandwidth when constructing the local Whittle estimate of d 0 , their test is consistent for values of d 0 in the interval [ 0 , 1 . 32 ] , though we believe the proof can be modified to allow the interval [ 0 , 1 . 5 ) . It follows the generalized least squares approach to construct the test statistic for a structural change in trend by taking d 0 -differences from the data. To make the test feasible, the fully extended local whittle (FELW) estimator d ^ F E L W of Abadir (2007) [38] is considered. While the FELW estimator is constructed under the null hypothesis of no structural change, Iacone et al. (2013) [37] showed that it also satisfies the necessary condition for consistency, even with a local break in trend. Since the true break date is unknown a priori, the final statistic SW uses the sup functional of Andrews (1993) [39] across all admissible break dates. This test is asymptotically size controlled for all d 0 ’s in the prescribed range. Using this pre-test, we can then define the alternative estimate of the break fraction λ ˜ = λ ^ · 1 SW > τ , where τ is the critical value for the SW test with a nominal size p % . Given that SW is a consistent test, plim T λ ˜ = λ b if λ ^ is a consistent estimate of λ b . If there is no break in the DGP, we can expect that p % of the estimates λ ˜ ’s are nonzero. In order to obtain a consistent estimate of λ b under the null of no structural break, we assume that the critical value τ is a function of the sample size T. Since SW = O p ( T ϱ ) , ϱ > 0 with a local break, let τ = c T ϱ ϵ for 0 < ϵ < ϱ . This specification introduced in KP is useful because it does not have any effect on the consistency of the test SW and does guarantee that plim T λ ˜ = 0 when no break is present. Hence, based on the consistency of λ ˜ , it is recommended to use LM T if λ ˜ = 0 and LM T , λ ^ if λ ˜ 0 . The LM test statistics with the pre-test are denoted by LM T , λ ^ s p , LM T , λ ^ d p , and LM T , λ ^ t r p 
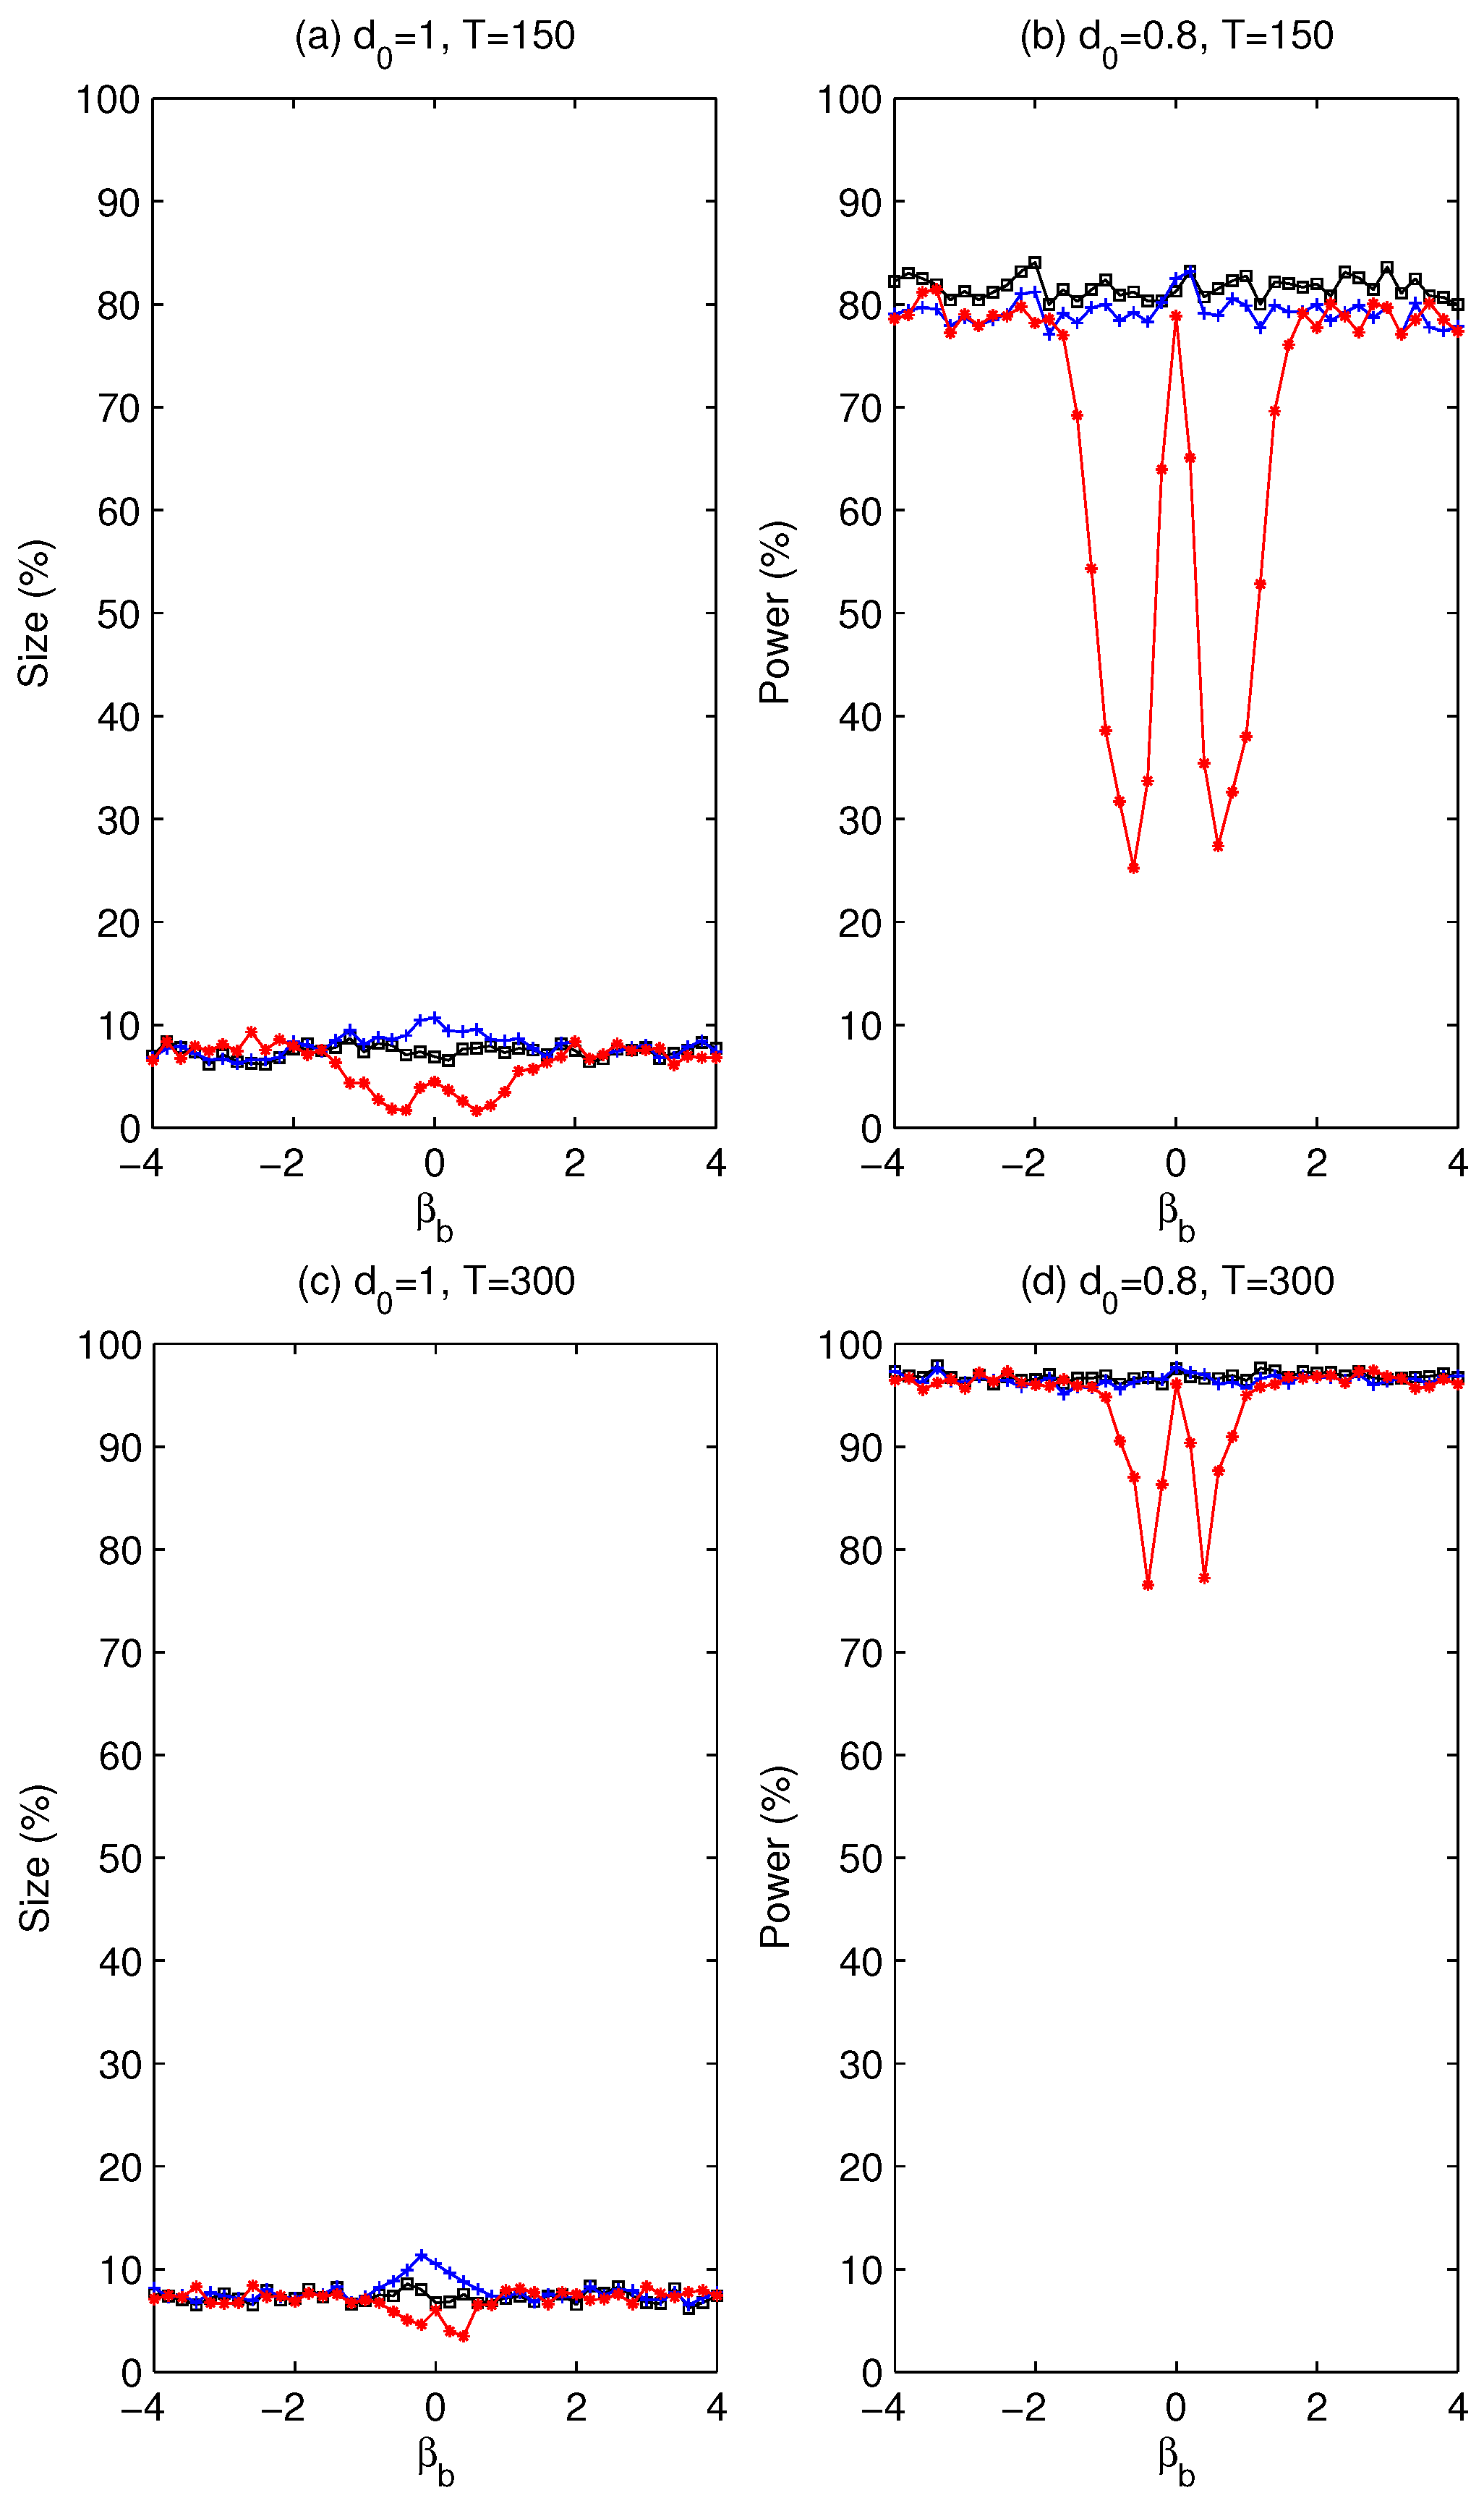
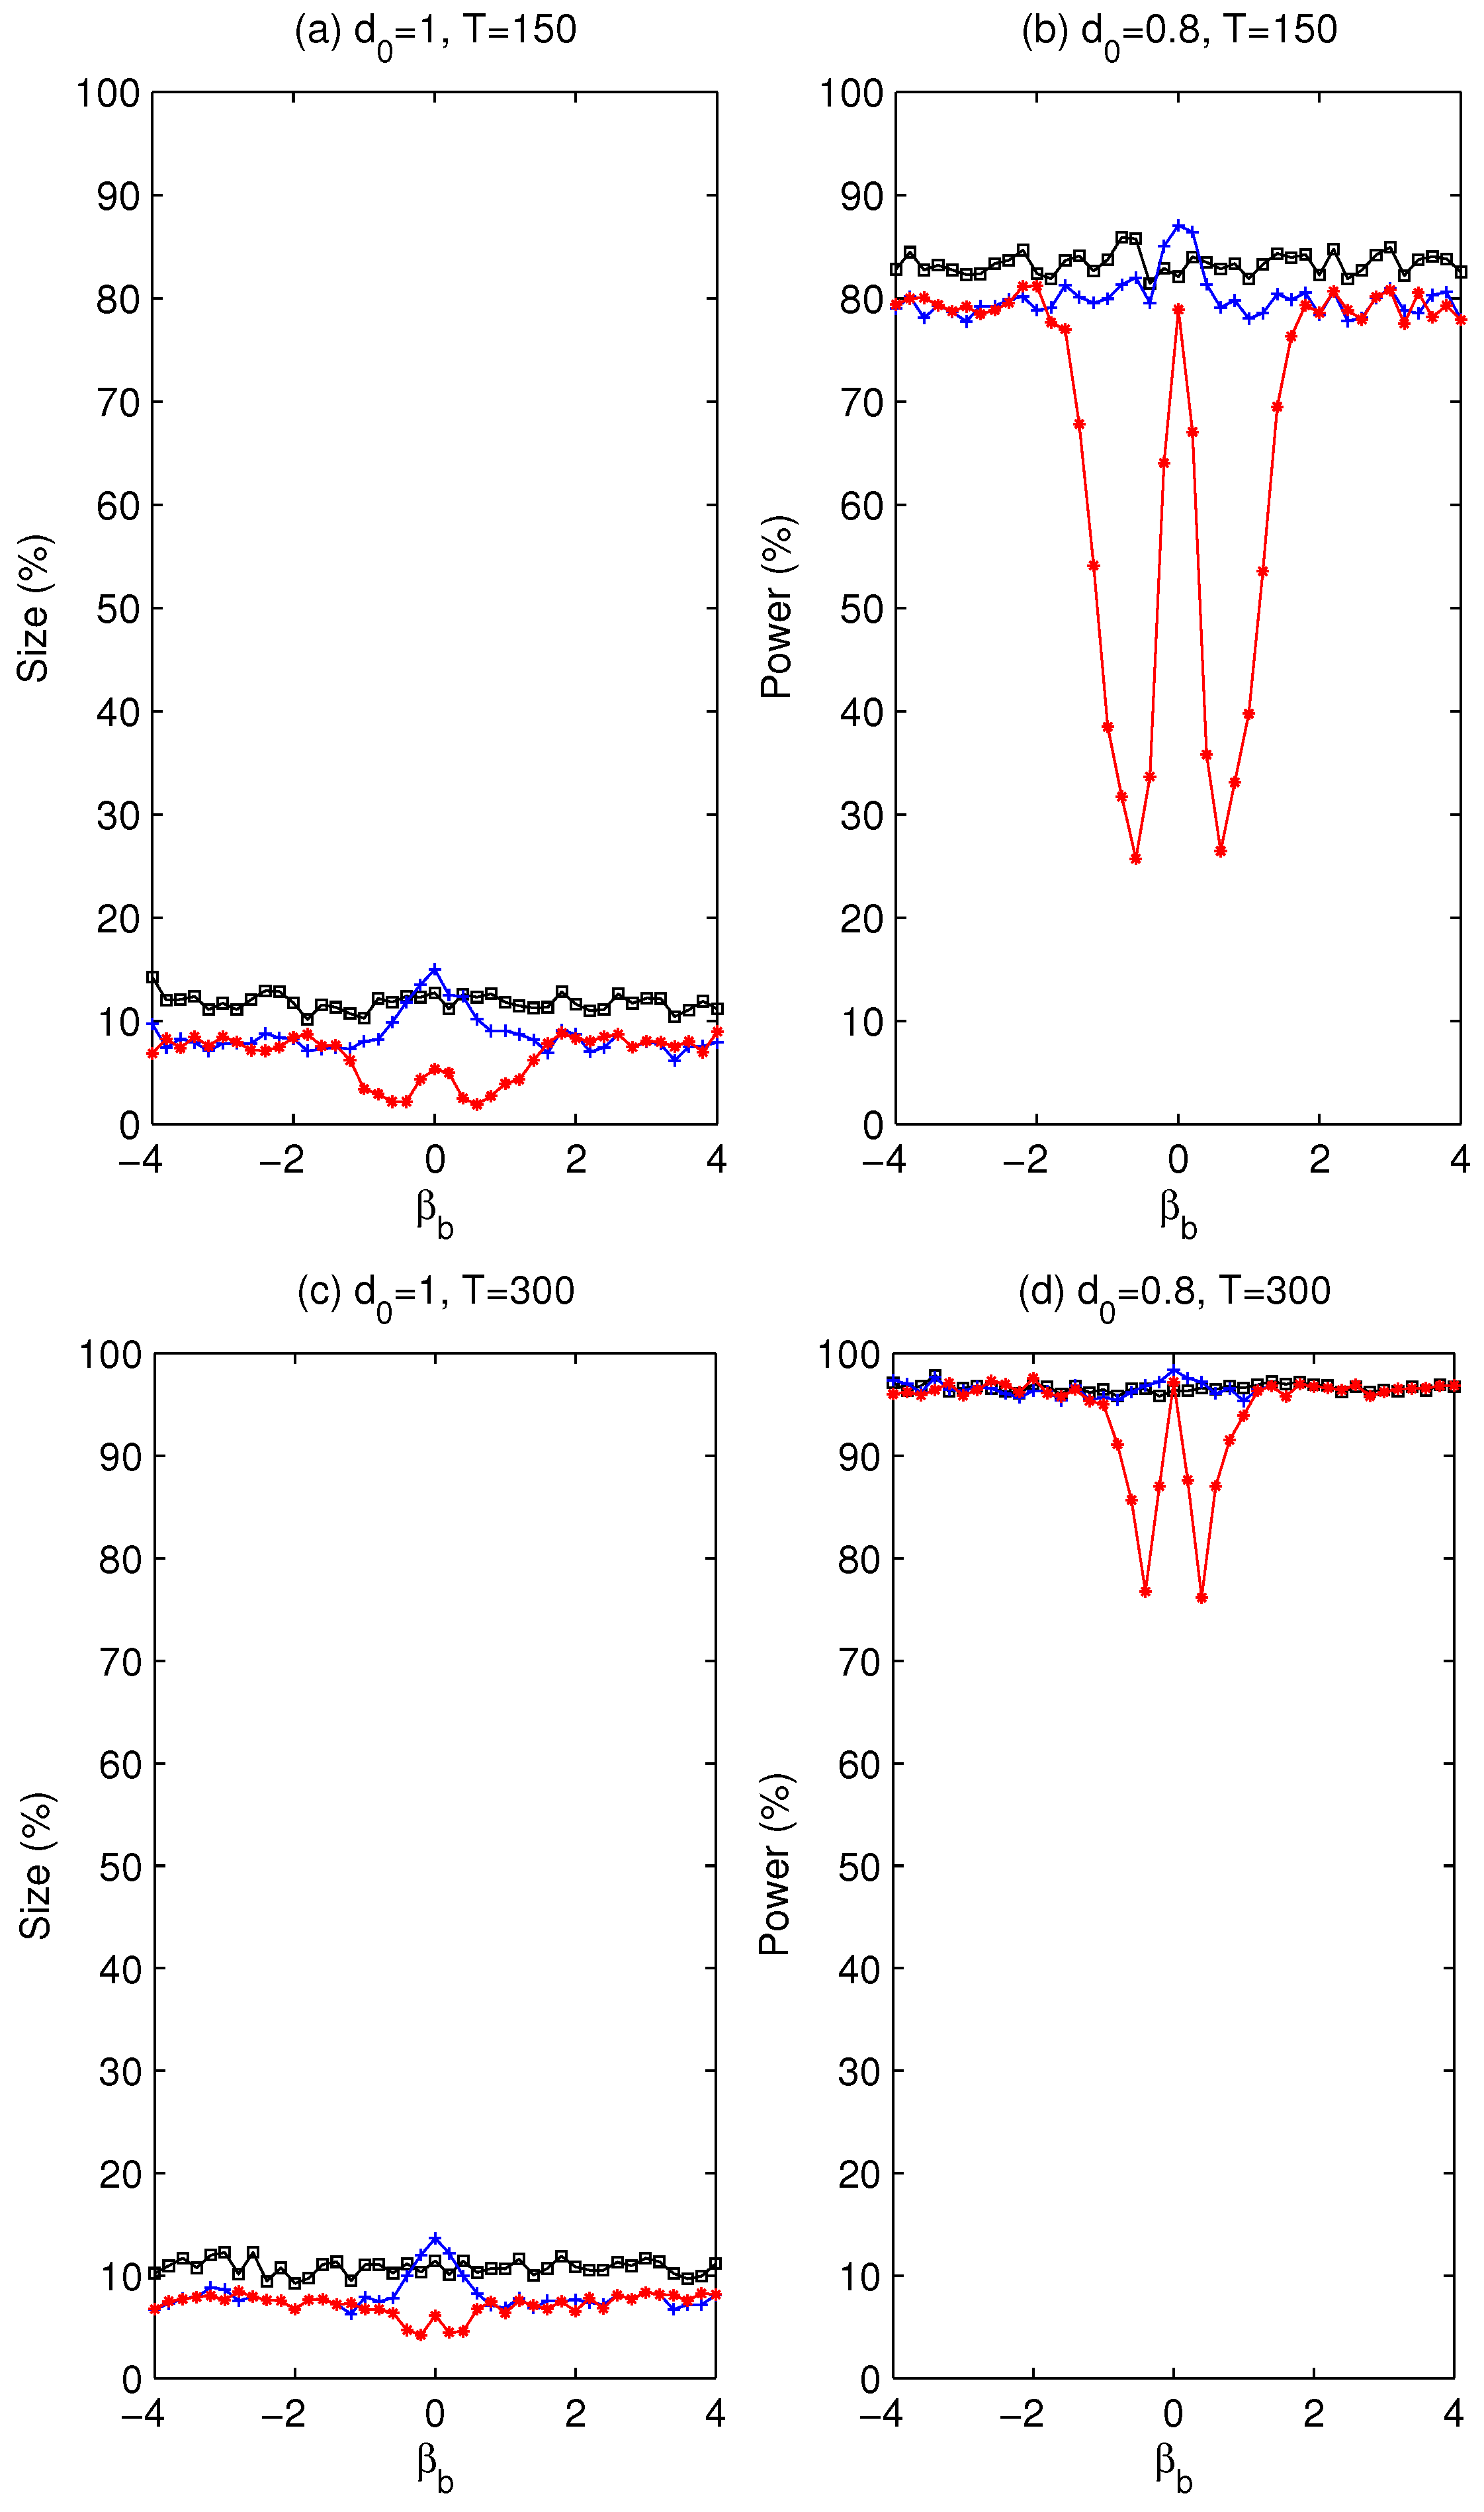
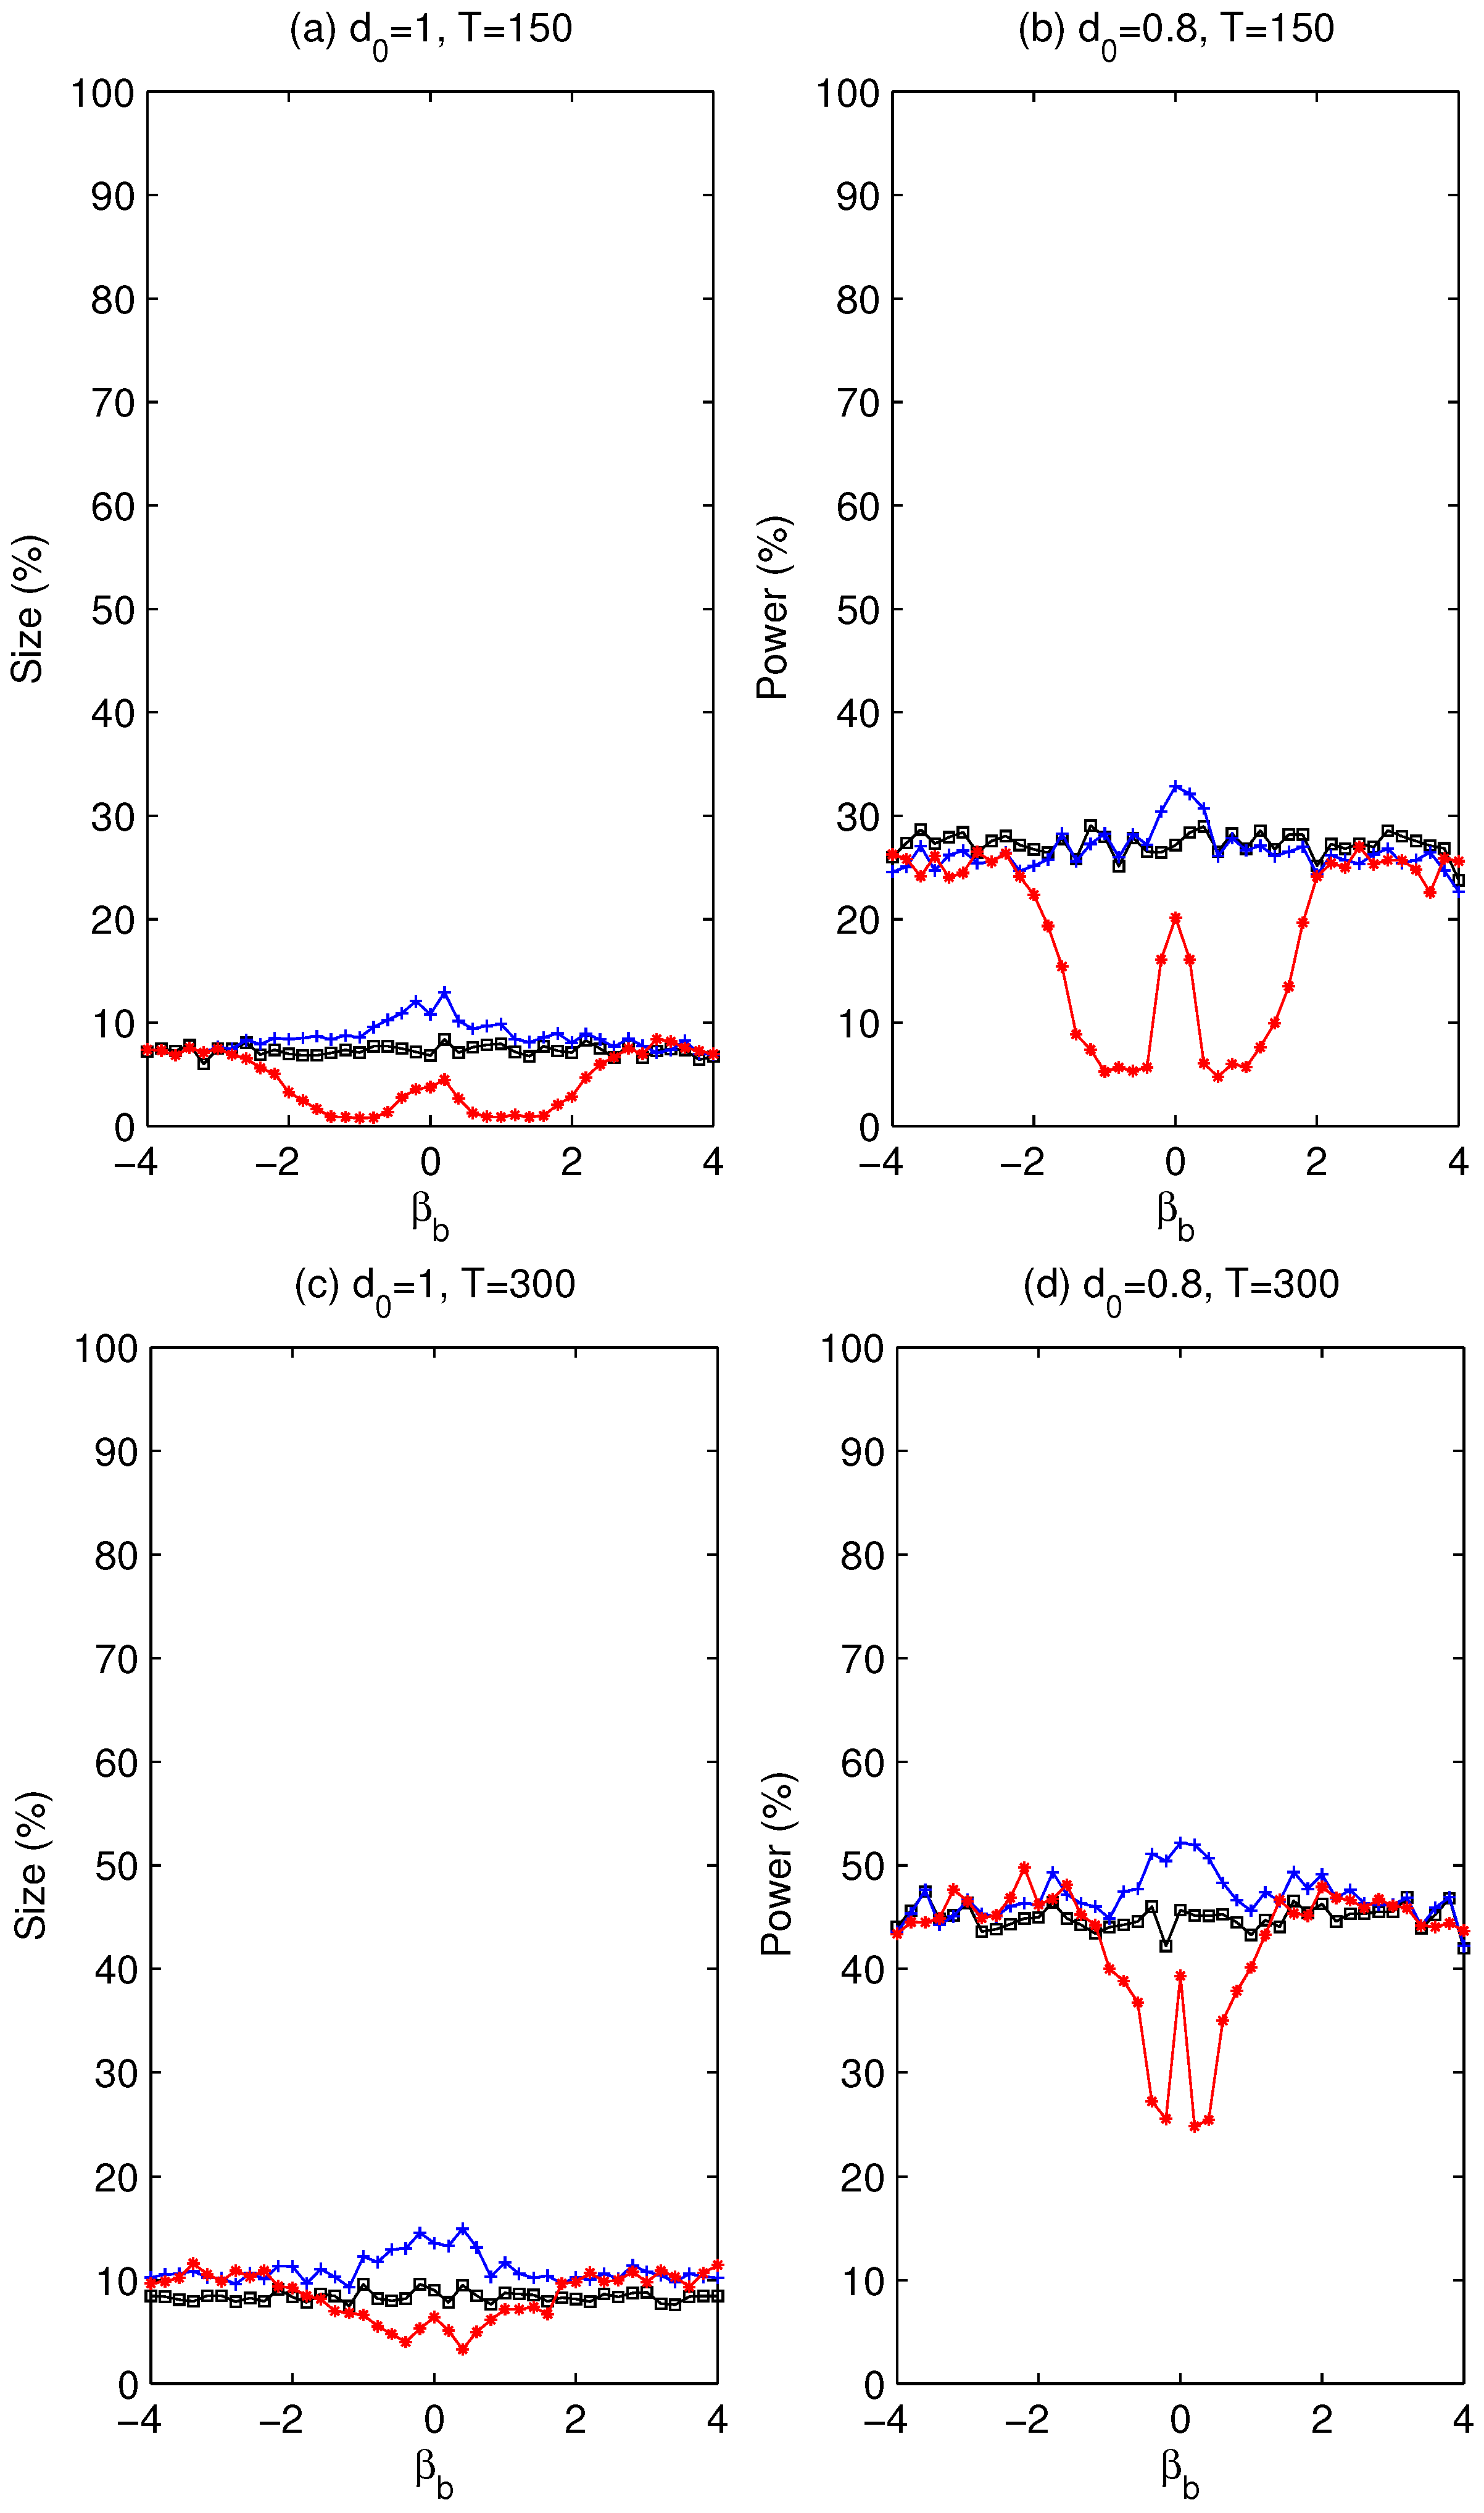
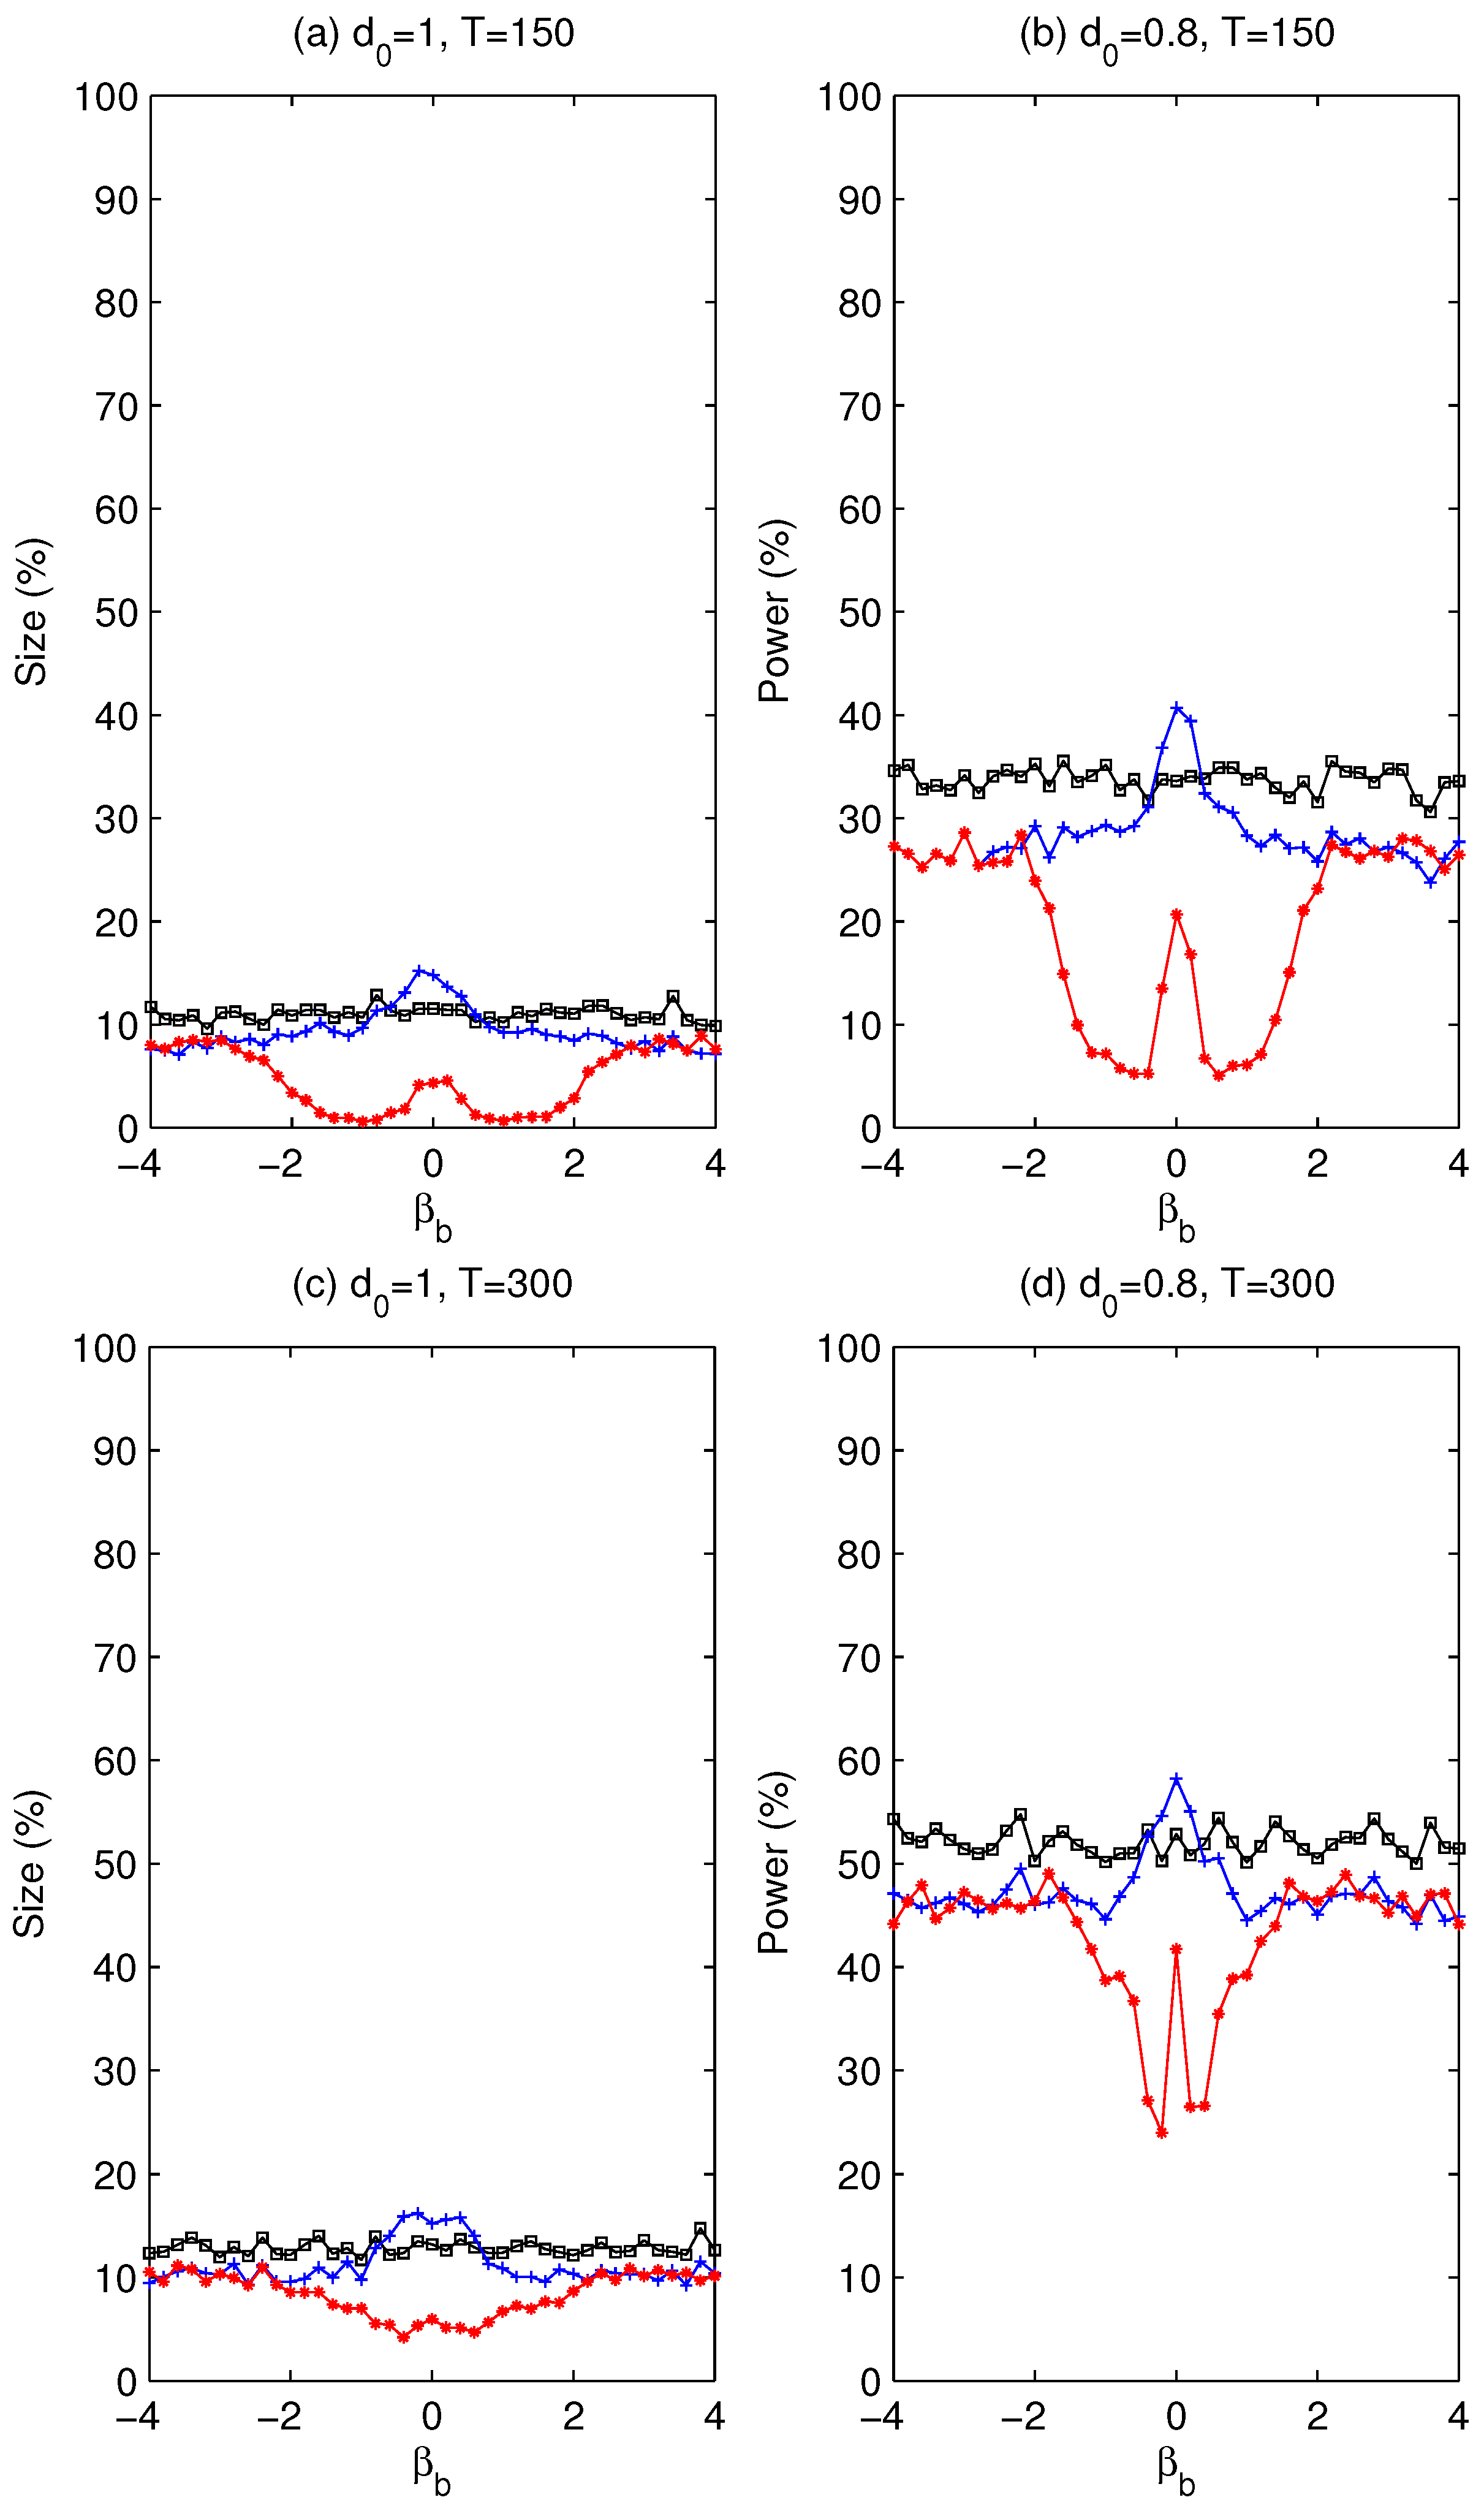
. Whether using a pre-test is beneficial will be assessed later via simulation experiments about the size and power of the tests.

4. Short-Run Dynamics

We now relax Assumption 1 to introduce short-run dynamics in the noise component. A zero-mean short-memory covariance stationary process η t can be represented as a one-sided moving average: η t = j = 0 ψ j ϵ t j , t = 0 , ± 1 , , where ψ 0 = 1 , j = 0 ψ j 2 < , ψ ( 1 ) j = 0 ψ j , and { ϵ t , t = 0 , ± 1 , } are i.i.d. random variables with mean zero. A special case of interest is an autoregressive moving average (ARMA( p , q )) process given by ϕ ( L ) η t = θ ( L ) ϵ t . In order to implement the Lagrange Multiplier test, we first estimate the parameters Ψ = ( ϕ 1 , , ϕ p , θ 1 , , θ q ) consistently. Then, under the null hypothesis, we can construct ϵ ^ t = ϕ ^ ( L ) θ ^ ( L ) 1 ( 1 L ) d 0 u ^ t , where u ^ t is the OLS residuals from the model considered, whereas ϕ ^ ( L ) and θ ^ ( L ) are estimated from ϕ ( L ) ( 1 L ) d 0 u ^ t = θ ( L ) ϵ t , using d 0 = 1 . With short-run dynamics in the noise component, we consider the following test statistic:
LM ^ = T k = 1 T 1 1 k ρ ^ k ,
where ρ ^ k is the kth order autocorrelation of residuals ϵ ^ 1 , , ϵ ^ T . Tanaka (1999) [14] derived an important result related to this statistic when no break is present.
Lemma 2 (Theorem 3.3 in Tanaka (1999) [14]).
Under local alternatives—that is, d 0 = 1 + δ T 1 / 2 with δ fixed—it holds that as T , LM ^ d N ( δ ω 2 , ω 2 ) , where
ω 2 = π 2 6 ( κ 1 , , κ p , ξ 1 , , ξ q ) Φ 1 ( κ 1 , , κ p , ξ 1 , , ξ q ) ,
κ i = j = 1 1 j g j i , ξ i = j = i 1 j h j i ,
with g j and h j the coefficients of L j in the expansion of 1 / ϕ ( L ) and 1 / θ ( L ) , respectively, and Φ the Fisher information matrix for ϕ and θ.
Remark 3.
Note that ω 2 < π 2 / 6 ; hence comparing Lemmas 1 and 2, the LM test has lower local asymptotic power in the presence of short-run dynamics of any kind. As will be shown via simulations, the loss in power can be substantial. It remains, nevertheless, inevitable.
With the maximum likelihood estimate ω ^ , we show that LM ^ / ω ^ d N ( 0 , 1 ) as T under the null hypothesis. In particular, when p = 1 or q = 1 , it is easy to compute ω ^ . Since v j = ς v j 1 + ϵ j in both cases, g j = ς j ,
κ 1 = j = 1 1 j ς j 1 = 1 ς log ( 1 ς ) , and Φ 1 = 1 ς 2 .
Hence, we have
ω 2 = π 2 6 1 ς 2 ς 2 ( log ( 1 ς ) ) 2 ,
and ω ^ can be computed using ς ^ . All these results remain valid for all trending models with a break considered. The relevant correction needed is a simple scaling by ω ^ so that the test becomes LM T , λ ^ * LM T , λ ^ / ω ^ .
Proposition 4.
Suppose that the process { y t } is generated under the null hypothesis of Model A2 or A3, and that Assumptions 1 and 2 hold with η t being an ARMA(p,q) process. Then, it holds that as T , LM T , λ ^ * d N ( 0 , 1 ) if λ ^ λ b = o p ( T 1 / 2 ) and ω ^ ω = o p ( 1 ) .
The sufficient conditions in Proposition 4 follow from Lemma 2 and Proposition 1, hence the proof is omitted. The finite sample performance of LM T , λ ^ * with λ ^ { λ ^ s , λ ^ d , λ ^ t r } allowing for a structural break under both the null and alternative hypotheses will be examined in the next section.

5. Simulation Experiments

In this section, we present results from simulation experiments to illustrate the various theoretical results. Throughout the simulations, the true break fraction is set to λ b = 0 . 5 .5 The DGP is specified as y t = f t + u t where
f t = μ 1 + β 1 t for Model A 0 , μ b C t for Model A 1 , β b B t for Model A 2 , μ b C t + β b B t for Model A 3 ,
and u t = Δ 1 ζ t # = Δ 1 η t 1 t 1 , t = 0 , ± 1 , ± 2 , , where η t is a short-memory zero-mean covariance stationary process that will be specified below. We set some parameters as follows: μ 1 = 1 . 72 , β 1 = 0 . 03 , μ b = 1 , and β b = 1 . The configurations are the same as those in PZ, chosen to obtain distributions that easily reveal the main features of interest. In all cases, the results are obtained via 10,000 replications. Additionally, 5% nominal size tests are considered.
First, to illustrate the effect of a structural break on the power of the fractional unit root test, we consider two different models when a structural change in slope is allowed in the DGP: (i) Model A0 (which ignores a relevant slope change); and (ii) Model A2 (which is well specified). The results are provided in Table 1. It is clear that the power of LM T is much lower than that of LM T , λ ^ d , which supports the fact that a structural break in the DGP should be allowed when testing for a fractional unit root.
Table 2, Table 3, Table 4 and Table 5 present the rejection probabilities of the tests LM T and LM T , λ ^ at the 5% significance level when η t i . i . d . N ( 0 , 1 ) . In Table 2, no structural change is allowed in the DGP (Model A0); i.e., y t = μ 1 + β 1 t + u t . The size of LM T is well controlled, which is 0.05 and 0.06 with sample sizes T = 150 , 500 , respectively. Table 3 reports the results for Model A1. The break fraction is not estimated consistently, because the level shift is negligible compared to the stochastic trend induced by the I ( 1 ) errors. Hence, LM T , λ ^ s and LM T , λ ^ d suffer from severe size distortion, while LM T maintains size close to the nominal level 5%. Table 4 presents the results pertaining to Model A2. We also consider the test based on trimmed data, LM T , λ ^ t r . The test LM T , λ ^ d is size-controlled, while the others show minor size distortion. However, the power of LM T , λ ^ d is always lower than that of the other two tests. Table 5 presents the results pertaining to Model A3. Here, we set μ b = 0 to consider the effect of an irrelevant level shift. Notice that LM T , λ ^ s exhibits liberal size distortion and LM T , λ ^ d also shows considerable size distortion. As noted by Chang and Perron (2016) [33], the estimate of the break date shows a pattern of bi-modality when an irrelevant level shift is introduced. This phenomenon is referred to the “contamination” effect, because the irrelevant level shift can make the estimate of the true break date less precise. By construction, the contamination effect is marginal on LM T , λ ^ t r , whose exact size is 6.7% when T = 500 .
In Table 6, Table 7 and Table 8, we provide simulation results when the errors have short-run dynamics; i.e., ( 1 ρ L ) η t = ϵ t , ϵ t i . i . d . N ( 0 , 1 ) . We set the value of the autoregressive (AR) parameter at ρ { 0 . 5 , 0 , 0 . 3 , 0 . 6 , 0 . 8 } . When ρ = 0 , we can compare the loss of power caused by allowing for dynamics when none is present. The other parameters remain unchanged. Table 6 reports the size and power of the Lagrange multiplier tests pertaining to Model A1, LM T . It is well size-controlled with less persistent AR parameters ρ { 0 , 0 . 3 } , but it is very conservative with a higher AR coefficient ρ { 0 . 6 , 0 . 8 } , while it shows liberal size distortions with ρ = 0 . 5 . We find some interesting features in terms of power. First, power is higher when the AR parameter ρ is negative (in part due to the liberal size distortions). Second, as ρ becomes positive and large, power shrinks considerably. In particular, the loss of power is substantial when the AR parameter ρ increases from 0.6 to 0.8. This implies that a sufficiently large time span is needed to distinguish fractional integration from weak dependence. Comparing Table 3 with Table 6, for the ρ = 0 case, it is obvious that power is substantially lower when an irrelevant AR parameter is introduced. This result suggests that selecting the number of lags in the noise component is crucial to obtain good power. Lastly, with a persistent AR parameter ρ = 0 . 8 , the LM tests have non-monotonic power; that is, power does not increase when the order of integration d 0 moves away from the null of a unit root. As also discussed in Lobato and Velasco (2007) [16], it is difficult to distinguish fractional integration from a highly persistent stationary short-memory process. Table 7 reports the results pertaining to Model A2. They show similar patterns as for Model A1. It is noticeable that LM T , λ ^ d * performs well in terms of size across all cases, while its power is always lower than that of the other tests. Table 8 presents the results for Model A3. LM T , λ ^ d * has size distortion, even with negative and less persistent AR parameters. This happens because when using the dynamic regression to estimate the break fraction, the estimate λ ^ d is negatively biased for Model A3. Among the three LM statistics, LM T , λ ^ t r * based on the trimmed data performs well in finite samples. The size of LM T , λ ^ t r * is well controlled across various values of ρ, while LM T , λ ^ s * and LM T , λ ^ d * show liberal size distortions. Moreover, the power loss of LM T , λ ^ t r * is minor relative to the other tests. Hence, LM T , λ ^ t r and LM T , λ ^ t r * are the recommended tests in practice.

The Size and Power When a Pre-Test Is Used

In Figure 1, Figure 2, Figure 3 and Figure 4, we present the size and power of the LM tests as the slope change parameter ( β b ) changes in Models A2 and A3 with and without the use of a pre-test. As a pre-test, we use the SW test of Iacone et al. (2013) [37] at the nominal 5% level. We only consider the version of the LM statistics based on the trimmed estimate of the break fraction, denoted LM T , λ ^ t r and LM T , λ ^ t r p when no short-run dynamics is allowed, and by LM T , λ ^ t r * and LM T , λ ^ t r * p when an AR(1) structure is allowed. To assess the extent of the differences in the size distortion and power, we also report the infeasible LM test based on the true value of break fraction, denoted LM T , λ b and LM T , λ b * . The results are presented in Figure 1 for Model A2 (no short-run dynamics), Figure 2 for Model A2, and in Figure 3 and Figure 4 for Models A2 and A3 with short-run dynamics of the form ( 1 0 . 3 L ) η t = ϵ t , ϵ t i . i . d . N ( 0 , 1 ) . For LM T , λ ^ t r p and LM T , λ ^ t r * p , the trimming window contains six observations (the simulation results are not sensitive to the length of the window). The magnitude of break in the slope of the trend β b varies from −4 to 4 in increments of 0.2. We set μ b = 0 for Model A3. The sample sizes are T = 150 , 300, and the number of replications is 10,000 for each value of the parameters. One-sided tests against the alternative hypothesis H 1 : d 0 < 1 are constructed at the nominal 5% level. For power, d 0 is set to 0.8.
The results for Model A2 (presented in Figure 1) show first that the version without the pre-test exhibits some liberal size distortions when β b is near 0, which reduce when T increases, though remain noticeable even with T = 300 . On the other hand, the version with the pre-test exhibits conservative size-distortions when β b is near but not equal to 0, which again reduce but remain noticeable when T = 300 . The most drastic differences occur when considering the power of the tests. The power of the version without the pre-test is slightly below but near to the power of the version with the true break fraction when T = 150 for all values of β b . When T = 300 , the power functions are nearly the same. Things are very different when the version with the pre-test is used. When β b is near but not equal to zero, the power reduces drastically, creating pronounced power valleys. This reduction in power alleviates somewhat when T = 300 , but remains important. This is due to the fact that for low values of β b , the SW test of Iacone et al. (2013) [37] is not powerful enough, so a change in slope regressor is not included. Yet, the magnitude of the change in slope is large enough to induce a considerable loss in power. This is akin to the problem faced by the Kim and Perron (2009) [10] test in the context of testing for a unit root.
The results for Model A3 (presented in Figure 2) show a similar picture. This is also the case when considering the tests LM T , λ ^ t r * and LM T , λ ^ t r * p with serial correlation in the DGP (Figure 3 and Figure 4), though here the size distortions of both tests are somewhat higher, liberal for LM T , λ ^ t r * , and conservative for LM T , λ ^ t r * p . The power losses of LM T , λ ^ t r * p is severe, especially when T = 150 .
Based on the simulation results, it is recommended to use the LM T , λ ^ t r or LM T , λ ^ t r * tests without the pre-test. In our view, the reduction in power when using a pre-test considerably outweighs the differences in size distortions. The SW test of Iacone et al. (2013) [37] is nevertheless still useful to assess the presence of large breaks.

6. An Empirical Application

We analyze the aggregate price indices of the G7 countries. Monthly seasonally-adjusted CPI series were obtained from the OECD Main Economic Indicators. All series are analyzed with a logarithm transformation and are plotted in Figure 5, where the vertical line is the break date estimated by minimizing the sum of squared residuals from Model A2.
The results are presented in Table 9. We only consider Model A2, and use the test for a slope change of Iacone et al. (2013) [37]. Based on the simulation results, we recommend using the LM tests with λ ^ t r . We present results with and without short-run dynamics. When dynamics is allowed, an AR(1) specification is used. The time span is from January 1969 to December 2007 ( T = 468 ). First, the augmented Dickey-Fuller type test (ADF) cannot reject the null of a unit root against the alternative of trend stationarity for all G7 countries. On the other hand, the SW test of Iacone et al. (2013) [37] detects a change in the slope of the trend. Allowing for a structural change in trend, the fractional unit root tests LM T , λ ^ t r and LM T , λ ^ t r * lead to a rejection of the unit root in favor of fractional integration. Specifically, the test results state that the order of fractional integration is greater than unity for all G7 countries. We apply the two-step feasible exact local Whittle estimator d ^ E L W of Shimotsu (2010) [40] to the residuals from the fitted trend equipped with the estimate of the break date T ^ b . This result is compatible with that in Gil-Alana (2008) [41], where he estimated the order of fractional integration for the U.S. CPI and found that the confidence intervals were located above unity. Hassler and Wolters (1995) [42] considered the inflation rates for various countries, and found that the order of fractional integration was located in an interval ( 0 , 0 . 5 ) ; that is, the inflation rate is a long-memory process.

7. Conclusions

We established testing procedures for a fractional unit root, allowing for a structural change under both the null and alternative hypotheses. Following Robinson (1994) [13], Tanaka (1999) [14] derived a Lagrange multiplier test in the time domain, and Dolado et al. (2002, 2008) [15,19] and Lobato and Velasco (2007) [16] considered Wald-type tests for a unit root null hypothesis against fractional integration. Although Dolado et al. (2008) [19] introduced deterministic components, the case with a structural break in trend has not been considered in the literature. In contrast to the large amount of work related to testing the null hypothesis of long-memory against the alternative of stationarity with level shifts, and vice versa, work related to a fractional unit root test allowing for a structural break in trend is more scarce. To the best of our knowledge, this paper is the first that addresses testing for a fractional process allowing a structural break under both the null and alternative hypotheses.
Fractional unit root tests allowing for a structural break under both the null and alternative hypotheses have some desirable features: (i) given that economic variables are often subject to structural changes, our approach imposes a symmetric treatment of the change under both the null and alternative hypotheses; (ii) it is not required to distinguish long memory from structural change; (iii) the power of fractional unit root tests can be substantially improved when a break is actually present. Under some conditions, the proposed LM test statistics have the standard normal limit under the null hypothesis. Simulation experiments confirmed that the tests have good size and power. Hence, we believe that our procedures offer useful complements to existing tests and should be used in practical applications.
An extension of practical interest is to allow I ( d 0 ) processes under the null hypothesis, where I ( 1 ) processes are included as a special case. The sufficient condition for the LM test statistic to have the standard normal limit may be different from that in Proposition 1. Recently, Chang and Perron (2016) [33] extended PZ’s analysis to cover the more general case of fractionally integrated errors for values of d 0 in the interval ( 0 . 5 , 1 . 5 ) excluding the boundary case 0.5. In particular, they established the rate of the convergence of λ ^ s from the static regression [33] (Theorem 2). It is also important to examine the performance of λ ^ d and λ ^ t r under the null of I ( d 0 ) processes. Such investigations, and others, are the object of the ongoing subject.

Acknowledgments

We are grateful to academic editor Steve Cook, two anonymous referees, Tomoyoshi Yabu and participants at the 11th International Symposium on Econometric Theory and Applications (SETA 2015) for constructive comments, and Fabrizio Iacone, Dukpa Kim, and Katsumi Shimotsu for sharing their GAUSS and MATLAB codes. Chang’s research was partly supported by the National Natural Science Foundation of China Grants No. 71131008 (Key Project).

Conflicts of Interest

The authors declare no conflict of interest.

Appendix A

Proof of Theorem A1.
The DGP is specified by (4), that is, for t = 1 , , T ,
y t = μ 1 + μ b C t + u t , μ b 0 .
Under H 0 , take first differences of y t and define D ( T b ) t = 1 if t = T b + 1 and 0 otherwise. Then,
T 1 t = 1 T ( Δ y t ) 2 = T 1 t = 1 T ( μ b D ( T b ) t + η t ) 2 = T 1 t = 1 T η t 2 + 2 t = 1 T μ b D ( T b ) t η t + t = 1 T μ b 2 D ( T b ) t 2 = T 1 t = 1 T η t 2 + 2 μ b η T b + 1 + μ b 2 = T 1 t = 1 T η t 2 + o p ( 1 )
and
T 1 j = 2 T log Δ Δ y j Δ y j = T 1 j = 2 T k = 1 j 1 1 k ( μ b D ( T b ) j k + η j k ) ( μ b D ( T b ) j + η j ) = T 1 j = 2 T k = 1 j 1 1 k μ b D ( T b ) j k + k = 1 j 1 1 k η j k ( μ b D ( T b ) j + η j ) = T 1 j = 2 T k = 1 j 1 1 k μ b 2 D ( T b ) j k D ( T b ) j + T 1 j = 2 T k = 1 j 1 1 k μ b D ( T b ) j k η j + T 1 j = 2 T k = 1 j 1 1 k η j k μ b D ( T b ) j + T 1 j = 2 T k = 1 j 1 1 k η j k η j A 1 + A 2 + A 3 + A 4 .
It is easy to show that A 1 = 0 . For A 2 , we have
( A 2 ) 2 = μ b 2 1 T 2 k = 1 T ( T b + 1 ) 1 k η T 1 + 1 + k 2 μ b 2 1 T 2 k = 1 T ( T b + 1 ) 1 k 2 k = 1 T ( T b + 1 ) η T 1 + 1 + k 2 μ b 2 π 2 6 1 T 2 k = 1 T ( T b + 1 ) η T 1 + 1 + k 2 = μ b 2 π 2 6 1 T k = 1 T ( T b + 1 ) η T 1 + 1 + k 2 1 T = O p ( T 1 ) = o p ( 1 ) ,
where the first inequality follows from the Cauchy-Schwarz inequality, and the second inequality holds because k = 1 k 2 = π 2 / 6 (see Tanaka (1999) [14]). Because η t is a short-memory zero-mean covariance stationary process, it is straightforward to show that T 1 k = 1 T ( T b + 1 ) η T 1 + 1 + k 2 = O p ( 1 ) . By the continuous mapping theorem, | A 2 | = o p ( 1 ) , which implies that A 2 = o p ( 1 ) . Similarly,
( A 3 ) 2 = μ b 2 1 T 2 k = 1 T b 1 k η T b + 1 k 2 μ b 2 1 T 2 k = 1 T b 1 k 2 k = 1 T b η T b + 1 k 2 μ b 2 π 2 6 1 T k = 1 T b η T b + 1 k 2 1 T = o p ( 1 ) .
Given the results previously,
LM M = T 6 π 2 T 1 j = 2 T k = 1 j 1 1 k η j k η j + o p ( 1 ) T 1 j = 2 T η j 2 + o p ( 1 ) = T 6 π 2 k = 1 T 1 k ρ k + o p ( 1 ) ,
hence following Lemma A1 and Slutsky’s theorem, we have LM M d N ( 0 , 1 ) . ☐
Proof of Theorem A2.
Under H 0 : d 0 = 1 , Δ y t = β 1 + Δ u t = β 1 + η t 1 t 1 . Define Δ y t ˜ = Δ y t β ^ 1 . First, consider the denominator of LM T . Under H 0 , conditioning on y 0 = 0 ,
T 1 t = 1 T Δ y t ˜ 2 = T 1 t = 1 T ( Δ y t β ^ 1 ) 2 = T 1 t = 1 T ( β 1 β ^ 1 + η t ) 2 = ( β 1 β ^ 1 ) 2 + 2 ( β 1 β ^ 1 ) T 1 t = 1 T η t + T 1 t = 1 T η t 2 = O p ( T 1 ) + o p ( 1 ) + T 1 t = 1 T η t 2 = T 1 t = 1 T η t 2 + o p ( 1 ) ,
where we use the fact that β ^ 1 β 1 = O p ( T 1 / 2 ) , and T 1 t = 1 T η t p 0 by the weak law of large numbers. Second, the numerator of LM T is given by
T 1 j = 2 T log Δ Δ y j ˜ Δ y j ˜ = T 1 j = 2 T k = 1 j 1 1 k Δ y j k ˜ Δ y j ˜ = T 1 j = 2 T k = 1 j 1 1 k Δ y j k β ^ 1 ( Δ y j β ^ 1 ) = T 1 j = 2 T k = 1 j 1 1 k β 1 β ^ 1 + η j k ( β 1 β ^ 1 + η j ) = ( β 1 β ^ 1 ) 2 T 1 j = 2 T k = 1 j 1 1 k + ( β 1 β ^ 1 ) T 1 j = 2 T k = 1 j 1 1 k η j + ( β 1 β ^ 1 ) T 1 j = 2 T k = 1 j 1 1 k η j k + T 1 j = 2 T k = 1 j 1 1 k η j k η j = B 1 + B 2 + B 3 + T 1 j = 2 T k = 1 j 1 1 k η j k η j ,
where we use the expansion log Δ = L + 1 2 L 2 + 1 3 L 3 + . We show that B i = o p ( 1 ) for i = 1 , 2 , 3 .
B 1 ( β 1 β ^ 1 ) 2 T 1 T log T + γ + ζ T = O p ( T 1 ) log T + γ + ζ T = o p ( 1 ) , B 2 = ( β 1 β ^ 1 ) T 1 k = 1 T 1 1 k j = k + 1 T η j = O p ( T 1 / 2 ) o p ( 1 ) = o p ( 1 ) , B 3 = ( β 1 β ^ 1 ) T 1 k = 1 T 1 1 k j = 1 T k η j = O p ( T 1 / 2 ) o p ( 1 ) = o p ( 1 ) ,
where γ is the Euler-Mascheroni constant and ζ T 1 / ( 2 T ) which approaches 0 as T . The results for B 2 and B 3 follow from the arguments used in the proof of Theorem 1 for the terms A 2 and A 3 . Hence,
T 1 j = 2 T log Δ Δ y j ˜ Δ y j ˜ = T 1 j = 2 T k = 1 j 1 1 k η j k η j + o p ( 1 ) .
Then, under H 0 ,
LM T = T 1 j = 2 T k = 1 j 1 1 k η j k η j + o p ( 1 ) T 1 t = 1 T η t 2 + o p ( 1 ) = T 1 j = 2 T k = 1 j 1 1 k η j k η j T 1 t = 1 T η t 2 + o p ( 1 ) .
This completes the proof. ☐
Proof of Propositions A1 and A3.
When the estimate of the break date is consistent, the proof is trivial and omitted. We here focus on having a consistent estimate of the break fraction at some rate T ϰ for 0 < ϰ 1 . Specifically, suppose that the estimate of the break fraction λ ^ satisfies that λ ^ λ b = o p ( T ϰ ) for 0 < ϰ 1 . For all models A1–A3, we have a detrended sequence { y ˜ t } based on the OLS method in PZ. The Lagrange Multiplier test statistic is given by:
LM T , λ ^ = T 6 π 2 t = 2 T log Δ Δ y ˜ t Δ y ˜ t t = 1 T Δ y ˜ t 2 = T 6 π 2 t = 2 T k = 1 t 1 1 k Δ y ˜ t k Δ y ˜ t t = 1 T Δ y ˜ t 2 .
We show that the stochastic orders of terms associated with the deterministic time trend are smaller than those of terms associated with the error process. We can write (9) as:
Y ˜ = M ^ z Z ( T b ) ϕ + M ^ z U = M ^ z Z ( T b ) 2 ϕ 2 + M ^ z U = M ˜ + U ˜ ,
and Δ Y ˜ = Δ M ˜ + Δ U ˜ . Since LM T , λ ^ is a functional of Δ Y ˜ and subvectors of Δ Y ˜ , it suffices to consider the inner product of Δ Y ˜ Δ Y ˜ , that is,
Δ Y ˜ Δ Y ˜ = Δ M ˜ Δ M ˜ + 2 Δ M ˜ Δ U ˜ + Δ U ˜ Δ U ˜ .
Note that we only need to check the stochastic order of Δ Y ˜ Δ Y ˜ because the lag of order k is controlled to be small relative to the sample size T. We want to show that the term Δ U ˜ Δ U ˜ dominates the others. It is straightforward to show that Δ U ˜ Δ U ˜ = O p ( T ) uniformly over all admissible break dates T b { π T , ( 1 π ) T } for some π ( 0 , 1 / 2 ) in all models. When Δ M ˜ Δ M ˜ has a smaller order of magnitude compared to that of Δ U ˜ Δ U ˜ , so does Δ M ˜ Δ U ˜ by the Cauchy-Schwartz inequality. Further, the order of magnitude of Δ M ˜ Δ M ˜ cannot be greater than that of M ˜ Δ M ˜ . The order of magnitude of M ˜ Δ M ˜ is O p ( T 2 2 ϰ ) for Models A2 and A3, which implies that the break fraction should be estimated consistently at some rate greater than T 1 / 2 . On the other hand, for Model A1b, the stochastic order of M ˜ Δ M ˜ is O p ( T 1 + 2 α ) . Hence, the orders of magnitude of terms associated with the deterministic trend are greater than those of the terms associated with the error process, thereby the LM statistic diverges as T . ☐
  • 1.Given that unit root and long memory processes share similar features, distinguishing between long memory processes and short memory processes with structural changes has been an important topic in econometrics and financial economics. Along the lines of Perron (1989) [1], it is well known that short memory processes with level shifts exhibit properties that lead standard tools to conclude that long memory is present (e.g., Diebold and Inoue (2001) [20], Granger and Hyung (2004) [21], Lu and Perron (2010) [22], Perron and Qu (2010) [23], Qu and Perron (2013) [24], Xu and Perron (2014) [25], and Varneskov and Perron (2016) [26], among many others). On the other hand, it has been also documented that long memory processes induce a rejection of the null hypothesis of no structural change when using conventional structural change tests (see Wright (1998) [27] and Krämer and Sibbertsen (2002) [28]).
  • 2.The restriction that d 0 0 . 5 is standard in the long memory literature. Tanaka (1999) [14] showed that the case with d 0 = 0 . 5 needs to be treated separately from the case with d 0 0 . 5 .
  • 3.Under H 0 , β ^ 1 is a T 1 / 2 -consistent estimator of the slope coefficient β 1 . Hosking (1996) [32] considered a stationary ARFIMA ( p , d , q ) process { y t } and showed the weak convergence of the sample mean for d ( 0 . 5 , 0 . 5 ) . It is not difficult to generalize the result to the case where d ( 0 . 5 , 1 ) , for which β ^ 1 is a T 3 / 2 d -consistent estimator.
  • 4.Simulation results related to this issue are available upon request.
  • 5.Unreported simulation results with λ b = { 0 . 3 , 0 . 7 } are qualitatively similar to those with λ b = 0 . 5 .

References

  1. P. Perron. “The great crash, the oil price shock and the unit root hypothesis.” Econometrica 57 (1989): 1361–1401. [Google Scholar] [CrossRef]
  2. D.A. Dickey, and W.A. Fuller. “Distribution of the estimators for autoregressive time series with a unit root.” J. Am. Stat. Assoc. 74 (1979): 427–431. [Google Scholar] [CrossRef]
  3. P. Perron. “Testing for a unit root in a time series with a changing mean.” J. Bus. Econ. Stat. 8 (1990): 153–162. [Google Scholar] [CrossRef]
  4. L.J. Christiano. “Searching for a break in GNP.” J. Bus. Econ. Stat. 10 (1992): 237–250. [Google Scholar] [CrossRef]
  5. E. Zivot, and D.W.K. Andrews. “Further evidence on the great crash, the oil price shock and the unit root hypothesis.” J. Bus. Econ. Stat. 10 (1992): 251–270. [Google Scholar] [CrossRef]
  6. P. Perron. “Further evidence on breaking trend functions in macroeconomic variables.” J. Econom. 80 (1997): 355–385. [Google Scholar] [CrossRef]
  7. T.J. Vogelsang, and P. Perron. “Additional tests for a unit root allowing for a break in the trend function at an unknown time.” Int. Econ. Rev. 39 (1998): 1073–1100. [Google Scholar] [CrossRef]
  8. P. Perron, and X. Zhu. “Structural breaks with deterministic and stochastic trends.” J. Econom. 129 (2005): 65–119. [Google Scholar] [CrossRef]
  9. P. Perron, and T. Yabu. “Testing for shifts in trend with an integrated or stationary noise component.” J. Bus. Econ. Stat. 27 (2009): 369–396. [Google Scholar] [CrossRef]
  10. D. Kim, and P. Perron. “Unit root tests allowing for a break in the trend function at an unknown time under both the null and alternative hypotheses.” J. Econom. 148 (2009): 1–13. [Google Scholar] [CrossRef]
  11. J.L. Carrion-i-Silvestre, D. Kim, and P. Perron. “GLS-based unit root tests with multiple structural breaks under both the null and the alternative hypotheses.” Econom. Theory 25 (2009): 1754–1792. [Google Scholar] [CrossRef]
  12. P.M. Robinson. “Testing for strong serial correlation and dynamic conditional heteroskedasticity in multiple regression.” J. Econom. 47 (1991): 67–84. [Google Scholar] [CrossRef]
  13. P.M. Robinson. “Efficient tests of nonstationary hypothesis.” J. Am. Stat. Assoc. 89 (1994): 1420–1437. [Google Scholar] [CrossRef]
  14. K. Tanaka. “The nonstationary fractional unit root.” Econom. Theory 15 (1999): 549–582. [Google Scholar] [CrossRef]
  15. J.J. Dolado, J. Gonzalo, and L. Mayoral. “A fractional Dickey-Fuller test for unit roots.” Econometrica 70 (2002): 1963–2006. [Google Scholar] [CrossRef]
  16. I.N. Lobato, and C. Velasco. “Efficient Wald tests for fractional unit roots.” Econometrica 75 (2007): 575–589. [Google Scholar] [CrossRef] [Green Version]
  17. C. Amsler, and P. Schmidt. “A test of the null of integer integration against the alternative of fractional integration.” J. Econom. 187 (2015): 217–237. [Google Scholar]
  18. D. Kwiatkowski, P.C.B. Phillips, P. Schmidt, and Y. Shin. “Testing the null hypothesis of stationarity against the alternative of a unit root: How sure are we that economic time series have a unit root.” J. Econom. 54 (1992): 154–178. [Google Scholar] [CrossRef]
  19. J.J. Dolado, J. Gonzalo, and L. Mayoral. “Wald tests of I(1) against I(d) alternatives: Some new properties and an extension to processes with trending components.” Stud. Nonlinear Dyn. E. 12 (2008): 1–33. [Google Scholar]
  20. F.X. Diebold, and A. Inoue. “Long memory and regime switching.” J. Econom. 105 (2001): 131–159. [Google Scholar] [CrossRef]
  21. C.W.J. Granger, and N. Hyung. “Occasional structural breaks and long memory with an application to the S&P 500 absolute stock returns.” J. Empir. Finance 11 (2004): 399–421. [Google Scholar]
  22. Y.K. Lu, and P. Perron. “Modeling and forecasting stock return volatility using a random level shift model.” J. Empir. Finance 17 (2010): 138–156. [Google Scholar] [CrossRef]
  23. Z. Qu. “Long-memory and level shifts in the volatility of stock market return indices.” J. Bus. Econ. Stat. 28 (2010): 275–290. [Google Scholar] [CrossRef]
  24. P. Perron. “A stochastic volatility model with random level shifts and its application to S&P 500 and NASDAQ return indices.” Econom. J. 16 (2013): 309–339. [Google Scholar]
  25. J. Xu, and P. Perron. “Forecasting return volatility: Level shifts with varying jump probability and mean reversion.” Int. J. Forecast. 30 (2014): 449–463. [Google Scholar] [CrossRef]
  26. R.T. Varneskov, and P. Perron. Combining Long Memory and Level Shifts in Modeling and Forecasting the Volatility of Asset Returns, Boston, MA, USA: Department of Economics, Boston University, Unpublished manuscript. 2016.
  27. J.H. Wright. “Testing for a structural break at unknown date with long-memory disturbances.” J. Time Ser. Anal. 19 (1998): 369–376. [Google Scholar] [CrossRef]
  28. W. Krämer, and P. Sibbertsen. “Testing for structural changes in the presence of long memory.” Int. J. Bus. Econ. 1 (2002): 235–242. [Google Scholar]
  29. P.M. Robinson. “The distance between rival nonstationary fractional processes.” J. Econom. 128 (2005): 283–300. [Google Scholar] [CrossRef]
  30. D. Marinucci, and P.M. Robinson. “Alternative forms of fractional Brownian motion.” J. Stat. Plan. Inference 80 (1999): 111–122. [Google Scholar] [CrossRef]
  31. J. Davidson, and N. Hashimzade. “Type I and type II Brownian motions: A reconsideration.” Comput. Stat. Data Anal. 53 (2009): 2089–2106. [Google Scholar] [CrossRef]
  32. J.R.M. Hosking. “Asymptotic distributions of the sample mean, autocovariances, and autocorrelations of long-memory time series.” J. Econom. 73 (1996): 261–284. [Google Scholar] [CrossRef]
  33. S.Y. Chang, and P. Perron. “Inference on a structural change in trend with fractionally integrated errors.” J. Time Ser. Anal. 37 (2016): 555–574. [Google Scholar] [CrossRef]
  34. M. Hatanaka, and K. Yamada. “A unit root test in the presence of structural changes in I(1) and I(0) models.” In Cointegration, Causality, and Forecasting: A Festschrift in Honour of Clive W.J. Granger. Edited by R.F. Engle and H. White. Oxford, UK: Oxford University Press, 1999, pp. 256–282. [Google Scholar]
  35. D.I. Harvey, S.J. Leybourne, and P. Newbold. “Innovational outlier unit root tests with an endogenously determined break in level.” Oxf. B. Econ. Stat. 63 (2001): 559–575. [Google Scholar] [CrossRef]
  36. L.C. Nunes, C.-M. Kuan, and P. Newbold. “Spurious break.” Econom. Theory 11 (1995): 736–749. [Google Scholar] [CrossRef]
  37. F. Iacone, S.J. Leybourne, and A.M.R. Taylor. “Testing for a break in trend when the order of integration is unknown.” J. Econom. 176 (2013): 30–45. [Google Scholar] [CrossRef]
  38. K.M. Abadir, W. Distaso, and L. Giratis. “Nonstationarity-extended local Whittle estimation.” J. Econom. 141 (2007): 1353–1384. [Google Scholar] [CrossRef]
  39. D.W.K. Andrews. “Tests for parameter instability and structural change with unknown change point.” Econometrica 61 (1993): 821–856. [Google Scholar] [CrossRef]
  40. K. Shimotsu. “Exact local Whittle estimation of fractional integration with unknown mean and time trend.” Econom. Theory 26 (2010): 501–540. [Google Scholar] [CrossRef]
  41. L.A. Gil-Alana. “Fractional integration and structural breaks at unknown periods of time.” J. Time Ser. Anal. 29 (2008): 163–185. [Google Scholar] [CrossRef]
  42. U. Hassler, and J. Wolters. “Long memory in inflation rates: International evidence.” J. Bus. Econ. Stat. 13 (1995): 37–45. [Google Scholar] [CrossRef]
Figure 1. Null rejection probabilities in Model A2, λ b = 0 . 5 [ + : LM T , λ ^ t r , * : LM T , λ ^ t r p , : LM T , λ b ].
Econometrics 05 00005 g001
Figure 2. Null rejection probabilities in Model A3, λ b = 0 . 5 [ + : LM T , λ ^ t r , * : LM T , λ ^ t r p , : LM T , λ b ].
Econometrics 05 00005 g002
Figure 3. Null rejection probabilities in Model A2, where ( 1 0 . 3 L ) η t = ϵ t , λ b = 0 . 5 [ + : LM T , λ ^ t r , * : LM T , λ ^ t r * p , : LM T , λ b ].
Econometrics 05 00005 g003
Figure 4. Null rejection probabilities in Model A3, where ( 1 0 . 3 L ) η t = ϵ t , λ b = 0 . 5 [ + : LM T , λ ^ t r , * : LM T , λ ^ t r * p , : LM T , λ b ].
Econometrics 05 00005 g004
Figure 5. (log) CPI for the G7 Countries.
Econometrics 05 00005 g005
Table 1. The effect of a structural break in trend on the Lagrange multiplier (LM) tests.
T = 150
d 0 0.50.550.60.650.70.750.80.850.90.951
LM T 0.7670.6170.4580.2900.1870.1170.0700.0440.0290.0200.004
LM T , λ ^ d 110.9970.9860.9490.8580.7030.4850.3030.1690.036
Note: 5% nominal size tests are used. The data-generating process (DGP) is specified by y t = β b B t + u t and u t = Δ m ( Δ d η t ) 1 t 1 with η t i . i . d . N ( 0 , 1 ) where d 0 = m + d , d [ 0 . 5 , 0 ) , and m = 1 . The values of model parameters are set to λ 0 = 0 . 5 , β b = 0 . 5 . The test LM T , designed for Model A1, ignores a structural break in the DGP, while the test LM T , λ ^ d , designed for Model A2, is well specified with the estimate of the break date obtained from the dynamic regression (10).
Table 2. Rejection probabilities of the LM T test for Model A0.
d 0 0.50.550.60.650.70.750.80.850.90.951
T = 150
1110.9970.9830.9240.7780.5440.3070.1540.051
T = 500
1111110.9970.9200.6080.2600.056
Note: 5% nominal size tests are used. The DGP is defined by y t = μ 1 + β 1 t + u t , and u t = Δ m ( Δ d η t ) 1 t 1 with η t i . i . d . N ( 0 , 1 ) where d 0 = m + d , d [ 0 . 5 , 0 ] , and m = 1 . The values of model parameters are set to μ 1 = 1 . 72 , β 1 = 0 . 03 .
Table 3. Rejection probabilities of the LM T , λ ^ and LM T tests for Model A1.
d 0 0.50.550.60.650.70.750.80.850.90.951
T = 150
LM T , λ ^ s 1110.9890.9900.9690.8970.7650.5890.4100.255
LM T , λ ^ d 1110.9970.9880.9460.8390.6550.4450.2630.134
LM T 1110.9970.9810.9270.7720.5410.3090.1510.052
T = 500
LM T , λ ^ s 1111110.9990.9700.8020.4940.252
LM T , λ ^ d 1111110.9960.9320.6740.3300.118
LM T 1111110.9970.9250.6160.2500.055
Note: 5% nominal size tests are used. The DGP is defined by y t = μ b C t + u t , and u t = Δ m ( Δ d η t ) 1 t 1 with η t i . i . d . N ( 0 , 1 ) , where d 0 = m + d , d [ 0 . 5 , 0 ] , and m = 1 . The values of model parameters are set to λ 0 = 0 . 5 , μ b = 1 .
Table 4. Rejection probabilities of the LM T , λ ^ tests for Model A2.
d 0 0.50.550.60.650.70.750.80.850.90.951
T = 150
LM T , λ ^ s 1110.9980.9870.9360.8200.6100.3870.2110.077
LM T , λ ^ d 0.9980.9940.9820.9510.8820.7650.6060.4090.2460.1300.039
LM T , λ ^ t r 10.9990.9990.9970.9810.9220.7940.5870.3690.2050.072
T = 500
LM T , λ ^ s 1111110.9950.9040.5670.2290.063
LM T , λ ^ d 11110.9970.9740.8930.7170.4260.1650.048
LM T , λ ^ t r 1111110.9970.9170.5910.2440.071
Note: 5% nominal size tests are used. The DGP is defined by y t = β b B t + u t , and u t = Δ m ( Δ d η t ) 1 t 1 with η t i . i . d . N ( 0 , 1 ) , where d 0 = m + d , d [ 0 . 5 , 0 ] , and m = 1 . The values of model parameters are set to λ 0 = 0 . 5 , β b = 1 .
Table 5. Rejection probabilities of the LM T , λ ^ tests for Model A3.
d 0 0.50.550.60.650.70.750.80.850.90.951
T = 150
LM T , λ ^ s 1110.9980.9900.9530.8570.6790.4800.3050.175
LM T , λ ^ d 110.9990.9950.9770.9210.8060.6160.4190.2580.128
LM T , λ ^ t r 1110.9960.9810.9260.7980.5870.3800.2180.083
T = 500
LM T , λ ^ s 1111110.9950.9240.6590.3500.156
LM T , λ ^ d 11110.9990.9960.9740.8510.5610.2590.101
LM T , λ ^ t r 111110.9990.9930.8990.5710.2330.067
Note: 5% nominal size tests are used. The DGP is defined by y t = β b B t + u t , and u t = Δ m ( Δ d η t ) 1 t 1 with η t i . i . d . N ( 0 , 1 ) , where d 0 = m + d , d [ 0 . 5 , 0 ] , and m = 1 . The values of model parameters are set to λ 0 = 0 . 5 , β b = 1 .
Table 6. Rejection probabilities of LM T , λ ^ * and LM T for Model A1 with short-run dynamics.
d 0
ρ 0.50.550.60.650.70.750.80.850.90.951
T = 150
LM T , λ ^ s * 10.9990.9970.9870.9650.8940.7760.6180.4490.3050.187
−0.5 LM T , λ ^ d * 10.9990.9970.9860.9620.8910.7690.5980.4290.2770.168
LM T 10.9990.9940.9740.9280.8130.6390.4420.2590.1370.059
LM T , λ ^ s * 0.9930.9860.9670.9270.8620.7740.6560.5280.4240.3290.244
0 LM T , λ ^ d * 0.9910.9810.9550.9040.8240.7110.5820.4350.3210.2240.143
LM T 0.9860.9690.9300.8510.7280.5720.4110.2670.1630.1020.046
LM T , λ ^ s * 0.9460.8990.8390.7670.6710.5530.4500.3650.2720.2150.158
0.3 LM T , λ ^ d * 0.9220.8630.7880.6830.5730.4410.3370.2450.1680.1150.069
LM T 0.8940.8110.7070.5760.4450.3030.2090.1330.0770.0540.026
LM T , λ ^ s * 0.5580.4840.3850.2960.2340.1630.1270.0910.0610.0480.029
0.6 LM T , λ ^ d * 0.4560.3700.2740.1970.1440.0860.0600.0390.0240.0200.010
LM T 0.3610.2770.1840.1210.0790.0420.0290.0180.0130.0130.007
LM T , λ ^ s * 0.0960.0740.0490.0350.0250.0170.0140.0100.0120.0110.008
0.8 LM T , λ ^ d * 0.0440.0330.0190.0130.0140.0120.0150.0220.0240.0270.036
LM T 0.0190.0160.0110.0120.0180.0260.0330.0410.0420.0380.026
T = 500
LM T , λ ^ s * 111110.9990.9790.8560.5810.3050.129
−0.5 LM T , λ ^ d * 111110.9990.9740.8290.5370.2620.100
LM T 1111110.9800.8300.5020.2150.066
LM T , λ ^ s * 11110.9990.9920.9360.7810.5760.4030.263
0 LM T , λ ^ d * 11110.9990.9850.8940.6950.4510.2730.143
LM T 11110.9990.9790.8580.5950.3300.1680.058
LM T , λ ^ s * 1110.9980.9790.9200.7770.5750.3940.2570.155
0.3 LM T , λ ^ d * 1110.9960.9670.8690.6840.4470.2610.1620.074
LM T 1110.9950.9570.8370.6110.3760.2050.1240.051
LM T , λ ^ s * 0.9840.9560.8800.7360.5590.3480.1950.1140.0560.0330.016
0.6 LM T , λ ^ d * 0.9770.9350.8440.6730.4870.2970.1710.1050.0650.0450.023
LM T 0.9740.9270.8330.6700.4970.3160.1990.1350.0830.0580.028
LM T , λ ^ s * 0.2490.1480.0750.0400.0240.0150.0080.0070.0050.0060.004
0.8 LM T , λ ^ d * 0.2020.1330.0840.0670.0660.0690.0840.0910.1010.1070.103
LM T 0.2170.1590.1260.1200.1420.1570.1710.1630.1340.1020.043
Note: 5% nominal size tests are used. The DGP is defined by y t = μ b C t + u t and u t = Δ m ( Δ d η t ) 1 t 1 with ( 1 ρ L ) η t = ϵ t and ϵ t i . i . d . N ( 0 , 1 ) , where d 0 = m + d , d [ 0 . 5 , 0 ] . We set μ b = 1 .
Table 7. Rejection probabilities of LM T , λ ^ * for Model A2 with short-run dynamics.
d 0
ρ 0.50.550.60.650.70.750.80.850.90.951
T = 150
LM T , λ ^ s * 10.9990.9960.9850.9490.8610.7130.5150.3540.2150.100
0 . 5 LM T , λ ^ d * 0.9930.9820.9550.9080.8160.6800.5210.3500.2330.1360.054
LM T , λ ^ t r * 10.9960.9900.9690.9260.8220.6710.4780.3350.2030.098
LM T , λ ^ s * 0.9910.9780.9430.8850.7950.6520.5070.3640.2680.1890.097
0 LM T , λ ^ d * 0.9120.8510.7790.6680.5620.4250.3110.2050.1530.1040.046
LM T , λ ^ t r * 0.9880.9650.9310.8680.7740.6450.4960.3730.2800.2050.113
LM T , λ ^ s * 0.9070.8480.7610.6620.5330.4290.3190.2390.1700.1290.071
0.3 LM T , λ ^ d * 0.6910.6020.5020.4090.3110.2300.1630.1150.0760.0560.027
LM T , λ ^ t r * 0.8680.7920.6960.5940.4670.3690.2710.1980.1410.1090.055
LM T , λ ^ s * 0.4360.3600.2820.2150.1570.1190.0830.0610.0500.0380.027
0.6 LM T , λ ^ d * 0.2300.1760.1300.0920.0580.0440.0280.0200.0190.0160.012
LM T , λ ^ t r * 0.4210.3440.2690.2110.1560.1180.0820.0620.0540.0430.030
LM T , λ ^ s * 0.0570.0400.0380.0380.0440.0530.0610.0630.0580.0440.028
0.8 LM T , λ ^ d * 0.0220.0120.0130.0170.0250.0320.0440.0470.0440.0340.023
LM T , λ ^ t r * 0.0400.0260.0240.0250.0340.0390.0490.0530.0510.0380.024
T = 500
LM T , λ ^ s * 111110.9990.9630.7850.4450.1970.068
−0.5 LM T , λ ^ d * 11110.9930.9520.8240.5940.3110.1290.039
LM T , λ ^ t r * 1111110.9750.8250.4900.2210.081
LM T , λ ^ s * 11110.9980.9690.8310.5750.3290.1690.076
0 LM T , λ ^ d * 110.9930.9680.9070.7930.6170.4080.2250.1080.050
LM T , λ ^ t r * 11110.9980.9780.8650.6170.3620.1900.099
LM T , λ ^ s * 110.9990.9940.9500.8260.6140.3820.2330.1450.081
0.3 LM T , λ ^ d * 0.9930.9740.9290.8460.7460.6130.4270.2550.1490.0810.049
LM T , λ ^ t r * 110.9990.9940.9570.8360.6250.3910.2360.1450.079
LM T , λ ^ s * 0.9750.9300.8280.6870.5210.3660.2570.1780.1250.0990.065
0.6 LM T , λ ^ d * 0.7880.7090.5960.4750.3400.2220.1440.0910.0600.0400.030
LM T , λ ^ t r * 0.9760.9330.8340.6900.5140.3530.2400.1610.1130.0900.067
LM T , λ ^ s * 0.2450.1870.1610.1690.1910.2180.2380.2260.1760.1220.067
0.8 LM T , λ ^ d * 0.1430.1040.0870.0850.0840.0920.1010.1170.1030.0820.048
LM T , λ ^ t r * 0.2350.1650.1300.1240.1270.1420.1610.1900.1910.1990.226
Note: 5% nominal size tests are used. The DGP is defined by y t = β b B t + u t and u t = Δ m ( Δ d η t ) 1 t 1 with ( 1 ρ L ) η t = ϵ t and ϵ t i . i . d . N ( 0 , 1 ) , where d 0 = m + d , d [ 0 . 5 , 0 ] . We set β b = 1 .
Table 8. Rejection probabilities of LM T , λ ^ * for Model A3 with short-run dynamics.
d 0
ρ 0.50.550.60.650.70.750.80.850.90.951
T = 150
LM T , λ ^ s * 10.9990.9960.9860.9520.8800.7490.5610.4030.2720.149
0 . 5 LM T , λ ^ d * 10.9990.9960.9830.9460.8710.7380.5490.3900.2580.139
LM T , λ ^ t r * 10.9960.9890.9700.9250.8320.6860.4910.3390.2190.096
LM T , λ ^ s * 0.9920.9800.9460.8970.8130.6970.5690.4410.3440.2620.183
0 LM T , λ ^ d * 0.9910.9730.9390.8810.7860.6700.5370.4010.3030.2290.149
LM T , λ ^ t r * 0.9830.9630.9190.8480.7400.6090.4730.3430.2500.1840.095
LM T , λ ^ s * 0.9190.8680.7850.6950.5870.4880.3770.3020.2300.1830.137
0.3 LM T , λ ^ d * 0.8990.8350.7470.6460.5180.4250.3070.2360.1670.1210.083
LM T , λ ^ t r * 0.8770.8090.7100.6070.4830.3810.2740.2080.1580.1190.069
LM T , λ ^ s * 0.4810.3960.3180.2510.1910.1500.1150.0860.0720.0550.039
0.6 LM T , λ ^ d * 0.4070.3170.2410.1730.1250.0880.0630.0460.0320.0260.016
LM T , λ ^ t r * 0.3850.2980.2420.1750.1270.0920.0710.0510.0420.0320.021
LM T , λ ^ s * 0.0820.0590.0520.0390.0360.0330.0320.0330.0270.0240.019
0.8 LM T , λ ^ d * 0.0450.0280.0230.0150.0140.0140.0160.0190.0240.0260.030
LM T , λ ^ t r * 0.0400.0300.0300.0260.0310.0420.0440.0500.0440.0390.026
T = 500
LM T , λ ^ s * 111110.9990.9700.8070.5010.2430.103
0 . 5 LM T , λ ^ d * 111110.9930.9360.7410.4340.1990.079
LM T , λ ^ t r * 111110.9990.9720.8010.4760.2120.073
LM T , λ ^ s * 11110.9990.9790.8760.6740.4390.2860.164
0 LM T , λ ^ d * 11110.9910.9530.8290.6220.3790.2260.124
LM T , λ ^ t r * 11110.9980.9700.8350.5910.3260.1770.077
LM T , λ ^ s * 110.9990.9950.9620.8590.6730.4680.3070.1920.123
0.3 LM T , λ ^ d * 110.9970.9780.9250.7920.5800.3720.2150.1240.076
LM T , λ ^ t r * 110.9990.9920.9450.8120.5900.3710.2220.1310.078
LM T , λ ^ s * 0.9780.9350.8430.6970.5210.3480.2200.1400.0910.0700.050
0.6 LM T , λ ^ d * 0.9420.8640.7390.5720.3930.2400.1380.0800.0500.0350.025
LM T , λ ^ t r * 0.9710.9170.8180.6670.4930.3430.2310.1620.1080.0870.063
LM T , λ ^ s * 0.2320.1530.1140.0970.0950.0990.1050.0930.0710.0520.052
0.8 LM T , λ ^ d * 0.1620.1010.0670.0490.0410.0390.0390.0470.0570.0710.067
LM T , λ ^ t r * 0.2250.1730.1440.1450.1540.1760.2030.1900.1550.1050.055
Note: 5% nominal size tests are used. The DGP is defined by y t = β b B t + u t and u t = Δ m ( Δ d η t ) 1 t 1 with ( 1 ρ L ) η t = ϵ t and ϵ t i . i . d . N ( 0 , 1 ) , where d 0 = m + d , d [ 0 . 5 , 0 ] . We set β b = 1 .
Table 9. Empirical results for the logarithmic price indices of the G7 countries.
ADF SW Break Date d ^ ELW LM T , λ ^ tr LM T , λ ^ tr *
Canada−0.16 (4)19.40 ***1986 May [0.45]1.309.44 ***9.37 *** 0 . 13
France−1.47 (6)28.19 ***1985 Nov [0.43]1.6934.65 ***7.54 *** 0 . 62
Germany−1.59 (1)10.78 **1982 Oct [0.35]1.3218.98 ***8.01 *** 0 . 41
Italy−0.61 (7)16.37 ***1986 Jul [0.45]1.5429.55 ***11.64 *** 0 . 52
Japan−2.50 (11)18.86 ***1980 Nov [0.31]1.6518.93 ***8.73 *** 0 . 42
U.K.−1.47 (7)16.50 ***1983 Nov [0.38]1.519.46 ***4.39 *** 0 . 5
U.S.A.−0.44 (2)15.75 **1984 Jun [0.40]1.2912.71 ***3.48 *** 0 . 38
Note: (1) The numbers in parentheses are the values of the autoregressive order selected by the Bayesian information criterion when constructing the ADF test; (2) the numbers in brackets [ · ] denote the estimated break fractions; (3) the numbers in · are the estimates of the AR coefficient in the noise component. *, **, and *** denote a statistic significant at the 10%, 5%, and 1% level, respectively.

