Article

Mapping Changes in Carbon Storage and Productivity Services Provided by Riparian Ecosystems of Semi-Arid Environments in Northwestern Mexico

by
Romeo Mendez-Estrella
,
Jose Raul Romo-Leon
* and
Alejandro E. Castellanos
Departamento de Investigaciones Científicas y Tecnológicas, Universidad de Sonora, Luis Donaldo Colosio s/n, entre Sahuaripa y Reforma, Colonia Centro, Hermosillo C.P. 83000, Sonora, Mexico
*
Author to whom correspondence should be addressed.
ISPRS Int. J. Geo-Inf. 2017, 6(10), 298; https://doi.org/10.3390/ijgi6100298
Submission received: 22 June 2017 / Revised: 22 September 2017 / Accepted: 24 September 2017 / Published: 26 September 2017

Abstract

:
We analyze the importance of riparian ecosystems (RE) as critical areas for carbon storage and productivity in semi-arid regions of Northwest Mexico. We calculated the carbon storage by land cover and compared temporal trends of basal productivity (MODIS) and pre-monsoon productivity (Landsat) of RE, to other land cover types. We used land cover maps generated previously for the region (years 1993, 2002, and 2011), assigning values of carbon stored in aerial and root biomass, as well as organic carbon stored in the soil. To estimate productivity (proxy), time series were generated using the Normalized Difference Vegetation Index (NDVI) values of Landsat 4–5 TM and MODIS for each land cover type. We found that RE stores 93,147 tC/ha, about 1.5 times the estimated storage for oak forest (65,048 tC/ha). Productivity of RE was similar to highly productive land cover types, such as agriculture and oak forest, and higher than in the rest of the ecosystems of the region. We also found that changes from RE to agriculture and cultivated grasslands represented a decrease in productivity (p < 0.001). Finally, we report a gradual decrease in basal productivity (p = 0.0151) and pre-monsoon productivity (p = 0.031) in the RE. These results help us understand that changes in land use, intensive use of water, and climate can influence the ecosystem services of productivity and carbon storage offered by RE in semi-arid areas.

1. Introduction

Riparian ecosystems (RE) are key elements for the function and assemblage of habitats in arid and semi-arid environments [1,2,3]. Moreover, numerous studies have found that many species (not only riparian species) in these areas depend on water, nutrients resources present in riparian habitats [4,5]. RE resource richness is a consequence of the multiple ecological and hydrological processes such as high volumes of surface runoff, flooding regime, transport and deposition of organic matter, soil development, moisture retention, and biomass production [1,2,3,6].
Arid and semi-arid RE are often cataloged as large carbon reserves [7,8] due to their broad diversity and abundance of plant species, which can produce dense stands of individuals and large volumes of biomass, when compared to other arid ecosystems [9].
From an ecosystem services (ES) perspective, it is believed that riparian ecosystems of arid-semiarid zones (REAZ) provide a great variety and quantity of ES compared to the other ecosystems present in the same area [10]. In addition to materials and goods obtained, the REAZ offer multiple support, regulation services, acting as filters of agricultural pollutants, water purifiers, erosion control, carbon capture and storage, flood control, among others, and cultural services, which contribute to the development of functional coupled human and natural systems [11,12,13,14,15]. Despite the considerable provision of ES offered by the REAZ, there is a general lack of knowledge regarding key processes that affect the provision of these services.
In Mexico, only a limited quantity of ES has been subject to management or regulation in the REAZ. Due to their importance for economic-social development, ES related to water production and fertile land, are the most widely studied and regulated in REAZ in the country. However, services regarding primary productivity (support services) and carbon storage (regulation services) have been undervalued and scarcely studied.
Primary productivity is tightly related to ecosystem functioning and development, since it regulates material and energy exchange trough photosynthetic-respiration activity [16]. It is also considered a support service, since it is the base for the “production” of other services. In this sense, when photosynthetically active radiation is converted into biomass and consumed by the livestock, or used as a fuel or as construction materials, productivity generates provision services [17]. Energy that is transformed into biomass also provides the ES of carbon storage, promoting the regulation of climate [17].
The evidence of a gradual and significant increase in temperature over the last 100 years [18], derived from increased CO2 levels in the atmosphere, has provoked the concern of the scientific and political community worldwide. In the face of this situation, decision-makers require accurate information regarding the current status and spatial distribution of sources, sinks and storage of carbon at global, regional, and even local scales [19]. Interest has generally been focused on tropical and temperate forests, since those ecosystems represent the largest reservoirs of carbon in the world. However, it has been observed that carbon storage in the REAZ can match the levels of other ecosystems, such as the pine, oak [20,21], and tropical dry forests [22].
Due to the limited evidence provided by the scientific community [23], there is a general lack of information regarding productive capacity and carbon storage in the REAZ. Therefore, in the case of Mexico, there are no legal mechanisms to protect these ecosystems and ensure the preservation of their ES.
Previous studies have calculated that arid environments of Northwestern Mexico have undergone extensive conversions, primarily due to agricultural use [24]. Therefore, it is imperative to improve our understanding regarding their capacity as and ES providers to be able to develop management guidelines according to their importance and prominence in arid landscapes.
The objective of the present study is to (1) provide evidence of the importance of the REAZ as critical areas for productivity and carbon storage services in a regional context, and (2) assess how these services can be affected by land and water use in semi-arid regions. For this, we developed the following objectives: (1) to estimate the carbon content in three different stocks (aerial biomass, root biomass, and in the soil) per land cover type present in an experimental REAZ; (2) determine the spatial distribution of carbon in three different years (1993, 2002, and 2011) using land cover maps of the study area [25]; (3) analyze NDVI values per land cover type in order to compare proxies of productivity between RE, and other ecosystems found in the same region; (4) quantify and analyze changes in carbon storage associated to changes in land use; and, finally (5) analyze the temporal trends in productivity per land cover type, as well as the behavior of these trends in RE. The present study will contribute to increase our knowledge regarding carbon dynamics, and vegetation function, in key ecosystems of semi-arid environments.

2. Materials and Methods
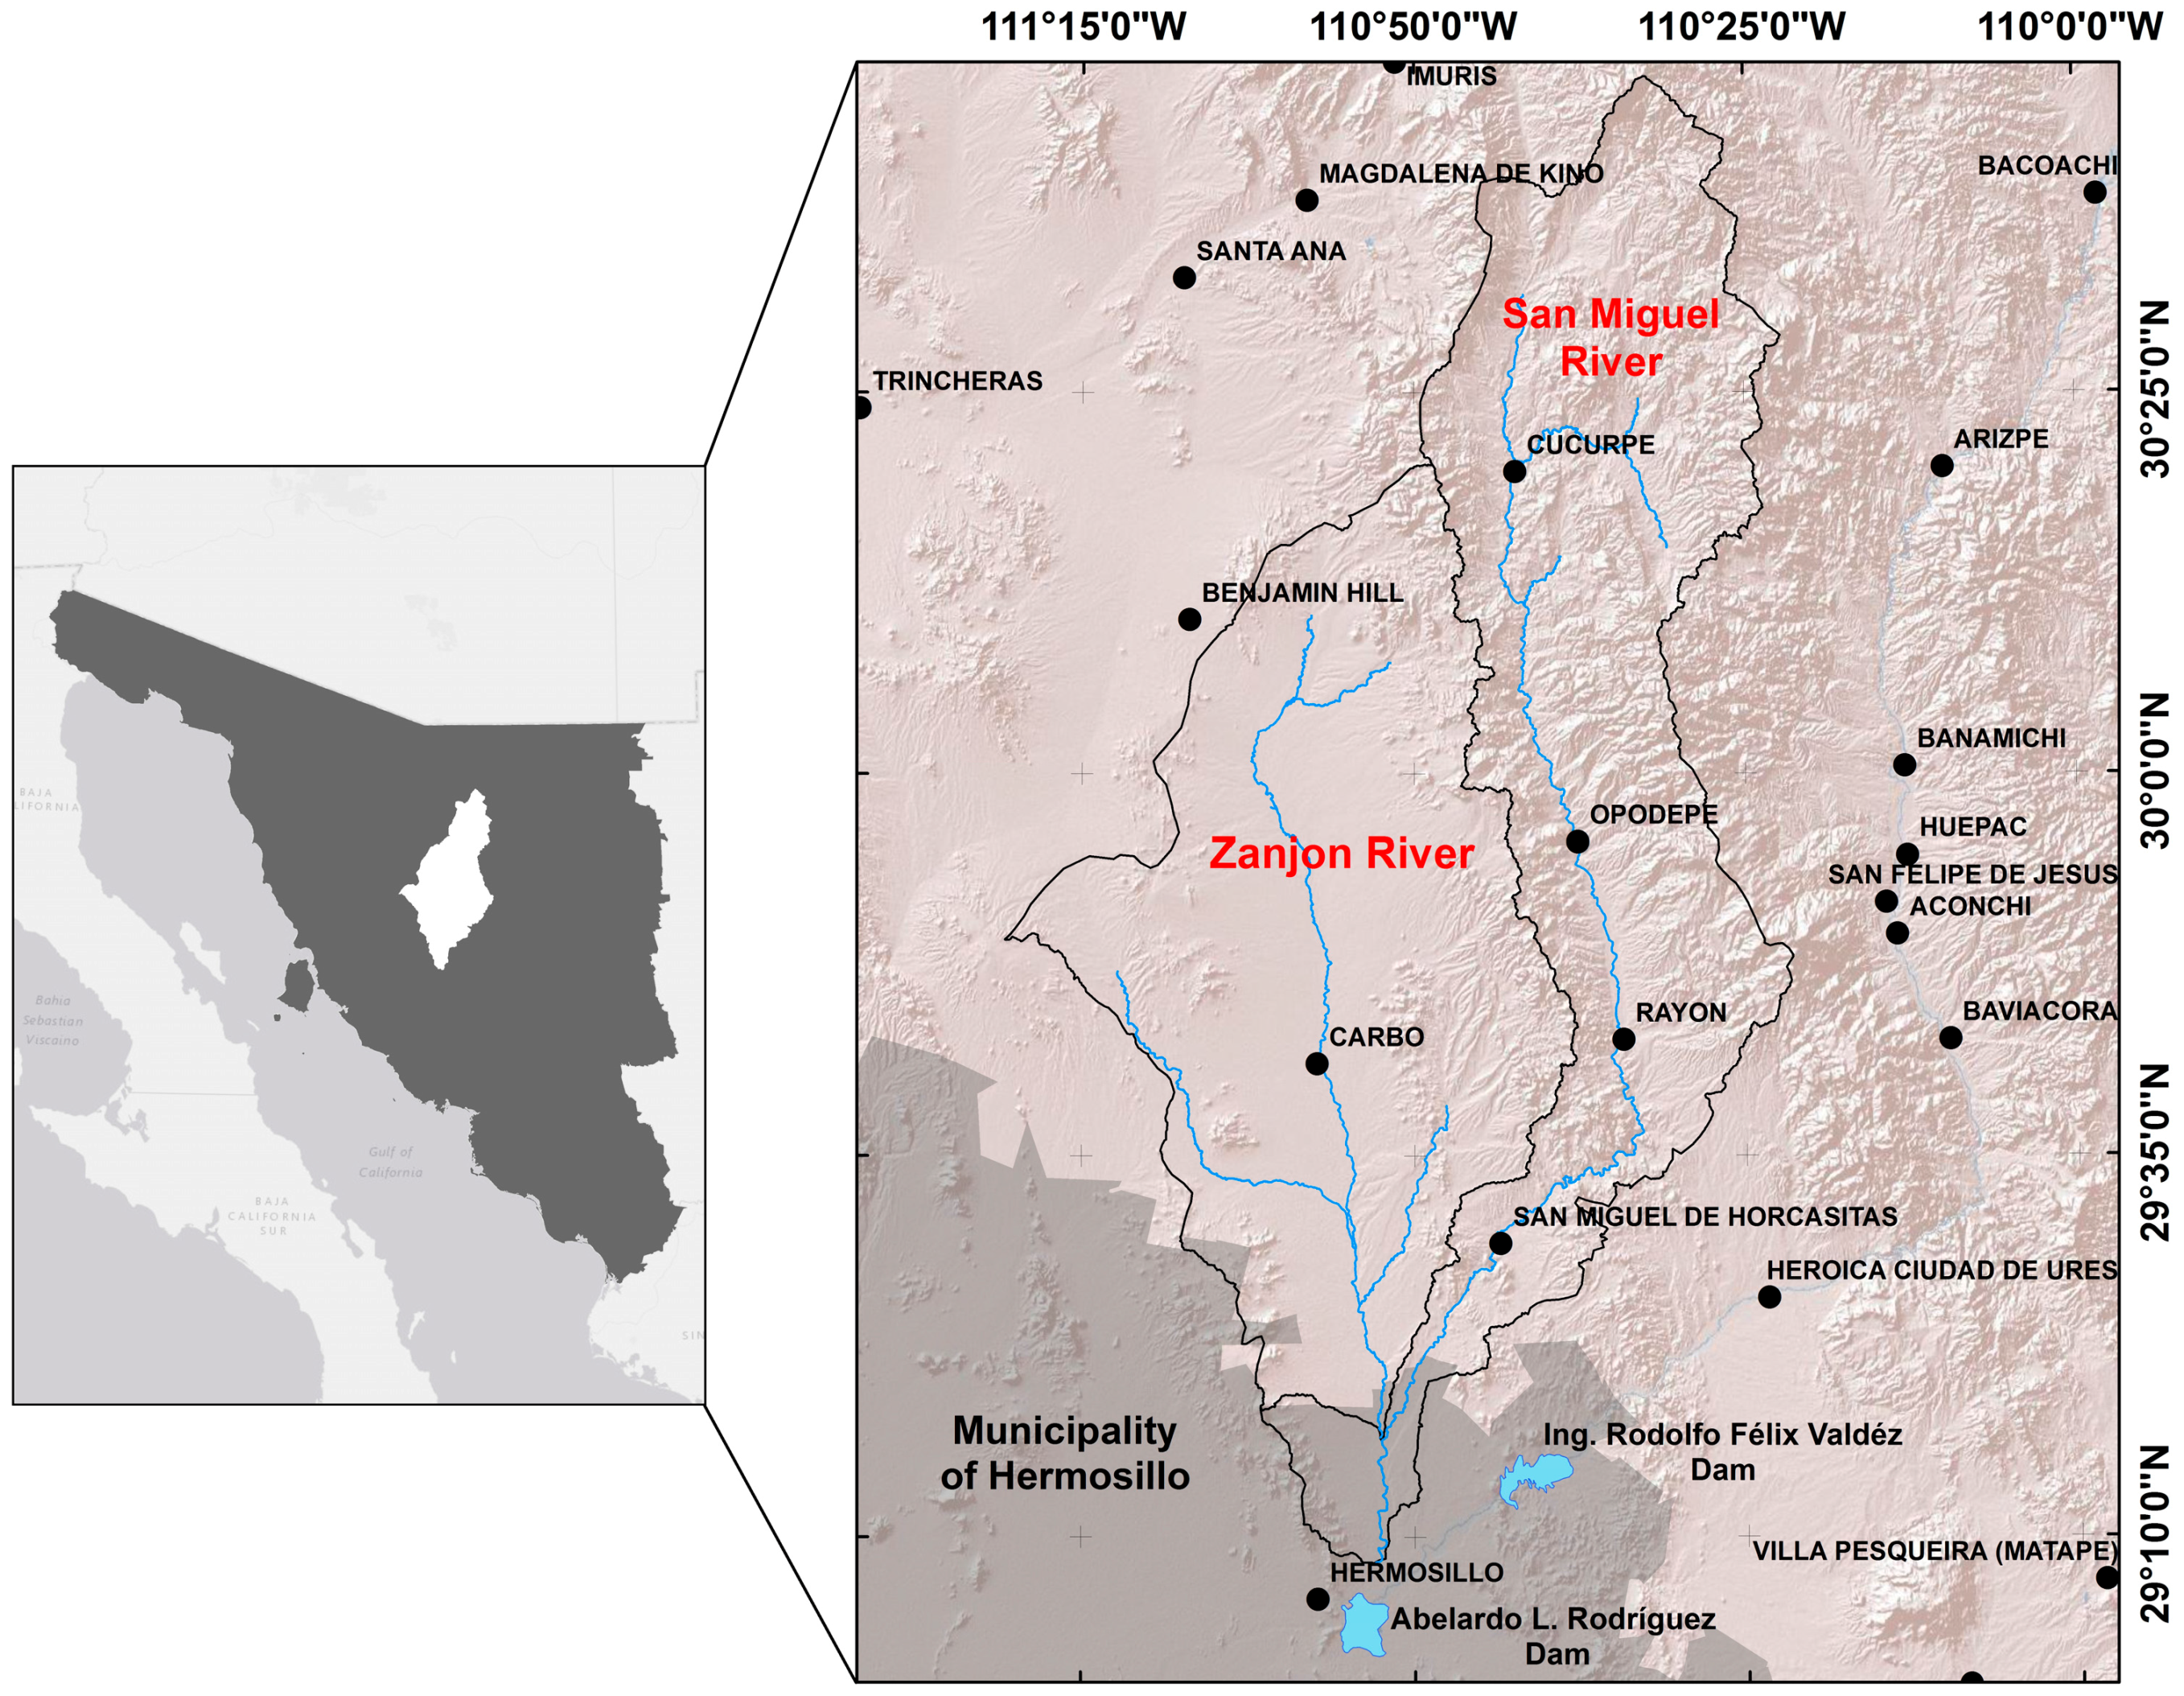
2.1. Study Area

We selected the sub-basin “El Cajoncito—Arroyo del Carrizo” as our study area, which includes the San Miguel (SMR) and Zanjón (ZR) river regions [26]. It is located in North-Central Sonora (Mexico), approximately between latitudes 30°46′ and 28°53′ north and longitudes 110°33′ and 110°45′ west. The sub-basin approximate area is 9437 km2, and it covers 32% of the Sonora River basin. The El Cajoncito—Arroyo del Carrizo sub-basin provides most of the water for Hermosillo (the capital city of Sonora), since it feeds the Abelardo L. Rodríguez dam and multiple groundwater wells used to supply the city. Moreover, these river systems recharge aquifers that provide water for agricultural, public–urban, and fishing activities in at least eight municipalities in the State [27].
The mean elevation for the Zanjón River (ZR) region is 656 m, ranging from 1734 m in the Sierra de Cucurpe to 280 m in the lower reaches, where it converges with the San Miguel River (SMR). Both watersheds are subject to a bimodal precipitation pattern, with summer and winter monsoons. Precipitation in the ZR is the lowest in the entire basin of the Sonora River, with records of between 340 and 384 mm/year, occurring mostly during the summer monsoon. The annual mean temperature ranges between 21 °C and 22 °C [27]. The dominant land cover types in this region are desert scrub, cultivated and induced grassland (mainly buffel-grass (Cenchrus ciliaris)), subtropical/succulent scrub, and agriculture (annual and perennial) [25].
The San Miguel River region has a mean elevation of 948 m, with a maximum of 2439 m in the Sierra Azul and a minimum of 225 m at the Abelardo L. Rodríguez dam. Annual accumulated precipitation ranges from 423 mm to 575 mm (most of it occurring during the summer monsoon), with an average annual temperature ranging between 19 °C and 22 °C [28]. The dominant land cover types in this region are subtropical and desert scrub, oak/oak–pine forest, as well as natural/native grassland and riparian mesquite [25].
The presence of riparian vegetation is widespread in some sections of the SMR watercourse, mainly between Cucurpe and San Miguel de Horcasitas (Figure 1). Agricultural areas are found near main settlements like Cucurpe, Opodepe, Rayón, and San Miguel de Horcasitas. The most extensive agricultural fields are located at the riverbanks towards North Rayón. It is also worth noting that, despite the fact that topography makes it difficult to establish prairies of buffel-grass in the SMR sub-basin, extensive livestock production is also a significant activity.
Social and economic development in both regions has been closely related to the use and exploitation of the RE. Provision of ground and surface water, as well as use of the fertile land on the floodplains, are the most important provision ES, and have allowed the development of agricultural and livestock production activities. The intensive use of the resources described above exerts a constant pressure on the RE, compromising its structural and functional integrity, as well as their capacity to provide ES.

2.2. Mapping Critical Areas for Carbon Storage

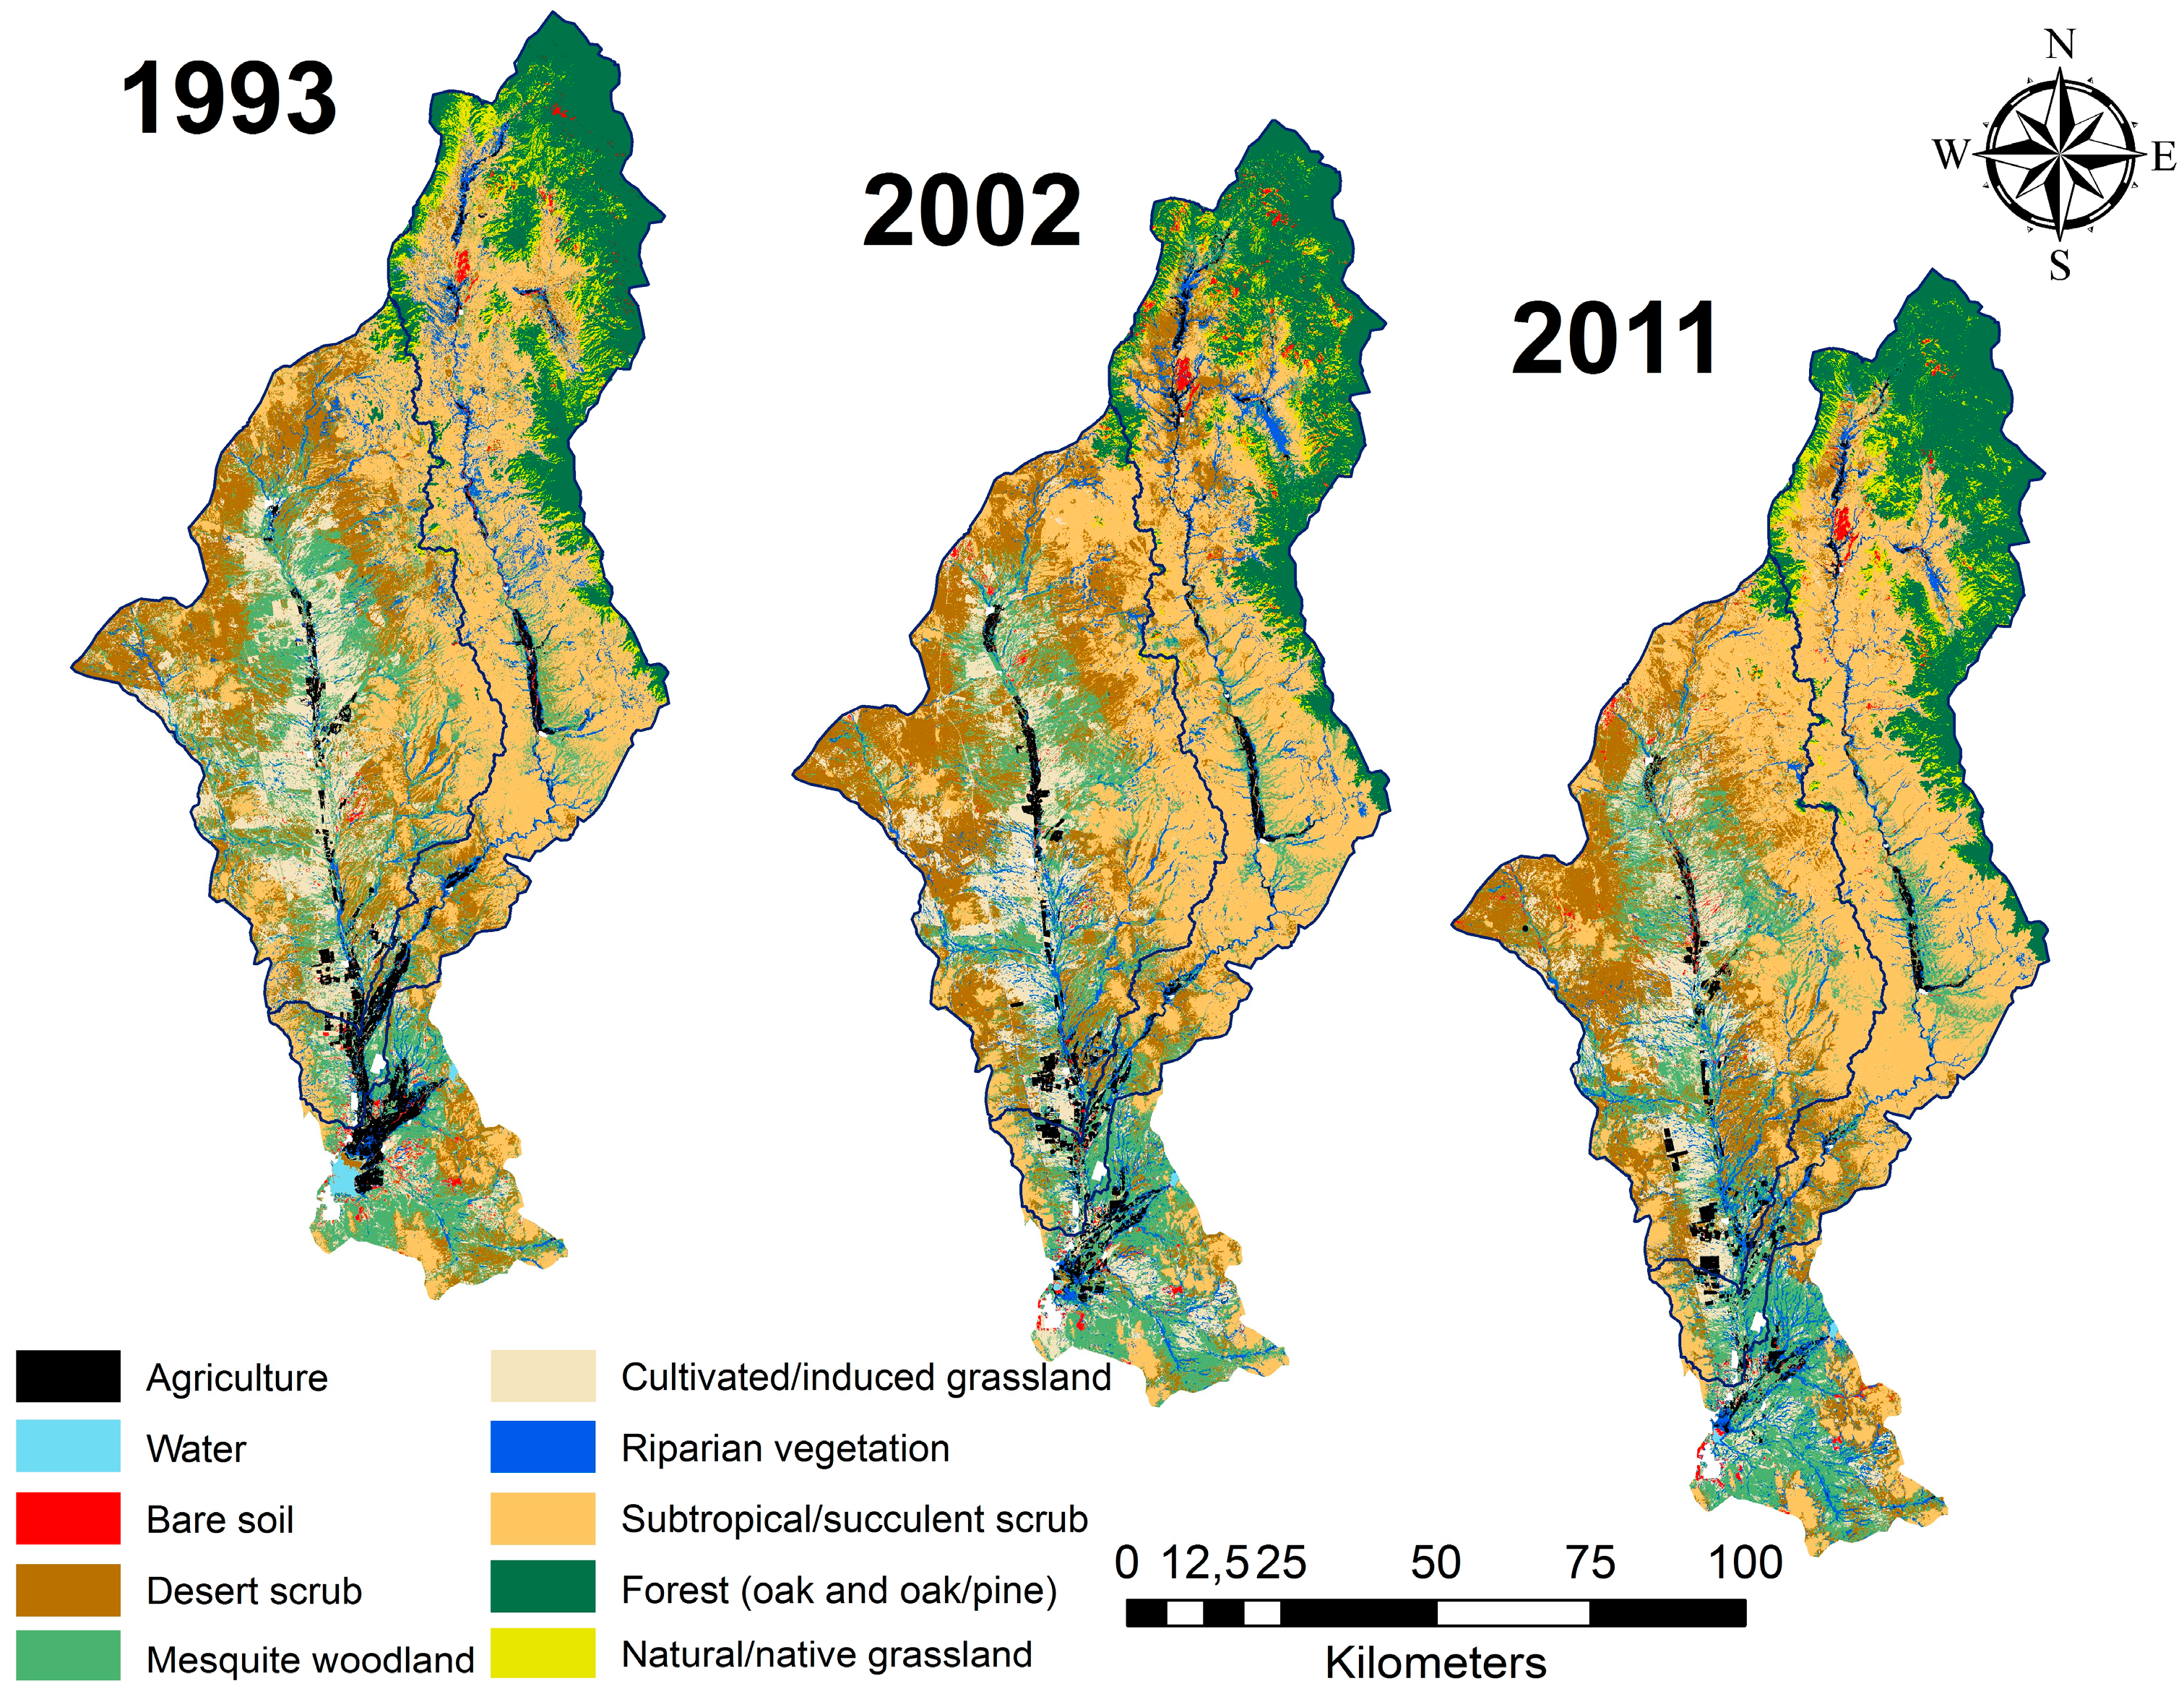
2.2.1. Land Use and Cover Classification

This study used land cover maps generated by Méndez–Estrella et al. (2016) [25] (Figure 2), which were generated through supervised classification, using the CART (Classification and Regression Trees) model and the scheme of classes proposed by Anderson [29], considering a combination of physiognomic and life form criteria provided by diverse sources [30,31].
Sampling (for classification training) for each of the land cover classes was made on the field, and also using orthorectified imagery with high spatial resolution. The training sample size ranged between 60 and 150 sites per land cover class defined in the scheme.
Once the training locations where collected, Landsat TM scenery (from Path 35-Row 39 and Path 35-Row 40) was selected for the years 1999, 2002, and 2011, assuring atmospheric and terrain correction [25]. A total of two images per year (on both scene locations) were collected from the United States Geological Survey [25].
Using the TM scenes and a digital elevation model (DEM) obtained also from the United States Geological Survey, we derived an array of variables used to create the thematic classification maps [25].
Global precisions of the classifications were greater than 79%, the precision values of the user and producer are in the range of 52% to 100% and the kappa coefficient is greater than 75% [25]. The classifications, therefore, comply with the acceptable limits of accuracy [32].

2.2.2. Carbon Storage by Land Cover Type

To identify critical areas for carbon storage we used land-use and land-cover maps of the area of interest, assigning each of the classes an average value of carbon, calculated from information collected in the field, or from previous studies [33]. In order to obtain values for carbon storage per land cover class, we used a combination of approaches ranging from the use of coefficients obtained from the literature to direct field sampling.
Our first approach to derive carbon storage values was through estimation obtained in previous studies, regarding biomass and carbon allocation in arid lands vegetation types [34,35,36,37,38,39,40,41,42,43]. The second step was to complement the previous using datasets form the National Forestry Inventory (NFI), provided by the National Forestry Commission (CONAFOR, for its Spanish acronym). Specifically, we used dendrometric measurements of diameter at breast height (DBH), which is collected for every tree with DBH greater than 7.5 cm at each sample plot (conglomerate), conducted on land cover types present in our study site (Appendix A). Results obtained from the previous measurements were fed to specific allometric equations (Appendix B), to obtain estimates for carbon storage on this cover types. Finally, direct field sampling was carried out for riparian vegetation, where NFI estimation or data from the literature was not available.
Values of carbon stocks regarding (1) aerial biomass, (2) root biomass, and (3) organic carbon in the soil, were calculated and fed into the model through the following procedure:
(a)
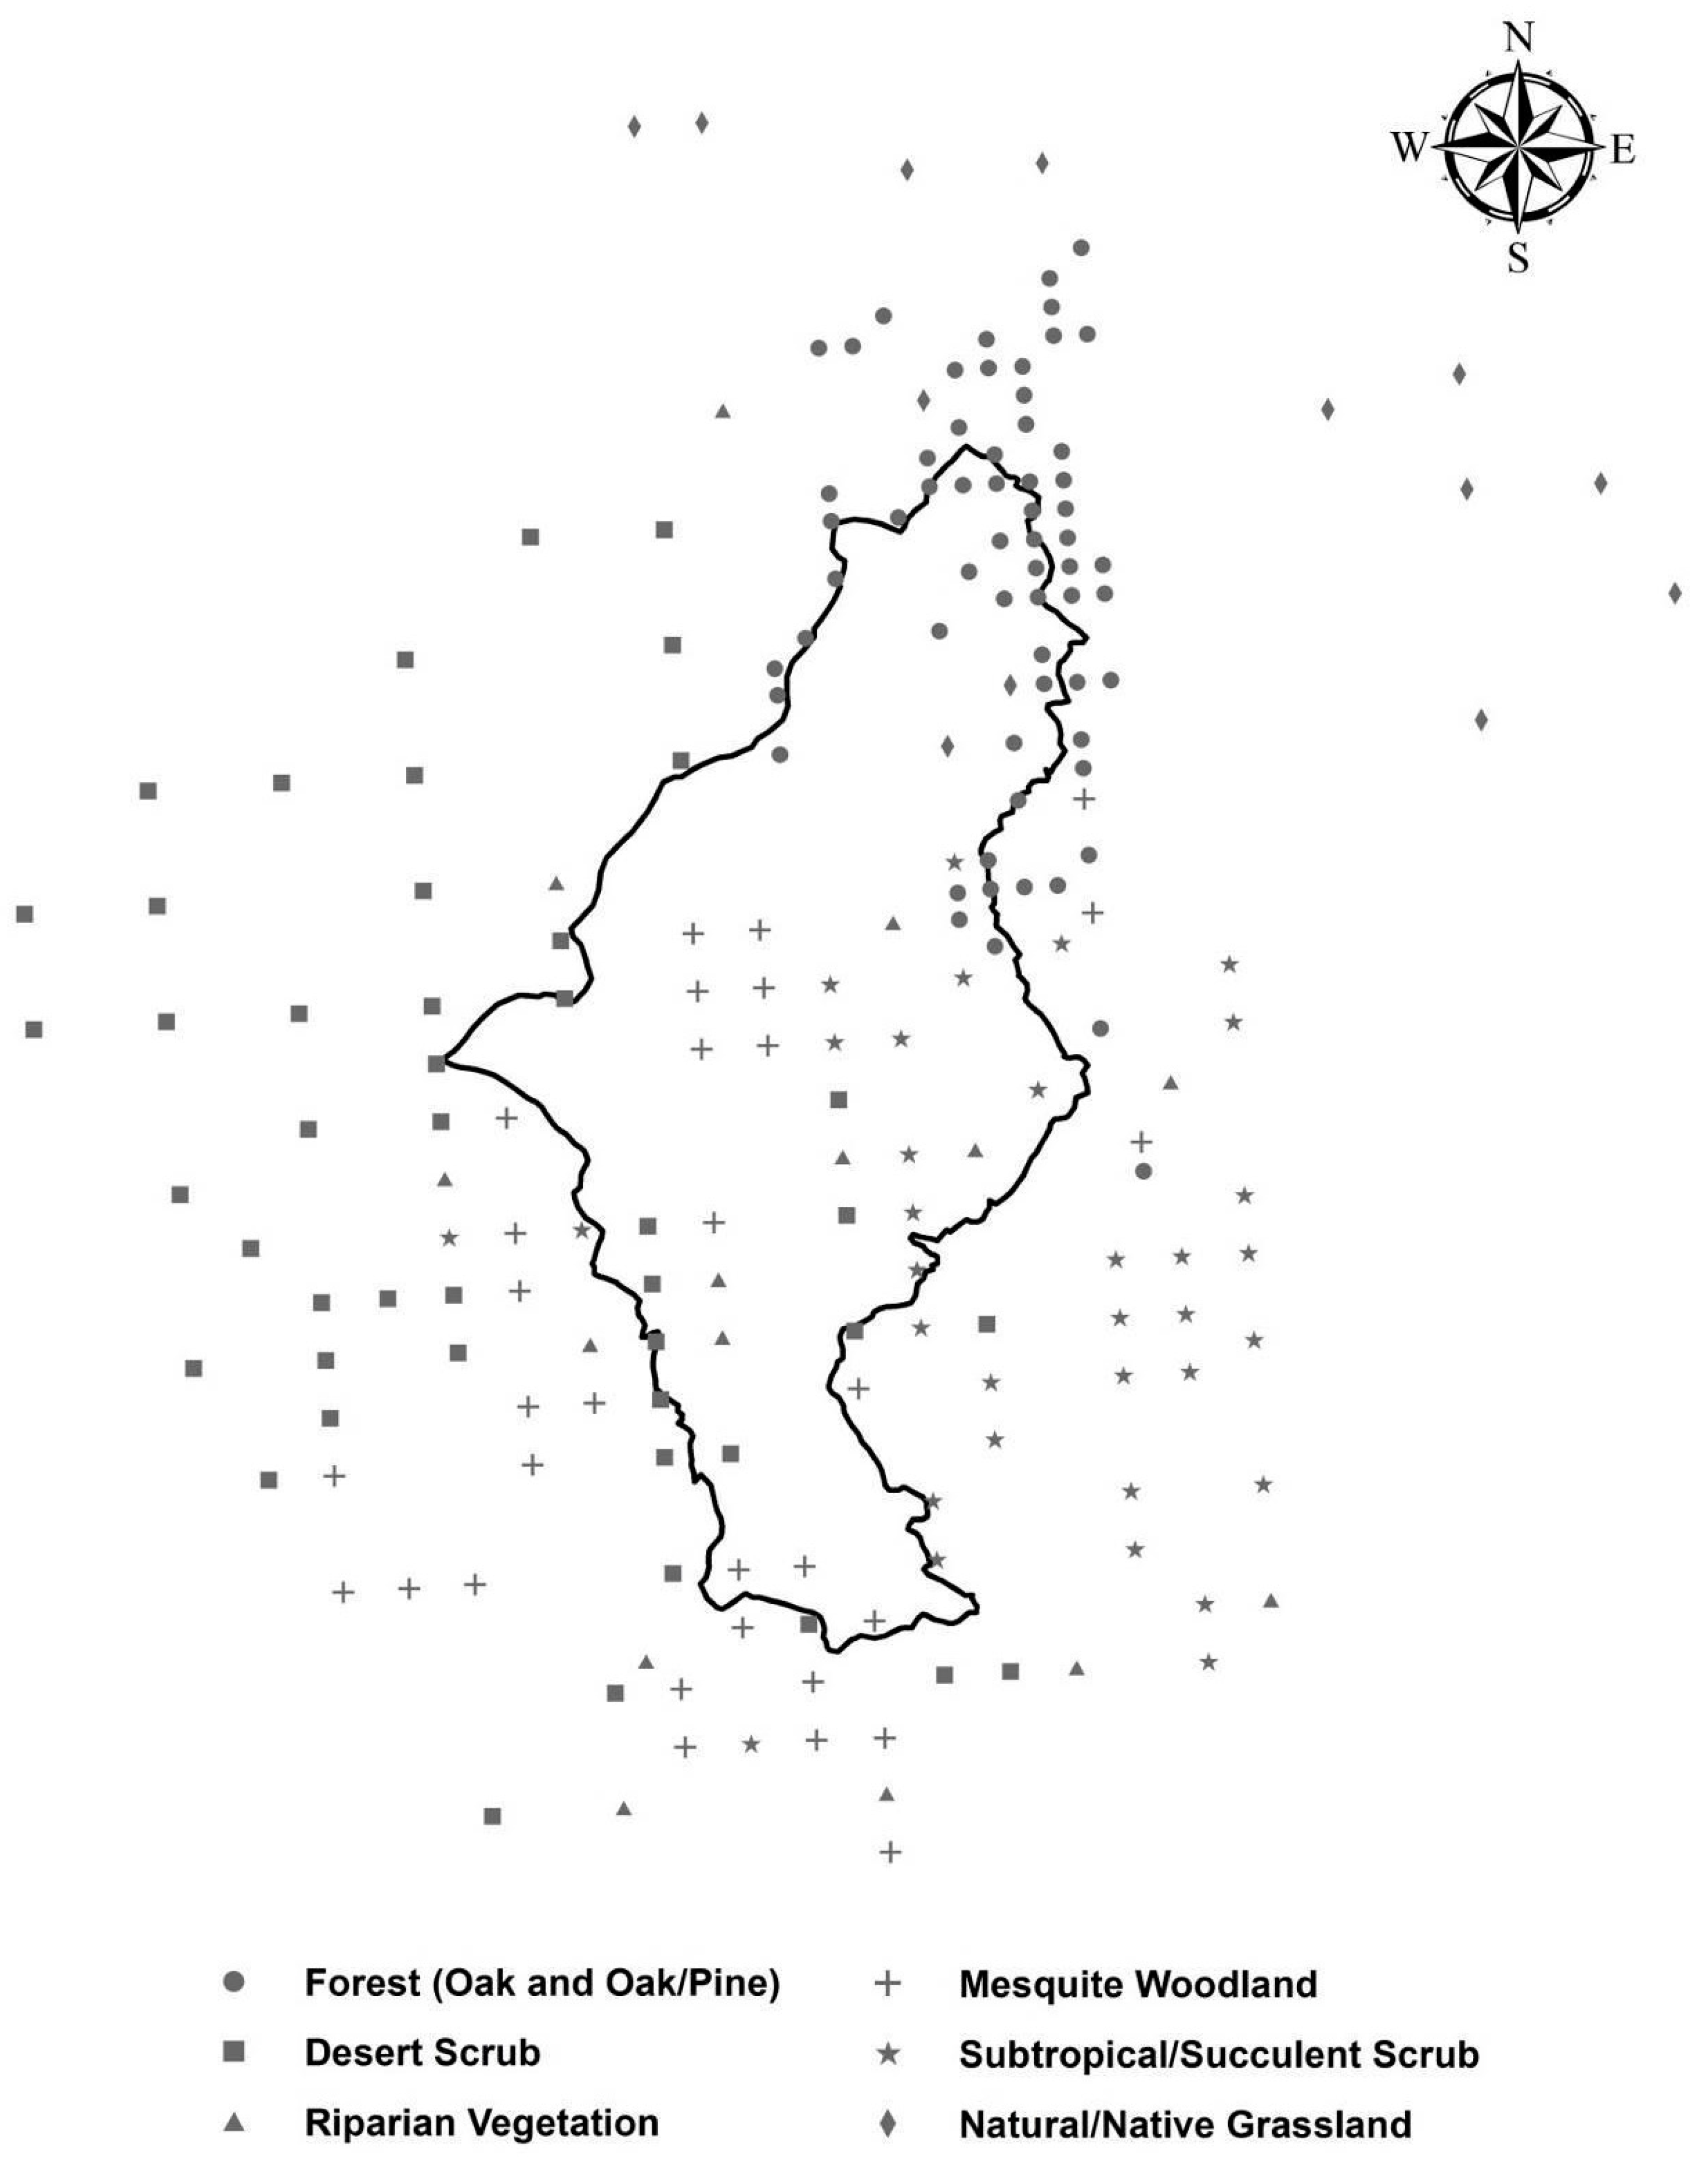
Aerial biomass per land cover type was estimated using the NFI information for the study area (Appendix A). Each NFI sampling unit is called a “conglomerate” and, in arid zones, has an area of 1600 m2 [44]. The diameter at breast height (DBH) data was used to calculate biomass per species in each “conglomerate”, applying the allometric equations reported in the literature [45,46]. Each “conglomerate” sample size was between 7 and 39 trees (depending on land cover type), and the total biomass by conglomerate was estimated in ton/ha.
(b)
Aerial biomass of cultivated/induced grassland (not included in the NFI sampling sites), was obtained from regional studies regarding this variable [34], using similar sites to the land cover type of interest.
(c)
Aerial biomass of perennial and annual agriculture was obtained from the “Servicio de Información Agroalimentaria y Pesquera” database [35].
(d)
For the riparian ecosystems of the SMR (Riparian vegetation), which differs from Riparian mesquite (composed mainly by Prosopis, Cercidium, Acacia) due to the floristic composition (species of the genera Populus, Salix, Bacharis, etc.), no information was found in the NFI or in the literature. Therefore, eight field-sampling sites were established (with a sample size of 28 trees per site) using the NFI protocol, in which the DBH was measured (using only trees that had over 7.5 DBH) in order to enable the use of species-specific allometric equations (Appendix B).
(e)
For accumulated root biomass, we used previous works, which estimate shoot:root biomass ratios per vegetation type [36,37,38,39,41,42,43].
(f)
Finally, for the organic carbon stored in the soil, we obtained the reported carbon values for each soil type [36,40].
The information generated through allometric equations or reported in the literature is expressed in biomass per hectare, before being finally converted to ton/ha of carbon. This conversion was performed by multiplying the biomass by the standard factor of conversion to carbon, which is 0.47 according to the IPCC (2006) for most types of vegetal cover [47]. In the case of agriculture, different conversion values were used according to the particular type of crop present, as described in Carvajal et al. [41]. Appendix B presents the references for each calculation, or the bibliographic origins of the data that were used for the spatial modeling of critical areas for carbon storage.

2.2.3. Spatiotemporal Changes in Carbon Storage

Critical areas for carbon storage were obtained by applying the carbon storage and sequestration models, included in the Integrated Valuation of Ecosystem Services and Tradeoffs (InVEST 3.1.0) [20].
Once estimated, carbon stocks were assigned to each land cover type, assuming that spatiotemporal changes among the different vegetation types, (e.g., riparian vegetation transformed to agriculture) translates into carbon storage changes. Therefore, an ecosystems service model (InVEST 3.1.0) was applied to each of the classified thematic maps previously obtained (years 1993, 2002, and 2011), in order to estimate carbon gains and losses in our study site. For each year classified, a carbon storage map was obtained, with a spatial resolution of 30 m corresponding to that of Landsat TM 4–5 images.

2.3. Productivity Estimations and Trends

2.3.1. Vegetation Indices as Proxies for Productivity

Vegetation indices are highly correlated to photosynthetic activity [16], and are often used to assess vegetation function. These indices can be derived from sensors mounted on satellite platforms, from where we can obtain images at specific temporal resolutions [16]. We decided to use the MODIS and Landsat images to: (1) corroborate possible differences and trends in productivity with two sources of information; (2) complement the spatial resolution (with both MODIS and Landsat) of our analysis; and (3) to compare our results to those obtained in previous studies, with respect to the productivity trends found in the wetlands of the region [48,49].
The Normalized Difference Vegetation Index (NDVI) is frequently used to analyze the photosynthetic activity of vegetation, providing approximate information about the primary productivity, biomass, and the index of foliar area for extensive areas of the landscape [16,50]. This index has also been used to observe changes in vegetation photosynthesis [51]. For photosynthetically active vegetation, high reflectance in the near infrared and low reflectance in the red wavelength are characteristics utilized for the construction of the NDVI [52]. This index is calculated by applying the following equation to each of the pixels of an image obtained through remote sensing:
NDVI = NIR     RED NIR   +   RED
where NIR stands for near infrared reflectance and RED stands for red visible reflectance of the photosynthetically active radiation (PAR) spectral region.
In this study, the parameters obtained based on NDVI were: (1) “basal productivity”, using information from the MODIS sensor (MOD13Q1), which represents the proxy of vegetation productivity excluding the growing season [53], and (2) “pre-monsoon productivity”, based on Landsat TM 4–5 satellite images (from 1988 to 2011), which represents the proxy of productivity of vegetation before the growing season. The previous analysis contributes to increase our understanding, regarding the importance riparian ecosystems, which could be key to maintain ecological processes at regional scales, even during drought periods.
By constructing a MODIS NDVI time series from 2001 to 2012, using the 16-day NDVI composite of the MODIS sensor (MOD13Q1), we obtained phenological parameters of the vegetation at the regional scale [53]. This allowed us to understand key functions of the ecosystems analyzed, such as photosynthetic activity [16], and also helped us to analyze and predict the responses of the vegetation to changes in meteorological and management variables [54]. In order to analyze long-term trends of the proxy represented by the basal productivity [53] of each of the coverage types in our study area, we excluded the productivity of the seasonally active vegetation (small integral) from the total productivity during the time of growth (large integral) [53].
An NDVI time series based on Landsat TM 4–5 satellite images (from 1988 to 2011) was also created. To accomplish this, we selected images taken prior to the summer monsoon for each year to analyze. The images were obtained from the Earth Explorer platform, managed by the United States Geological Survey [25] and chosen between March and April of each year. Two Landsat scenes were selected per year, due to the extent of our study area (Path 35-Row 39 and Path 35-Row 40). Once the images were obtained, information was extracted by coverage type that presented no changes over the period 1993–2011 [25].

2.3.2. Comparing Basal and Pre-Monsoon Productivity

Considering the hypothesis that the REAZ would be more productive than adjacent ecosystems, even in periods of the year where productivity is limited by the reduced availability of rainwater [1,2,3,6], it is important to determine annual differences in basal (MODIS 2001–2012) and pre-monsoon (Landsat 1993–2011) productivity values between riparian vegetation and the surrounding land cover types. We used a Kruskal–Wallis test, to analyze general differences between land cover types and to compare land cover using Dunn’s method [55]. The data used was MODIS and Landsat NDVI values of the pixels corresponding to each land cover type.
To assess land use change impact on RE productivity, we compared NDVI values representing the growing season (large integral of MODIS) in RE which remained unchanged over the 2002–2011 period, versus those that underwent changes and were substituted by other land cover type. We focused primarily in changes between riparian vegetation and agriculture and cultivated/induced grassland and vice versa. For this analysis, we used the large integral of MODIS corresponding to the year 2011 only, in order to ensure that all of the transitions between land cover classes were complete. The data obtained was analyzed using a Mann–Whitney U rank sum test, to determine possible differences between productivity of preserved RE and sections of the river that have undergone changes.

2.3.3. Trends on Basal and Pre-Monsoon Productivity

Knowledge of trends in productivity over time provides us with an indicator of an ecosystem’s condition facing climatic variations, and anthropogenic management [48,49,51]. Previous studies have documented the progressive decline of productivity in the riparian ecosystems of the upper San Pedro River in Arizona [49], and in extensive areas of mangrove in the southeastern coast of the Gulf of California in Sonora, Mexico [48]. Since our study is located between the two areas mentioned above, and to increase our understanding of ongoing processes on the region, we assess the temporal trends of the NDVI values per vegetation type, using a simple linear least squares regression analysis. Specifically, we analyze the proxies of a) productivity before the summer monsoon based on Landsat and b) basal productivity based on MODIS.

2.4. Temperature, Precipitation, Runoff and Water Depth Effects on Productivity Trends

To analyze the relationship between productivity trends for each land cover type and climatic variability, we obtained the temporal trends of (1) annual mean temperature, (2) mean temperature of spring–summer and autumn–winter, (3) annual accumulated precipitation, and (4) accumulated precipitation of spring–summer and autumn–winter. Climatic parameters for each region were obtained using daily records of three climatological stations from the National Meteorology Center [56], located within the ZR and five stations within the SMR [56]. Then, the climatic parameters from each station were averaged and grouped according to the region (Table 1). A simple regression analysis was conducted for each parameter in of the regions (ZR and SMR). We also used data from the hydrological station “El Cajón”, located on the course of the SMR [57] to observe annual accumulated runoff.
To test correlation between climatological and hydrological variability and productivity trends (MODIS and Landsat) of riparian vegetation and riparian mesquite, a Pearson product moment correlation analysis was performed.
Finally, we used spatial information regarding the distribution of water depth, as derived by Méndez-Estrella et al. [25], and the Landsat TM derived NDVI pre-monsoon for years 2007, 2008, 2009, and 2010 to perform a non-linear regression analysis, to assess riparian vegetation productivity as a function of water depth.

3. Results

3.1. Carbon Storage

3.1.1. Carbon Stocks and Allocation

Our findings show that the land cover types with greatest carbon storage in aerial biomass were riparian vegetation (33.5 TonC/ha), oak/oak–pine forest (11 TonC/ha), and riparian mesquite (4 TonC/ha). On the other hand, the land cover types storing the least carbon in their aerial tissue were: natural grassland, desert scrub, and cultivated grassland (prairies of buffel-grass) (with 2.85, 2.39 and 0.74 TonC/ha, respectively) (Table 2).
Results from our analysis suggests higher carbon storage for riparian and riparian-mesquite root systems, than in the rest of the land cover types analyzed. In contrast, land cover types such as annual agriculture and cultivated grassland exhibit a lower quantity of accumulated carbon in the roots (Table 2). In subtropical scrub cover it has been reported that root systems have low storage carbon capacity [39]. This is due to the fact that this vegetation type is distributed mainly on slopes and hills of medium elevation, where soils are shallow [44]. Other vegetation types such as mesquite woodland and desert scrub are associated to deeper soils [44], allowing them to develop greater root biomass systems. Other studies have reported that root systems are the structural components with the highest proportion in the total biomass of mesquite woodland and desert scrub [9,58], which acts to increase the estimations of carbon stored below the soil, even compared to other coverage with greater aerial biomass (e.g., forest) (Table 2).
According to our analysis, oak/oak–pine forest, riparian vegetation, and subtropical scrub present high values for soil organic carbon, while grasslands, mesquite woodland, and desert scrub present lower values. It should be noted that the quantity of carbon stored in the soil is up to three times greater than the carbon stock present in the aerial biomass of the vegetation [59].
Comprising the three carbon stocks mentioned before, riparian vegetation, oak/oak–pine forest and the riparian mesquite present the highest stocks of carbon per unit area in the region. Nevertheless, considering the coverage of each vegetation type, subtropical scrub, forest (oak/oak–pine), mesquite woodland, and even desert scrub constitute a greater total storage of carbon compared to the riparian vegetation when considering the entire study area (Table 3).

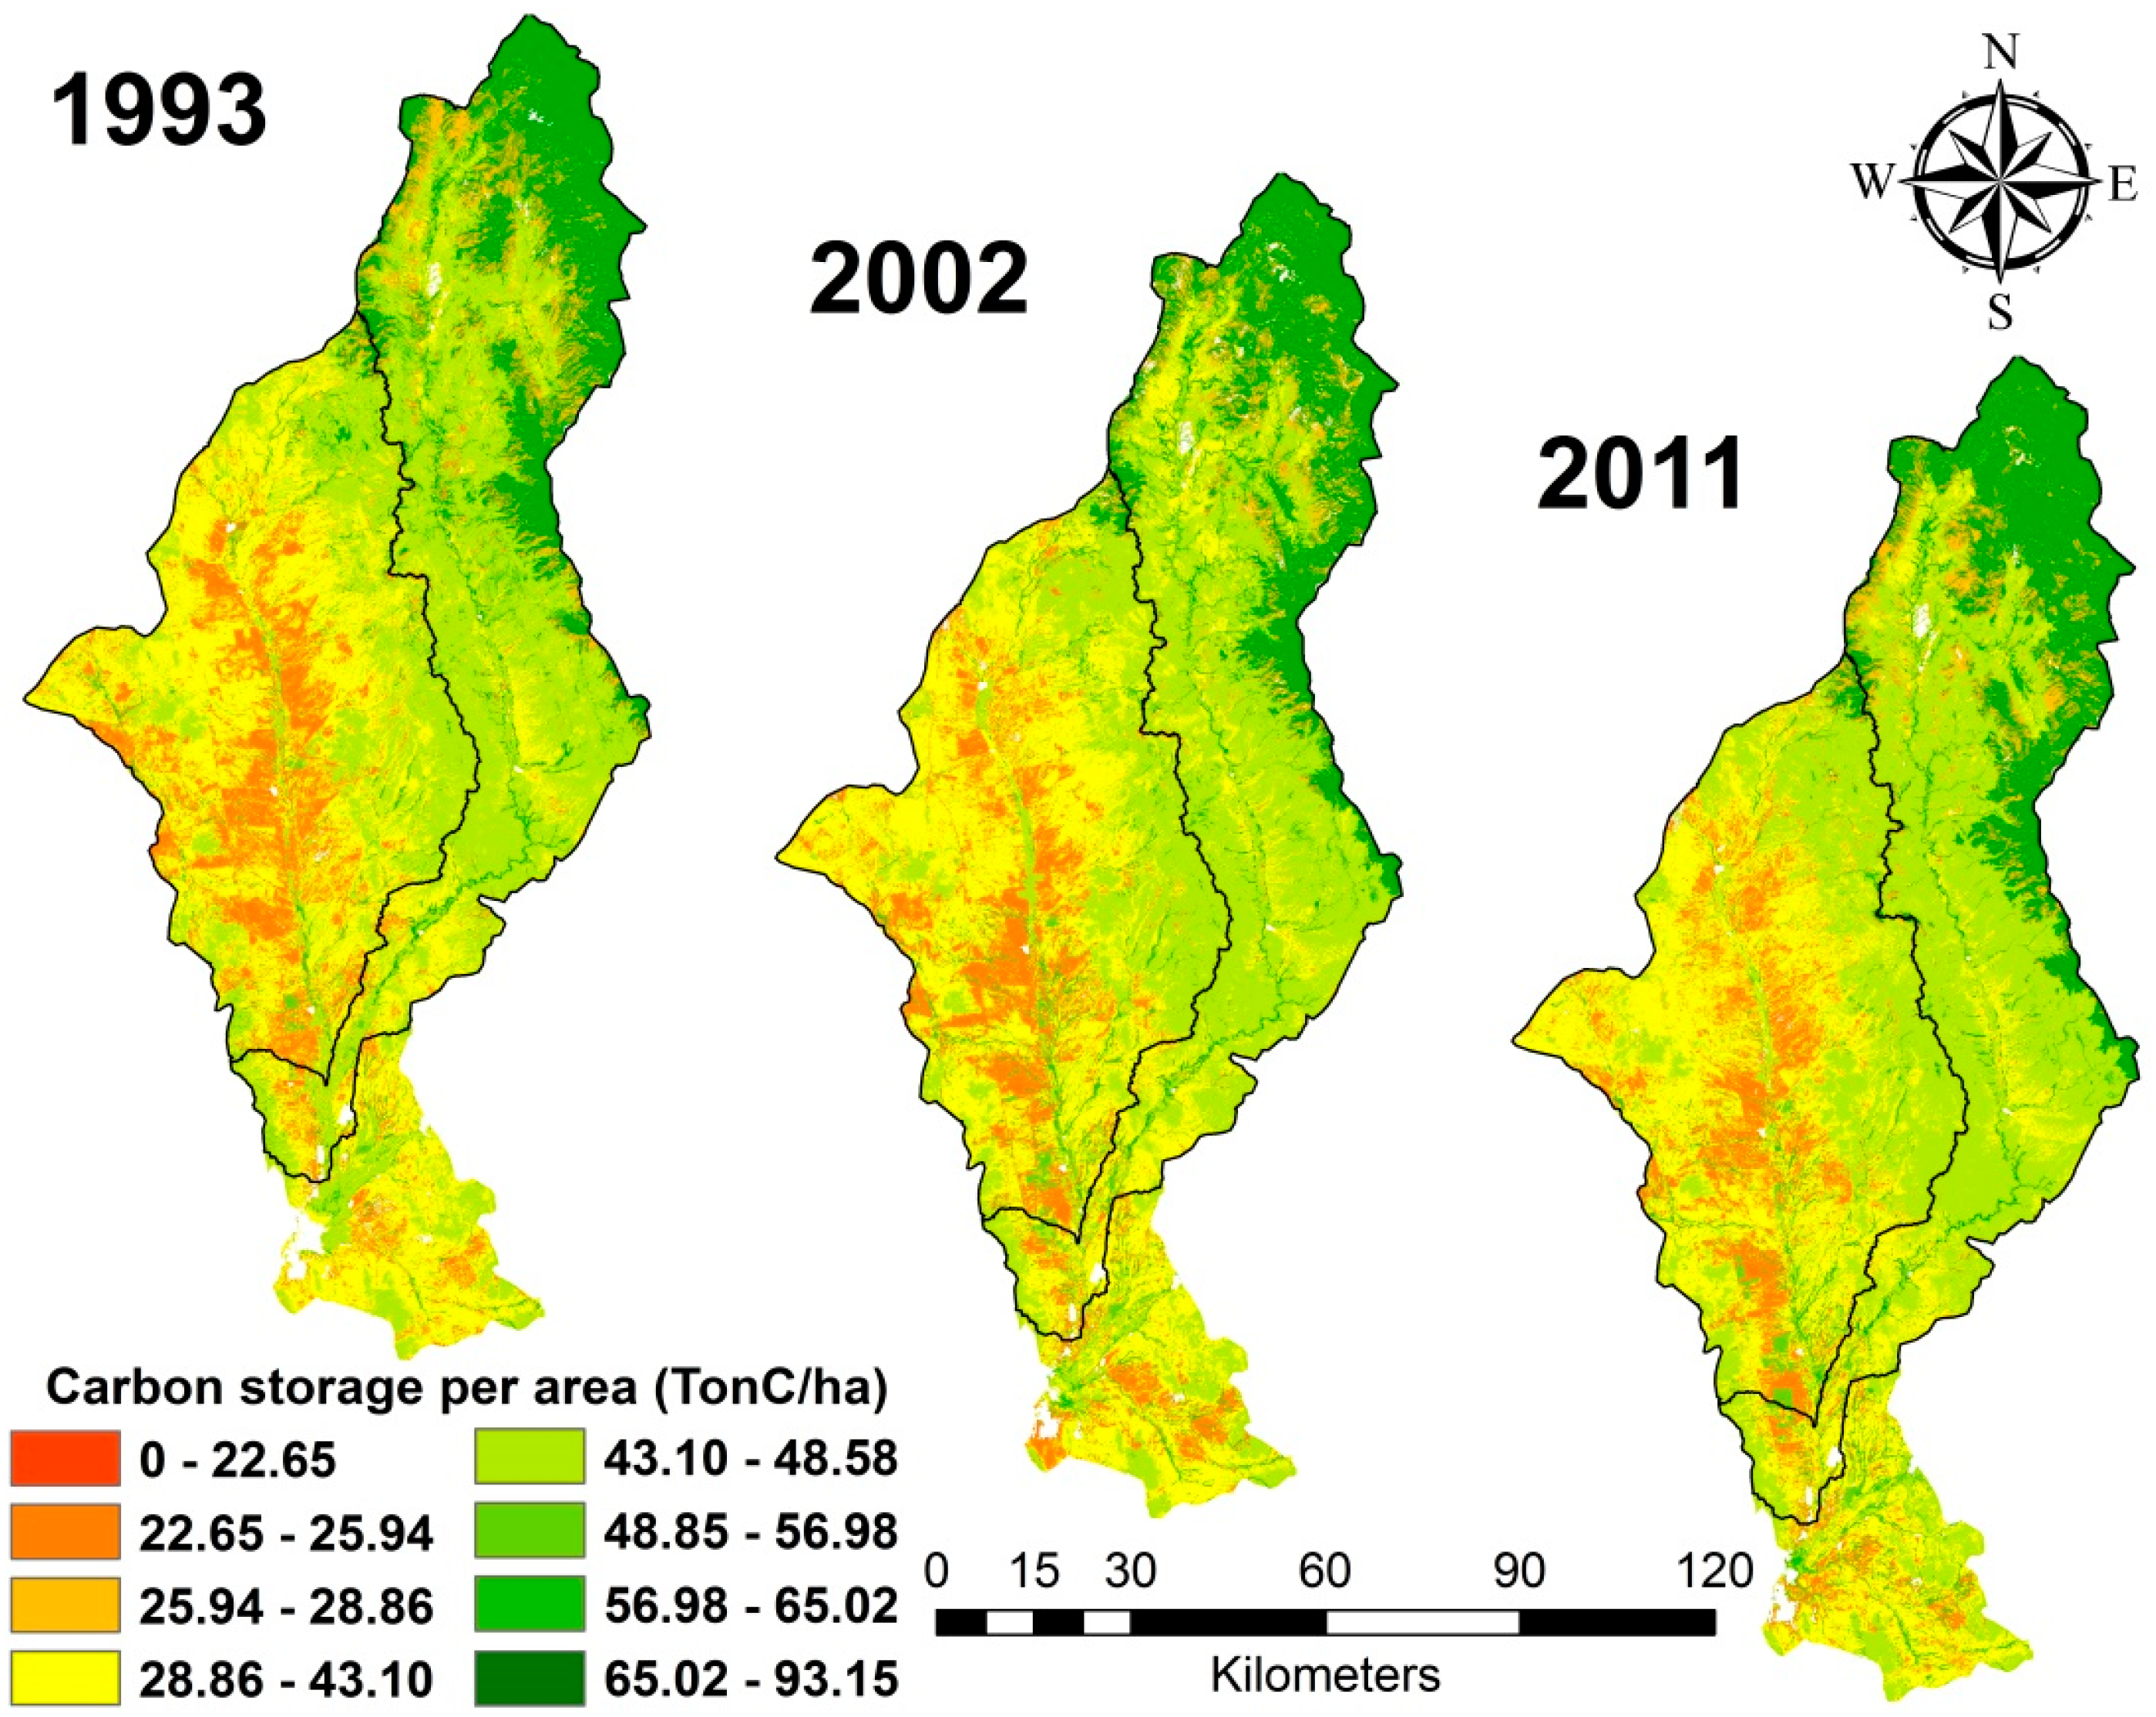
3.1.2. Spatial Distribution of the Carbon Storage

Land cover types with a greater carbon storage capacity are distributed in the mid- and northern sections of the SMR. For most of this area, our carbon storage estimations vary between roughly 48 and 93 TonC/ha, with minimum values of 22.75 TonC/ha in areas covered by cultivated/induced grassland. The ZR region presents carbon storage values between 0 and 22 TonC/ha in sites with cultivated or induced grasslands, and up to values between 48.064 to 57.245 TonC/ha, in the areas with subtropical scrub, perennial agriculture and riparian mesquite (Figure 2 and Figure 3).

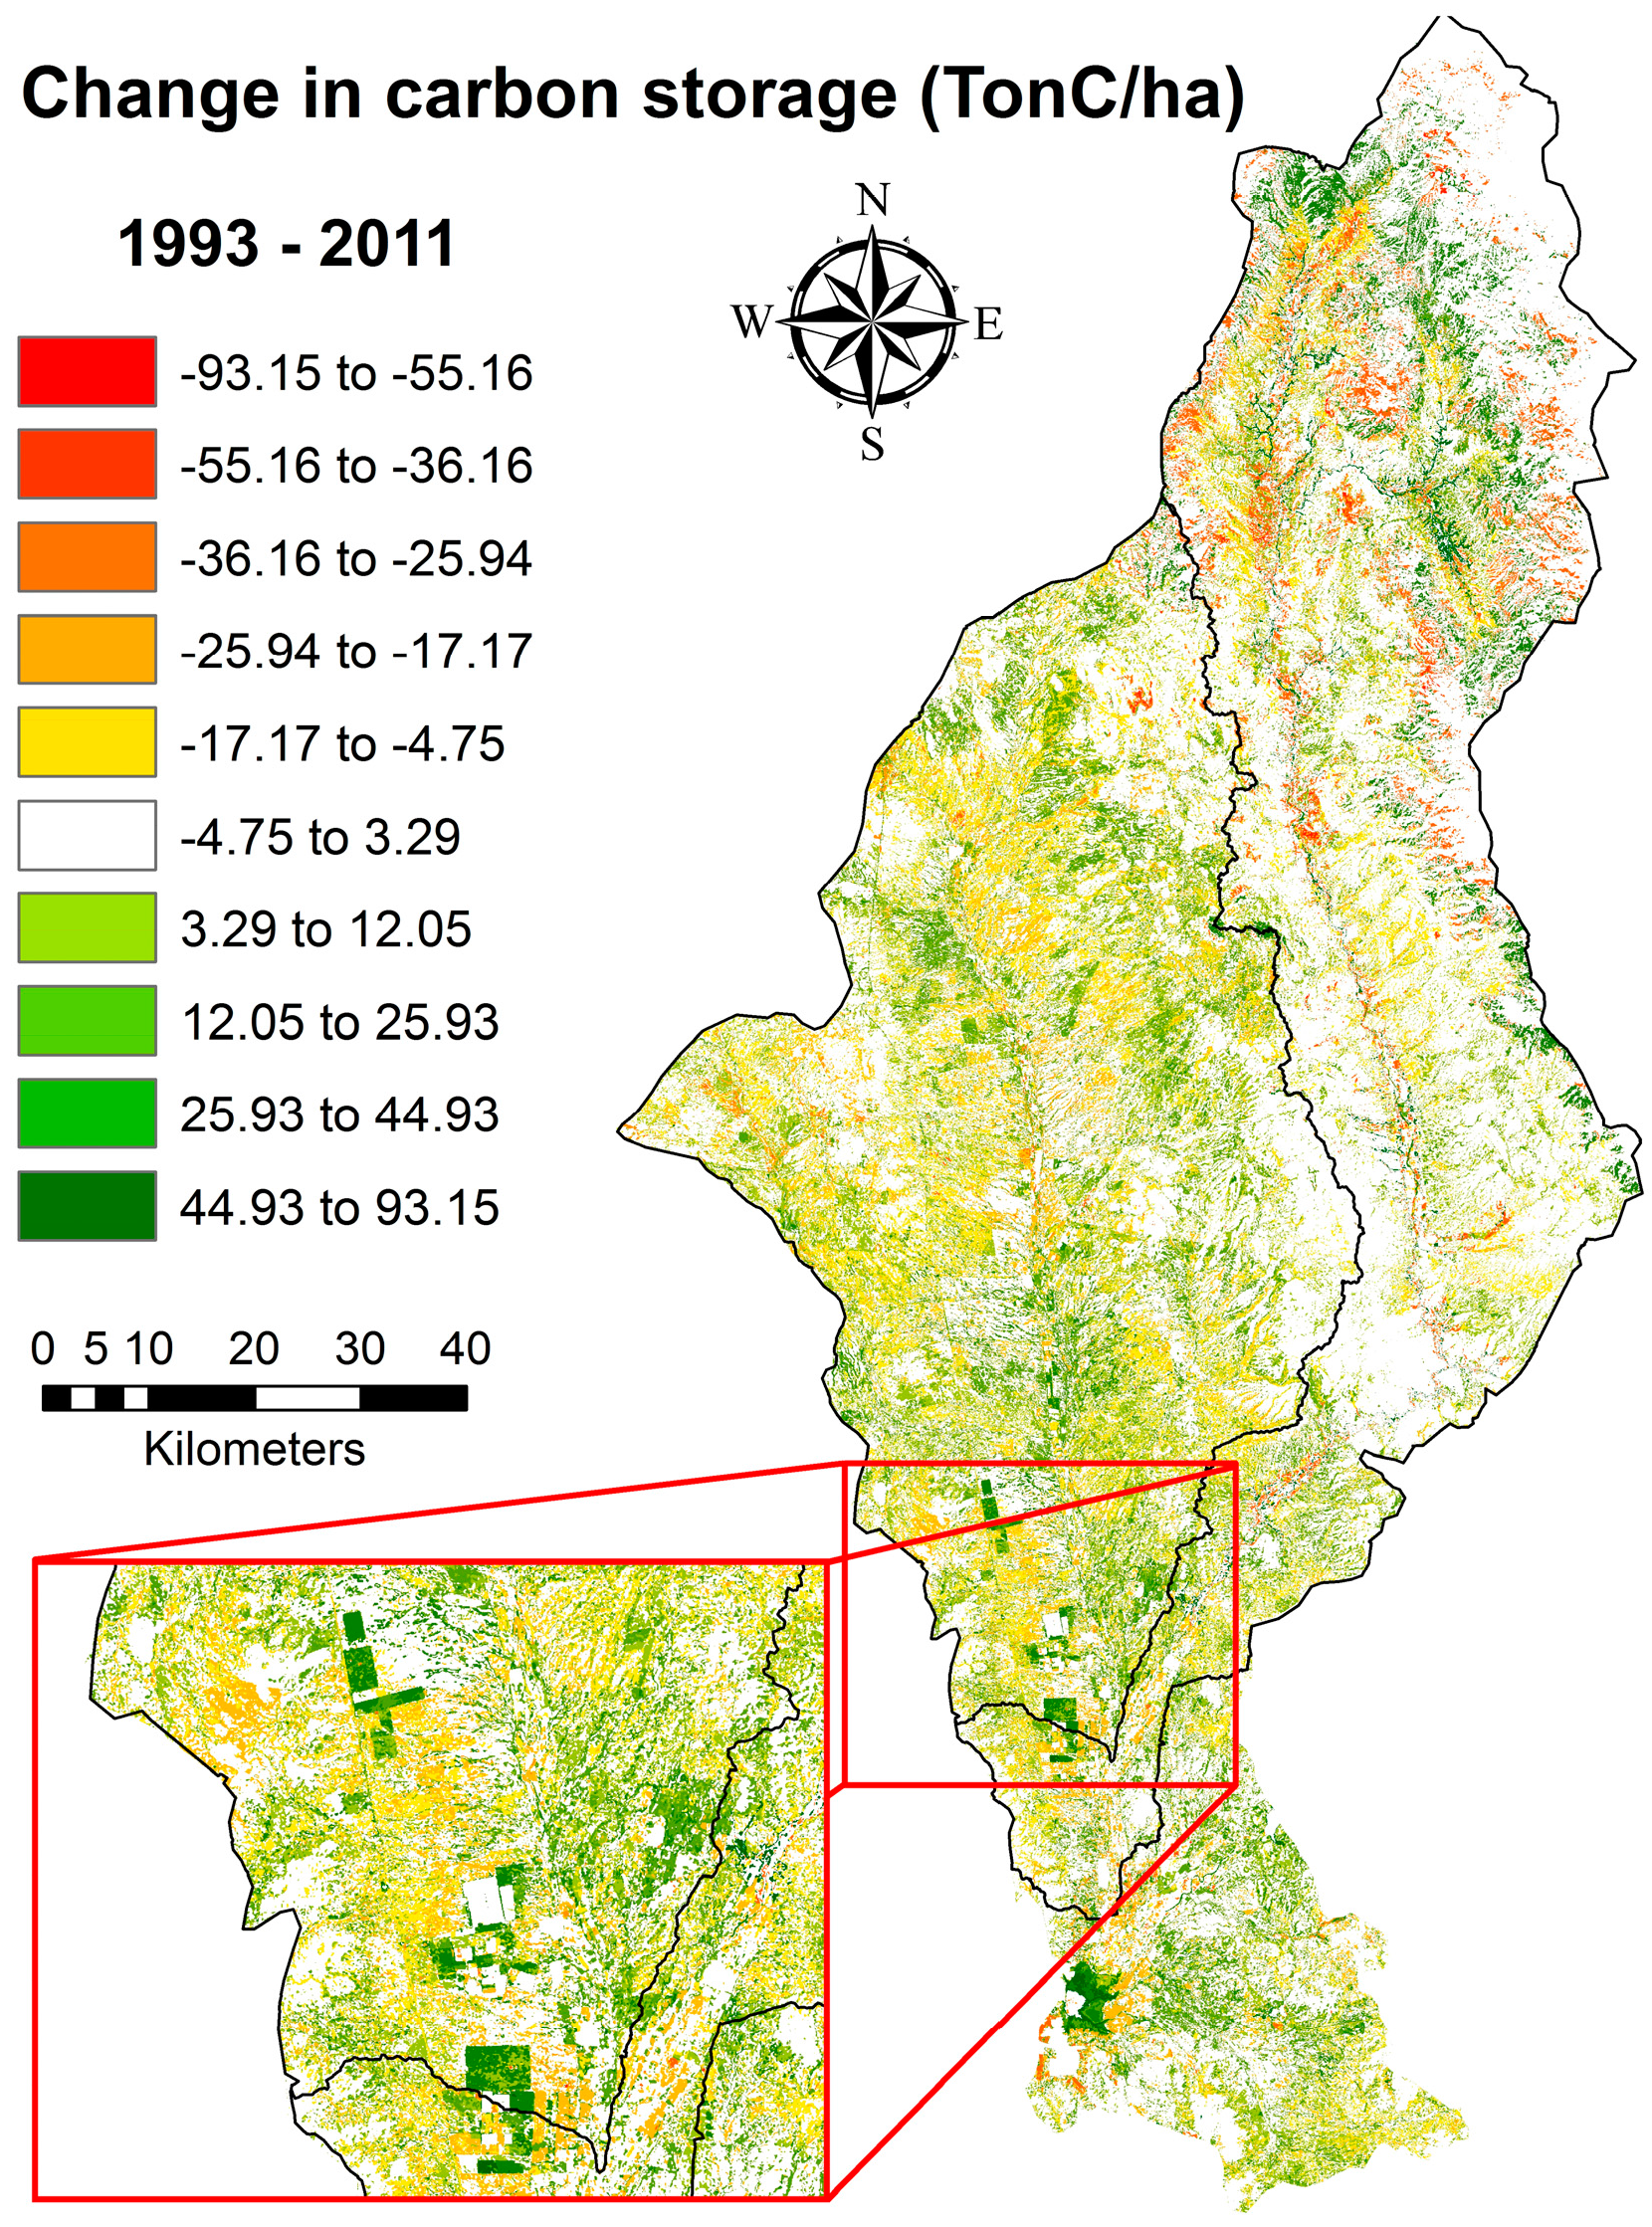
3.1.3. Spatiotemporal Changes in Carbon Storage

Our results describe how spatial and temporal changes in the land cover reflect changes in carbon storage. Figure 4 shows the effect of the spatial change on the carbon stock, derived from exchanges among the landscape components in the period 1993–2011.
For the ZR, the reduction in carbon storage is related to agricultural area loss, substituted by classes such as desert scrub, mesquite woodland, and cultivated grassland, this change represents a decrease of between 4.491 and 20.401 TonC/ha. It should be noted that the agricultural biomass (mainly comprising annual crops) is constantly harvested, unlike the natural vegetation where carbon, although present in lower quantity, is stored for longer time periods. Likewise, the establishment of new prairies of buffel-grass in sites of natural vegetation, such as desert scrub and mesquite woodland represents a reduction in carbon storage of 6.175 and 15.91 TonC/ha, respectively.
On the other hand, changes related to riparian mesquite reestablishment as a consequence of agricultural field abandonment, lead to an increase of 14.09 TonC/ha in stored carbon (Figure 4). Establishment of perennial crops (such as grape, orange, and walnut) in sites of induced grasslands, mesquite woodland, or desert scrub, represents an increase in carbon storage of between 10.186 and 26.096 TonC/ha. The loss of cultivated grasslands and their substitution with mesquite and desert scrub represents a possible increase of 6.175 and 15.91 TonC/ha, respectively (Table 2).
Changes arising from the loss of land cover of anthropogenic origin and its substitution with “natural” vegetation have already been reported in another study [60], in which a relationship was found between the abandonment of agricultural fields on the peri-urban areas and the re-assignation of water from agricultural to exclusively urban use.
Areas presenting the greatest reduction in carbon storage were those where riparian vegetation was lost, in a conversion to bare soil or to seasonal agriculture (decrease of between 44.197 and 49.992 TonC/ha). In contrast, areas with possible gains in carbon of up to 38.797 TonC/ha were also detected (Table 2 and Figure 2 and Figure 3). Overall, change from riparian vegetation to bare soil and agriculture was 1987 and 220 ha, respectively. The previous represents a total carbon loss of 109,095 tons for our study area.

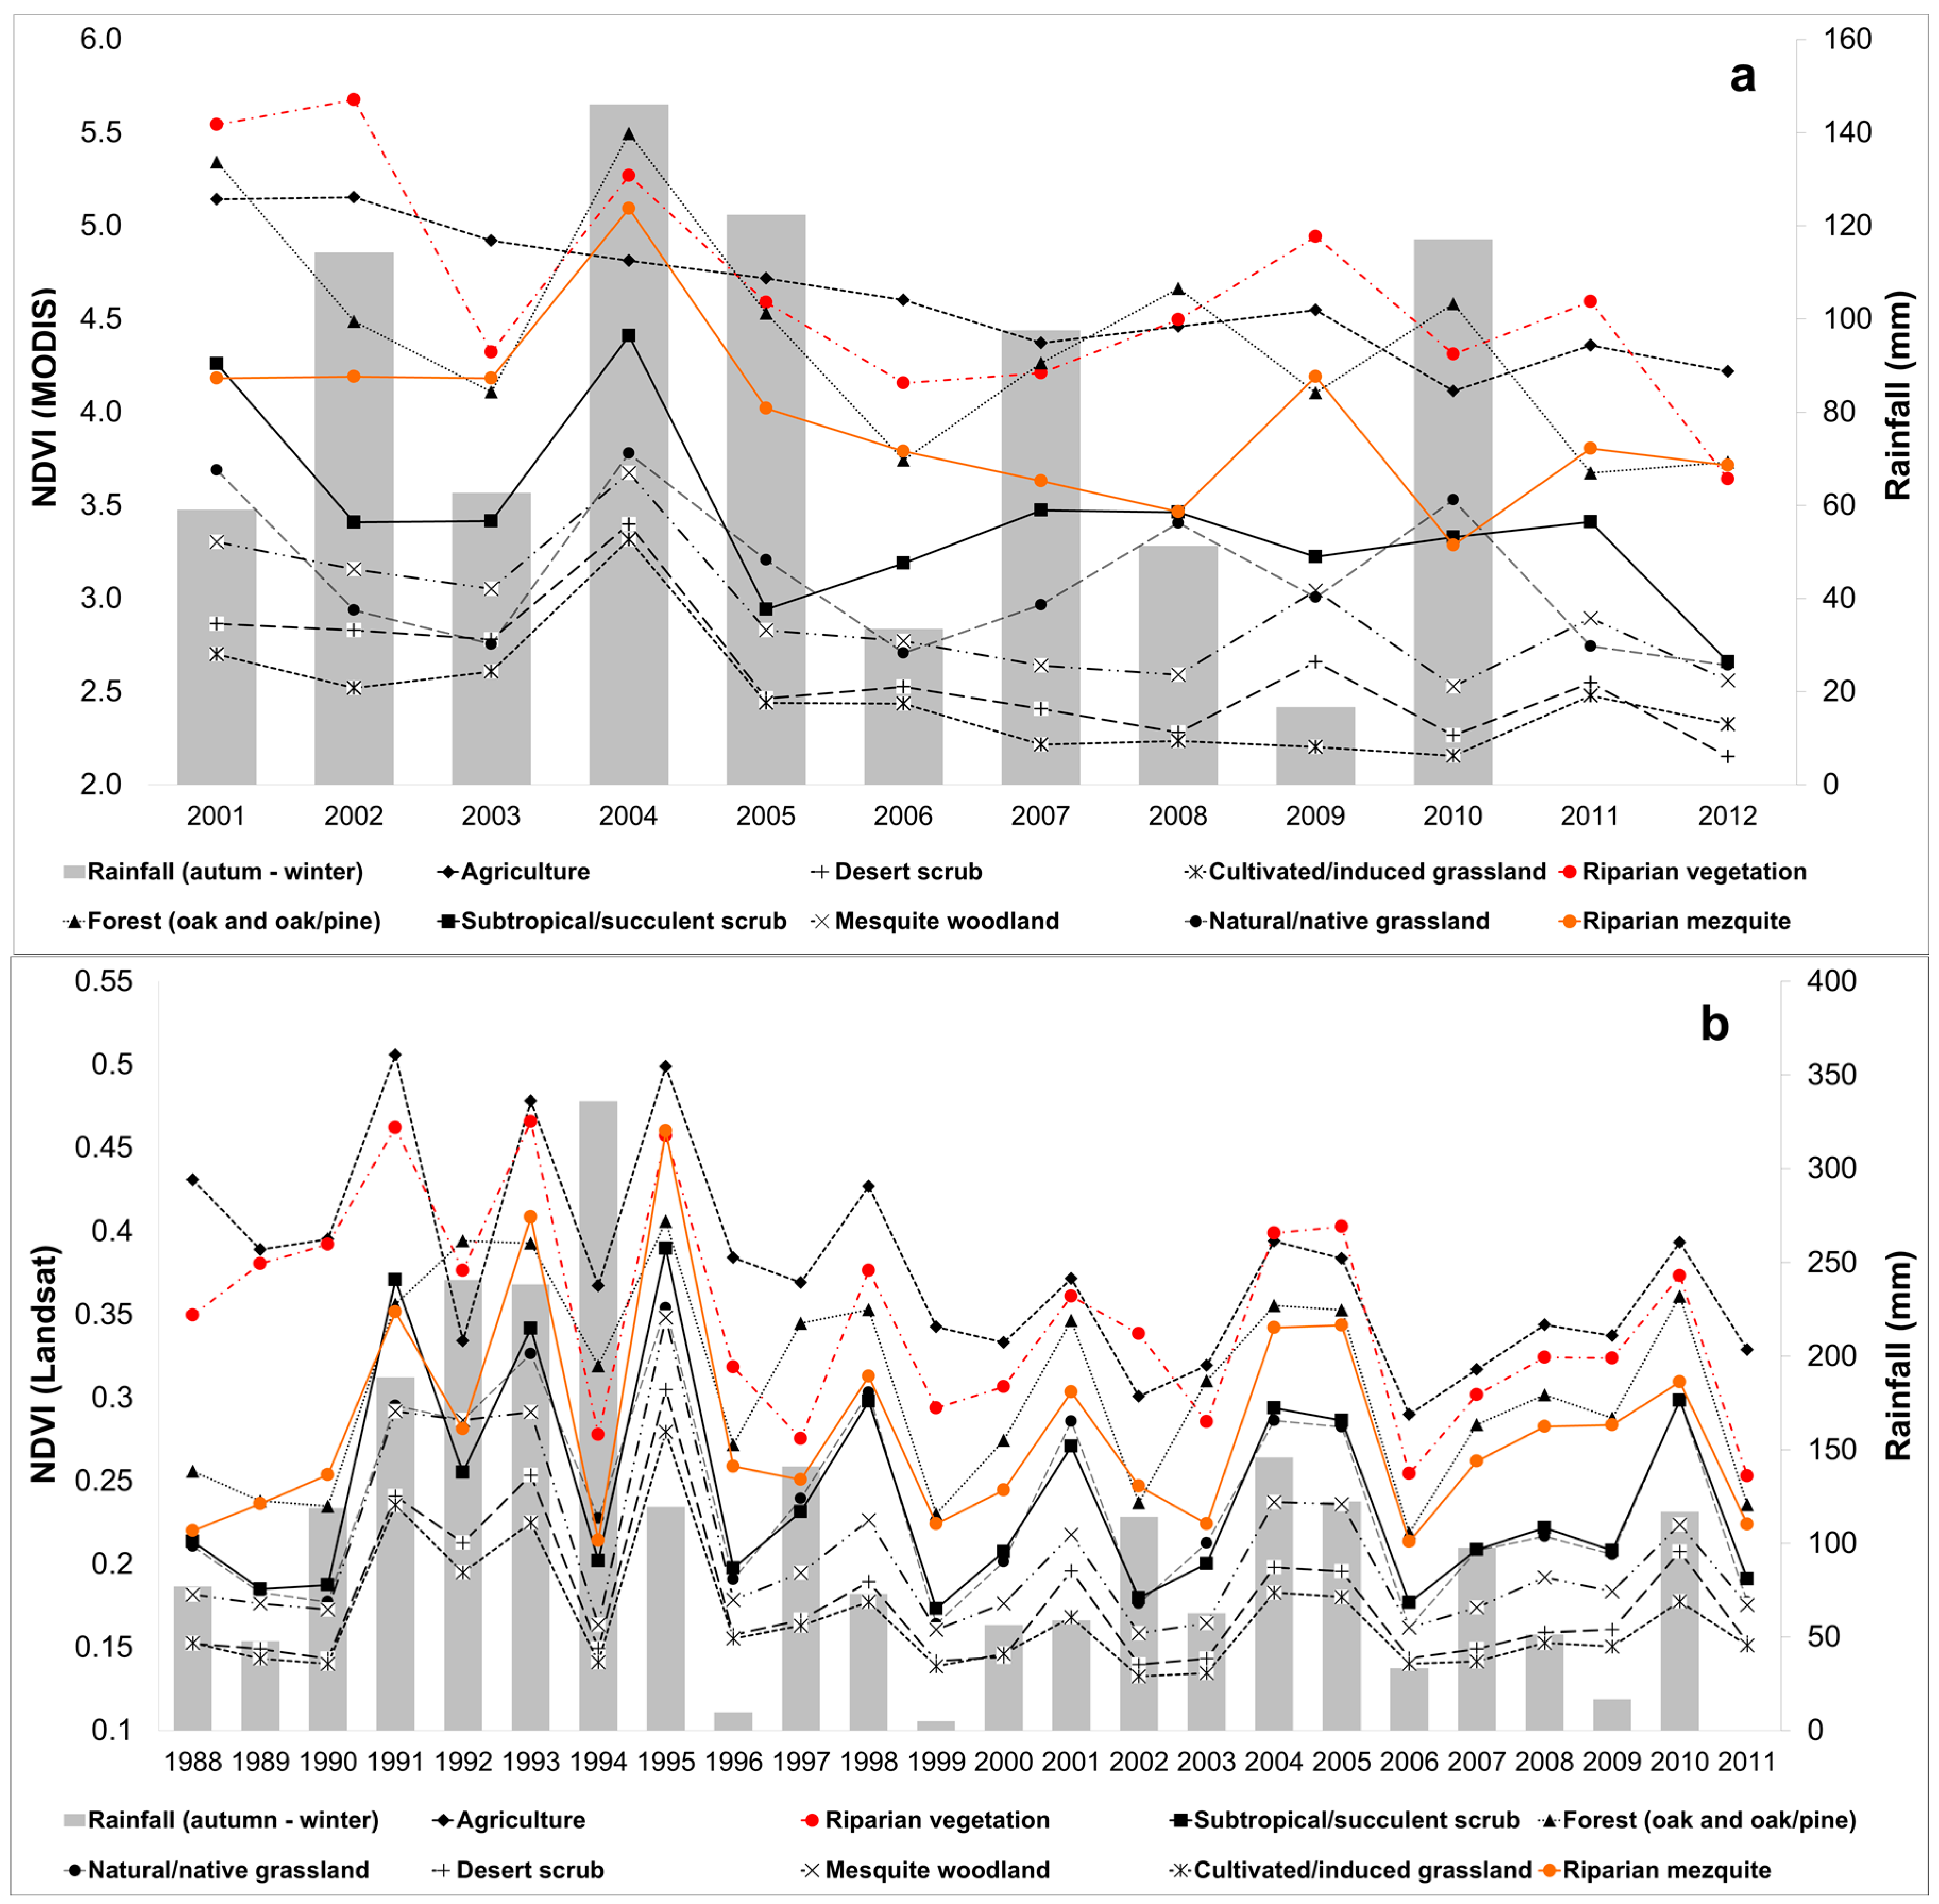
3.2. Differences in Productivity per Land Cover Type

We analyzed differences between productivity proxies for each land cover type to understand the relative importance of each ecosystem in function of its contribution to regional productivity. The results of multiple comparisons by treatment pairs procedure (using the Dunn’s method), show that basal productivity (large integral minus small integral) of the riparian vegetation is equal to, or greater than, that of oak/oak–pine forest for years 2002, 2006, 2009, and 2011, and agriculture for 2001, 2002, 2004, 2009, 2010, and 2011 (Table 4, Figure 5a).
For riparian mesquite, annual basal productivity during the period of analysis was generally lower than that of agriculture and riparian. When compared to oak/oak–pine forest, the riparian mesquite also exhibited lower basal productivity except during years 2003, 2006, 2009, 2011, and 2012 (no statistical differences during this years) (Table 4, Figure 5a). Annual basal productivity of riparian mesquite were consistently higher than those of natural grassland, mesquite woodland, desert scrub, and cultivated grassland (Table 4 with p < 0.05 and Q values > 4, Figure 5a) and the subtropical scrub, except in the latter for 2001, 2008, and 2010 (Table 4, Figure 5a).
Regarding the Landsat time series of pre-monsoon productivity, the results support those observed using MODIS–NDVI time series, since the riparian vegetation is among the three most productive types of land cover, together with agriculture and the oak/oak–pine forest (Figure 5b). Likewise, the riparian mesquite presents values (proxy of productivity) greater than those land cover types associated to more arid conditions, such as desert scrub, cultivated/induced grassland, and mesquite woodland (Figure 2 and Figure 5b). It is important to observe that in years in which lower autumn–winter precipitation is recorded (1988, 1989, 1996, 1999, 2000, 2006, and 2009), there are increased differences in the proxies of productivity of the riparian vegetation and agriculture, compared to the other land cover types (Figure 5b). This is due to the fact that these two land cover types are less dependent on precipitation than the others present in the study area.

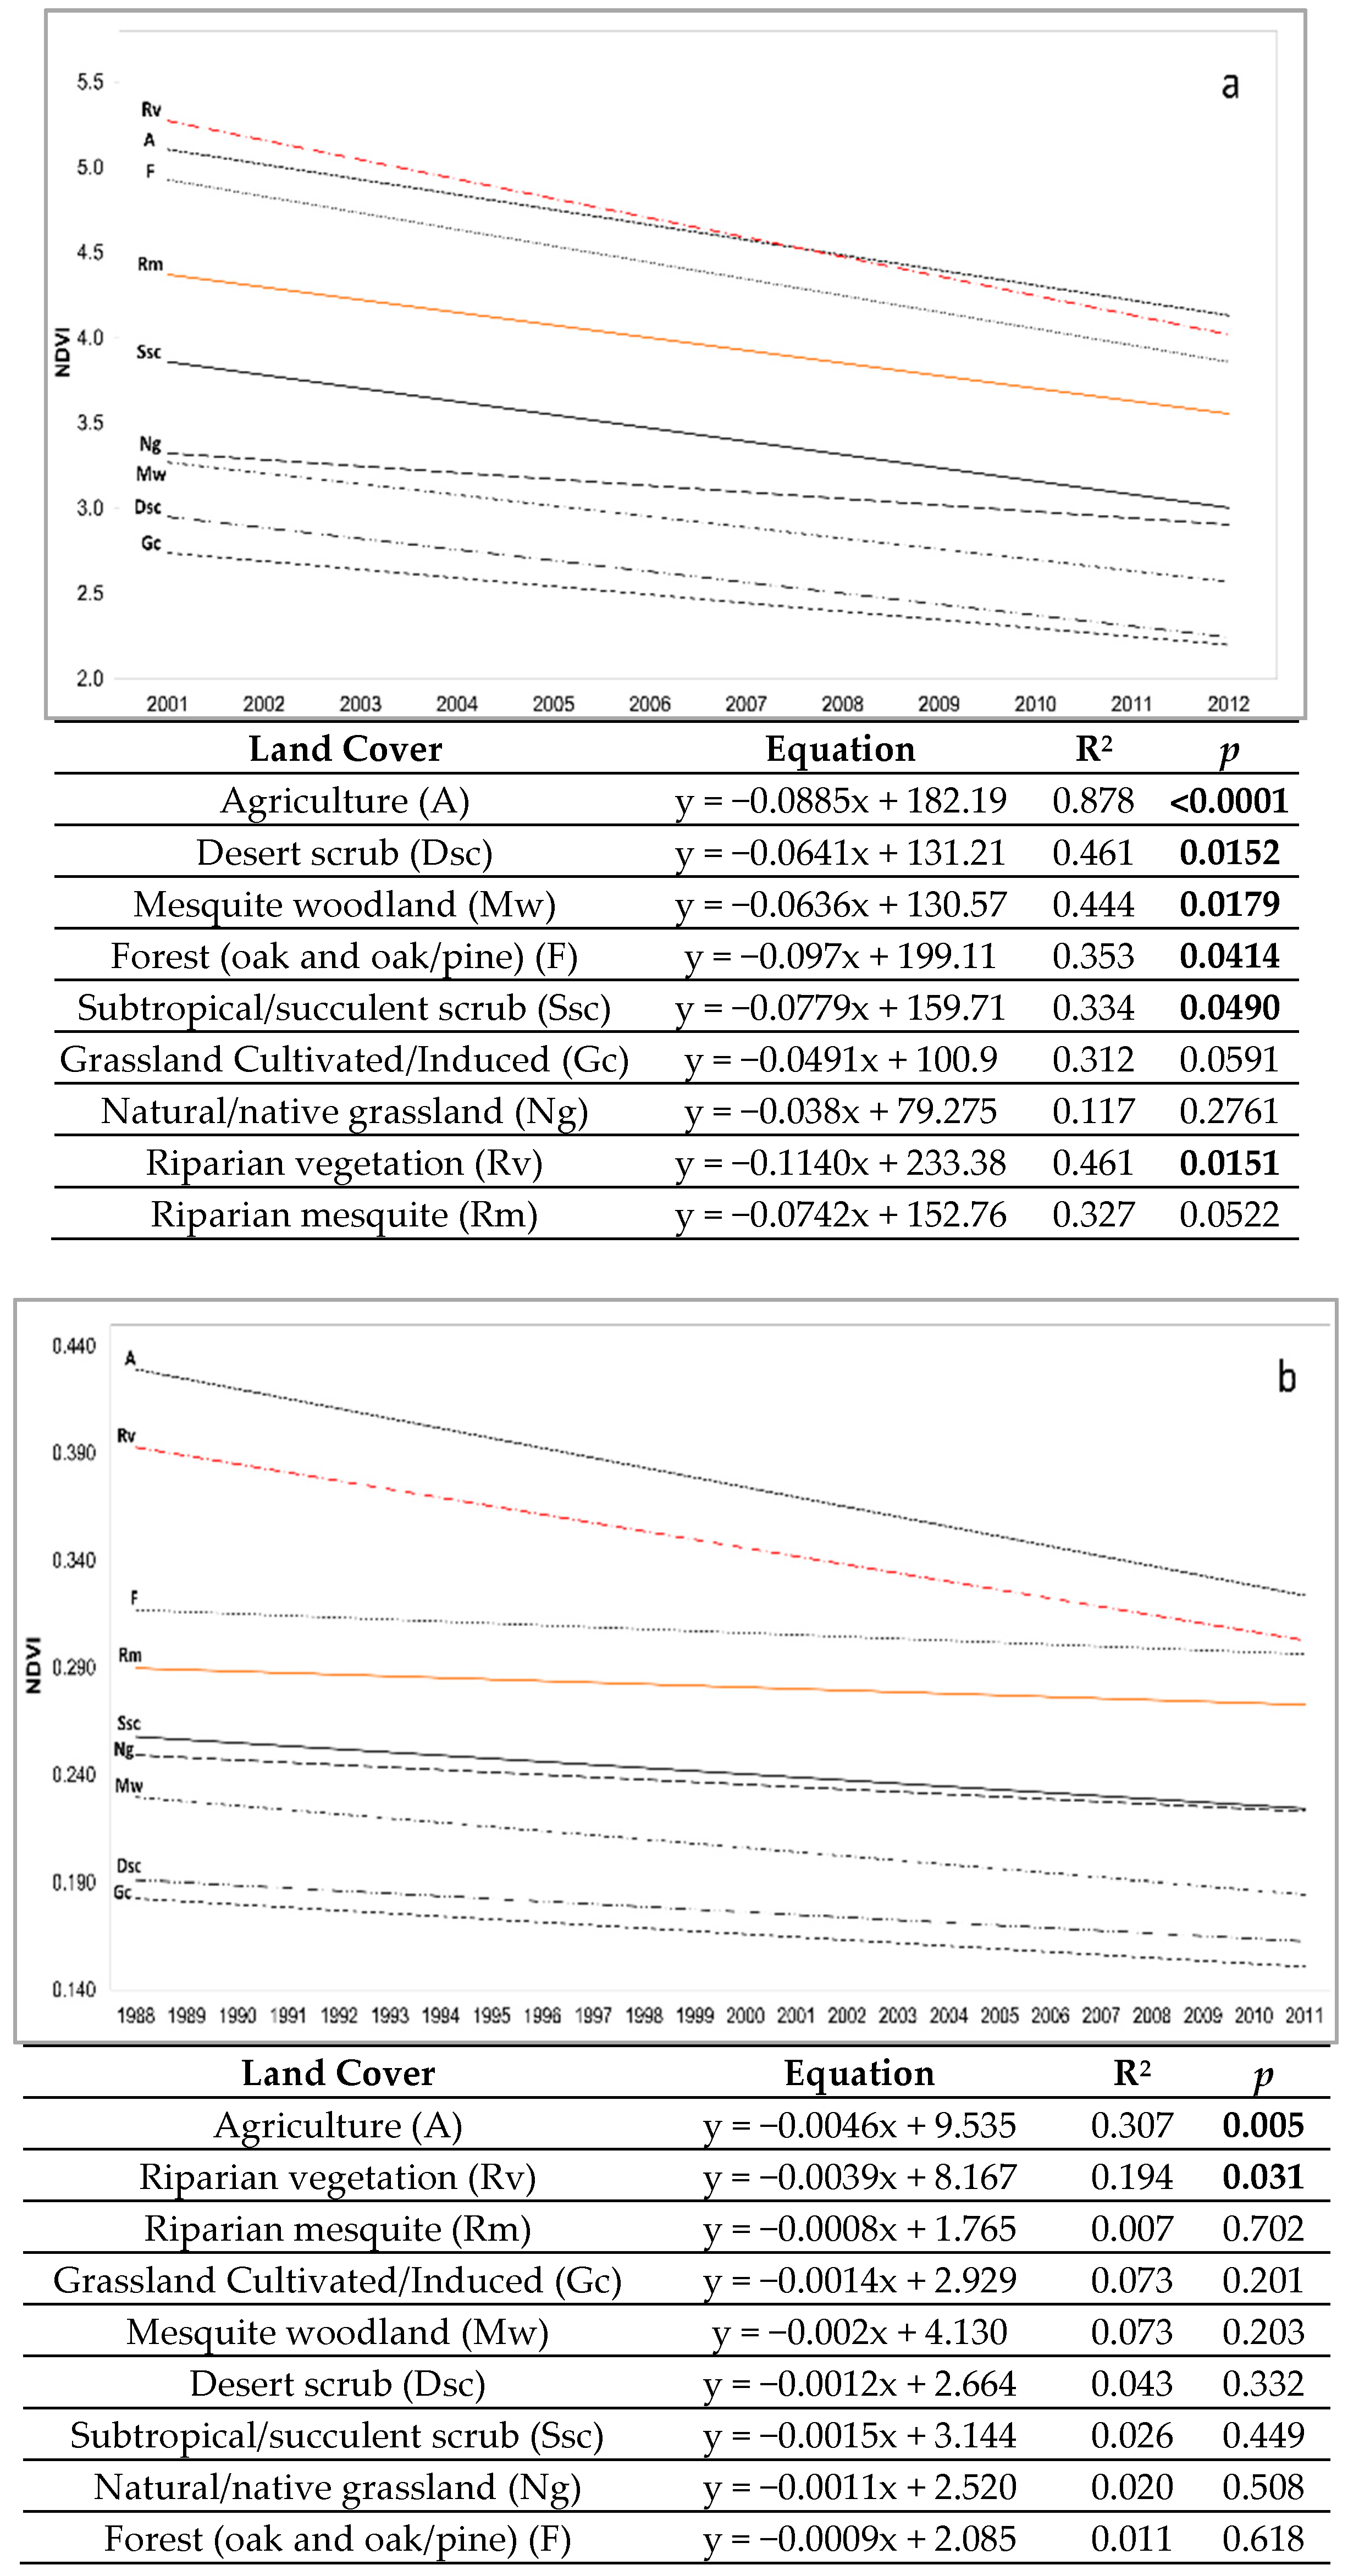
3.3. Trends in productivity

The NDVI time series, using MODIS (basal productivity 2001–2012) and Landsat (pre-monsoon productivity 1993–2011), shows a general negative trend in all land cover types in our study area (Figure 6). The MODIS data indicate that the observed trend is significant for six of the nine land cover types analyzed, with the exception of the natural grassland, cultivated grassland, and riparian mesquite (Figure 6a). However, the results show that the regression based on the NDVI of Landsat was only statistically significant for agriculture and riparian vegetation, suggesting a gradual decrease in NDVI values (Figure 6b). The greater temporal resolution of the observations made with MODIS provides us continuous information pertaining to the basal productivity of the different ecosystems, while Landsat represents, in this case, the productivity specific to a moment prior to the growth season which, in this region, generally coincides with the summer monsoon [61].

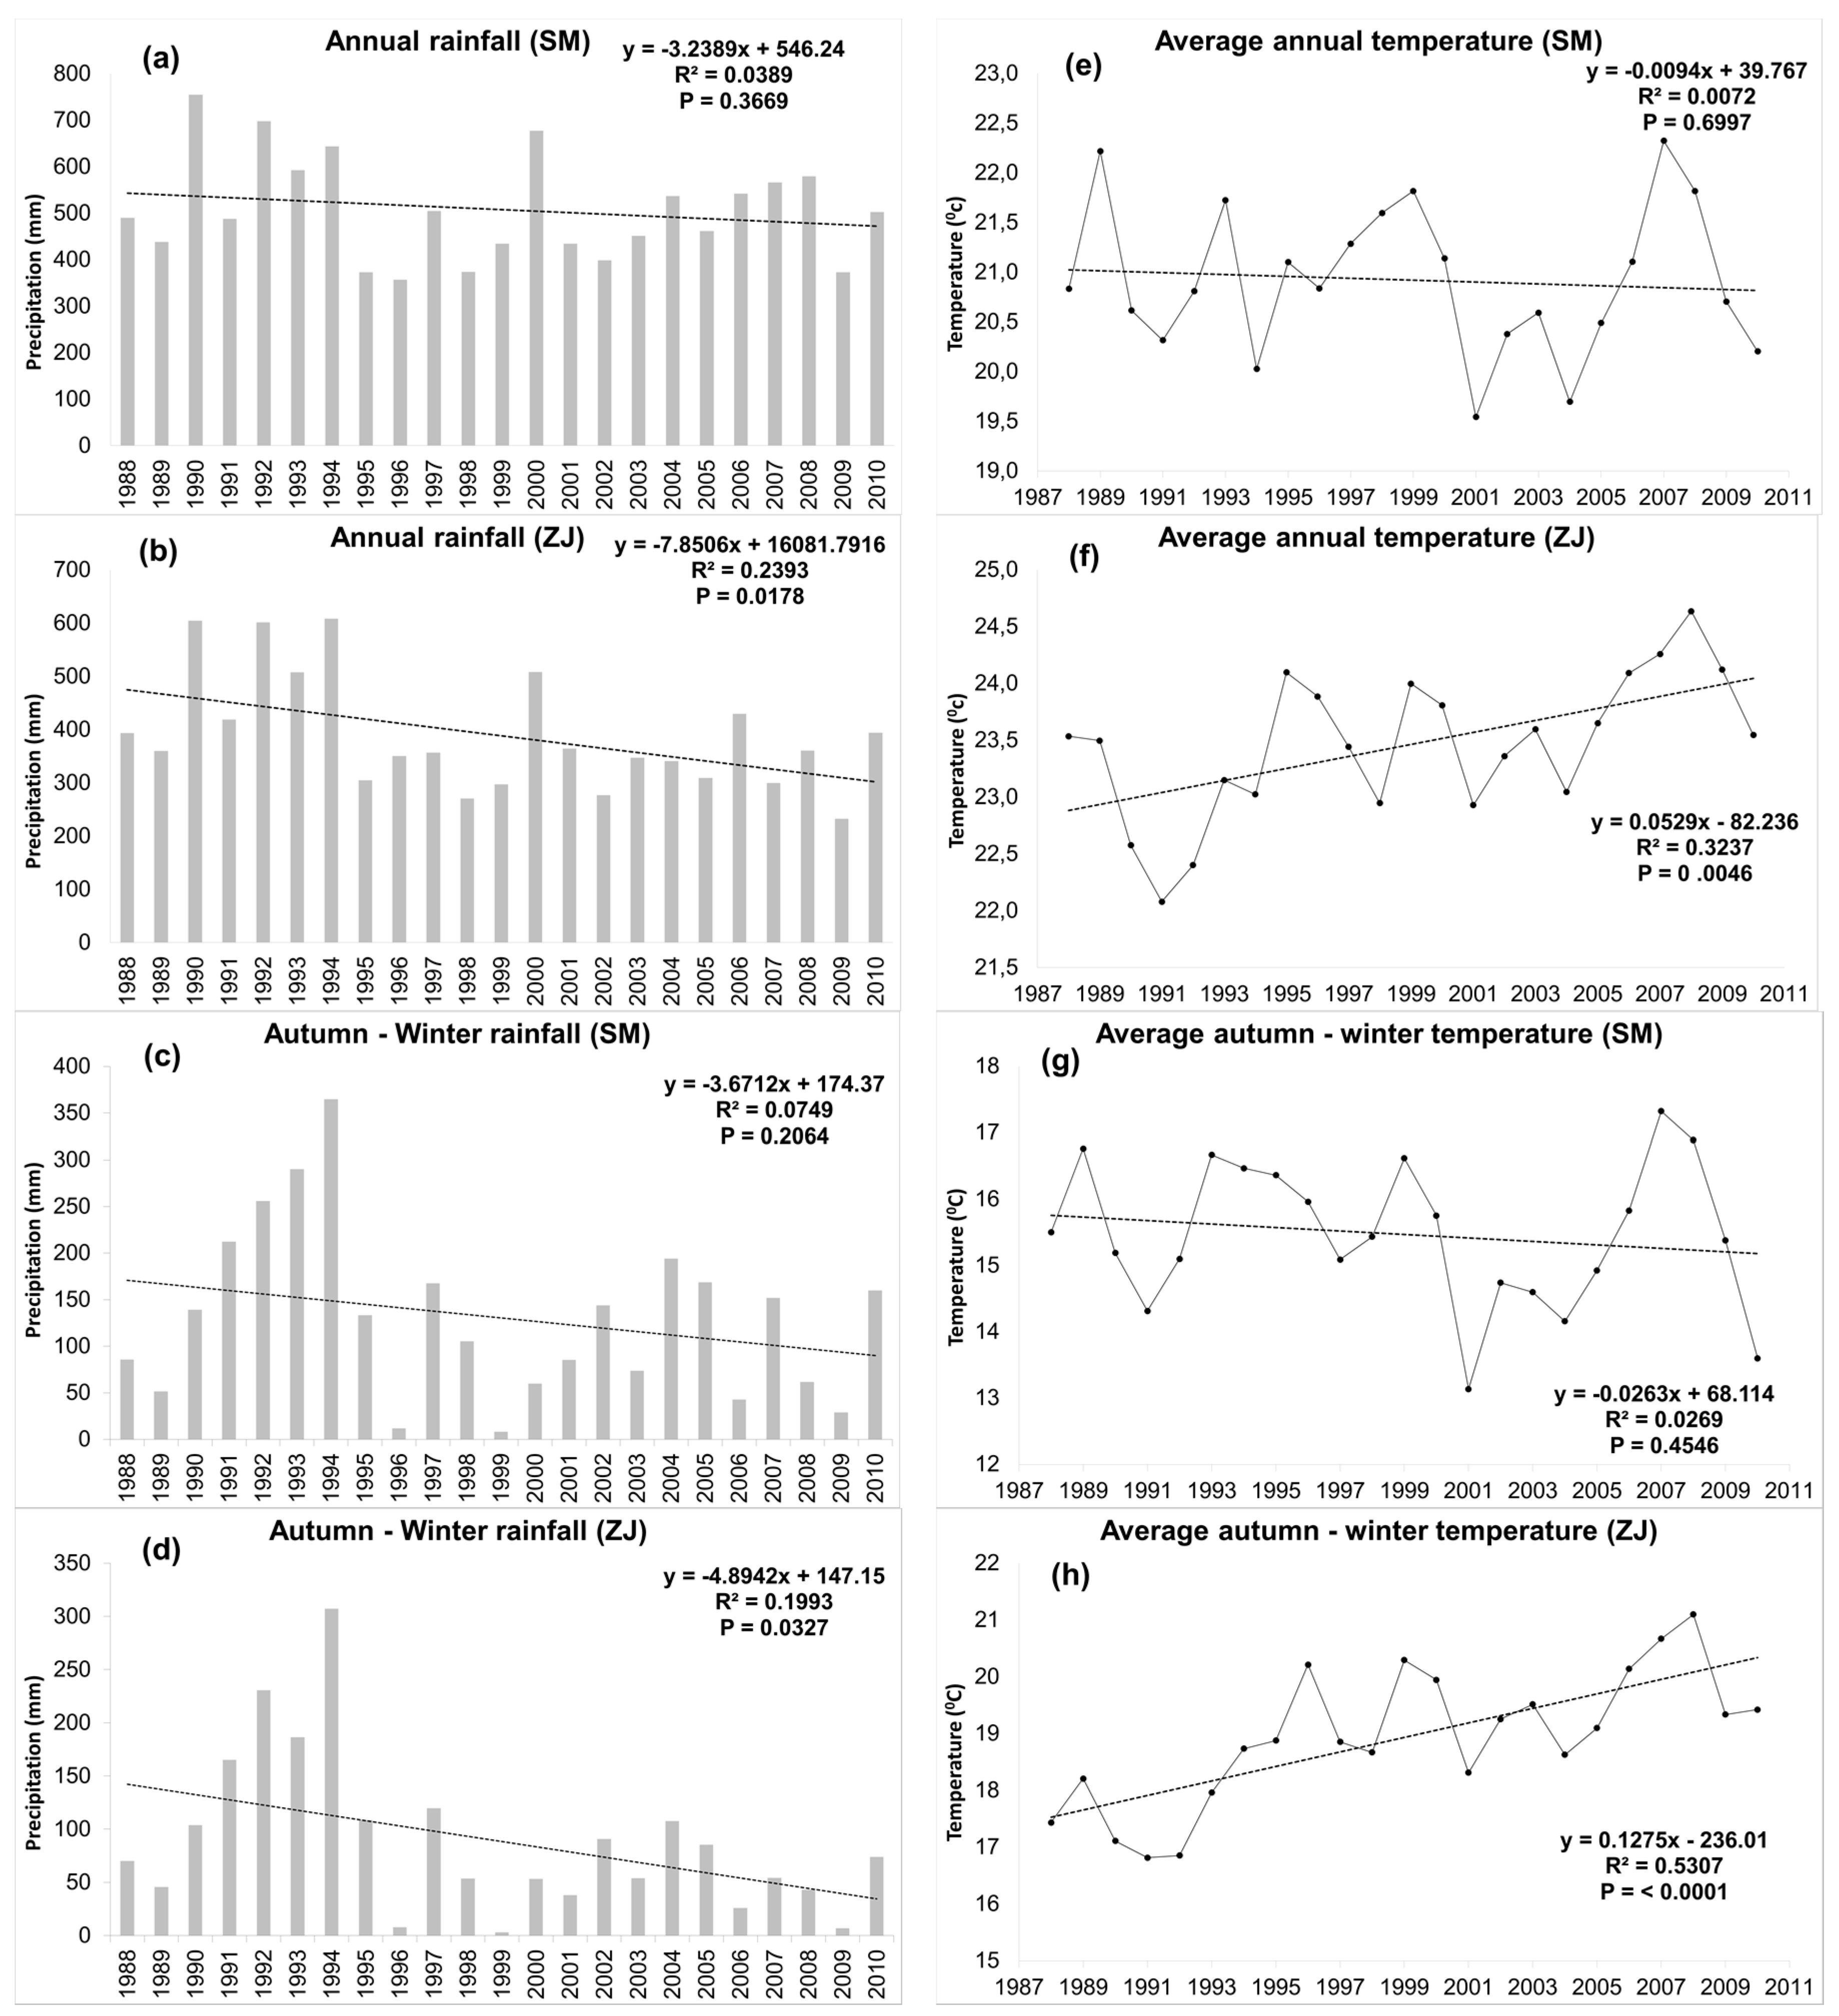
3.4. Decrease in Productivity and Its Possible Causes

In this study, we found a decreasing trend in annual accumulated precipitation across the entire study area, but this was only statistically significant in the ZR region (simple linear regression, p = 0.0178). Likewise, the increase in annual mean temperature was only statistically significant for the ZR region (simple linear regression, p = 0.0046) (Figure 7b,f).
For the ZR region, which presents greater aridity than the SMR, the decrease in autumn–winter precipitation and the increase in temperature over the same period of the year were significant (simple linear regression, p < 0.05) (Figure 7d,h). This increase in air temperature, and precipitation reduction (Figure 7), have generated drought conditions repeatedly reported for the region (in the period between 1995 and 2011) [56,62] and could affect the productivity of all land cover types present in the region. On the other hand, while the reduction in precipitation was not significant for the SMR region (Figure 7a,c), the high exploitation of ground and surface water for sustaining agricultural and livestock production activities [28] could explain the reduction of surface runoff in the region [62], which could also be related to the decrease in productivity of the RE [49].
Despite the trends towards decreasing precipitation and increasing temperatures (mostly for the ZR), a significant correlation was only found between the decrease in the basal productivity of the riparian vegetation distributed in the SMR and an increase in the annual average temperature (Simple Linear Regression, p = 0.0468, Table 5). Likewise, for the riparian mesquite in the ZR region, there is a significant correlation between the decrease in basal productivity and the increase in average temperature of the autumn–winter period (simple linear regression, p = 0.0362, Table 6).
Agriculture, urban development, and livestock production are activities exerting great pressure on RE, since they use large quantities of ground and surface water. Ground water is obtained from wells and “norias” (shallow wells that do not reach the aquifer), while much of the surface water is obtained from water reservoirs known regionally as “represos”, or dams.
Analyzing the spatial relationship between the static levels of water and the proxy of the pre-monsoon productivity (derived from Landsat images) of the riparian vegetation for different years of the study period, we observe that NDVI values exhibits an exponential decline with increasing water table depth (Figure 8). From this result, we can also observe that, after exceeding a threshold in the water table of approximately 10 to 12 m, photosynthetic activity declines considerably (Figure 8). In the SMR and ZR regions, close to 52% of the RE are located in areas with a water depth of between 1 and 12 m (according to previous studies) [25], the rest of the area is found at depths above this threshold (these sites might undergo functional and structural changes).

3.5. Productivity in Sites with Changes in Land Cover

The main changes undergone by riparian vegetation and riparian mesquite land cover types in the ZR and SMR are their conversion to agricultural areas or grasslands [25]. In addition to a reduction in carbon storage (Table 2, Figure 4), substitution of riparian vegetation and riparian mesquite for other land cover types often results in a decrease in productivity.
Based on the results of a Mann–Whitney U rank sum test, in places where riparian vegetation has changed to agriculture, we were able to observe a significant decrease in productivity when the conversion occurs (p < 0.001, Mann–Whitney U statistic = 8480.5). Nevertheless, riparian areas that changed to agriculture have high NDVI values, depending on the crop type and the time of the year (perennial and annual crops during their productive cycle). Most of time, the opening of new agricultural fields implies the removal of natural vegetation and its substitution by annual or perennial crops, which for this semi-arid region of Mexico represents a decrease in productivity.
Abandonment of agricultural fields has been documented in this region [60]; the fields had been occupied mainly by riparian mesquite [25]. Contrary to our expectations, this change also results in a decreasing productivity (p = 0.006, Mann–Whitney U statistic = 5438), which can be explained by the loss of vegetal coverage in the early stages of the replacement of agriculture by riparian vegetation (Figure 9b). Additionally, it is worth noting that new mesquite woodlands often present low values of foliar area.
Finally, changes from riparian vegetation to cultivated grasslands and vice versa also represent drastic changes in NDVI (Figure 9c,d). Substitution of RE for prairies of buffel-grass has been a common practice, above all in the region of ZR [63]. In sites where these changes have been presented, a significant reduction in the values of NDVI is observed (p < 0.001, Mann–Whitney U statistic = 2379; Figure 9c). The change from cultivated grassland to riparian vegetation has also been reported, and has been explained from the perspective of the resilience of RE, since “it appears the conditions for the growth and maintenance of the prairies are not adequate to definitively substitute riparian vegetation, and for this reason, the land cover reverts to its previous state” [25]. Recovery of the riparian vegetation is reflected in an apparent increase in productivity (p < 0.001, Mann–Whitney U statistic = 15,955; Figure 9d).

4. Discussion

4.1. Carbon Storage in the REAZ

Our results from carbon stock estimation by area suggest that the REAZ has the capacity to store much more carbon than the rest of the land cover types analyzed. Nevertheless, the REAZ constitutes a small fraction of the landscape, when compared to the land cover types, such as oak/oak–pine forest or desert scrub, which might present a larger overall storage due to their extent. However, if we take into account the 59% of the riparian vegetation that has been substituted by agriculture in the region of the San Miguel River [24], the REAZ total values of carbon would be greater than those of cultivated grassland and riparian mesquite and close to those of the desert scrub (Table 3). Moreover, the importance of the REAZ resides not only on its overall capacity to store carbon but also in the fact that this ecosystem ranks among the highest carbon stocks in terms of its aerial and root biomass, as well as in its soils [7,8]. To understand the importance of the REAZ in terms of carbon storage, it is necessary analyze the ratios per area (other land cover type/REAZ) with the rest of the land cover types in arid environments. From the previous, is worth mentioning that according to our results, conversion from riparian vegetation to any other land cover type in our study area represents a loss of carbon storage capacity.
Differences in carbon storage between ZR (16,976 TonC) and SMR (23,422 TonC) can be explained as a function of biophysical and management conditions of each region. The SMR presents greater annual precipitation and less extreme temperatures compared to the ZR [27,28]. The SMR land cover types are related, to a lesser degree of aridity (e.g., oak/oak–pine forest and riparian vegetation), with greater carbon storage capacity. In contrast, the vegetation in the ZR, includes mostly desert scrub and mesquite woodland, which present lower values of carbon storage. Likewise, the ZR presents a larger area devoted to the development of economic activities related to intensive use of soil and water, such as large-scale grape cultivars and extensive livestock production that promotes the use of exotic grasses [25].
Spatial information regarding the location of loss/gain of carbon storage capacity has been assessed in previous studies [20,33,64]. However, the value of assessing potential carbon storage capacity in arid environments, and especially in the REAZ, has been underestimated [64]. In order to mitigate the effects of greenhouse gas accumulation, it is of great importance to provide accurate information to stakeholders, managers and policy-makers regarding the current status, dynamics, and spatial distribution of the sources and sinks of carbon [65]. Tools such as those utilized in this study can facilitate the ES mapping process, linking the spatial information of land cover and use to biophysical values obtained from official databases, local studies, or field samples [20].

4.2. Productivity Differences and Trends

Productivity proxies were derived using the NDVI, since the index is highly correlated to the Leaf Areas Index [66], canopy coverage, biomass, chlorophyll content, photosynthesis, respiration, etc. [16]. High NDVI values represent productive vegetation coverage, while a decrease through time of NDVI, in a specific area, might suggest a steady degradation of the ecosystem biophysical conditions [67].
Given the time period analyzed (2001–2012), we found that the REAZ presents an equal, or greater, productivity than (1) agriculture, which is supplied with water and nutrients, and (2) oak/oak–pine forest, which is distributed in areas with more precipitation and cooler summer temperatures [56]. However, compared to the rest the land cover types analyzed, basal productivity of riparian vegetation was always greater for all the years analyzed (Table 4, Figure 5a). The greater basal and pre-monsoon productivity of the RE (riparian vegetation and riparian mesquite) could be explained as a consequence of the constant flow of materials, water, and energy, in the systems. Our results show that agriculture, riparian vegetation, oak/oak–pine forest, and riparian mesquite land cover types present the higher values of NDVI in relation to the rest of the classes analyzed. These results provide evidence of the importance of the RE as areas of high productivity in the arid zones of Northeastern Mexico, particularly in regions such as the ZR, in which RE adjoin other less productive vegetation types, such as desert scrub, mesquite woodland, and cultivated grassland (Figure 2 and Figure 5a,b).
Our analysis of trends shows a significant decrease in the productivity for the REAZ over time (both Landsat and MODIS sensors suggested this). In the regional context, other studies that used NDVI data from Landsat have found a progressive decrease in pre-monsoon productivity in mangroves of the Gulf of California in the period 1990–2010 [48], and in agriculture and riparian vegetation in the San Pedro River (USA) between 1984 and 2012 [49]. The tendency towards a decrease in the productive capacity of the vegetation appears to be a regional phenomenon and this was also found in our analysis based on MODIS and Landsat data (Figure 6a). The gradual decrease on NDVI values in other REAZ of the region, such as the San Pedro River (USA), has been explained as a response to the reduced flow of surface water, increased air temperature, and increased depth of water table levels [49]. The negative trend in productivity of the riparian vegetation and riparian mesquite could be the consequence of a synergy between the set of climatic conditions and the state of water management in the region that can give rise to the decrease in surface runoff and a possible decrease in phreatic levels, as shown in previous studies [25].
Water availability and management are considered the most prominent drivers for productivity in the REAZ. In our present analysis we found an inverse relationship between groundwater depth and REAZ productivity, demonstrating the phreatic level modifications could explain, in part, the trends mentioned before. There are around 1544 subterranean water concessions in the region, of which 898 correspond to the SMR and 646 to the ZR. The volume of water under concession for the region, according to the Public Register of Water Rights of the National Water Commission (REPDA, by its Spanish acronym), is approximately 144.9 Mm3/year, while the annual mean recharge is 147.3 Mm3/year [27]. Water recharge and extraction in the aquifers is, thus, very similar and most of the wells are found close to the course of the rivers, which could increase the water table depth, mostly in areas with greater agricultural activity [25]. On the other hand, a total of 387 “represos” have been reported in SMR alone [68], covering a total area of 185 ha and retaining the runoff that would otherwise reach the watercourses. Most of the dams are constructed without authorization, since CONAGUA only has around 80 surface water concessions registered in both of the sub-basins [69]. Human activities present in the region (deviation of watercourses and detention of surface water flow) have reduced the availability of water for other purposes, such as urban and ecological uses. This might alter the structure and functioning of the REAZ. With a reduction on surface and ground water availability, riparian plant species of arid and semi-arid zones make structural adjustments, reducing their LAI and canopy coverage [70], a phenomenon that can be identified remotely through a reduced NDVI [49]. These adjustments seek to maintain the function of the RE when water is scarce, but if the lack of water is maintained, the system can undergo a transition from the strictly riparian vegetation formed by genera such as Populus and Salix, towards plant communities composed by facultative species such as Prosopis, Tamarix, Celtis, and other xerophytic trees [1,2,3].

5. Conclusions

There is a greater quantity of carbon stored in the central and northern sections of the SMR, a region that has been less dynamic in terms of the development of agricultural and livestock production activities. This region also features vegetation types with greater values of the productivity proxies (NDVI: greater integral–lesser integral of MODIS and NDVI: pre-monsoon of Landsat). In contrast, the ZR shows lower quantity of carbon stored per hectare. This is partly due to the introduction of large fields of induced grasslands in areas where riparian vegetation, mesquite woodland, and desert scrub were present.
Abandoned agricultural areas can be converted over time into carbon sinks, which represents an exchange of costs and benefits between a social contingency (land abandonment) and an ecological benefit (recovery of vegetation).
Despite the fact that other vegetation types of greater coverage in the region (such as the subtropical scrub oak/oak–pine forest or mesquite woodland) represent a greater carbon storage, the RE feature the land cover types with the greatest capacity for carbon storage per unit area (even greater than that of the oak/oak–pine forest). Likewise, basal and pre-summer monsoon productivity values in the REAZ are equal, or higher (some years), than land cover types such as oak/oak–pine forest or agriculture, which are considered to be highly productive.
A possible synergy between the increase in temperature, mainly of autumn–winter, the decrease in precipitation, and of surface runoff, as well as changes in land use and the intensity of water use, could have a negative influence on productivity in the REAZ.
This study provides evidence to enable the following conclusions about productivity:
  • There is a decrease in the time of the basal and pre-monsoon productivity of the REAZ. This is partly due to the drier conditions observed during the previous decades in the region, partly provoked by ENSO dominance in recent years [71].
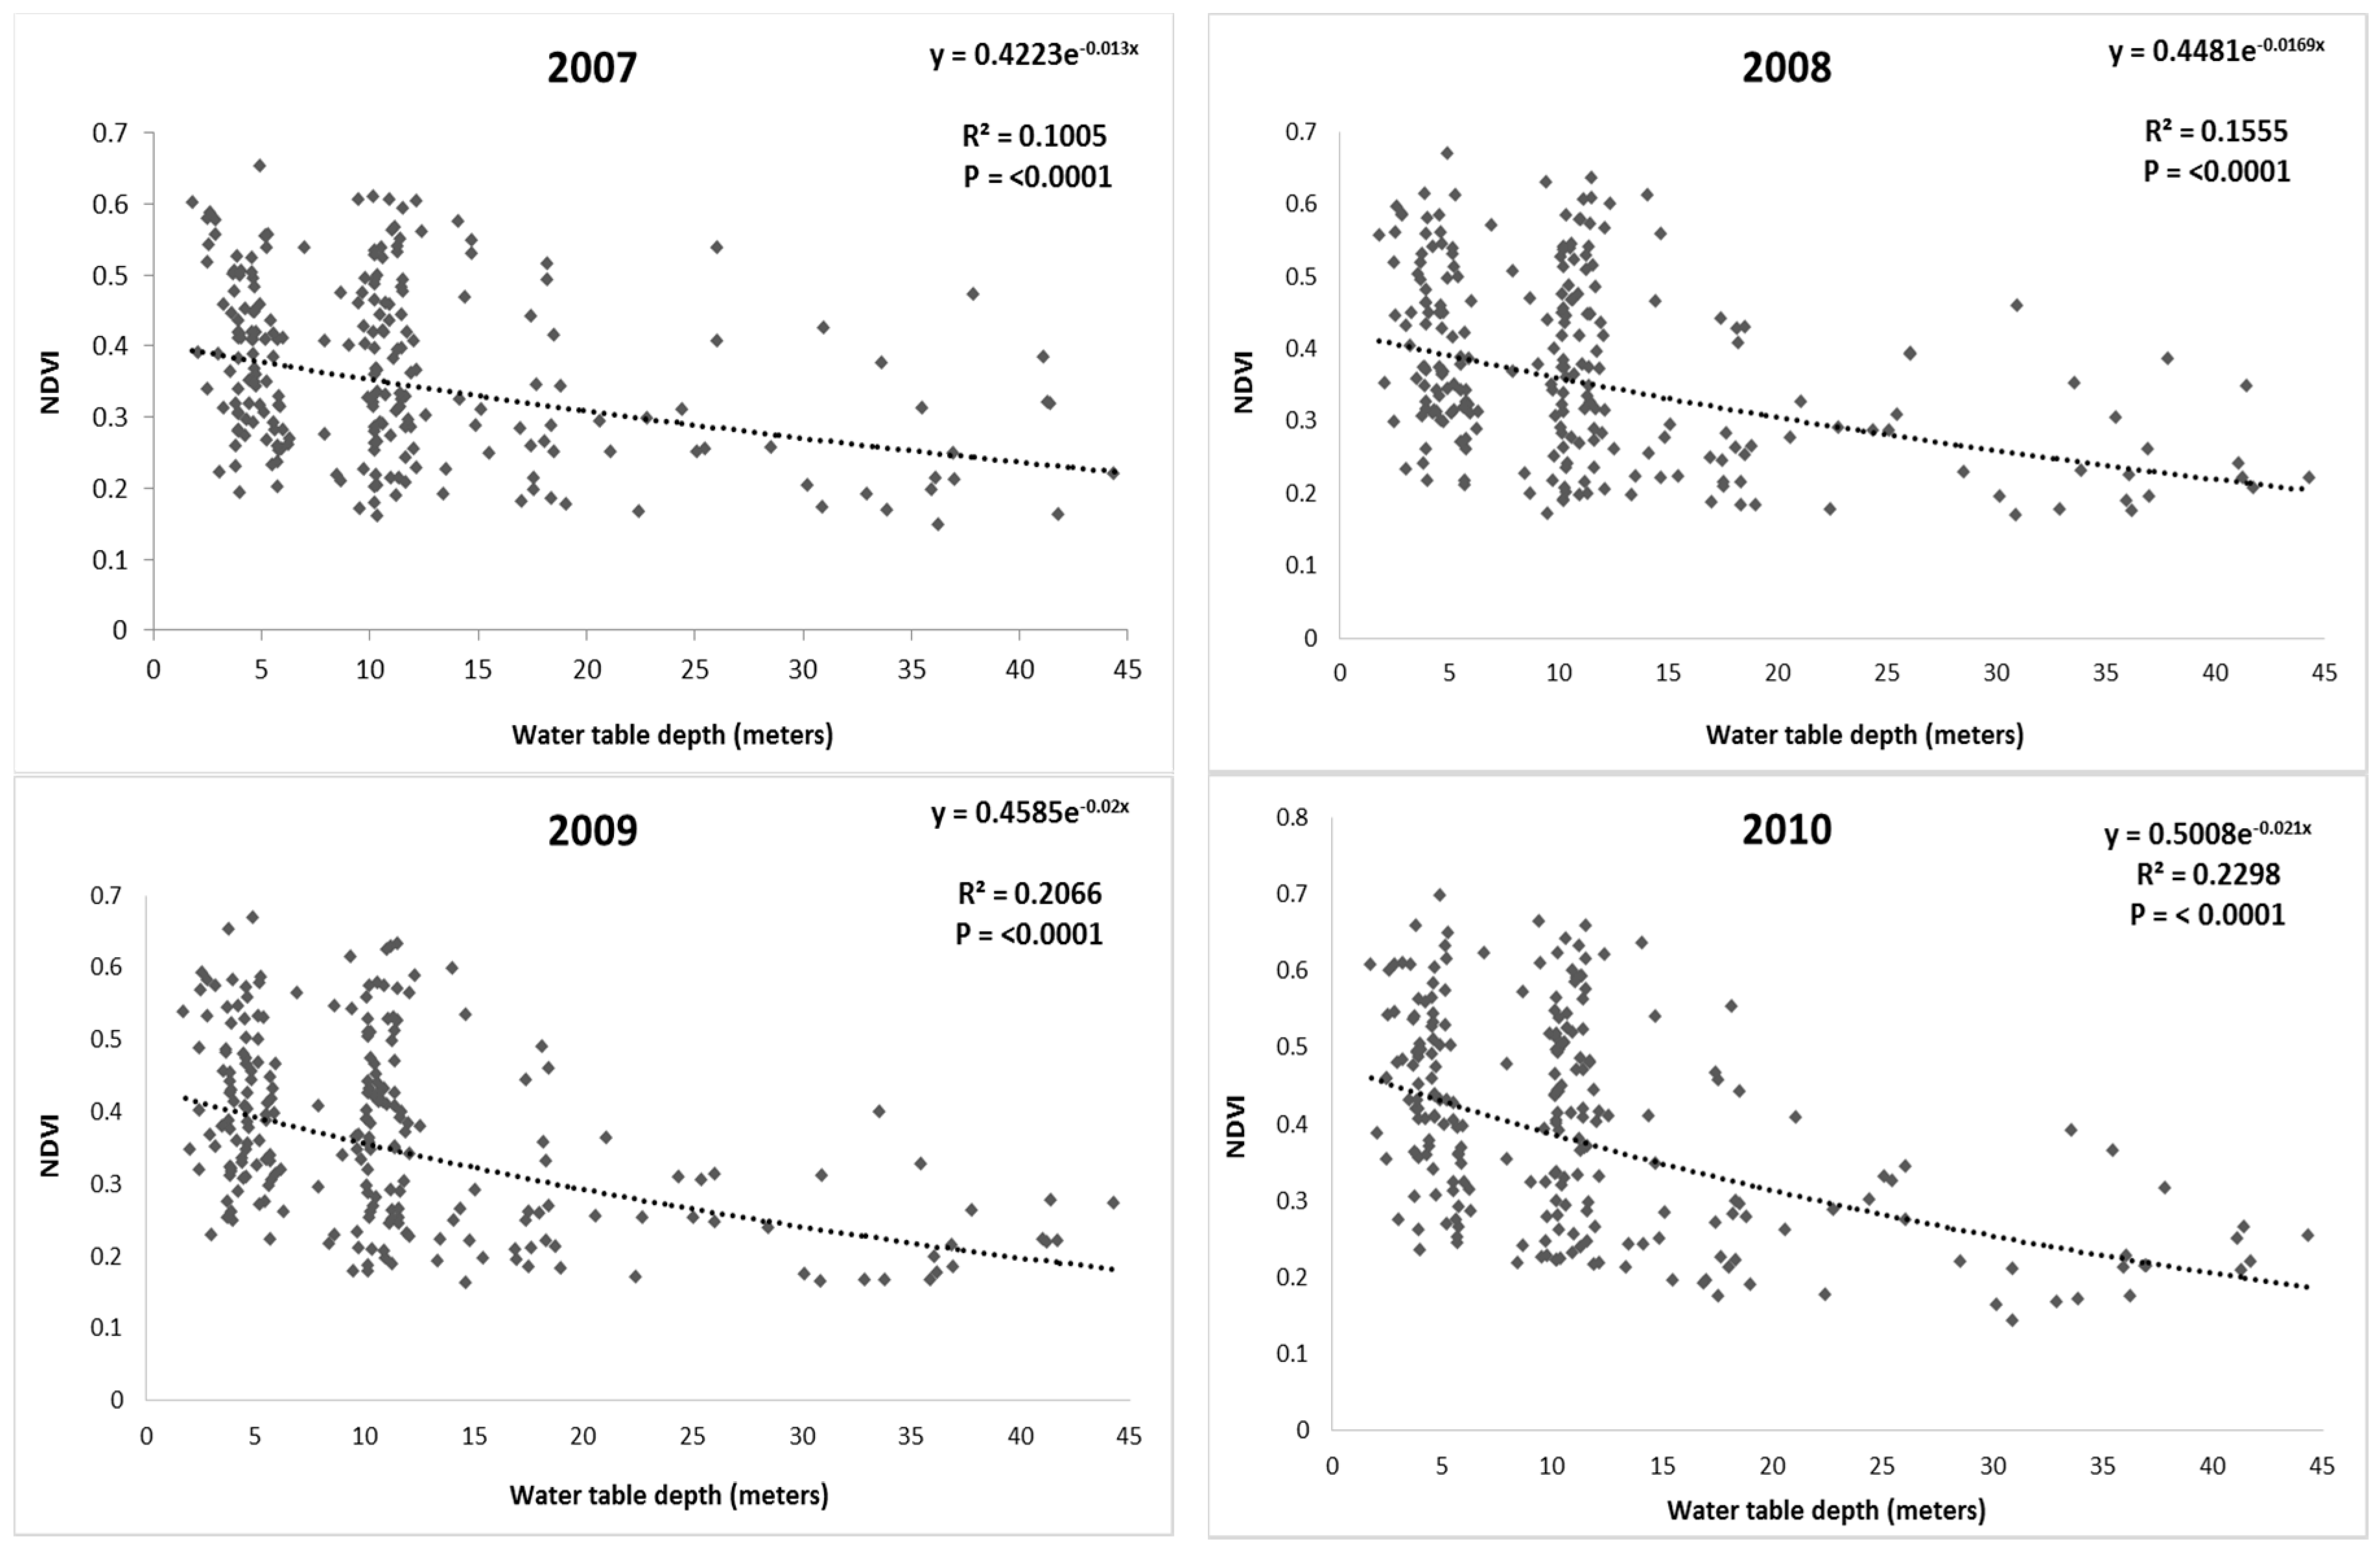
  • Productivity of riparian vegetation decreases with the increased depth of the static levels of subterranean water.
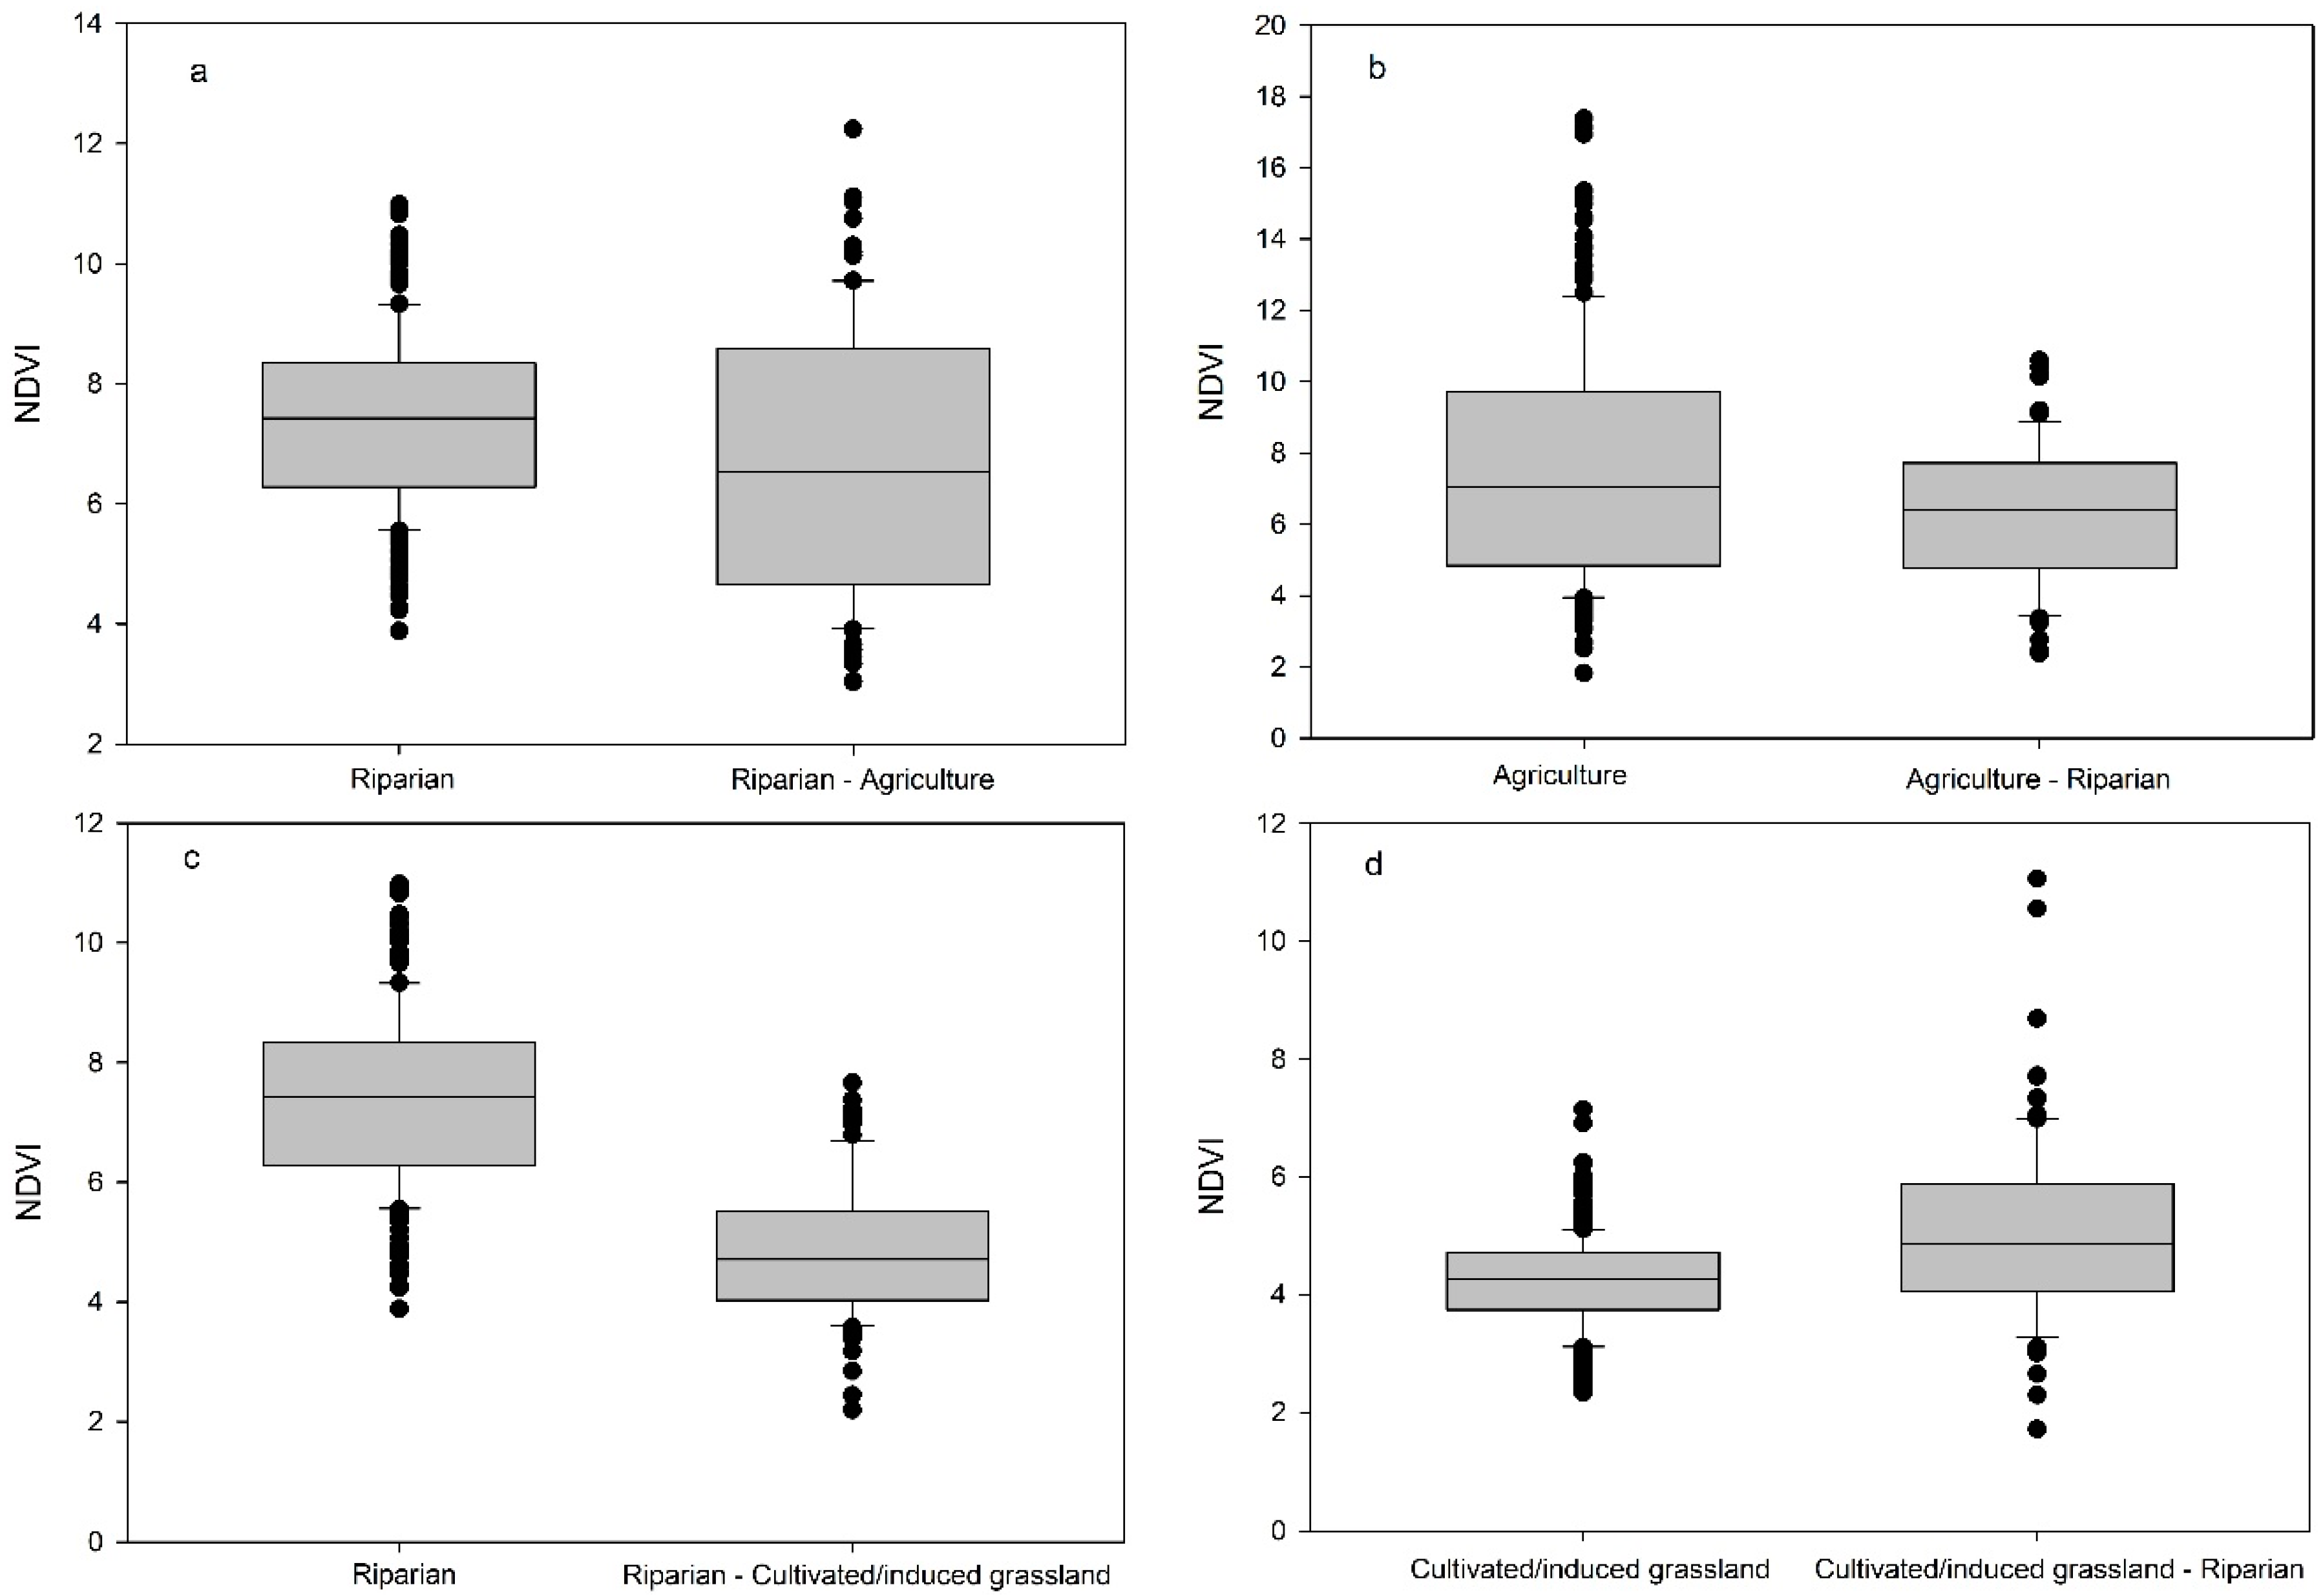
  • Productivity decreases in sites where the REAZ has transformed to other land cover types.
  • In sites where there is an intensive use of water and soil, a transition is seen between strictly riparian (genera Populus and Salix) and facultative (genera Prosopis, Acacia and Celtis) species.
The present work improves our understanding of how land use change dynamics, intensive water use, and changes in meteorological conditions can have an impact on the ES of productivity and carbon storage offered by the REAZ.
Spatial modeling of ES could be a very important instrument to evaluate the impact of public policies concerning land use (governmental supports for agriculture, livestock production, mining concessions, touristic and urban development, etc.) in semi-arid or arid regions. These tools may be utilized with greater regularity as the frequency and precision of forestry inventories and land cover mapping improves, and as a greater quantity of allometric equations are generated in order to estimate the biomass of species of semi-arid zones.

Acknowledgments

The authors wish to thank the financial support provided by the Project: “Strengthening Resilience of Arid Region Riparian Corridors Ecohydrology and Decision-Making in the Sonora and San Pedro Watersheds”, supported, in turn, by the National Science Foundation’s Dynamics of Coupled Natural and Human (CNH) Systems Program. We wish to thank the National Council for Science and Technology of Mexico (CONACYT) for their support of Romeo Mendez, through a postgraduate scholarship. Also AECV and JRRL recognize grant support (CB2013-223525-R). Finally, AECV for support trough grant INF2012/1-188387.

Author Contributions

Romeo Mendez-Estrella was the primary author and all authors contributed to the final paper. Jose Raul Romo-Leon set the idea of the research, discussed, contributed to all steps of the analysis, and commented on the manuscript. Alejandro E. Castellanos advised on the research project, commented on, and revised, the manuscript.

Conflicts of Interest

The authors declare no conflict of interest.

Appendix A

Figure A1. Location of sample plots (conglomerate), used to estimate biomass per land cover class within the study area. Information provided by the National Forestry Commission (CONAFOR).
Ijgi 06 00298 g010

Appendix B

Table A1. References to allometric equations and data, for the estimation of carbon content (by species) in the land cover types analyzed.
Land Cover TypeData UtilizedSources of Information
Forest (oak/oak–pine)NFI sampling points (63)Allometric equations for above-ground biomass
Acacia farnesiana [72]
Arbutus arizonica, Arctostaphylos pungens, Cupressus arizonica, Fraxinus gooddingii, Garrya wrightii, Juniperus spp, J. coahuilensis, J. deppeana, J. monosperma, Prosopis juliflora, P. velutina, Quercus sp., Q. chiapasensis, Q. chihuahuensis, Q. depressipes, Q. turbinella, Q. toumeyi, Q. viminea, Q. crassifolia, Q. arizonica, Q. grisea, Q. Hypoleucoides, Q. oblongifolia, Q. laurifolia, Rhus choriophylla [45]
Eysenhardtia orthocarpa [9]
Lysiloma watsonii, L. divaricatum, Pinus engelmannii, P. leiophylla, Quercus sideroxyla [73]
Pinus cembroides [74]
Prosopis glandulosa [75]
Quercus castanea [76]
Shoot: root biomass [39]
Soil organic carbon [36]
Desert scrubNFI sampling points (46)Allometric equations for above-ground biomass
Acacia constricta, A. occidentalis, Bumelia sp., Forchammeria watsonii, Prosopis glandulosa, P. juliflora, P. velutina [45]
Bursera fagaroides, B. hindsiana, Cercidium microphyllum, C. sonorae, Eysenhardtia orthocarpa, Fouquieria macdougalii, Olneya tesota, Parkinsonia microphylla, P. praecox, P. florida, Guaiacum coulteri [9]
Celtis pallida, Condalia globosa [72]
Lysiloma divaricatum, L. watsonii [73]
Shoot: root biomass [39]
Soil organic carbon [40]
Mesquite woodlandNFI sampling points (31)Allometric equations for abov- ground biomass
Acacia farnesiana, Celtis pallida, Condalia globosa [72]
Ipomoea arborescens [77]
Acacia occidentalis, Havardia mexicana, Prosopis glandulosa, P. juliflora, P. velutina [45]
Bursera hindsiana, B. microphylla, B. laxiflora and B. lancifolia, Cercidium microphyllum, C. sonorae, Eysenhardtia orthocarpa, Fouquieria macdougalii, Guaiacum coulteri, Jatropha cordata, Olneya tesota, Opuntia thurberi, O. versicolor, Parkinsonia microphylla, P. praecox, P. florida, Randia thurberi, Sideroxylon occidentale, Pithecellobium dulce [9]
Shoot: root biomass [39]
Soil organic carbon [36]
Subtropical/succulent scrubNFI sampling points (34)Allometric equations for abov- ground biomass
Acacia colicantha [78]
Ceiba acuminata, C. pentandra, Erythrina flabelliformis, Ipomoea arborescens, Lysiloma divaricatum, L. watsonii [73]
Celtis pallida, C. reticulate [72]
Acacia cymbispina, A. occidentalis, A. greggii, A. willardiana, Diphysa suberosa, Prosopis glandulosa, P. juliflora, P. velutina [45]
Bursera fagaroides, B. hindsiana, Cercidium sonorae, C. praecox, Eysenhardtia orthocarpa, E. polystachya, Fouquieria macdougalii, Guaiacum coulteri, Jatropha cordata, Olneya tesota, Opuntia wilcoxii, O. arbuscula, O. thurberi, Parkinsonia microphylla, P. praecox, P. aculeata [9]
Shoot: root biomass [37]
Soil organic carbon [36]
Riparian vegetation (includes Riparian mesquite)NFI sampling points (15), field sampling points (n = 8)Allometric equations for above-ground biomass
Parkinsonia microphylla, Parkinsonia aculeata, Olneya tesota, Guaiacum coulteri, Jatropha cordata, Cercidium sonorae, C. microphyllum, Eysenhardtia orthocarpa, Bursera microphylla, B. hindsiana, Opuntia thurberi, Randia thurberi [9]
Prosopis velutina, P. juliflora, Prosopis sp., Acacia occidentalis, Havardia mexicana, Populus sp, Salix sp., Bacharis sp., Hymenoclea monogyra, Celtis pallida, Vallesia glabra, Phaulothamnus spinescens, Acacia occidentalis [45]
Celtis pallida, Condalia globosa, Acacia farnesiana [72]
Ipomoea arborescens [73]
Shoot: root biomass [39]
Soil organic carbon [36]
Natural/native grasslandNFI sampling points (13)Allometric equations for above-ground biomass
Chilopsis linearis, Juniperus deppeana, Juniperus monticola, Juniperus coahuilensis, Prosopis laevigata, P. velutina, P. juliflora, P. glandulosa, Quercus arizonica, Q. chihuahuensis, Q. depressipes, Q. emoryi, Q. grisea, Q. oblongifolia [45]
Lysiloma watsonii, Quercus sideroxyla [73]
Shoot: root biomass [38]
Soil organic carbon [40]
Cultivated/induced grasslandRegional surveyAbove-ground biomass [34]
Shoot: root biomass [38]
Soil organic carbon [40]
AgricultureOfficial dataAbove-ground biomass [35,41,43]
Shoot: root biomass [37]
Soil organic carbon [40]

References

  1. Baker, B.M.; Ffolliott, P.F.; Debano, L.F.; Neary, D.G. Riparian Areas of the Southwestern United States: Hydrology, Ecology, and Management; Lewis Publishers; CRC Press: Boca Raton, FL, USA, 2004; p. 408. [Google Scholar]
  2. Patten, D.T. Riparian ecosytems of semi-arid north america: Diversity and human impacts. Wetlands 1998, 18, 498–512. [Google Scholar] [CrossRef]
  3. Zaimes, G.; Nichols, M.; Green, D.; Crimmins, M. Understanding Arizona’s Riparian Areas; College of Agriculture and Life Sciences, University of Arizona: Tucson, AZ, USA, 2007; Available online: http://extension.arizona.edu/sites/extension.arizona.edu/files/pubs/az1432.pdf (accessed on 4 August 2016).
  4. Pase, C.P.; Layser, E.F. Classification of riparian habitat in the southwest. In Importance, Preservation, and Management of Riparian Habitat: A Symposium; Johnson, R.R., Jones, D.A., Eds.; U.S. Department of Agriculture: Fort Collins, CO, USA, 1977; pp. 5–9. [Google Scholar]
  5. Granados-Sánchez, D.; Hernández-García, M.; López-Ríos, G. Ecología de las zonas ribereñas. Rev. Chapingo Ser. 2006, 12, 55–69. (In Spanish) [Google Scholar]
  6. Rood, S.B.; Mahoney, J.M. Collapse of riparian poplar forests downstream from dams in western prairies: Probable causes and prospects for mitigation. Environ. Manag. 1990, 14, 451–464. [Google Scholar] [CrossRef]
  7. Tufekcioglu, A.; Raich, J.; Isenhart, T.; Schultz, R. Biomass, carbon and nitrogen dynamics of multi-species riparian buffers within an agricultural watershed in iowa, USA. Agrofor. Syst. 2003, 57, 187–198. [Google Scholar] [CrossRef]
  8. Hazlett, P.; Gordon, A.; Sibley, P.; Buttle, J. Stand carbon stocks and soil carbon and nitrogen storage for riparian and upland forests of boreal lakes in northeastern ontario. For. Ecol. Manag. 2005, 219, 56–68. [Google Scholar] [CrossRef]
  9. Búrquez, A.; Martínez-Yrízar, A.; Núñez, S.; Quintero, T.; Aparicio, A. Aboveground biomass in three sonoran desert communities: Variability within and among sites using replicated plot harvesting. J. Arid Environ. 2010, 74, 1240–1247. [Google Scholar] [CrossRef]
  10. Egoh, B.; Reyers, B.; Rouget, M.; Richardson, D.M.; Le Maitre, D.C.; van Jaarsveld, A.S. Mapping ecosystem services for planning and management. Agric. Ecosyst. Environ. 2008, 127, 135–140. [Google Scholar] [CrossRef]
  11. Assessment, M.E. Ecosystems and Human Well-Being; Island Press: Washington, DC, USA, 2005; Volume 5. [Google Scholar]
  12. Balvanera, P. Los servicios ecosistémicos que ofrecen los bosques tropicales. Rev. Ecosistemas 2012, 21, 136–147. (In Spanish) [Google Scholar]
  13. Loomis, J.; Kent, P.; Strange, L.; Fausch, K.; Covich, A. Measuring the total economic value of restoring ecosystem services in an impaired river basin: Results from a contingent valuation survey. Ecol. Econ. 2000, 33, 103–117. [Google Scholar] [CrossRef]
  14. Orúe, M.E.; Booman, G.C.; Laterra, P. Uso de la Tierra, Configuración del Paisaje y el Filtrado de Sedimentos y Nutrientes por Humedales y Vegetación Ribereña. Valoración de Servicios Ecosistémicos: Conceptos, Herramientas y Aplicaciones Para el Ordenamiento Territorial; INTA Ediciones: Buenos Aires, Argentina, 2011; pp. 237–254. (In Spanish) [Google Scholar]
  15. Sweeney, B.W.; Bott, T.L.; Jackson, J.K.; Kaplan, L.A.; Newbold, J.D.; Standley, L.J.; Hession, W.C.; Horwitz, R.J. Riparian deforestation, stream narrowing, and loss of stream ecosystem services. Proc. Natl. Acad. Sci. USA 2004, 101, 14132–14137. [Google Scholar] [CrossRef] [PubMed]
  16. Huete, A.; Didan, K.; van Leeuwen, W.; Miura, T.; Glenn, E. Modis vegetation indices. In Land Remote Sensing and Global Environmental Change; Springer: New York, NY, USA, 2010; pp. 579–602. [Google Scholar]
  17. Altesor, A.; Barral, M.P.; Booman, G.; Carreño, L.; Cristeche, E.; Isacch, J.P.; Maceira, N.; Pérez, N. Servicios Ecosistémicos: Un Marco Conceptual en Construcción. Aspectos Conceptuales y Operativos. Expansión e Intensificación Agrícola en Argentina: Valoración de Bienes y Servicios Ecosistémicos Para el Ordenamiento Territorial; INTA Ediciones: Buenos Aires, Argentina, 2010. (In Spanish) [Google Scholar]
  18. Root, T.L.; Price, J.T.; Hall, K.R.; Schneider, S.H.; Rosenzweig, C.; Pounds, J.A. Fingerprints of global warming on wild animals and plants. Nature 2003, 421, 57–60. [Google Scholar] [CrossRef] [PubMed]
  19. Deng, S.; Shi, Y.; Jin, Y.; Wang, L. A gis-based approach for quantifying and mapping carbon sink and stock values of forest ecosystem: A case study. Energy Procedia 2011, 5, 1535–1545. [Google Scholar] [CrossRef]
  20. Bagstad, K.J.; Semmens, D.J.; Winthrop, R. Comparing approaches to spatially explicit ecosystem service modeling: A case study from the san pedro river, arizona. Ecosyst. Serv. 2013, 5, 40–50. [Google Scholar] [CrossRef]
  21. Ordoñez, D.; Antonio, B.; Caballero, M.; Jiménez, I.; Carmona, J.; Galicia, A.; Calvo, F.; Balam, M.; Rojas, R.; Jiménez, J. Estimación del Carbono Almacenado en Pinus Hartwegii en el Parque Nacional Izta-Popo, Zoquiapan. Estado Actual del Conocimiento del Ciclo del Carbono y sus Interacciones en Mexico; Programa Mexicano del Carbono, Universidad Autónoma del Estado de Mexico e Instituto Nacional de Ecología: Texcoco, Mexico, 2012; pp. 680–684. (In Spanish) [Google Scholar]
  22. Ruesch, A.; Gibbs, H.K. New IPCC Tier1 Global Biomass Carbon Map For the Year 2000; Carbon Dioxide Information Analysis Center, Oak Ridge National Laboratory: Oak Ridge, Tennessee, 2008. Available online: http://cdiac.ornl.gov (accessed on 4 September 2016).
  23. Postel, S.; Richter, B. Rivers for Life: Managing Water for People and Nature; Island Press: Washington, DC, USA, 2012. [Google Scholar]
  24. Scott, M.L.; Nagler, P.L.; Glenn, E.P.; Valdes-Casillas, C.; Erker, J.A.; Reynolds, E.W.; Shafroth, P.B.; Gomez-Limon, E.; Jones, C.L. Assessing the extent and diversity of riparian ecosystems in sonora, mexico. Biodivers. Conserv. 2009, 18, 247–269. [Google Scholar] [CrossRef]
  25. Mendez-Estrella, R.; Romo-Leon, J.R.; Castellanos, A.E.; Gandarilla-Aizpuro, F.J.; Hartfield, K. Analyzing landscape trends on agriculture, introduced exotic grasslands and riparian ecosystems in arid regions of mexico. Remote Sens. 2016, 8, 664. [Google Scholar] [CrossRef]
  26. Comisión Nacional para el Conocimiento y Uso de la Biodiversidad (CONABIO). ‘Subcuencas hidrológicas‘. Extraído de Boletín Hidrológico. (1970). Subcuencas Hidrológicas en Mapas de Regiones Hidrológicas. Escala más Común 1:1,000,000. Secretaría de Recursos Hidraúlicos; Jefatura de Irrigación y control de Ríos, Dirección de Hidrología: Ciudad de México, Mexico, 1998. (In Spanish) [Google Scholar]
  27. Comisión Nacional del Agua (CONAGUA). Actualización de la Disponibilidad Media Anual de Agua Subterránea. Acuífero (2626) río Zanjón, Estado de Sonora; Diario Oficial de la Federación: Ciudad de México, Mexico, 2009. (In Spanish) [Google Scholar]
  28. Comisión Nacional del Agua (CONAGUA). Actualización de la Disponibilidad Media Anual de Agua Subterránea. Acuífero (2625) río san Miguel, Estado de Sonora; Diario Oficial de la Federación: Ciudad de México, Mexico, 2009. (In Spanish) [Google Scholar]
  29. Anderson, J.R. A Land Use and Land Cover Classification System for Use with Remote Sensor Data; US Government Printing Office: Washington, DC, USA, 1976; Volume 964.
  30. Rzedowski, J. Vegetación de Mexico, 1st ed.; Comisión Nacional para el Conocimiento y Uso de la Biodiversidad: Tialpan, Mexico, 2006; p. 504. (In Spanish) [Google Scholar]
  31. Shreve, F.; Wiggins, I.L. Vegetation and Flora of the Sonoran Desert; Stanford University Press: Stanford, CA, USA, 1964; Volumes 1 and 2. [Google Scholar]
  32. Congalton, R.G.; Green, K. Assessing the Accuracy of Remotely Sensed Data: Principles and Practices; CRC Press: Boca Raton, FL, USA, 2008. [Google Scholar]
  33. Vashum, K.T.; Jayakumar, S. Methods to estimate above-ground biomass and carbon stock in natural forests—A review. J. Ecosyst. Ecogr. 2012. [Google Scholar] [CrossRef]
  34. Franklin, K.A.; Lyons, K.; Nagler, P.L.; Lampkin, D.; Glenn, E.P.; Molina-Freaner, F.; Markow, T.; Huete, A.R. Buffelgrass (pennisetum ciliare) land conversion and productivity in the plains of sonora, Mexico. Biol. Conserv. 2006, 127, 62–71. [Google Scholar] [CrossRef]
  35. SIAP-SAGARPA. Producción Agrícola por Estado. Available online: http://www.Siap.Gob.Mx/cierre-de-la-produccion-agricola-por-estado/ (accessed on 15 January 2016).
  36. Gálvez, R.O.P.R.; Dávalos, R.P.; De Jong, E.S.D.; Álvarez, B.H.J.O. Evaluación de los Recursos Forestales Mundiales 2010. Informe Nacional Mexico; Organización de las Naciones Unidas para la Agricultura y la Alimentación: Rome, Italy, 2010. (In Spanish) [Google Scholar]
  37. Jackson, R.; Canadell, J.; Ehleringer, J.R.; Mooney, H.; Sala, O.; Schulze, E. A global analysis of root distributions for terrestrial biomes. Oecologia 1996, 108, 389–411. [Google Scholar] [CrossRef] [PubMed]
  38. Johnson, M.V.V. Pennisetum Ciliare Invasion: Mechanisms and Effects; Texas A&M University: Kingsville, TX, USA, 2007. [Google Scholar]
  39. Mokany, K.; Raison, R.; Prokushkin, A.S. Critical analysis of root: Shoot ratios in terrestrial biomes. Glob. Chang. Biol. 2006, 12, 84–96. [Google Scholar] [CrossRef]
  40. Segura-Castruita, M.A.; Sánchez-Guzmán, P.; Ortiz-Solorio, C.A.; del Carmen Gutiérrez-Castorena, M. Carbono orgánico de los suelos de Mexico. Terra Latinoam. 2005, 23, 21–28. (In Spanish) [Google Scholar]
  41. Carvajal, M.; Mota, C.; Alcaraz-López, C.; Iglesias, M. Investigación Sobre la Absorción de CO2 por los Cultivos más Representativos. Available online: http://cambioclimaticomurcia.carm.es/pdfs/lessco2/ponencia_cisc_espanol.pdf (accessed on 3 November 2014).
  42. Stromberg, J. Root patterns and hydrogeomorphic niches of riparian plants in the american southwest. J. Arid Environ. 2013, 94, 1–9. [Google Scholar] [CrossRef]
  43. Smith, M.W.; Wood, B.W. Pecan tree biomass estimates. HortScience 2006, 41, 1286–1291. [Google Scholar]
  44. The National Foreatry Commission (CONAFOR). Inventario Nacional Forestal y de Suelos. Informe 2004–2009; Forestal, C.N., Ed.; CONAFOR: Zapopan, Jalisco, Mexico, 2012. (In Spanish) [Google Scholar]
  45. Jenkins, J.C.; Chojnacky, D.C.; Heath, L.S.; Birdsey, R.A. National-scale biomass estimators for united states tree species. For. Sci. 2003, 49, 12–35. [Google Scholar]
  46. Rojas-García, F.; De Jong, B.H.; Martínez-Zurimendí, P.; Paz-Pellat, F. Database of 478 allometric equations to estimate biomass for mexican trees and forests. Ann. For. Sci. 2015, 72, 835–864. [Google Scholar] [CrossRef]
  47. Intergovernmental Panel on Climate Change (IPCC). 2006 IPCC Guidelines for National Greenhouse Gas Inventories; Prepared by the National Greenhouse Gas Inventories Programme; Eggleston, H.S., Buendia, L., Miwa, K., Ngara, T., Tanabe, K., Eds.; Intergovernmental Panel on Climate Change: Hayama, Japan, 2006. [Google Scholar]
  48. Alatorre, L.C.; Sánchez-Carrillo, S.; Miramontes-Beltrán, S.; Medina, R.J.; Torres-Olave, M.E.; Bravo, L.C.; Wiebe, L.C.; Granados, A.; Adams, D.K.; Sánchez, E. Temporal changes of ndvi for qualitative environmental assessment of mangroves: Shrimp farming impact on the health decline of the arid mangroves in the gulf of california (1990–2010). J. Arid Environ. 2016, 125, 98–109. [Google Scholar] [CrossRef]
  49. Nguyen, U.; Glenn, E.P.; Nagler, P.L.; Scott, R.L. Long-term decrease in satellite vegetation indices in response to environmental variables in an iconic desert riparian ecosystem: The upper san pedro, arizona, united states. Ecohydrology 2015, 8, 610–625. [Google Scholar] [CrossRef]
  50. Tucker, C.; Sellers, P. Satellite remote sensing of primary production. Int. J. Remote Sens. 1986, 7, 1395–1416. [Google Scholar] [CrossRef]
  51. Fu, B.; Burgher, I. Riparian vegetation ndvi dynamics and its relationship with climate, surface water and groundwater. J. Arid Environ. 2015, 113, 59–68. [Google Scholar] [CrossRef]
  52. Mather, P.; Tso, B. Classification Methods for Remotely Sensed Data; CRC Press: Boca Raton, FL, USA, 2009. [Google Scholar]
  53. Jönsson, P.; Eklundh, L. Timesat—A program for analyzing time-series of satellite sensor data. Comput. Geosci. 2004, 30, 833–845. [Google Scholar] [CrossRef]
  54. Kogan, F. Application of vegetation index and brightness temperature for drought detection. Adv. Space Res. 1995, 15, 91–100. [Google Scholar] [CrossRef]
  55. Day, R.W.; Quinn, G.P. Comparisons of treatments after an analysis of variance in ecology. Ecol. Monogr. 1989, 59, 433–463. [Google Scholar] [CrossRef]
  56. Servicio Meteorológico Nacional (SMN). Red de Estaciones Climatológicas. Available online: smn1.conagua.gob.mx/climatologia/normales/estacion/EstacionesClimatologicas.kmz (accesed on 20 September 2016).
  57. Comisión Nacional del Agua (CONAGUA). Estaciones hidrométricas. Mexico Subdir. Gen. Téc. 2012. unpublished data. (In Spanish) [Google Scholar]
  58. Joneidi Jafari, H. Relationship between root biomass and soil organic carbon: Case study of arid shrub lands of semnan province. Desert 2013, 18, 173–176. [Google Scholar]
  59. Eswaran, H.; Van Den Berg, E.; Reich, P. Organic carbon in soils of the world. Soil Sci. Soc. Am. J. 1993, 57, 192–194. [Google Scholar] [CrossRef]
  60. Díaz-Caravantes, R.E.; Sánchez-Flores, E. Water transfer effects on peri-urban land use/land cover: A case study in a semi-arid region of mexico. Appl. Geogr. 2011, 31, 413–425. [Google Scholar] [CrossRef]
  61. Méndez-Barroso, L.A.; Vivoni, E.R.; Watts, C.J.; Rodríguez, J.C. Seasonal and interannual relations between precipitation, surface soil moisture and vegetation dynamics in the north american monsoon region. J. Hydrol. 2009, 377, 59–70. [Google Scholar] [CrossRef]
  62. Comisión Nacional del Agua (CONAGUA). Programa de Medidas Preventivas y de Mitigación de la Sequía Para el Consejo de Cuenca Alto Noroeste. Programa Nacional Contra la Sequía (Pronacose). Available online: http://www.Pronacose.Gob.Mx/pronacose14/contenido/documentos/imta_conagua%20cuenca%20noroeste%20salida.Pdf (accessed on 18 November 2015).
  63. Castellanos, A.E.; Yanes, G.; Valdéz, D. Drought-tolerant exotic buffel-grass and desertification. In Weeds across Borders: Proceedings of a North American Conference; Tellman, B., Ed.; The Sonora-Arizona Desert Museum: Tucson, AZ, USA, 2002; pp. 99–112. [Google Scholar]
  64. Asner, G.P.; Archer, S.; Hughes, R.F.; Ansley, R.J.; Wessman, C.A. Net changes in regional woody vegetation cover and carbon storage in Texas drylands, 1937–1999. Glob. Chang. Biol. 2003, 9, 316–335. [Google Scholar] [CrossRef]
  65. Wang, G.; Oyana, T.; Zhang, M.; Adu-Prah, S.; Zeng, S.; Lin, H.; Se, J. Mapping and spatial uncertainty analysis of forest vegetation carbon by combining national forest inventory data and satellite images. For. Ecol. Manag. 2009, 258, 1275–1283. [Google Scholar] [CrossRef]
  66. Van Leeuwen, W.J.; Huete, A.R.; Laing, T.W. Modis vegetation index compositing approach: A prototype with avhrr data. Remote Sens. Environ. 1999, 69, 264–280. [Google Scholar] [CrossRef]
  67. Bai, Z.G.; Dent, D.L.; Olsson, L.; Schaepman, M.E. Proxy global assessment of land degradation. Soil Use Manag. 2008, 24, 223–234. [Google Scholar] [CrossRef]
  68. Moreno-Vazquez, J.L.; Centro de Estudios del Desarrollo de El Colegio de Sonora (COLSON), Hermosillo, Sonora, México. El fortalecimiento de la resilencia de corredores riparios áridos: Ecohidrología y toma de decisiones en la cuenca del río san miguel. 2012. unpublished work (In Spanish) [Google Scholar]
  69. Comisión Nacional del Agua (CONAGUA). Localizador Repda de Aguas Nacionales, Zonas Federales y Descargas de Aguas Residuales (Locrepda), Segunda Versión en Google Earth. Capa de Datos Geográficos de los Aprovechamientos de Agua Superficial Inscritos del Registro Público de Derechos de Agua Repda. 2012. Available online: http://sigagis.Conagua.Gob.Mx/locrepda/ (accessed on 15 July 2015).
  70. Williams, C.A.; Cooper, D.J. Mechanisms of riparian cottonwood decline along regulated rivers. Ecosystems 2005, 8, 382–395. [Google Scholar] [CrossRef]
  71. Hallack-Alegria, M.; Watkins, D.W., Jr. Annual and warm season drought intensity–duration–frequency analysis for Sonora, Mexico. J. Clim. 2007, 20, 1897–1909. [Google Scholar] [CrossRef]
  72. Návar, J.; Nájera, J.; Jurado, E. Preliminary estimates of biomass growth in the tamaulipan thornscrub in north-eastern mexico. J. Arid Environ. 2001, 47, 281–290. [Google Scholar] [CrossRef]
  73. Návar, J. Allometric equations for tree species and carbon stocks for forests of northwestern mexico. For. Ecol. Manag. 2009, 257, 427–434. [Google Scholar] [CrossRef]
  74. Guerrero Silva, L.P. Cuantificación de Biomasa, Carbono y Producción de Oxigeno de Pinus Cembroides Zucc. En Mazapíl, Zacatecas, Mexico. Undergraduate thesis, Universidad Autónoma Agraria Antonio Narro, Saltillo, Mexico, 2014. (In Spanish). [Google Scholar]
  75. González, J.M.; Méndez, A.S.; Luna, J.A.N.; Ontiveros, V.G. Modelos para estimar volumen y biomasa de árboles individuales de Prosopis glandulosa, var. Torreyana en el ejido jesús gonzález ortega n° 1, mpio. De mexicali, bc. Agrofaz Publ. Semest. Investig. Cient. 2006, 6, 225–240. (In Spanish) [Google Scholar]
  76. Aguilar, R.; Ghilardi, A.; Vega, E.; Skutsch, M.; Oyama, K. Sprouting productivity and allometric relationships of two oak species managed for traditional charcoal making in central mexico. Biomass Bioenergy 2012, 36, 192–207. [Google Scholar] [CrossRef]
  77. Návar, J. Alometría para biomasa en especies arbóreas del noroeste de Mexico. Trop. Subtrop. Agroecosyst. 2010, 12, 507–519. (In Spanish) [Google Scholar]
  78. Návar Chaidez, J.d.J. Allometric equations and expansion factors for tropical dry trees of eastern sinaloa, mexico. Trop. Subtrop. Agroecosyst. 2008, 10, 45–52. [Google Scholar]
Figure 1. Study area location. The region of the San Miguel-Zanjón Rivers is located in the central part of the state of Sonora, Mexico.
Ijgi 06 00298 g001
Figure 2. Classification of land cover used in this study [25].
Ijgi 06 00298 g002
Figure 3. Spatial distribution of the carbon storage in the region of San Miguel River (SMR)–Zanjón River (ZR).
Ijgi 06 00298 g003
Figure 4. Changes in carbon storage in the SMR–ZR region.
Ijgi 06 00298 g004
Figure 5. Accumulated Normalized Difference Vegetation Index (NDVI) values of MODIS, representing the proxy of the basal productivity (a) and NDVI values of Landsat, representing the proxy of productivity of the vegetation before the summer monsoon (b).
Ijgi 06 00298 g005
Figure 6. Trends in productivity (proxy) from the NDVI time series of MODIS (a) and Landsat (b), representing the proxies of the basal (large integral–small integral) and pre-monsoon productivity, respectively, for each land cover type (p values in bold, show significance).
Ijgi 06 00298 g006
Figure 7. Trends in total annual precipitation and annual average temperature for the SMR (a,e) and ZR (b,f). Accumulated precipitation and the autumn–winter average temperature for the SMR (c,g) and for the ZR (d,h).
Ijgi 06 00298 g007
Figure 8. Spatial relationship between water depth and pre-monsoon NDVI values of the riparian vegetation for different years of the study period.
Ijgi 06 00298 g008
Figure 9. Comparison of the proxy of total productivity during the growing season (greater integral of MODIS) among different land cover types that remained unchanged during the period 2002–2011, relative to the same classes that underwent changes from riparian vegetation to agriculture or cultivated/induced grassland, and vice versa.
Ijgi 06 00298 g009
Table 1. Meteorological stations used to analyze the trends in temperature and precipitation between 1988 and 2010.
RegionClimatological Stations
Zanjón River00026074 Querobabi
00026016 Carbó
00026182 Pesqueira
San Miguel River00026025 Cucurpe
00026241 Meresichic
00026064 Opodepe
00026181 Rayón
00026180 El Cajón
Table 2. Carbon stocks per land cover type.
Land CoverAboveground Carbon (Tonc/ha)Belowground Carbon (Tonc/ha)Soil Carbon (Tonc/ha)Total Carbon (Tonc/ha)
MeanσData SourceMeanσRoot: Shoot Ratio and Source of DataOrganic Carbon Values and Source of Data
Riparian vegetation33.4717.08Allometric equations and data obtained in field work (8 sampling plots, mean sample size of 28 trees by plot)10.722.920.320 [36,42]48.95 [36]93.147
Forest (oak and oak/pine)11.08.47Allometric equations and data obtained in the NFI (63 sampling plots, mean sample size of 39 trees by plot)3.252.500.295 [39]50.8 [36]65.048
Riparian mesquite4.021.14Allometric equations and data obtained in the NFI (12 sampling plots, mean sample size of 19 trees by plot)4.271.221.063 [39] 48.95 [36]57.245
Perennial agriculture6.105.10Records [35,43]1.951.830.319 [43]40.8 [40]48.850
Subtropical/succulent scrub2.912.66Allometric equations and data obtained in the NFI (36 sampling plots, mean sample size of 17 trees by plot)1.641.500.563 [39]43.52 [36]48.064
Irrigated agriculture2.221.51Records [35,41]0.130.100.059 [41]40.8 [40]43.155
Mesquite woodland3.482.89Allometric equations and data obtained in the NFI (31 sampling plots, mean sample size of 7 trees by plot)3.703.071.063 [39]31.48 [36]38.664
Desert scrub2.391.78Allometric equations and data obtained in the NFI (46 sampling plots, mean sample size of 7 trees by plot)2.541.891.063 [39]24 [40]28.929
Natural/native grassland2.852.35Allometric equations and data obtained in the NFI (13 sampling plots, mean sample size of 15 trees by plot)1.991.640.7 [37]21.4 [40]26.251
Cultivated/induced grassland0.740.13Bibliography [34]0.610.100.82 [38]21.4 [40]22.754
Table 3. Values of total carbon considering the total area of each land cover type for 2011.
Land CoverPixels (30 × 30 m)Cover (Ha)Carbon per Unit Area (TonC/ha)Total Carbon (Ton)
Subtropical/succulent Scrub3,528,729.00317,585.6148.0615,264,434.76
Forest (oak and oak/pine)1,347,073.00121,236.5765.057,886,196.41
Mesquite woodland1,614,070.00145,266.3038.665,616,576.22
Desert scrub1,715,565.00154,400.8528.934,466,662.19
Riparian mesquite496,849.0044,716.4157.252,559,790.89
Cultivated/induced grassland945,453.0085,090.7722.751,936,155.38
Riparian vegetation113,194.0010,187.4693.15948,931.34
Natural/native grassland357,958.0032,216.2226.25845,707.99
Irrigated agriculture165,361.0014,882.4943.16642,253.86
Perennial agriculture52,803.004752.2748.85232,148.39
Table 4. Results of all pairwise multiple comparison procedures (Dunn’s method) between basal productivity (NDVI–MODIS) of riparian vegetation and the rest of land cover classes (for the period from 2001 to 2012). Cells in gray indicate no significant differences between treatments (p > 0.05).
Comparison200120022003200420052006
RanksQRanksQRanksQRanksQRanksQRanksQ
Riparian vegetationRv vs. A548.45.4342.13.486.80.9460.24.5311.13.1267.82.6
Rv vs. Dsc2060.325.51553.419.21304.816.21260.815.61742.021.61832.822.7
Rv vs. F100.31.2453.65.4253.33.05.10.123.10.3489.15.8
Rv vs. Gc2252.628.21868.023.41556.019.51374.417.21689.721.12004.225.1
Rv vs. Mw1516.718.31209.714.6943.411.4980.311.81219.214.71369.416.5
Rv vs. Ng1164.18.21595.411.21413.19.91071.77.5852.96.01639.711.5
Rv vs. Rm710.54.7328.12.268.20.447.90.399.30.7193.01.3
Rv vs. Ssc615.28.3928.412.5804.310.8462.66.21174.515.8835.411.2
Riparian mesquiteRm vs. A162.21.014.00.118.60.1508.13.3211.81.474.80.5
Rm vs. Dsc1349.89.41225.38.61236.78.71308.69.21642.711.51639.811.5
Rm vs. F610.24.2125.50.9185.21.342.70.3122.40.8296.12.0
Rm vs. Gc1542.110.81540.010.81487.810.41422.210.01590.411.21811.112.7
Rm vs. Mw806.15.6881.76.1875.26.11028.27.11119.97.81176.48.2
Rm vs. Ng453.52.51267.46.91344.97.31119.66.1753.74.11446.67.8
Rm vs. Ssc95.30.7600.34.3736.15.3510.53.71075.27.7642.44.6
Comparison200720082009201020112012
RanksQRanksQRanksQRanksQRanksQRanksQ
Riparian vegetationRv vs. A232.82.3376.93.7456.34.5415.34.1591.65.8213.02.1
Rv vs. Dsc1486.618.41984.924.61680.520.81944.024.11956.324.21584.519.6
Rv vs. F115.11.4101.81.2579.76.9218.32.6566.36.7130.61.5
Rv vs. Gc1705.821.32032.525.42188.927.42021.525.32030.025.41277.716.0
Rv vs. Mw1188.314.31577.619.01246.415.01581.319.11484.217.9969.911.7
Rv vs. Ng1046.67.4700.34.91453.510.2467.23.31714.112.11064.27.5
Rv vs. Rm274.81.8655.14.3244.31.6705.14.6348.82.319.10.1
Rv vs. Ssc515.36.9647.88.71114.415.0640.18.6742.710.01049.914.1
Riparian mesquiteRm vs. A42.00.3278.21.8212.01.4238.01.3242.81.6232.11.5
Rm vs. Dsc1211.88.51329.89.31436.110.1289.81.91607.511.31603.611.2
Rm vs. F159.71.1757.05.2335.42.31238.88.7217.51.5149.71.0
Rm vs. Gc1431.010.11377.49.71944.613.7923.46.41681.211.81296.89.1
Rm vs. Mw913.56.3922.56.41002.07.01316.39.21135.47.9989.06.9
Rm vs. Ng771.84.245.20.21209.26.6876.26.11365.37.41083.35.9
Rm vs. Ssc240.51.77.30.1870.06.265.10.5393.92.81069.07.7
Abbreviations are as follow: agriculture (A), desert scrub (Dsc), forest (oak and oak/pine) (F), cultivated/induced grassland (Gc), mesquite woodland (Mw), natural/native grassland (Ng), riparian mesquite (Rm), subtropical/succulent scrub (Ssc) and riparian vegetation (Rv).
Table 5. Pearson correlation analysis between the proxy of the pre-monsoon and basal productivity of the riparian vegetation, accounting for climatic and surface hydrological parameters of the SMR.
Proxy of Pre-Monsoon Productivity of the Riparian Vegetation (Landsat)
Statistical ParametersAverage Annual TemperatureAverage Temperature Autumn–WinterAnnual Accumulated PrecipitationAccumulated Precipitation Autumn–WinterAnnual Runoff Volume
Correlation Coefficient−0.123−0.185−0.04390.3560.186
p Value0.5750.3970.8420.09570.397
Number of Samples2323232323
Proxy of basal productivity of the riparian vegetation (MODIS)
Correlation Coefficient−0.639−0.513−0.5630.1780.383
p Value0.0468 *0.130.09030.6230.274
Number of Samples1010101010
* Statistically significant at p < 0.05.
Table 6. Pearson correlation analysis between the proxy of the pre-monsoon and basal productivity of the riparian mesquite, accounting for climatic parameters of the ZR.
Proxy of Pre-Monsoon Productivity of the Riparian Mesquite (Landsat)
Statistical ParametersAverage Annual TemperatureAverage Temperature Autumn–WinterAnnual Accumulated PrecipitationAccumulated Precipitation Autumn–Winter
Correlation Coefficient−0.143−0.245−0.1440.205
p Value0.5150.2590.5120.349
Number of Samples23232323
Proxy of basal productivity of the riparian mesquite (MODIS)
Correlation Coefficient−0.618−0.664−0.3040.362
p Value0.05690.0362 *0.3940.304
Number of Samples10101010
* Statistically significant at p < 0.05.

