Barrier Island Dynamics Using Mass Center Analysis: A New Way to Detect and Track Large-Scale Change


Abstract
: A geographic information system (GIS) was used to introduce and test a new method for quantitatively characterizing topographic change. Borrowing from classic Newtonian mechanics, the concept of a body’s center of mass is applied to the geomorphic landscape, and the barrier island environment in particular, to evaluate the metric’s potential as a proxy for detecting, tracking and visualizing change. Two barrier islands along North Carolina’s Outer Banks are used to test this idea: Core Banks, uninhabited and largely-undeveloped, and Hatteras Island, altered by the presence of a protective dune system. Findings indicate that for Core Banks, the alongshore change in the center of mass is in accord with dominate littoral transport and wind conditions. Cross-shore change agrees with independent estimates for the island migration rates. This lends credence to our assertion that the mass center metric has the potential to be a viable proxy for describing wholesale barrier migration and would be a valuable addition to the already-established ocean shoreline and subaerial volume metrics. More research is, however, required to demonstrate efficacy.1. Introduction
This research introduces a new quantitative metric for characterizing coastal change: the system center of mass. Borrowed from classical Newtonian mechanics, the center of mass, as applied to coastal geomorphology, and to geomorphological systems in general, maps a finite volume, consolidated or unconsolidated sediment/rock mass into a single point in three-dimensional space, its physical center of mass. With a time series of data, this center of mass can be computed and tracked through space to provide an accounting for how a feature or system overall is evolving (moving) with time.
Much previous research associated with coastal change has relied on the ocean shoreline and changes in the shoreline’s position ([1–9]). The most common datum used to represent this shoreline has been the high water line (HWL). The HWL is defined as the position of the land/water interface at the time of the last high tide prior to survey [10] and is demarcated on the beach by a line (the wet/dry line), differentiating darker toned wetted sand from the intertidal zone and the lighter toned drier sands located on the supra tidal beach [2,4,7]. The HWL has been shown by some investigators to be a reliable and stable proxy for shoreline change assessment [2,4]. Others, however, view the HWL as a variable and unreliable metric for capturing long-term trends [7,10,11]. Perhaps the HWL’s relative accessibility and ease of measurement in the field, and visibility from aerial photography, are the principle reasons for its widespread use [2]. The HWL has been superseded by the tidally referenced mean high water (MHW) shoreline, however, the large body of historic data based on the HWL supports the continued use of the latter in shoreline studies [8].
It is unclear whether changes in the ocean shoreline accurately reflect change across an entire coastal complex, such as a barrier island. Brock et al. (2004) [12] found that change in morphology across a 10-km section of Assateague Island in Maryland and Virginia was not well predicted by a change in the ocean shoreline, though they qualified their findings in light of the short, 10-month time span of the study data. The authors went on to suggest that a new metric, the volume balance line, a measure that partitions the island cross-shore into two equal-volume sections, could be employed in complement with the ocean shoreline to better predict whole-barrier island changes.
The more recent adoption of active-sensor altimetry (i.e., radar and LiDAR), combined with global navigation satellite systems, and analytical tools, such as geographic information systems (GISs), by the geoscience research community have made it possible to incorporate volume-based approaches as a supplement to the ocean shoreline position proxy ([12–21]). Airborne and satellite-based active sensor platforms allow coverage over large (multi-square kilometer) areas of coastline quickly and at a relatively low cost as compared to a ground-based approach. Further, the digital elevation models (DEMs) generated from these systems (particularly LiDAR) can both derive accurate MHW shoreline positions [22] and produce topographic surface models, whose resolution enables investigators to observe details across large areas at sub-meter scales [21,23].
In this article, we exploit these new technologies, and the derivative high-resolution DEMs, to introduce the center of mass (CM) as a further complement to traditional coastal assessment measures, such as the established ocean shoreline position and volume metrics. In doing so, our objectives are two fold. First, we will describe the CM as an extension of the analogous concept from elementary Newtonian mechanics into geomorphology, as well as demonstrate the GIS as a capable and fitting environment for generating, tracking and visualizing this mass center. Second, we will apply the CM concept in a GIS environment in an attempt to prove the concept, by using the CM to measure and track aggregate motion across two contrasting barrier islands, one in a near-natural state and the other having undergone human alteration, over a short span of time.
2. Study Area
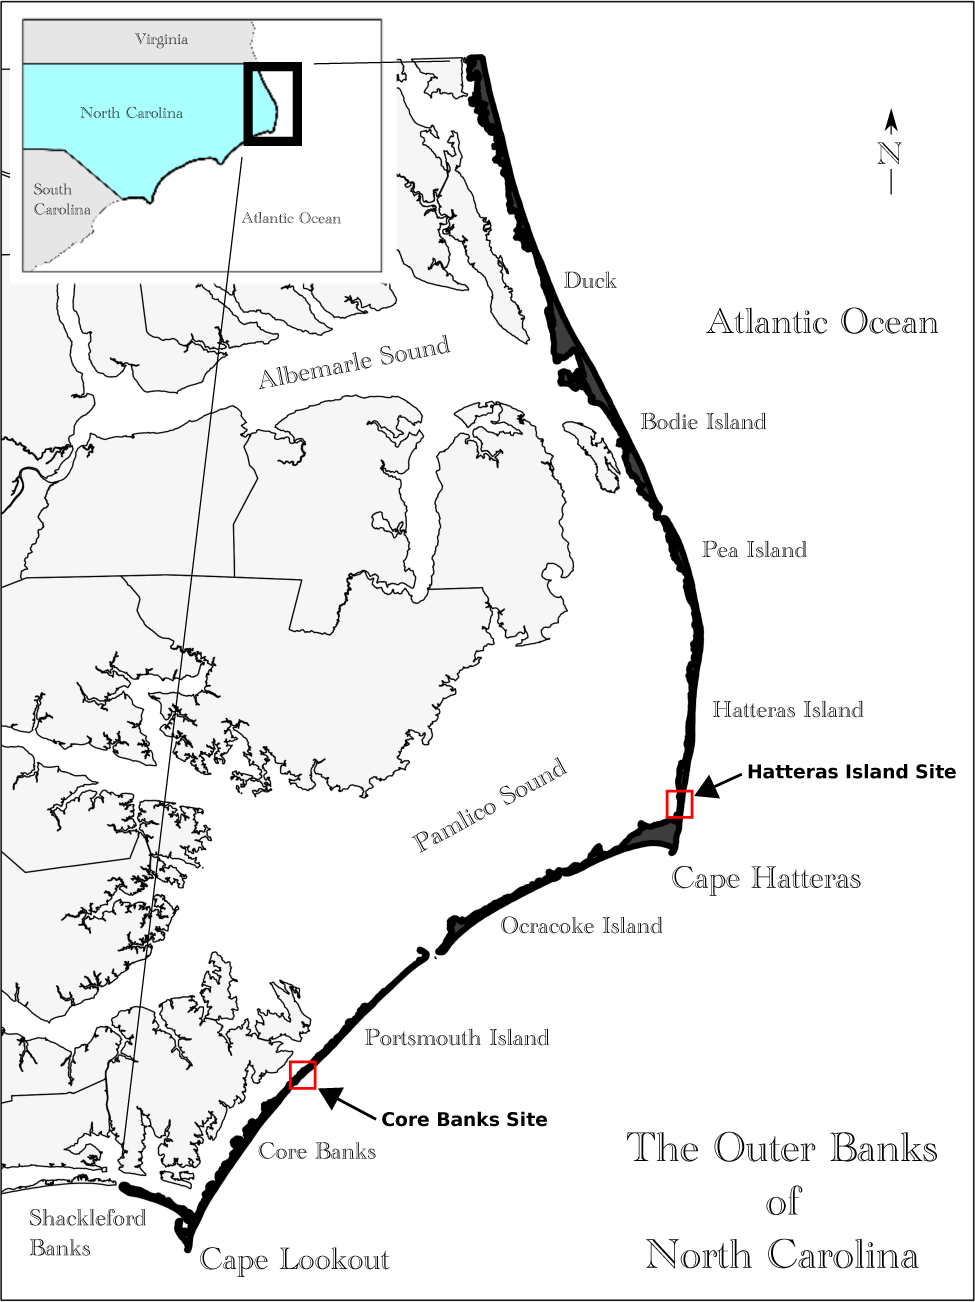
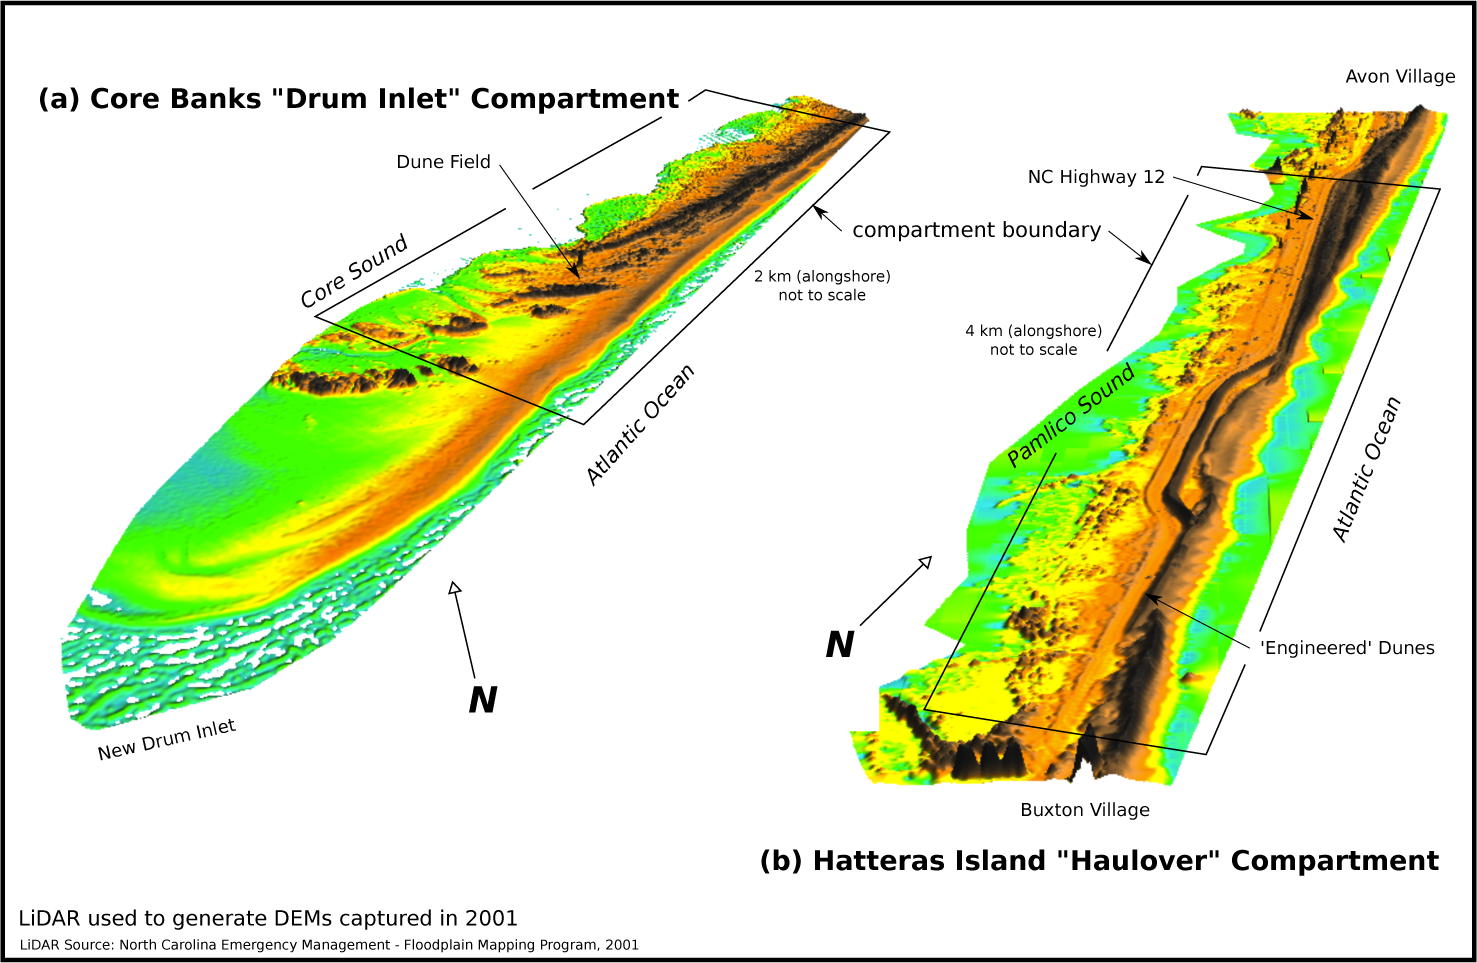
To realize the second objective of this research and to demonstrate the viability of the mass center analysis concept, two small barrier island study sites were selected along the North Carolina Outer Banks. The Outer Banks (see Figure 1) are a chain of transgressive spit and barrier island features that span approximately 250 km from the Virginia-North Carolina border south to Shackleford Banks [24].
The first island site chosen (refer to Figures 1 and 2) is a two kilometer section located at the southern end of the Outer Banks on Core Banks. Core Banks extends for 72 km between Cape Lookout and Ocracoke Inlet. It was selected for this research for its lack of human-influenced morphology. The barrier island is undeveloped, with no paved roads, little large-scale human modification and no permanent human habitation. Core Banks is considered to be a natural barrier island system [25].
The second site selected is a four-kilometer section located along Hatteras Island in the Cape Hatteras National Seashore (see Figures 1 and 2). Unlike its Core Banks counterpart, this site, as with most of Hatteras Island, has been topographically altered by the installation of a series of continuous, shore parallel, ocean-fronting dunes [26]. These dunes, initially placed in the 1930s and amended in the 1950s [26], have changed the way the island responds to high energy storm events, such that Hatteras Island no longer reacts to these forces as it did prior to dune placement. In this research, Hatteras Island will represent the human-altered environment.
3. Methods
Five (LiDAR) datasets were downloaded from NOAA’s Coastal Service Center, each for the Core Banks and Hatteras Island study sites along North Carolina’s Outer Banks. The series for the Core Banks location include data from 1997, 2001 and 2005. For Hatteras Island, LiDAR captured in 1996, 2001 and 2009 was obtained.
Two additional LiDAR datasets were also acquired for both study sites. The first was captured following Hurricane Irene’s landfall in August 2011. Irene crossed the North Carolina coast near Cape Lookout on 27 August 2011. The post-Irene flight was conducted on 28 and 29 August. A second post-storm mission from 2012 in association with Hurricane Sandy, which impacted the Outer Banks in late October 2012, was also included. Both post-hurricane compilations are included here to provide some limited insights into how the island systems responds to a high energy storm event, as well as to test the response of the island mass center metric to such events.
Each LiDAR dataset was interpolated into a digital elevation model (DEM) using the open-source GRASS (Geographic Resources and Analysis Support System) GIS. GRASS’ regularized spline with a tension interpolator was used with a cell resolution of 1 m.
Volume and Center of Mass: Mass centers and total volumes were next computed for each 2-km island site. Volumes (Equation (1)) were computed in GRASS GIS by multiplying the zij, here the island surface’s elevation above mean high water (MHW), assigned to each grid cell in the compartment DEM by the grid cell area, a.
Volume units are in cubic meters.
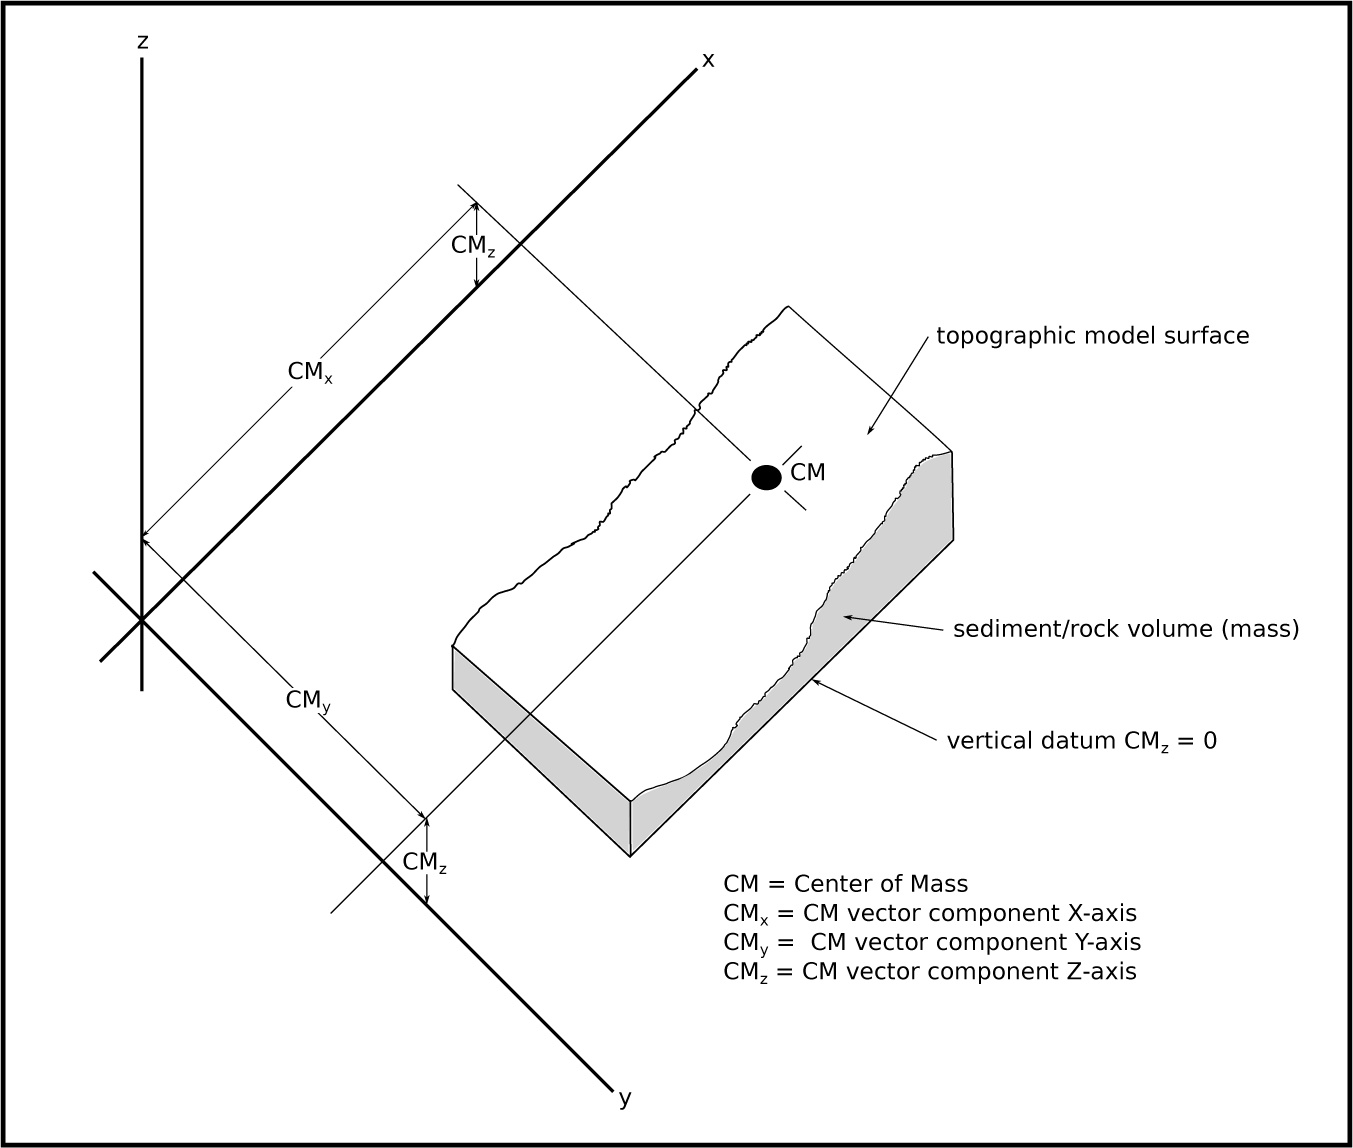
Center of Mass Defined: The center of mass in three-dimensional space (Figure 3) can be expressed as:
The particle masses can be represented as the product of the particle density and its volume; thus, an equivalent form is:
We can compute the center of mass from a barrier island or beach volume, or any other non-zero mass body in a georeferenced frame, using these equations within a GIS environment. To do this, we consider the discrete case of continuous Equations (5) and (6a–6c):
This permits the integration, or summation, of the discrete masses across a raster surface using a GIS, where those masses are represented as the product of the cell volume and its associated density (ρ * V).
The subscript, ⊞, indicates that the factor is a raster surface.
The density surface (ρ⊞) would ideally reflect variations in the actual surface and subsurface density for the area under study; however, here, we will assume a simple, homogeneous field of 2,650 kg/m3 (an island built from pure quartz sand). We further represent the position vectors (r) as raster surfaces where the raster cells each contain the x and y positions, respectively, for the cell’s geometric centroid. Computation for the component CMs (CMx, CMy, and CMz) then proceeds as:
CMx, CMy and CMz are component scalars indicating the CM position in 3D space. Coordinate space is based on the coordinate system orientation for the position surfaces, rx and ry.
Mass center computations are based on Equation (2) and are computed for analysis in GRASS using Equations (8)–(10). Derivation of the mass center constituents (CMx, CMy and CMz) was also conducted in GRASS by treating each factor in the center of mass formulae as a continuous raster surface. More information on the implementation is available from the authors.
The center of mass position is computed for three-dimensional space and represented graphically in three dimensions using displacement diagrams. The displacement diagrams introduced in the Results Section of this article show the path of the CM through time within the study area compartment. The mass centers are depicted in the diagrams by circular glyphs, whose size (diameter) is in proportion to the total computed compartment volume. Proportionality is scaled such that small differences in volume can be ascertained visually. The position of the glyph marks the position of the mass center. The base projection surface for the displacement diagram is a representative hill-shade for the compartment.
Displacement is shown in the diagrams using vectors that reveal the magnitude and direction of change in (x-y) the mass center position through time. The magnitude of the vector (the total displacement distance between mass centers) is also displayed numerically on the diagram adjacent to the vector trace. Finally, changes in the vertical (elevation) position of the center of mass are indicated numerically on the diagrams.
It is proposed that the center of mass as described above can be used to determine shifts in sediment mass (volumetric shifts) through time. From this, one can infer net shorter-and longer-term effects associated with the redistribution of sediment, and bulk sediment transport, across and along an island. Moreover, it is proposed that the change in mass center position can also be used, particularly in concert with other evidence, to infer changes in position for the entire island. That is, measured quantitatively, the island’s migration distance, and path, through time in response to periods of increased storm activity, as well as against local and eustatic sea level rise.
Data Error: Vertical resolution checks on the LiDAR derived DEMs revealed an approximate systematic shift in the Hatteras Island data for both 2001 and 2011. Comparison with North Carolina Department of Transportation Highway 12 baseline benchmarks indicated a mean elevation underestimation of 0.2 m in the 2001 data for both Core Banks and Hatteras Island and a 0.441 m overestimation in that for 2011 on Hatteras Island. As a result, 0.2 m was added to both 2001 DEMs and 0.441 m was subtracted from the 2011 DEM for Hatteras to generate the final models. Models for 1996, 2009 and 2012 on Hatteras Island and 1997, 2005 and 2012 for Core Banks were used without adjustments in the analysis. No additional error analysis was performed on the resulting DEMs.
The LiDAR data used to generate the DEMs in this investigation contains additional errors that accumulate due to aircraft positioning, atmospheric effects, sensor instrumentation inaccuracies and other sources associated with capture and post-capture processing. Horizontal error for the LiDAR returns used in this study is approximately one to 2 m. Vertical error is approximately 15 cm [23].
Change Surfaces: A change surface is generated in GRASS GIS using the command r.series with the slope option. r.series with a slope uses corresponding cell values in each included input raster surface and fits a linear model (regression line) to the values. The slope of the resulting line is then assigned to the output raster’s corresponding cell. This is repeated for all cells contained in the input rasters.
The interpretation of this slope in this study is the rate of change in a cell’s surface elevation over time. If the slope is positive, the elevation is increasing, which indicates accretion. If the slope is negative, the cell’s surface elevation is decreasing, and so, net erosion is occurring. Along Core Banks, the input DEMs to r.series include 1997, 2001 and 2005. For Hatteras Island, the DEMs represent 1996, 1999, 2001, 2008 and 2009.
Difference Surfaces: A difference surface is generated by subtracting one raster layer from another. These surfaces were generated to assess some possible impacts associated with Hurricane Irene. However, the relatively long time span between the before surface (for Core Banks, 2005; for Hatteras Island, 2009) and the 2011 post-hurricane survey make it difficult to quantitatively assess how much of the change seen is storm induced versus that associated with the evolution of the longer period spanned by the input data. Some useful qualitative information can, however, be gleaned that might shed some light on storm-associated change.
4. Results
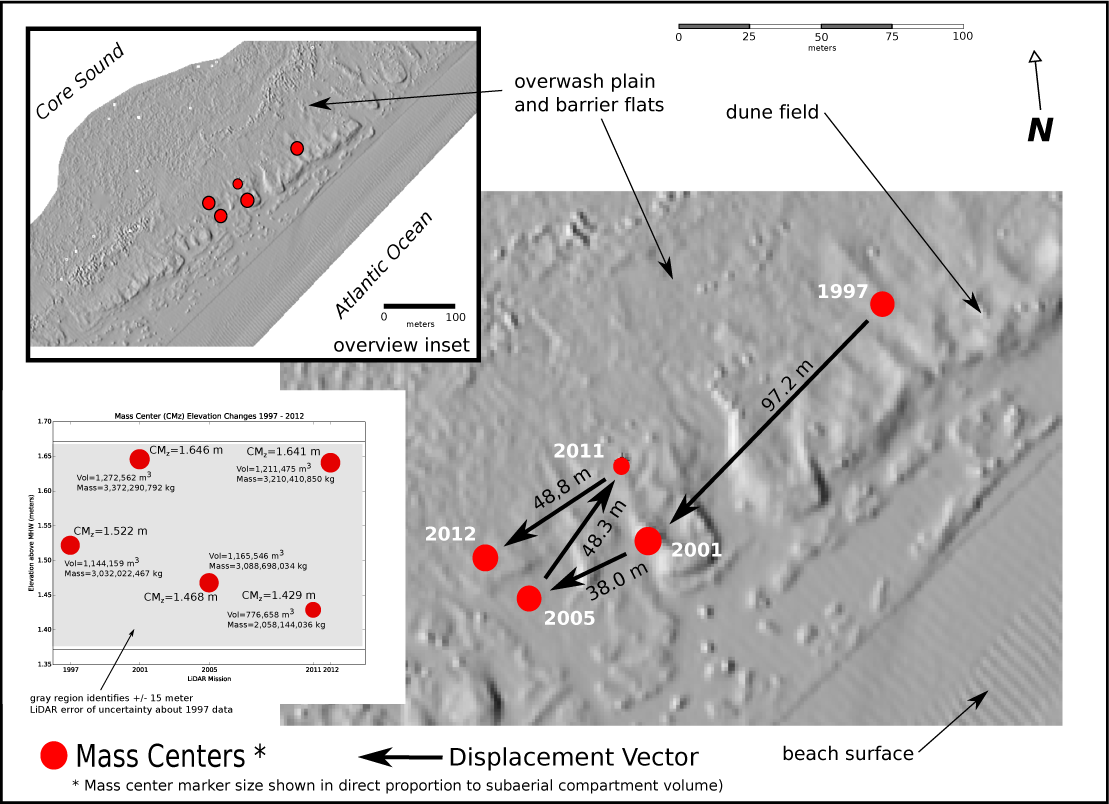
Along the Core Banks site mass center positions (CMs) mapped from 1997 through 2012, as seen in Figure 4, reveal a general drift alongshore to the south and west. Between 1997 and 2001, the CM moved 97 m to the southwest. It shifted an additional 38 m southwest in the subsequent interval between 2001 and 2005. An interruption in the southwesterly trend came between 2005 and 2011 (post-Irene), when the CM shifted almost 50 m (48.3 m) to the northeast. In the year that followed, 2012, the earlier southwest trend resumed, recovering all of the retrograde 48 m displacement recorded for the prior period. The cross-shore position for 2012 had, however, shifted slightly further westward relative to the 2011 position. Vertical changes in the CM exhibit much less variability than is seen in the horizontal components. The inset in Figure 4 shows the changes in CMz through the 1997 to 2012 study period for Core Banks. The vertical drift for the 15 year period is less than 25 centimeters. Consider this range in light of the ±15-cm vertical uncertainty associated with the source LiDAR data, the range of which is depicted by the gray band across the scatter plot of Figure 4.
Total subaerial material (sand) volumes (Figure 4 inset) ranged from a high of 1,272,562 cubic meters in 2001 to a low during 2011 of 776,658 cubic meters. Total volume in 2011 dropped some 61 percent below 2001 maximum values.
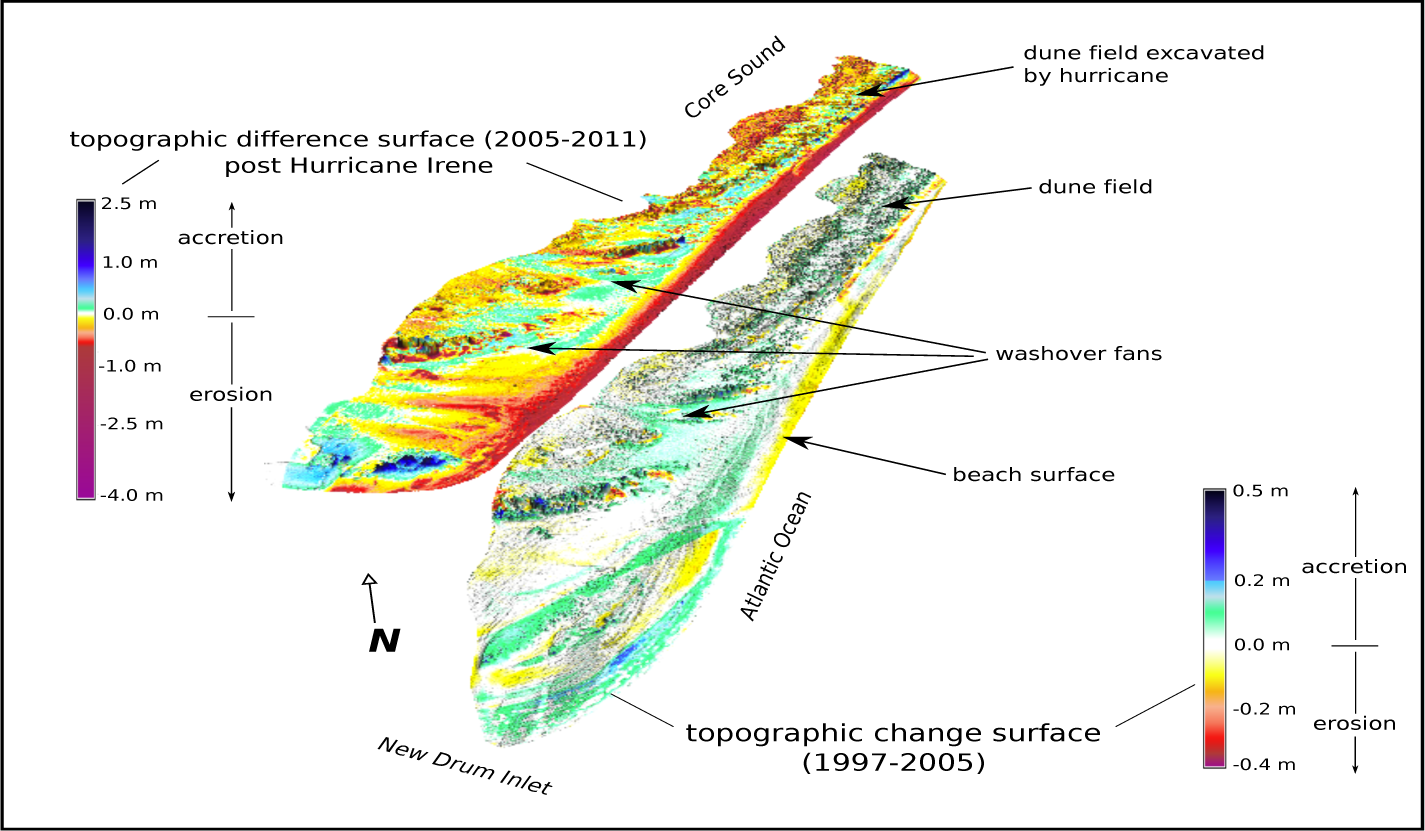
Figure 5 (lower island graphic) shows the distribution and intensity of topographic change (erosion/accretion) seen across the Core Banks site for the years 1997, 2001 and 2005. Minor erosion is seen (in yellow) across much of the ocean beach. Near New Drum Inlet to the southeast, and along the Core Banks (marsh) shoreline, the island was accreting during the same time period. The dune fields landward of the beach exhibit mild accretion (light green shading). Several overwash fans are also noted toward the southwestern third of the island.
A second difference surface is also included in Figure 5 (upper island graphic). This surface shows the changes in Core Banks topography from 2005 to 2011. Here, much greater change is obvious. The beach and parts of the fore dune field (dark red) lost considerable sediment (sand) mass, while select portions of the interior and along the Core Sound shoreline show moderate erosion. Many more washover fans and terraces are noticeable on the surface, blanketing sections of the interior and in places, the back-island areas, with sand. Some significant dune field loss is seen toward the northeastern end of the section.
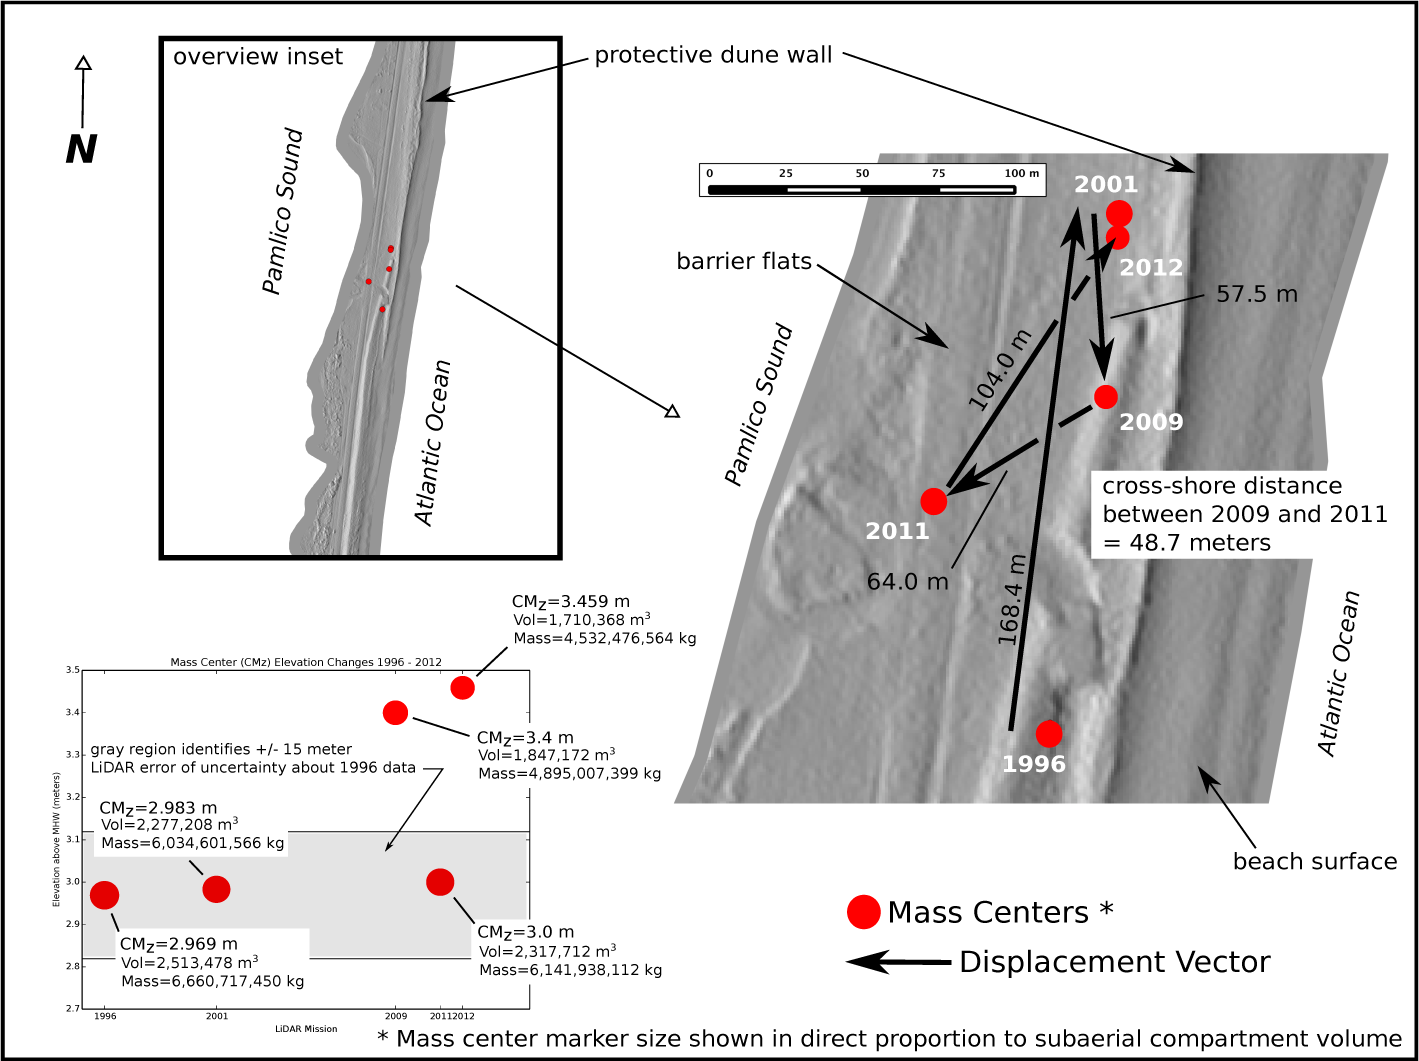
At the Hatteras Island site, mass centers were tracked for 16 years, from 1996 through 2012. Mass center positions are shown in Figure 6. As can be seen in the figure, CM changes, like those at Core Banks, are largely confined to motion alongshore. Unlike the changes seen along Core Banks, however, where there is a notable southwesterly trend in the CM’s position, the Hatteras site seems to offer no such readily discernible bias. The single variant CM is that representing data collected for 2011.
Between 2009 and the 2011, the CM shifted some 50 m (48.7 m) to the west, across-shore, and approximately 73 m, alongshore. The resultant displacement was 54 m to the southwest. During the subsequent interval from 2011 to 2012, the CM recovered much of the 50-m cross-shore, westerly shift, but had also moved back to the north, alongshore, to a position close to that recorded 11 years earlier, in 2001.
Vertical shifts in the mass centers (CMz) for the 1996 through 2012 period are shown in the inset plot of Figure 6. As with the Core Banks data discussed earlier, the Hatteras CMz positions are plotted in the context of the elevation uncertainty (vertical error of ±15 cm) associated with the source LiDAR data. The Hatteras CMz values are both larger in absolute value (all exceed 2.9 m above MHW) and show more vertical variation (almost 50 cm) than their Core Banks counterparts. Prior to 2001, the CMz was at or below 3 m. In the interim between 2001 and 2009, the CMz increased by more than 40 cm to approximately 3.4 m above MHW. For 2011, the CMz dropped to near pre-2009 levels, before recovering for the 2012 survey, where the CMz reached its apex for the 16-year study period.
Total subaerial volumes at the Hatteras site range from 1,710,368 cubic meters in 2012 to a peak of 2,513,478 cubic meters in 1996. This is a difference of some 803,110 cubic meters, or 68 percent. Ironically, the minimum volume coincides with the highest (2011) CMz position, while the maximum volume is seen in 1996, when the CMz was at its nadir. Only the 2009 and 2012 CMz positions lie outside the 15-cm vertical uncertainty threshold associated with the source LiDAR data.
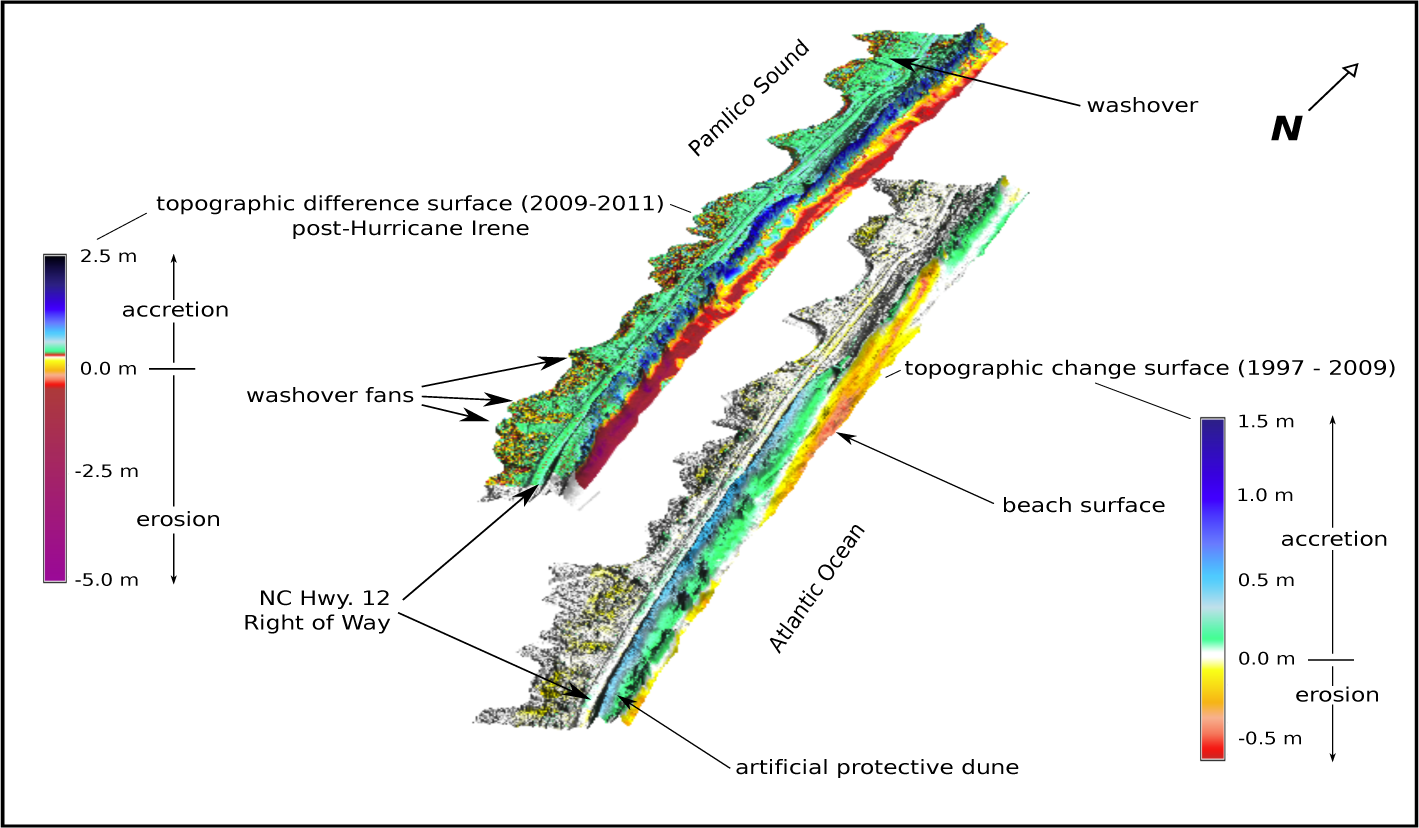
The topographic change surface for Hatteras Island is seen in Figure 7 (the lower surface in the figure). In contrast to Core Banks (Figure 5), there seems to be a distinct partitioning of erosion and accretion zones across-shore at the Hatteras site. Erosion (yellows and reds) dominates most of the beach surface, while the adjacent dune system to the west, particularly across the center of the island, experienced mild accretion (greens and blues). Behind the dunes and NC Highway 12, there has been only a very minor amount of erosion along the Pamlico Sound shoreline. Much of the interior has seen little change over the period.
The difference surface between the 2009 and 2011 for the Hatteras Island site is shown in the upper model seen in Figure 7. Much of the ocean beach, and particularly at the south end of the study site (dark reds and violets), experienced high erosion (>2.5 m in some places) during the interval, while the tops of the dune system recorded gains (shown in blue). Behind the dunes, washover fans and terraces are conspicuous along the island. Additional deposition is also noted all across the NC Highway 12 right-of-way.
5. Discussion
From Figure 4, it is clear that mass center change at the Core Banks site, for the duration of this study, is predominately alongshore. Such behavior is consistent with the reported net southwesterly longshore sediment transport for the island [27,28] and prevalent northeasterly winds of fall and winter.
The magnitude of the cross-shore changes at Core Banks CMs are less by an order of magnitude than those alongshore. This behavior was maintained even with the DEMs recorded following Hurricane Irene in 2011 and Hurricane Sandy in 2012. As is evidenced by the difference surface for Core Banks seen in Figure 5, beach retreat and overwash were significant along the barrier island in the post-Irene data. This difference surface, however, reflects a change between 2005 and 2011. The six-year span between the pre and post-storm records makes it impossible to know exactly how much impact Hurricane Irene alone had on the CM.
A year later, in 2012, much of the 2005–2011 retrograde motion of the CM alongshore was recovered. Total subaerial volume was also restored to near peak 2001 levels (Figure 4). The cross-shore change, however, was not negated, but instead, had shifted further westward.
During this eight-year study, based on changes in the position of the CM, the cross-shore component was measured to be 15.2 m west. This yields an annual rate of approximately 1.9 m/year, which agrees in approximation with the findings of Moslow and Heron (1979) [29] and McNinch and Wells (1999) [27], where Core Banks migration rates are estimated to range between one and 3 m/year. Thus, it seems reasonable to entertain the possibility that the cross-shore behavior of the CM at Core Banks is reflective of the overall, longer-term trend in the island’s evolutionary migration through time.
The CM at the Cape Hatteras site also exhibits mostly alongshore motion. The direction of that drift is, however, not consistent (Figure 6). Longshore transport along Hatteras Island north of Cape Point is southerly. However, only during the period between 2001 and 2009 do we see the CM moving in accord with this longshore transport. While the CM shifted northward at Core Banks during the six years between 2005 and Hurricane Irene in 2011, at Hatteras, it moved to the southwest. If there is a pattern at the Hatteras site, it is much more difficult to discern than that observed for Core Banks.
Similarly, again like Core Banks, the general cross-shore drift in the CM is small, with one exception: that measured between 2009 and 2011. Over this period, the CM moved some 50 m west across the barrier island, relocating to a spot approximately half the distance between the dune system and the Pamlico Sound shoreline (Figure 6). This shift, coupled with the washover structures seen in the difference surface (upper model) in Figure 7, suggest dune breaching and partial failure, likely associated with Hurricane Irene in 2011. While the two-year span between pre-(2009) and post-(2011) storm surveys makes it difficult to place this change solely with the hurricane, it is not unreasonable to tie the partial failure (breaching) of the protective dune system, coupled with extensive sound-side flooding, seen in the 2011 DEM, to the storm’s passage.
The dunes that run the length of Hatteras Island, and much of the Cape Hatteras National Seashore, present a largely impermeable barrier between the ocean beach and the remainder of the island. Only during high energy storm events are these sometimes 8 m-high features breached and washover sands transported across to the rear of the island [30]. Further, when overwash does occur, the North Carolina Department of Transportation is quick to return much of this material back into a newly reconstructed dune system. Thus, under most situations, wave energy, and the concomitant active erosion/accretion zones, are confined to the beach and along the seaward-facing fore dune wall. The lack of counterpoising washover deposition has resulted in excessive narrowing along this segment of Hatteras Island [30]).
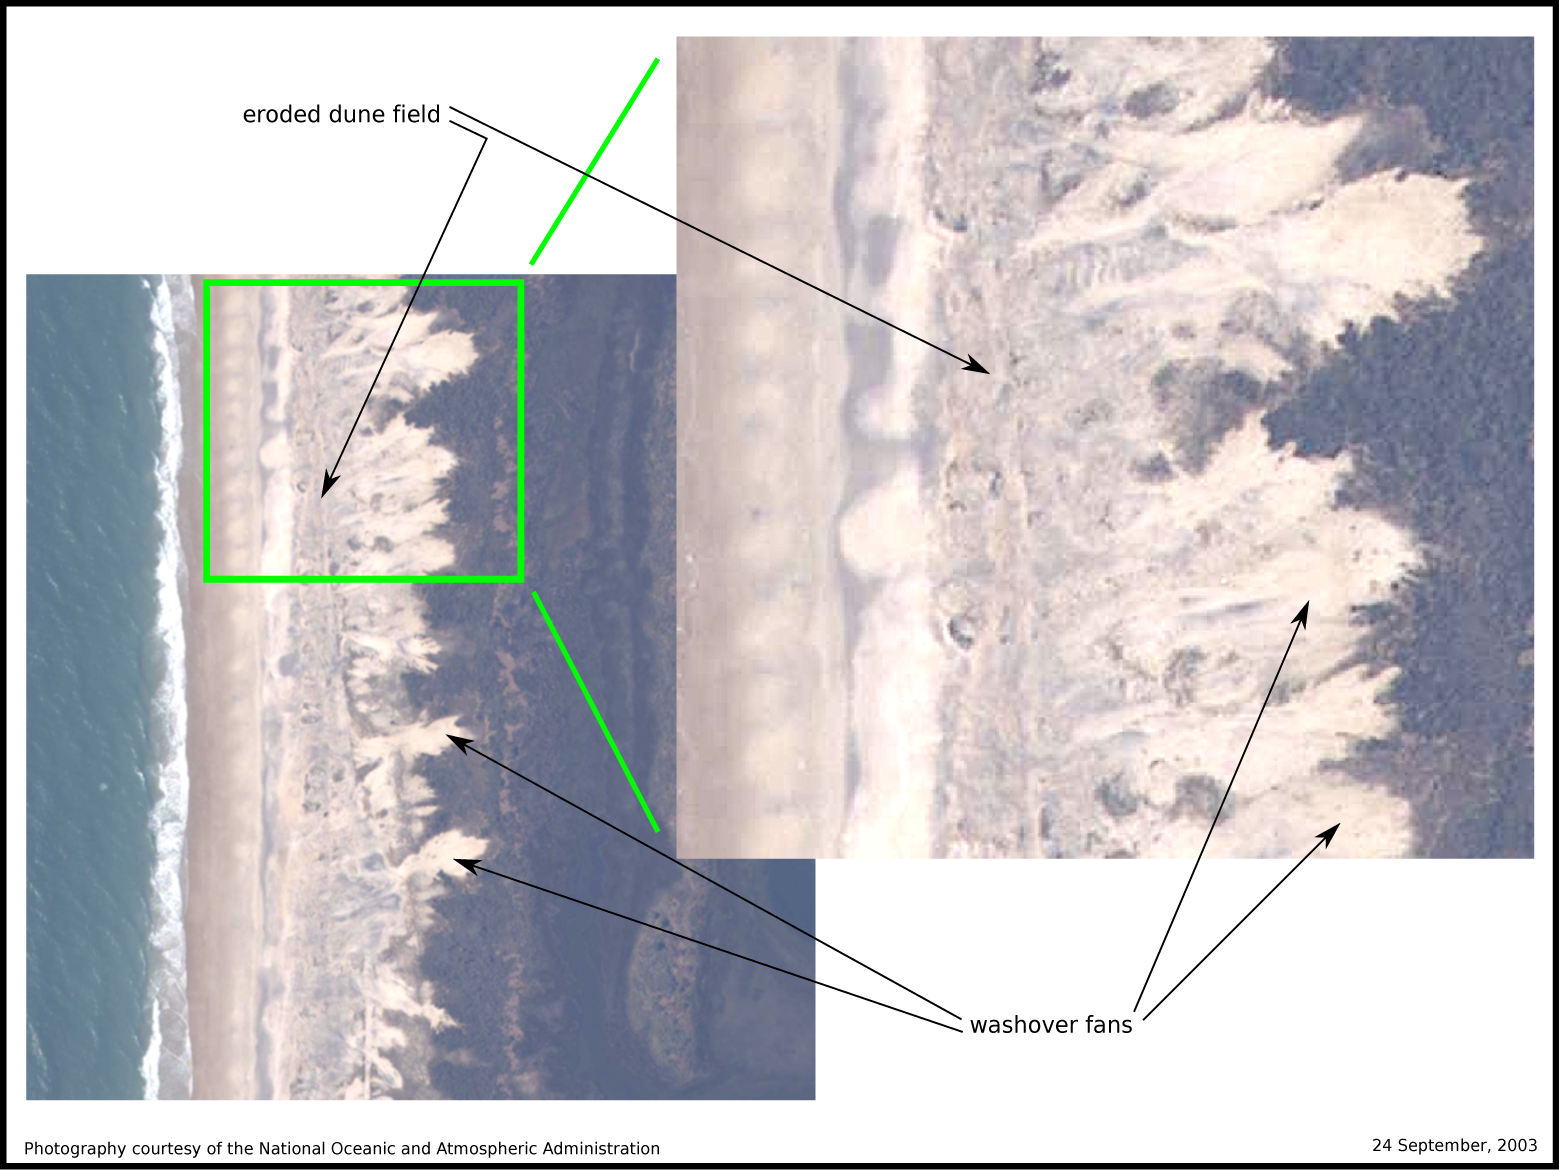
Less compartmentalization along Core Banks allows for sediment redistribution across the entire island. This is seen in the change surface from Figure 5. Based on the distribution of washover structures, the active zone in certain areas extends across the entire island. Washover is a common phenomena along Core Banks (Riggs and Ames, 2006). Significant cross-island overwash was recorded along Core Banks during Hurricane Ginger in 1971 [31], as well as for Hurricane Bonnie in 1998 [15] and, later, Hurricane Isabel in 2003 (see Figure 8).
Interestingly, the vertical component of the mass centers at both study sites exhibits limited net displacement. At Core Banks, the CMz varied by only 18 cm between 1997 and 2005 (Figure 4). The CMz fell to 1.43 m from 1.47 m between 2005 and 2011, a drop of only 3 cm. This displacement is well below the magnitude of error (±0.15 m) associated with the vertical component of the source data. A similar response is seen at the Hatteras site (Figure 6), though the ranges are larger (approximately 49 cm, overall, between 1996 and 2012). The continued maintenance and periodic reconstruction of the protective dune system at Hatteras could explain some of the behavior seen here. This is, however, not the case along unaltered Core Banks. Thus, we might conclude that the CMz is not sufficiently sensitive to offer any meaningful information on island evolution. Additional testing will be required to ascertain the true sensitivity and significance of the CMz.
6. Conclusions
This study had a two fold objective. The first was to extend an idea from classical Newtonian mechanics, the center of mass (CM), into the realm of geomorphology via GIS as a novel means to quantitatively describe large-scale changes within a landscape. The second was to apply the CM in a rudimentary proof of concept study to ascertain its potential usefulness in measuring such change. The two sites selected for the study, Core Banks and Hatteras Island, both located along North Carolina’s Outer Banks, offered prime locations for this proof of concept in that there is both available data and a wealth of supporting research that we have at our disposal to build upon in this work. In addition, both locations consist of unconsolidated barrier islands, along high energy ocean coasts, a combination that results in relatively large morphological change over short time spans.
Along Core Banks, the CM displacement was principally alongshore, in line with the dominant southwesterly longshore transport. A subordinate cross-shore displacement was also detected. Motions along both the alongshore and cross-shore axes appear to be in accord with estimates from previous investigations [27,29] and as reported by Riggs and Ames (2006) [32]. It is conjectured that the cross-shore component of motion along Core Banks reflects longer-term migration of the island in response to local and eustatic sea level rise.
At Cape Hatteras, CM displacement was erratic, with little or no trend, as was suggested along Core Banks. This was attributed in large measure to the existence of the protective dunes, which prevent island overwash and subsequent migration [30]. Only in the immediate aftermath of Hurricane Irene, when the dune system was partially compromised and washover sediments flooded the backside of the island, did the CM move significantly across shore. This change was quickly rectified after Hurricane Irene’s passage by the State of North Carolina to rebuild the breached dunes to their pre-storm state. Such recovery efforts are reflected in the subsequent 2012 survey and CM re-location.
Tempering these findings is the fact that this study accounts for less than two decades of island change (15 years along Core Banks, 16 years for the Cape Hatteras site). Though a decade of change might reveal evidence for any trends in shoreline change [33], it is unclear as to whether such a short time span is sufficient to allow us to draw any definitive conclusions regarding the motions of either island system or the proposed CMs ability to detect and measure it.
Moreover, while both sites selected for this investigation are considered sufficient to illustrate the CM concept as is presented here, each are geographically small and, for their positions, not likely representative of the overall geomorphic character of their respective host islands. The Core Banks site, for instance, is positioned near New Drum Inlet, whose influence is likely reflected in the results presented here. Similarly, the Hatteras Island site is an erosional hot spot, whose behavior is not necessarily indicative of Hatteras Island as a whole.
A third caveat that warrants mention is the fact that the CM computations presented here, for the lack of bathymetric data, only address the subaerial component of the barrier island system. There is, however, a considerable fraction of these islands below the waterline, both in the nearshore and the adjacent estuary. The interactions and mass exchanges that occur between these subaerial and subaqueous provinces are significant, on-going and, thus, important in order to fully understand and explain island evolution, whether using the CM or any other metric.
Further research, using data collected over longer periods and greater geographic extents, along with bathymetry if possible, is needed beyond this proof of concept to derive and interpret CM trajectories, as well as to assess the true sensitivity and reliability of the metric as a reflector of wholesale geomorphic change. Never the less, while much more work still needs to be done to demonstrate the CMs efficacy, the developed model, and the results yielded thus far, would seem a good foundation upon which to begin further study.
Acknowledgments
The authors would like to acknowledge the National Oceanic and Atmospheric Administration’s Coastal Services Center and the State of North Carolina’s Department of the Environment and Natural Resources for providing the shoreline and LiDAR data used in this investigation. Three anonymous reviewers are gratefully acknowledged for their excellent critiques and suggestions for improvement; this article has benefited immensely for their contributions. The authors also wish to extend their gratitude to the many developers and others who give freely of their time to continually develop and improve the quality of offerings within the open-source GIS landscape. Both GRASS and QGIS were instrumental in the execution of the analyses presented here. This work was partially supported by a grant from the US Army Research Office, grant W911NF111014.
Author Contributions
Principal author Paul Paris conceived the idea to apply the Newtonian center of mass metric to a coastal geomorphic system, and developed and adapted the model to a Geographic Information System (GIS) environment. Paul Paris also prepared much of the original manuscript. Helena Mitasova, in addition to technical inputs associated with the mass center model development and the GIS, also edited large portions of the original manuscript to adapt the material for publication in a scholarly journal.
Conflicts of Interest
The authors declare no conflict of interest.
References
- Anders, F.; Byrnes, M. Accuracy of shoreline change rates as deter-mined from maps and aerial photographs. Shore Beach 1991, 59, 17–26. [Google Scholar]
- Crowell, M.; Leatherman, S.P.; Buckley, M.K. Historical shoreline change: Error analysis and mapping accuracy. J. Coast. Res. 1991, 7, 839–852. [Google Scholar]
- Dolan, R.; Hayden, B. Storms and shoreline configuration. J. Sediment. Res. 1981, 51, 737–744. [Google Scholar]
- Dolan, R.; Hayden, B. Patterns and Prediction of Shoreline Change. In CRC Handbook of Coastal Processes and Erosion; Komar, P., Ed.; CRC Press: Boca Raton, FL, USA, 1983; pp. 123–149. [Google Scholar]
- Honeycutt, M.G.; Crowell, M.; Douglas, B.C. Shoreline-position forecasting: Impact of storms, rate-calculation methodologies, and temporal scales. J. Coast. Res. 2001, 17, 721–730. [Google Scholar]
- Leatherman, S.P.; Williams, A.T. Vertical sedimentation units in a barrier island washover fan. Earth Surf. Process. Landf. 1983, 8, 141–150. [Google Scholar]
- Moore, L.J. Shoreline mapping techniques. J. Coast. Res. 2000, 16, 111–124. [Google Scholar]
- Pajak, M.J.; Leatherman, S. The high water line as shoreline indicator. J. Coast. Res. 2002, 18, 329–337. [Google Scholar]
- Shoshany, M.; Degani, A. Shoreline detection by digital image processing of aerial photography. J. Coast. Res. 1992, 8, 29–34. [Google Scholar]
- Smith, G.L.; Zarillo, G.A. Calculating long-term shoreline recession rates using aerial photographic and beach profiling techniques. J. Coast. Res. 1990, 6, 111–120. [Google Scholar]
- Zhang, Z.; Huang, W.; Douglas, B.; Leatherman, S. Shoreline position variability and long-term trend analysis. Shore Beach 2002, 70, 31–35. [Google Scholar]
- Brock, J.C.; Krabill, W.B.; Sallenger, A.H. Barrier island morphodynamic classification based on LiDAR metrics for North Assateague Island, Maryland. J. Coast. Res. 2004, 20, 498–509. [Google Scholar]
- Bonisteel-Cormier, J.; Nayegandhi, A.; Wright, C.W.; Brock, J.C.; Segura, M. The Application of LiDAR in Monitoring Barrier Island Volumetric Change and Shoreline Position at the Gulf Islands National Seashore, MS, Proceedings of the South-Central Section, GSA 45th Annual Meeting, New Orleans, LA, USA, 28–29 March 2011.
- Hardin, E.; Mitasova, H.; Overton, M. Quantification and Characterization of Terrain Evolution in the Outer Banks, NC, Proceedings of the Coastal Sediments 2011, Miami, FL, USA, 2–6 May 2011; pp. 739–753.
- Meredith, A.; Eslinger, D.; Aurin, D. An Evaluation of Hurricane-Induced Erosion along the North Carolina Coast Using Airborne LiDAR Surveys; Technical Report NOAA/CSC/99031-PUB; NOAA Coastal Services Center: Charleston, SC, USA, 1999. [Google Scholar]
- Mitasova, H.; Hardin, E.; Overton, M.; Kurum, M. Geospatial analysis of vulnerable beach-foredune systems from decadal time series of LiDAR data. J. Coast. Conserv. 2010, 14, 161–172. [Google Scholar]
- Mitasova, H.; Overton, M.F.; Recalde, J.J.; Bernstein, D.J.; Freeman, C.W. Raster based analysis of coastal terrain dynamics from multitemporal LiDAR data. J. Coast. Res. 2009, 25, 507–514. [Google Scholar]
- Pearre, N. Automated Large-Scale Shoreline Variability Analysis from Video, Proceedings of American Geophysical Union Fall Meeting 2006, San Franscisco, CA, USA, 11–15 December 2006.
- Robertson, W.V.; Zhang, K.; Whitman, D. Hurricane induced beach change derived from airborne laser measurements near Panama City, Florida. Mar. Geol. 2007, 237, 191–205. [Google Scholar]
- Smith, R.K.; Bryan, K.R. Monitoring beach face volume with a combination of intermittent profiling and video imagery. J. Coast. Res. 2007, 23, 892–898. [Google Scholar]
- Woolard, J.W.; Colby, J.D. Spatial characterization, resolution, and volumetric change of coastal dunes using airborne LiDAR: Cape Hatteras, North Carolina. Geomorphology 2002, 48, 269–287. [Google Scholar]
- Stockdon, H.; Sallenger, A., Jr.; List, J.; Holman, R. Estimation of shore-line position and change using airborne topographic lidar data. J. Coast. Res. 2002, 18, 502–513. [Google Scholar]
- Sallenger, A., Jr.; Krabill, W.; Swift, R.; Brock, J.; List, J.; Hansen, M.; Holman, R.; Manizade, S.; Sontag, J.; Meredith, A.; et al. Evaluation of airborne topographic lidar for quantifying beach changes. J. Coast. Res. 2003, 19, 125–133. [Google Scholar]
- Dunbar, G.S. Historical Geography of the North Carolina Outer Banks; Louisiana State University Press: Baton Rouge, LA, USA, 1958. [Google Scholar]
- Riggs, S.R.; Ames, D.V.; Culver, S.J.; Mallinson, D.J.; Smith, C.G.; Corbett, D. R. Geomorphic, Time-Slice Mapping of Dynamic Barrier Islands, North Carolina’s Outer Banks: A Basis for Prudent Management, Proceedings of the 2004 GSA Annual Meeting, Denver, CO, USA, 7–10 November 2004; 36, pp. 123–123.
- Birkemeier, W.; Dolan, R.; Fisher, N. The evolution of a barrier island: 1930–1980. Shore Beach 1984, 52, 2–12. [Google Scholar]
- McNinch, J.; Wells, J. Sedimentary processes and depositional history of a cape associated shoal, Cape Lookout, North Carolina. Mar. Geol. 1999, 158, 233–252. [Google Scholar]
- Park, J.; Wells, J.T. Longshore transport at Cape Lookout, North Carolina: Shoal evolution and the regional sediment budget. J. Coast. Res. 2005, 21, 1–17. [Google Scholar]
- Moslow, T.; Heron, S. Quaternary Evolution of Core Banks, North Carolina: Cape Lookout to New Drum Inlet. In Barrier Islands; Leatherman, S., Ed.; Academic Press: New York, NY, USA, 1979; pp. 211–236. [Google Scholar]
- Smith, C.G.; Culver, S.J.; Riggs, S.R.; Ames, D.; Corbett, D.R.; Mallinson, D. Geospatial analysis of barrier island width of two segments of the outer banks of North Carolina, USA: Anthropogenic curtailment of natural self-sustaining processes. J. Coast. Res. 2008, 24, 70–83. [Google Scholar]
- Dolan, R.; Godfrey, P.J. Effects of hurricane ginger on the barrier islands of North Carolina. Geol. Soc. Am. Bull. 1973, 84, 1329–1334. [Google Scholar]
- Riggs, S.; Ames, D. Effect of Storms on Barrier Island Dynamics, Core Banks, Cape Lookout National Seashore, North Carolina, 1960–2001; Scientific Investigations Report 2006-5309; US Geological Survey: Reston, VA, USA, 2006. [Google Scholar]
- Camfield, F.E.; Morang, A. Defining and interpreting shoreline change. Ocean Coast. Manag. 1996, 32, 129–151. [Google Scholar]


© 2014 by the authors; licensee MDPI, Basel, Switzerland This article is an open access article distributed under the terms and conditions of the Creative Commons Attribution license (http://creativecommons.org/licenses/by/3.0/).
Share and Cite
Paris, P.; Mitasova, H. Barrier Island Dynamics Using Mass Center Analysis: A New Way to Detect and Track Large-Scale Change. ISPRS Int. J. Geo-Inf. 2014, 3, 49-65. https://doi.org/10.3390/ijgi3010049
Paris P, Mitasova H. Barrier Island Dynamics Using Mass Center Analysis: A New Way to Detect and Track Large-Scale Change. ISPRS International Journal of Geo-Information. 2014; 3(1):49-65. https://doi.org/10.3390/ijgi3010049
Chicago/Turabian StyleParis, Paul, and Helena Mitasova. 2014. "Barrier Island Dynamics Using Mass Center Analysis: A New Way to Detect and Track Large-Scale Change" ISPRS International Journal of Geo-Information 3, no. 1: 49-65. https://doi.org/10.3390/ijgi3010049