Application of Metabolic 13C Labeling in Conjunction with High-Field Nuclear Magnetic Resonance Spectroscopy for Comparative Conformational Analysis of High Mannose-Type Oligosaccharides

Abstract
:
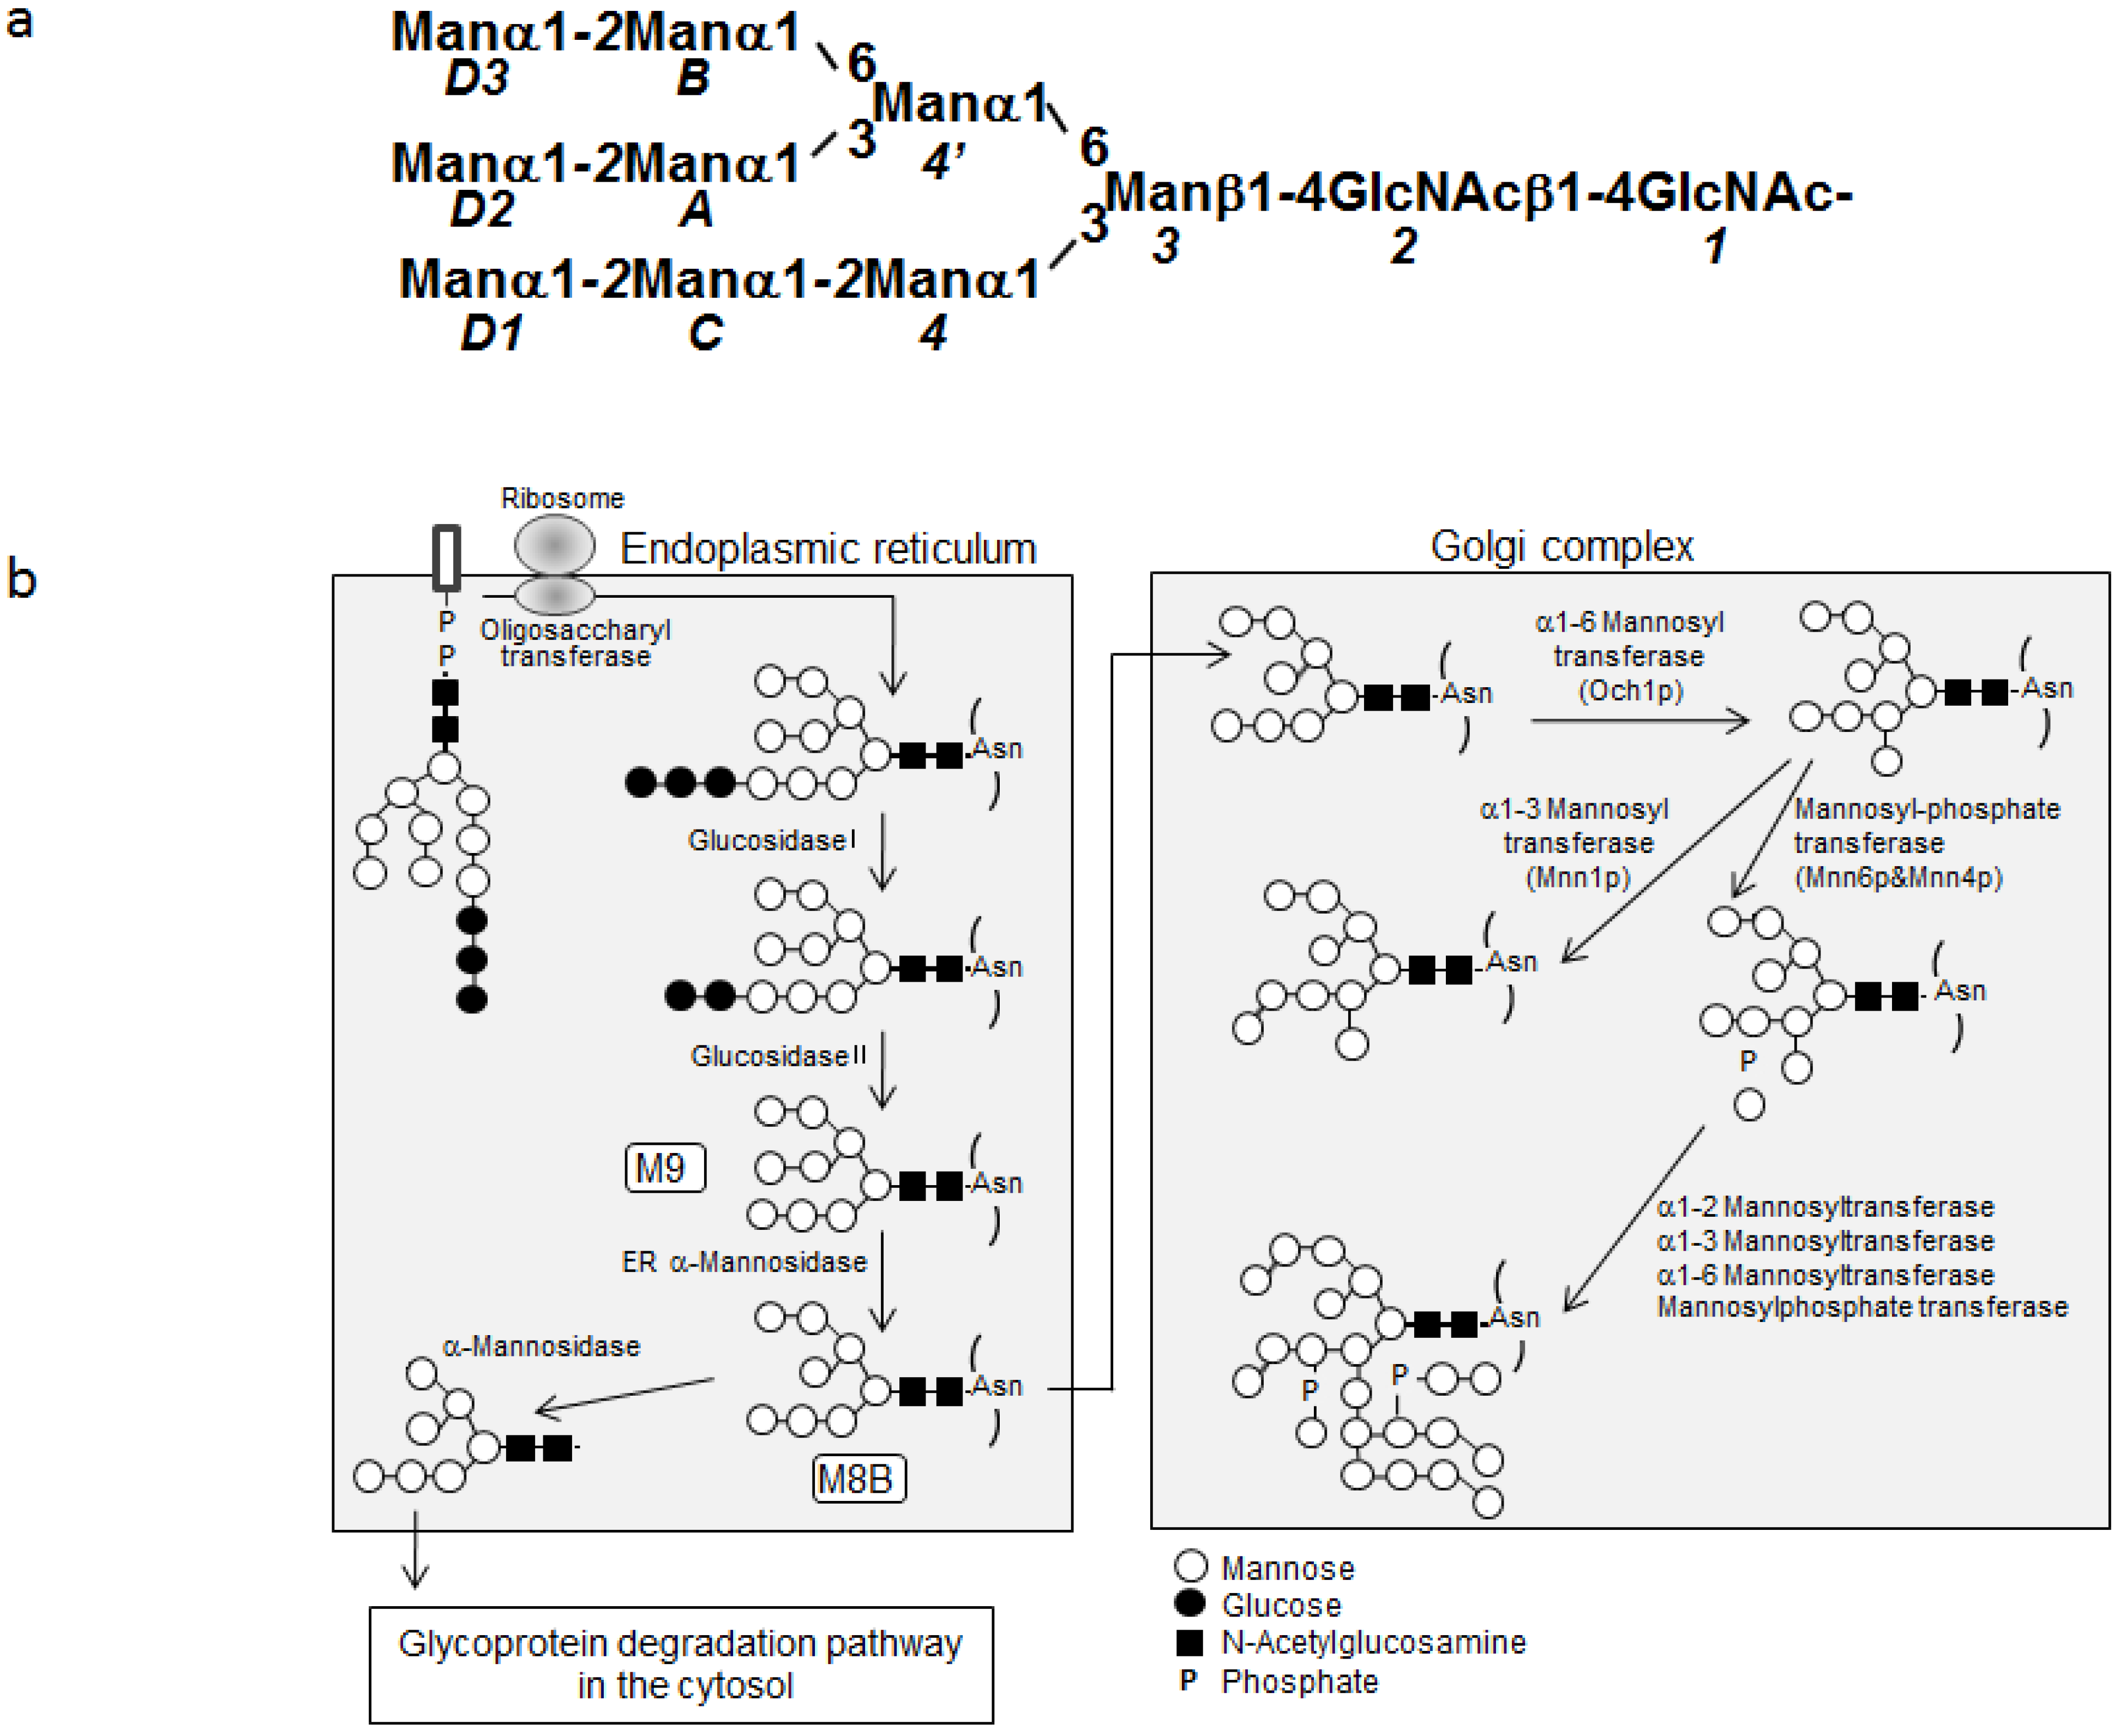
1. Introduction
2. Results
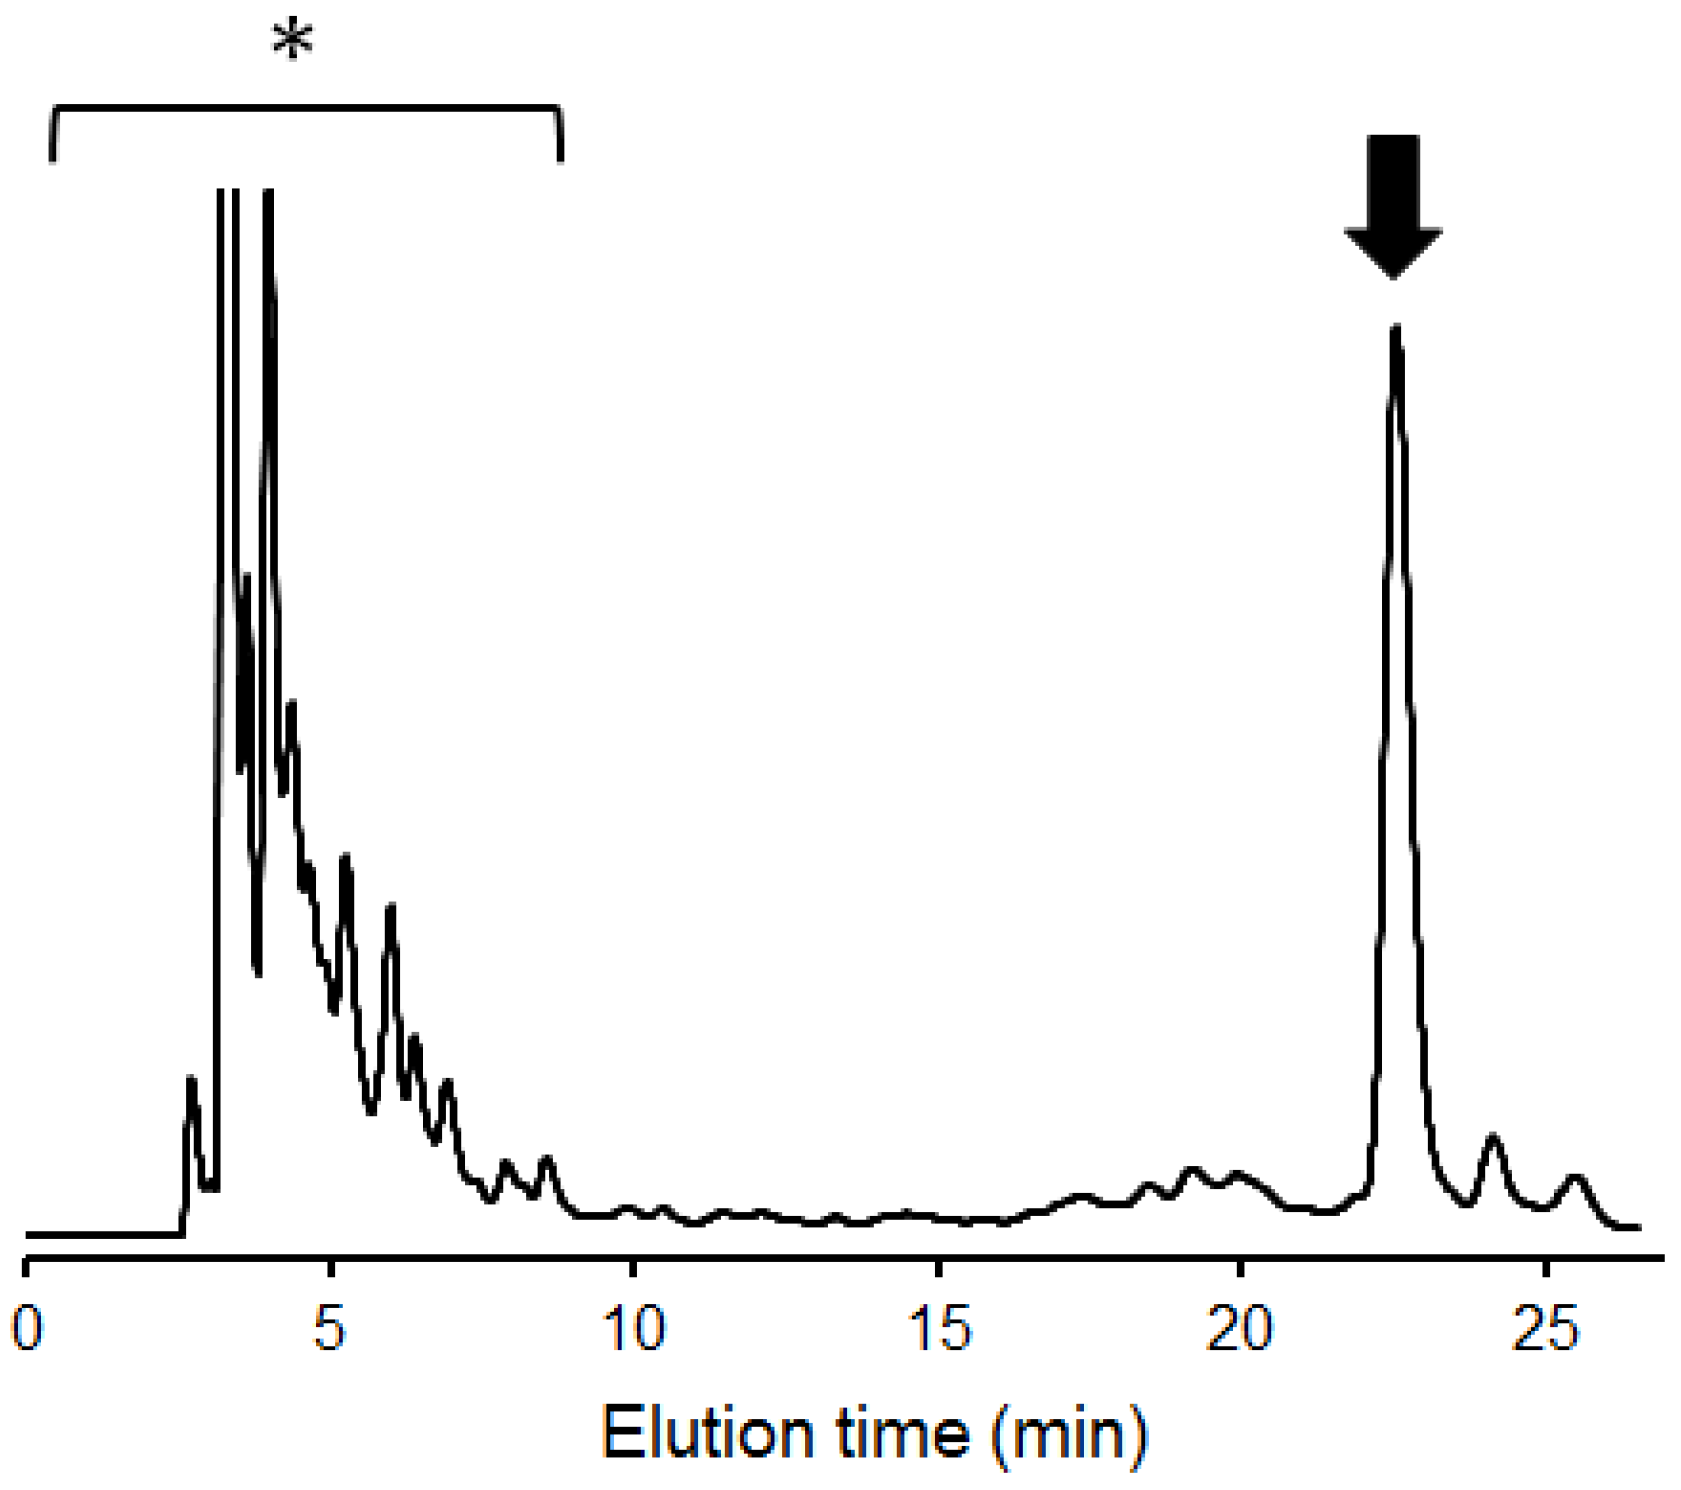
2.1. Overexpression of 13C-Labeled M9

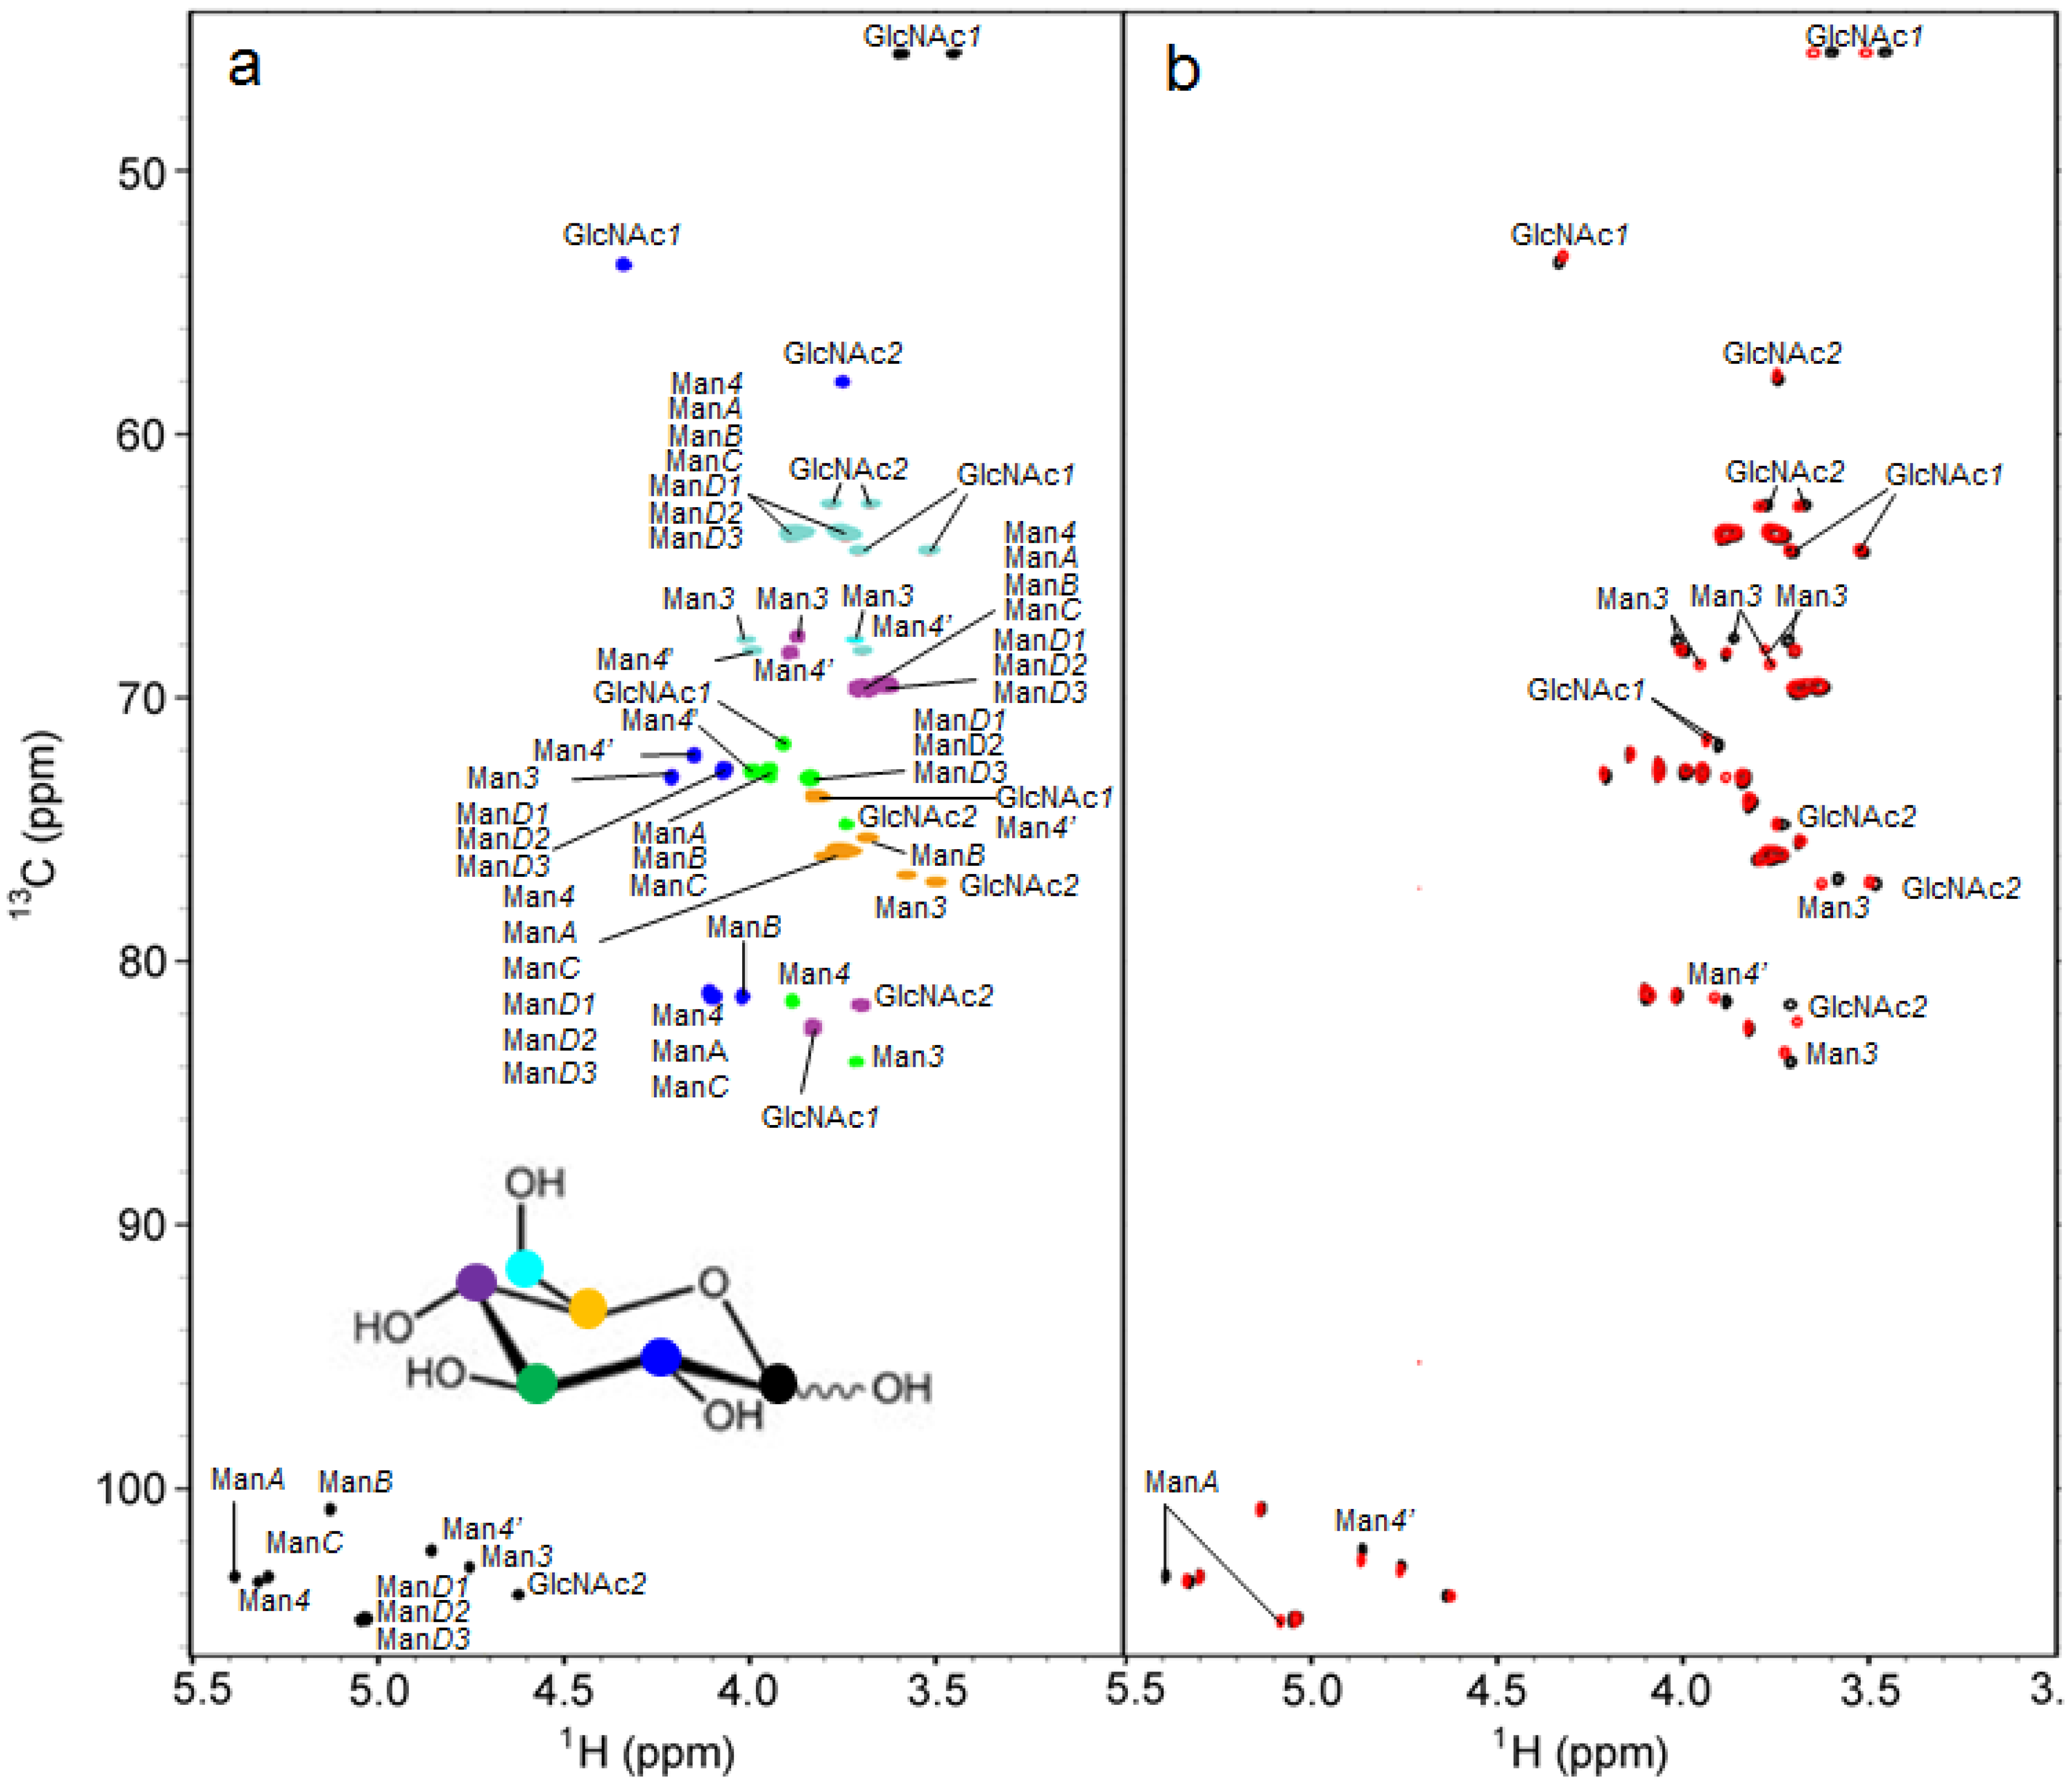
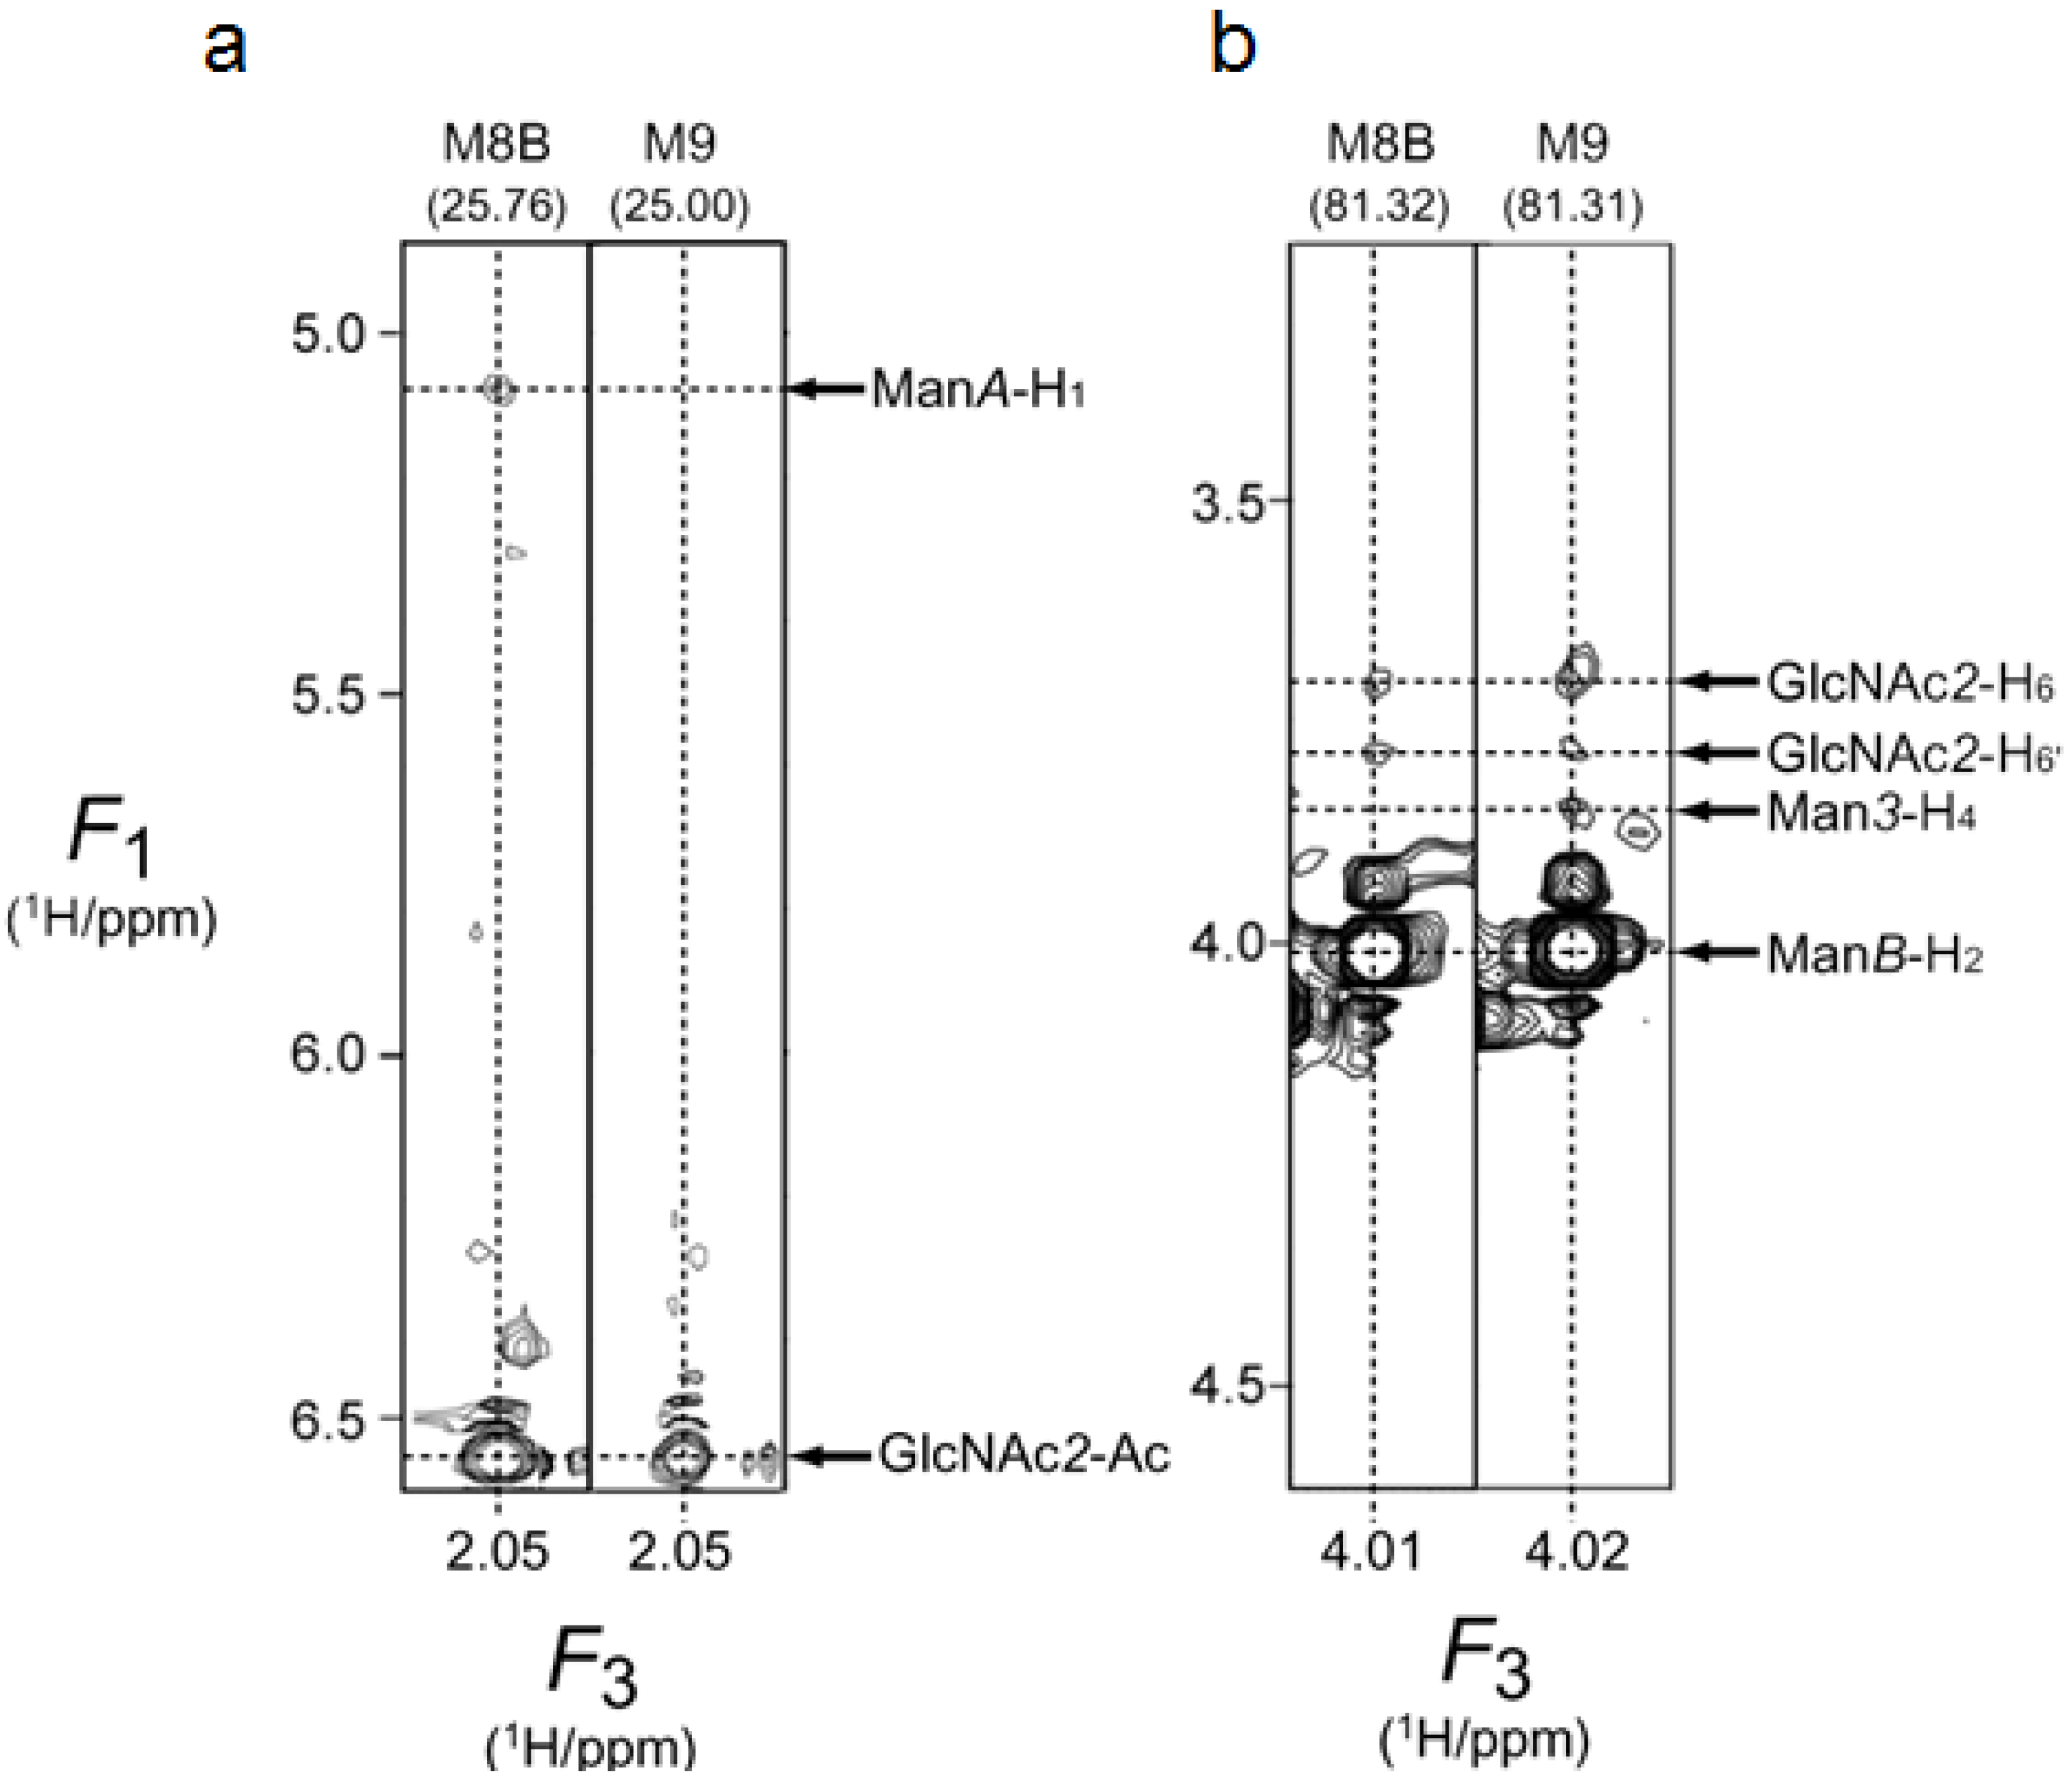
2.2. 1H-13C HSQC Spectral Comparison of M8B and M9

| M8B | M9 | |
|---|---|---|
| Man3 | 161.13 ± 0.02 | 160.86 ± 0.01 |
| Man4 | 172.93 ± 0.05 | 172.77 ± 0.04 |
| ManC | 172.72 ± 0.05 | 172.70 ± 0.04 |
| ManD1 | 171b | 171.38 ± 0.02 |
| Man4' | 171.46 ± 0.01 | 171.73 ± 0.06 |
| ManA | 171.51 ± 0.07 | 173.03 ± 0.02 |
| ManD2 | 171.26 ± 0.05 | |
| ManB | 172.33 ± 0.03 | 172.24 ± 0.09 |
| ManD3 | 171b | 171.15 ± 0.08 |
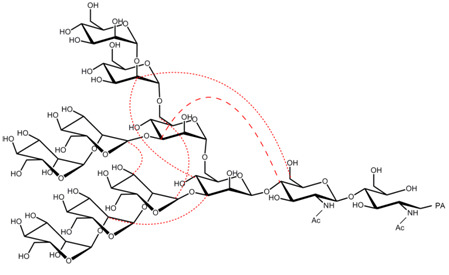
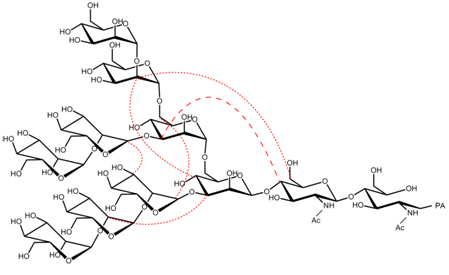
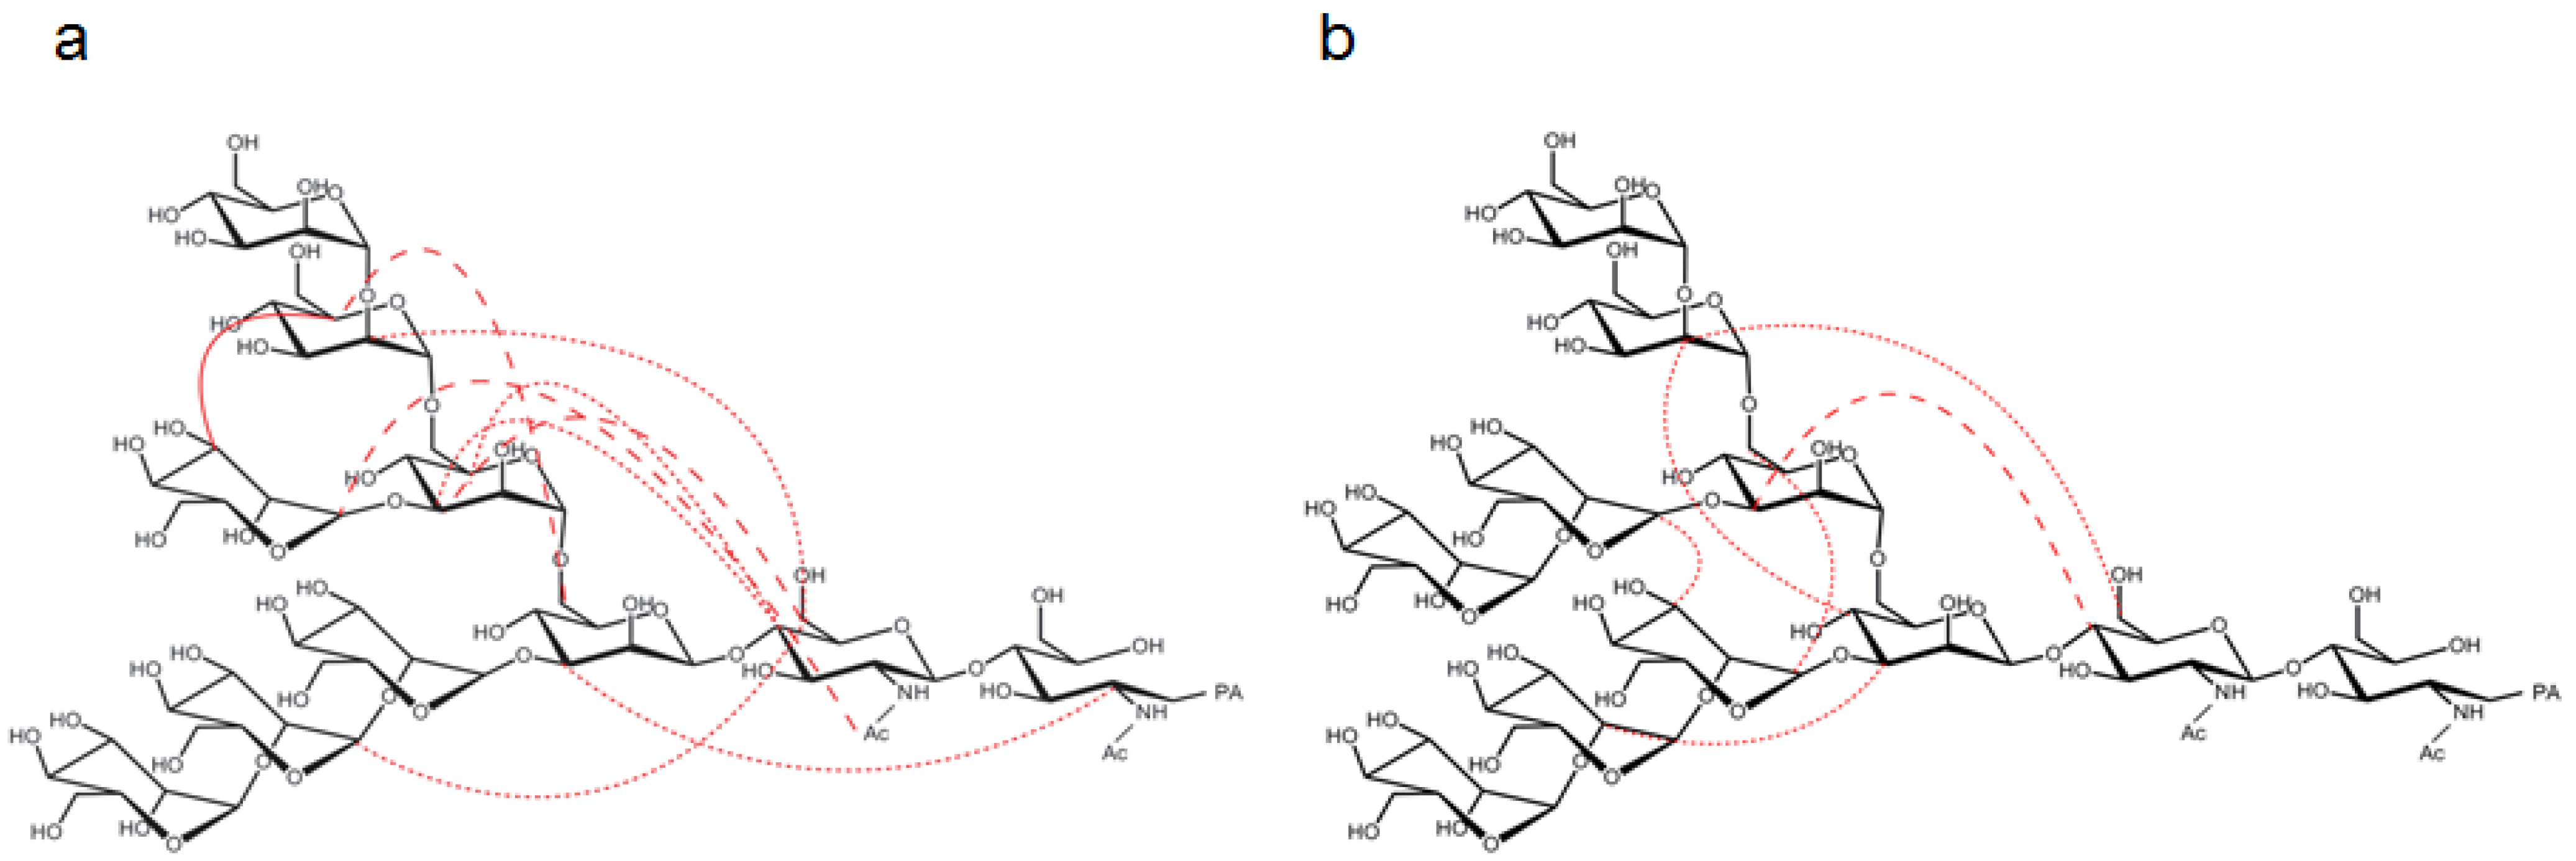
2.3. Interresidue NOE Connectivities of M8B and M9


3. Discussion
4. Experimental Section
4.1. Yeast Engineering
| Name | Sequence |
|---|---|
| mns1-del-f | CAGAAAAAGGTAGTAAAAGAGGAAAAGGTTAAACATTGAAAAAGGATTCTCGGATCCCCGGGTTAATTAA |
| mns1-del-r | CGCATAGTGAATTTTAAAAGGCGAATCTGGCCACTATATAGCACACTAACGAATTCGAGCTCGTTTAAAC |
| mns1-del-chk | AAGTGCAGAGGCGCTATC |
| T2.1 | TCTGCAAGCCGCAAACTT |
4.2. Metabolic Labeling
4.3. Purification
4.4. NMR Measurements and Analyses
5. Conclusions
Acknowledgments
References
- Varki, A. Biological roles of oligosaccharides: all of the theories are correct. Glycobiology 1993, 3, 97–130. [Google Scholar] [CrossRef]
- von der Lieth, C.W.; Siebert, H.C.; Kožár, T.; Burchert, M.; Frank, M.; Gilleron, M.; Kaltner, H.; Kayser, G.; Tajkhorshid, E.; Bovin, N.V.; Vliegenthart, J.F.G.; Gabius, H.J. Lectin ligands: new insights into their conformations and their dynamic behavior and the discovery of conformer selection by lectins. Acta anatomica 1998, 161, 91–109. [Google Scholar] [CrossRef] [Green Version]
- Fadda, E.; Woods, R.J. Molecular simulations of carbohydrates and protein-carbohydrate interactions: motivation, issues and prospects. Drug. Discov. Today 2010, 15, 596–609. [Google Scholar] [CrossRef]
- Gabius, H.J.; André, S.; Jiménez-Barbero, J.; Romero, A.; Solís, D. From lectin structure to functional glycomics: principles of sugar code. Trends. Biochem. Sci. 2011, 36, 298–313. [Google Scholar] [CrossRef]
- Kamiya, Y.; Yagi-Utsumi, M.; Yagi, H.; Kato, K. Structural and molecular basis of carbohydrate-protein interaction systems as potential therapeutic targets. Curr. Pharm. Des. 2011, 17, 1672–1684. [Google Scholar] [CrossRef]
- Lederkremer, G.Z. Glycoprotein folding, quality control and ER-associated degradation. Curr. Opin. Struct. Biol. 2009, 19, 515–523. [Google Scholar] [CrossRef]
- Aebi, M.; Bernasconi, R.; Clerc, S.; Molinari, M. N-glycan structures: recognition and processing in the ER. Trends. Biochem. Sci. 2010, 35, 74–82. [Google Scholar] [CrossRef]
- Kamiya, Y.; Satoh, T.; Kato, K. Molecular and structural basis for N-glycan-dependent determination of glycoprotein fates in cells. Biochim. Biophys. Acta 2012, 1820, 1327–1337. [Google Scholar]
- Wormald, M.R.; Petrescu, A.J.; Pao, Y.L.; Glithero, A.; Elliott, T.; Dwek, R.A. Conformational studies of oligosaccharides and glycopeptides: complementarity of NMR, X-ray crystallography, and molecular modelling. Chem. Rev. 2002, 102, 371–386. [Google Scholar] [CrossRef]
- Kato, K.; Sasakawa, H.; Kamiya, Y.; Utsumi, M.; Nakano, M.; Takahashi, N.; Yamaguchi, Y. 920 MHz ultra-high field NMR approaches to structural glycobiology. Biochim. Biophys. Acta 2008, 1780, 619–625. [Google Scholar]
- Kamiya, Y.; Yamamoto, S.; Chiba, Y.; Jigami, Y.; Kato, K. Overexpression of a homogeneous oligosaccharide with 13C labeling by genetically engineered yeast strain. J. Biomol. NMR 2011, 50, 397–401. [Google Scholar] [CrossRef]
- Herscovics, A.; Orlean, P. Glycoprotein biosynthesis in yeast. FASEB J. 1993, 7, 540–550. [Google Scholar]
- Nakanishi-Shindo, Y.; Nakayama, K.; Tanaka, A.; Toda, Y.; Jigami, Y. Structure of the N-linked oligosaccharides that show the complete loss of a-1,6-polymannose outer chain from och1, och1 mnn1, and och1 mnn1 alg3 mutants of Saccharomyces cerevisiae. J. Biol. Chem. 1993, 268, 26338–26345. [Google Scholar]
- Chiba, Y.; Suzuki, M.; Yoshida, S.; Yoshida, A.; Ikenaga, H.; Takeuchi, M.; Jigami, Y.; Ichishima, E. Production of human compatible high mannose-type (Man5GlcNAc2) sugar chains in Saccharomyces cerevisiae. J. Biol. Chem. 1998, 273, 26298–26304. [Google Scholar]
- Tvaroska, I.; Taravel, F.R. One - bond carbon-proton coupling constants: angular dependence in α-linked oligosaccharides. Carbohydr. Res. 1991, 221, 83–94. [Google Scholar] [CrossRef]
- Serianni, A.S.; Wu, J.; Carmichael, I. One-bond 13C-1H spin-coupling constants in aldofuranosyl rings: Effect of conformation on coupling magnitude. J. Am. Chem. Soc. 1995, 117, 8645–8650. [Google Scholar] [CrossRef]
- Van Halbeek, H.; Dorland, L.; Veldink, G.A.; Vliegenthart, J.F.G.; Strecker, G.; Michalski, J.C.; Montreuil, J.; Hull, W.E. A 500 MHz 1H NMR study of urinary oligosaccharides from patients with mannosidosis. FEBS Lett. 1980, 121, 71–77. [Google Scholar] [CrossRef]
- Vliegenthart, J.F.G.; Dorland, L.; van Halbeek, H. High-resolution, 1H-nuclear magnetic resonance spectroscopy as a tool in the structural analysis of carbohydrates related to glycoproteins. Adv. Carbohydr. Chem. Biochem. 1983, 41, 209–374. [Google Scholar] [CrossRef]
- Byrd, J.C.; Tarentino, A.L.; Maley, F.; Atkinson, P.H.; Trimble, R.B. Glycoprotein synthesis in yeast. Identification of Man8GlcNAc2 as an essential intermediate in oligosaccharide processing. J. Biol. Chem. 1982, 257, 14657–14666. [Google Scholar]
- González, L.; Bruix, M.; Díaz-Mauriño, T.; Feizi, T.; Rico, M.; Solís, D.; Jiménez-Barbero, J. Conformational studies of the Man8 oligosaccharide on native ribonuclease B and on the reduced and denatured protein. Arch. Biochem. Biophys. 2000, 383, 17–27. [Google Scholar] [CrossRef]
- Wyss, D.F.; Choi, J.S.; Wagner, G. Composition and sequence specific resonance assignments of the heterogeneous N-linked glycan in the 13.6 kDa adhesion domain of human CD2 as determined by NMR on the intact glycoprotein. Biochemistry 1995, 34, 1622–1634. [Google Scholar] [CrossRef]
- Wyss, D.F.; Choi, J.S.; Li, J.; Knoppers, M.H.; Willis, K.J.; Arulanandam, A.R.; Smolyar, A.; Reinherz, E.L.; Wagner, G. Conformation and function of the N-linked glycan in the adhesion domain of human CD2. Science 1995, 269, 1273–1278. [Google Scholar]
- Homans, S.W.; Pastore, A.; Dwek, R.A.; Rademacher, T.W. Structure and dynamics in oligomannose-type oligosaccharides. Biochemistry 1987, 26, 6649–6655. [Google Scholar] [CrossRef]
- Wooten, E.W.; Bazzo, R.; Edge, C.J.; Zamze, S.; Dwek, R.A.; Rademacher, T.W. Primary sequence dependence of conformation in oligomannose oligosaccharides. Eur. Biophys. J. 1990, 18, 139–148. [Google Scholar] [CrossRef]
- Woods, R.J.; Pathiaseril, A.; Wormald, M.R.; Edge, C.J.; Dwek, R.A. The high degree of internal flexibility observed for an oligomannose oligosaccharide does not alter the overall topology of the molecule. Eur. J. Biochem. 1998, 258, 372–386. [Google Scholar]
- Balaji, P.V.; Qasba, P.K.; Rao, V.S. Molecular dynamics simulations of high-mannose oligosaccharides. Glycobiology 1994, 4, 497–515. [Google Scholar] [CrossRef]
- Abe, H.; Takaoka, Y.; Chiba, Y.; Sato, N.; Ohgiya, S.; Itadani, A.; Hirashima, M.; Shimoda, C.; Jigami, Y.; Nakayama, K. Development of valuable yeast strains using a novel mutagenesis technique for the effective production of therapeutic glycoproteins. Glycobiology 2009, 19, 428–436. [Google Scholar]
- Longtine, M.S.; McKenzie, A., 3rd; Demarini, D.J.; Shah, N.G.; Wach, A.; Brachat, A.; Philippsen, P.; Pringle, J.R. Additional modules for versatile and economical PCR-based gene deletion and modification in Saccharomyces cerevisiae. Yeast 1998, 14, 953–961. [Google Scholar] [CrossRef]
- Gietz, R.D.; Schiestl, R.H. High-efficiency yeast transformation using the LiAc/SS carrier DNA/PEG method. Nat. Protoc. 2007, 2, 31–34. [Google Scholar] [CrossRef]
- Peat, S.; Whelan, W.J.; Edwards, T.E. Polysaccharides of Baker's Yeast. Part IV. Mannan. J. Chem Soc. 1961, 29–34. [Google Scholar]
- Tanabe, K.; Ikenaka, K. In-column removal of hydrazine and N-acetylation of oligosaccharides released by hydrazionolysis. Anal. Biochem. 2006, 348, 324–326. [Google Scholar] [CrossRef]
- Takahashi, N.; Kato, K. GALAXY (Glycoanalysis by the Three Axes of MS and Chromatography): a web application that assists structural analyses of N-glycans. Trends. Glycosci. Glycotech. 2003, 14, 235–251. [Google Scholar] [CrossRef]
- Kamiya, Y.; Yamaguchi, Y.; Takahashi, N.; Arata, Y.; Kasai, K.I.; Ihara, Y.; Matsuo, I.; Ito, Y.; Yamamoto, K.; Kato, K. Sugar-binding properties of VIP36, an intracellular animal lectin operating as a cargo receptor. J. Biol. Chem. 2005, 280, 37178–37182. [Google Scholar]
- Kato, K.; Takahashi, N. GALAXY database and pyridilaminated oligosaccharide library. In Experimental Glycoscience: Glycobiology; Taniguchi, N., Suzuki, A., Narimatsu, H., Kawasaki, T., Hase, S., Eds.; Springer: The Netherlands, 2008; pp. 413–416. [Google Scholar]
- Kamiya, Y.; Kamiya, D.; Yamamoto, K.; Nyfeler, B.; Hauri, H.P.; Kato, K. Molecular basis of sugar recognition by the human L-type lectins ERGIC-53, VIPL, and VIP36. J. Biol. Chem. 2008, 283, 1857–1861. [Google Scholar]
- Delaglio, F.; Grzesiek, S.; Vuister, G.W.; Zhu, G.; Pfeifer, J.; Bax, A. NMRPipe: a multidimensional spectral processing system based on UNIX pipes. J. Biomol. NMR 1995, 6, 277–293. [Google Scholar]
- Yamamoto, S.; Zhang, Y.; Yamaguchi, T.; Kameda, T.; Kato, K. Lanthanide-assisted NMR evaluation of a dynamic ensemble of oligosaccharide conformations. Chem. Commun. 2012, 48, 4752–4754. [Google Scholar] [CrossRef]
- Zhang, Y.; Yamamoto, S.; Yamaguchi, T.; Kato, K. Application of Paramagnetic NMR-Validated Molecular Dynamics Simulation to the Analysis of a Conformational Ensemble of a Branched Oligosaccharide. Molecules 2012, 17, 6658–6671. [Google Scholar] [CrossRef]
- Demarco, M.L.; Woods, R.J.; Prestegard, J.H.; Tian, F. Presentation of membrane-anchored glycosphingolipids determined from molecular dynamics simulations and NMR paramagnetic relaxation rate enhancement. J. Am. Chem. Soc. 2010, 132, 1334–1338. [Google Scholar] [CrossRef]
- Erdélyi, M.; d'Auvergne, E.; Navarro-Vázquez, A.; Leonov, A.; Griesinger, C. Dynamics of the glycosidic bond: conformational space of lactose. Chemistry 2011, 17, 9368–9376. [Google Scholar] [CrossRef]
| 13C resonances | 1H resonances | 13C resonances | 1H resonances | ||||||||
|---|---|---|---|---|---|---|---|---|---|---|---|
| residue | Atom | Chemical shift | residue | Atom | Chemical shift | residue | Atom | Chemical shift | residue | Atom | Chemical shift |
| GlcNAc1 | 1 | 45.66 | GlcNAc1 | 1 | 3.51 | GlcNAc1 | 1 | 45.60 | GlcNAc1 | 1 | 3.46 |
| 1' | 45.65 | 1' | 3.64 | 1' | 45.60 | 1' | 3.55 | ||||
| 2 | 53.11 | 2 | 4.31 | 2 | 53.22 | 2 | 4.31 | ||||
| 3 | 71.43 | 3 | 3.97 | 3 | 71.57 | 3 | 3.93 | ||||
| 4 | 82.46 | 4 | 3.83 | 4 | 82.52 | 4 | 3.82 | ||||
| 5 | 73.86 a | 5 | 3.82 | 5 | 73.93 | 5 | 3.82 | ||||
| 6 | 64.40 | 6 | 3.53 | 6 | 64.41 | 6 | 3.51 | ||||
| 6' | 64.39 | 6' | 3.72 | 6' | 64.41 | 6' | 3.70 | ||||
| Ac | 24.98 | Ac | 1.92 | Ac | 24.75 | Ac | 1.93 | ||||
| GlcNAc2 | 1 | 104.01 | GlcNAc2 | 1 | 4.61 | GlcNAc2 | 1 | 103.98 | GlcNAc2 | 1 | 4.61 |
| 2 | 57.73 | 2 | 3.74 | 2 | 57.86 | 2 | 3.73 | ||||
| 3 | 74.81 | 3 | 3.75 | 3 | 74.77 | 3 | 3.73 | ||||
| 4 | 82.41 | 4 | 3.67 | 4 | 81.73 | 4 | 3.68 | ||||
| 5 | 77.05 | 5 | 3.50 | 5 | 77.10 | 5 | 3.49 | ||||
| 6 | 62.73 | 6 | 3.69 | 6 | 62.76 | 6 | 3.69 | ||||
| 6' | 62.72 | 6' | 3.79 | 6' | 62.76 | 6' | 3.78 | ||||
| Ac | 25.76 | Ac | 2.05 | Ac | 25.00 | Ac | 2.05 | ||||
| Man3 | 1 | 103.10 | Man3 | 1 | 4.76 | Man3 | 1 | 102.98 | Man3 | 1 | 4.75 |
| 2 | 72.89 | 2 | 4.21 | 2 | 72.96 | 2 | 4.20 | ||||
| 3 | 83.47 | 3 | 3.72 | 3 | 83.83 | 3 | 3.70 | ||||
| 4 | 68.18 | 4 | 3.78 | 4 | 67.70 | 4 | 3.86 | ||||
| 5 | 77.08 | 5 | 3.63 | 5 | 76.90 | 5 | 3.58 | ||||
| 6 | 68.77 | 6 | 3.76 | 6 | 67.92 | 6 | 3.70 | ||||
| 6' | 68.78 | 6' | 3.95 | 6' | 67.94 | 6' | 4.00 | ||||
| Man4 | 1 | 103.49 | Man4 | 1 | 5.33 | Man4 | 1 | 103.53 | Man4 | 1 | 5.32 |
| 2 | 81.32 | 2 | 4.08 | 2 | 81.35 | 2 | 4.08 | ||||
| 3 | 72.75 | 3 | 3.99 | 3 | 72.81 | 3 | 3.98 | ||||
| 4 | 69.64 | 4 | 3.69 | 4 | 69.69 | 4 | 3.68 | ||||
| 5 | 75.94 | 5 | 3.73 | 5 | 75.94 | 5 | 3.72 | ||||
| 6 | 63.73 | 6 | 3.75 | 6 | 63.73 | 6 | 3.74 | ||||
| 6' | 63.73 | 6' | 3.87 | 6' | 63.73 | 6' | 3.86 | ||||
| ManC | 1 | 103.33 | ManC | 1 | 5.30 | ManC | 1 | 103.32 | ManC | 1 | 5.29 |
| 2 | 81.17 | 2 | 4.10 | 2 | 81.14 | 2 | 4.10 | ||||
| 3 | 72.82 | 3 | 3.95 | 3 | 72.84 | 3 | 3.94 | ||||
| 4 | 69.64 | 4 | 3.69 | 4 | 69.69 | 4 | 3.68 | ||||
| 5 | 75.94 | 5 | 3.73 | 5 | 75.94 | 5 | 3.72 | ||||
| 6 | 63.73 | 6 | 3.75 | 6 | 63.73 | 6 | 3.74 | ||||
| 6' | 63.73 | 6' | 3.87 | 6' | 63.73 | 6' | 3.86 | ||||
| ManD1 | 1 | 104.93 | ManD1 | 1 | 5.04 | ManD1 | 1 | 104.95 | ManD1 | 1 | 5.04 |
| 2 | 72.73 | 2 | 4.06 | 2 | 72.79 | 2 | 4.06 | ||||
| 3 | 73.03 | 3 | 3.84 | 3 | 72.95 | 3 | 3.83 | ||||
| 4 | 69.54 | 4 | 3.63 | 4 | 69.57 | 4 | 3.62 | ||||
| 5 | 75.94 | 5 | 3.73 | 5 | 75.94 | 5 | 3.72 | ||||
| 6 | 63.73 | 6 | 3.75 | 6 | 63.73 | 6 | 3.74 | ||||
| 6' | 63.73 | 6' | 3.87 | 6' | 63.73 | 6' | 3.86 | ||||
| Man4' | 1 | 102.71 | Man4' | 1 | 4.86 | Man4' | 1 | 102.35 | Man4' | 1 | 4.85 |
| 2 | 72.15 | 2 | 4.14 | 2 | 72.13 | 2 | 4.14 | ||||
| 3 | 81.39 | 3 | 3.91 | 3 | 81.54 | 3 | 3.88 | ||||
| 4 | 68.28 | 4 | 3.88 | 4 | 68.30 | 4 | 3.88 | ||||
| 5 | 73.86 | 5 | 3.82 | 5 | 73.93 | 5 | 3.82 | ||||
| 6 | 68.22 | 6 | 3.70 | 6 | 68.22 | 6 | 3.68 | ||||
| 6' | 68.20 | 6' | 4.00 | 6' | 68.22 | 6' | 3.98 | ||||
| ManA | 1 | 105.02 | ManA | 1 | 5.08 | ManA | 1 | 103.31 | ManA | 1 | 5.38 |
| 2 | 72.73 | 2 | 4.06 | 2 | 81.14 | 2 | 4.09 | ||||
| 3 | 73.06 | 3 | 3.88 | 3 | 72.84 | 3 | 3.94 | ||||
| 4 | 69.54 | 4 | 3.69 | 4 | 69.69 | 4 | 3.68 | ||||
| 5 | 75.94 | 5 | 3.73 | 5 | 75.94 | 5 | 3.72 | ||||
| 6 | 63.73 | 6 | 3.75 | 6 | 63.73 | 6 | 3.74 | ||||
| 6' | 63.73 | 6' | 3.87 | 6' | 63.73 | 6' | 3.86 | ||||
| ManD2 | 1 | ManD2 | 1 | ManD2 | 1 | 104.95 | ManD2 | 1 | 5.04 | ||
| 2 | 2 | 2 | 72.79 | 2 | 4.06 | ||||||
| 3 | 3 | 3 | 72.95 | 3 | 3.83 | ||||||
| 4 | 4 | 4 | 69.57 | 4 | 3.62 | ||||||
| 5 | 5 | 5 | 75.94 | 5 | 3.72 | ||||||
| 6 | 6 | 6 | 63.73 | 6 | 3.74 | ||||||
| 6' | 6' | 6' | 63.73 | 6' | 3.86 | ||||||
| ManB | 1 | 100.77 | ManB | 1 | 5.14 | ManB | 1 | 100.75 | ManB | 1 | 5.13 |
| 2 | 81.32 | 2 | 4.01 | 2 | 81.31 | 2 | 4.02 | ||||
| 3 | 72.82 | 3 | 3.95 | 3 | 72.84 | 3 | 3.94 | ||||
| 4 | 69.64 | 4 | 3.69 | 4 | 69.69 | 4 | 3.68 | ||||
| 5 | 75.44 | 5 | 3.68 | 5 | 75.47 | 5 | 3.68 | ||||
| 6 | 63.73 | 6 | 3.75 | 6 | 63.73 | 6 | 3.74 | ||||
| 6' | 63.73 | 6' | 3.87 | 6' | 63.73 | 6' | 3.86 | ||||
| ManD3 | 1 | 104.93 | ManD3 | 1 | 5.04 | ManD3 | 1 | 104.95 | ManD3 | 1 | 5.04 |
| 2 | 72.73 | 2 | 4.06 | 2 | 72.79 | 2 | 4.06 | ||||
| 3 | 73.03 | 3 | 3.84 | 3 | 72.95 | 3 | 3.83 | ||||
| 4 | 69.54 | 4 | 3.63 | 4 | 69.57 | 4 | 3.62 | ||||
| 5 | 75.94 | 5 | 3.73 | 5 | 75.94 | 5 | 3.72 | ||||
| 6 | 63.73 | 6 | 3.75 | 6 | 63.73 | 6 | 3.74 | ||||
| 6' | 63.73 | 6' | 3.87 | 6' | 63.73 | 6' | 3.86 | ||||
| M8B | Normalized intensity | M9 | Normalized intensity |
|---|---|---|---|
| 1H2-3H3 | 0.10 | 1H3-2H1 | 0.05 |
| 1H3-2H1 | 0.12 | 1H4-2H1 | 1.29 |
| 1H4-2H1 | 1.86 | 1H6-2H1 | 0.26 |
| 1H4-2Ac | 0.08 | 1H6-2Ac | 0.14 |
| 1H5-2H1 | 0.51 | 1H6'-2H1 | 0.22 |
| 1H6-2H1 | 0.54 | 1H6'-2Ac | 0.18 |
| 1H6-2Ac | 0.43 | 2H3-3H1 | 0.10 |
| 1H6'-2H1 | 0.23 | 2H4-3H1 | 1.31 |
| 1H6'-2Ac | 0.19 | 2H4-3H2 | 0.04 |
| 1Ac-2H5 | 0.06 | 2H4-4'H3 | 0.12 |
| 2H2-3H1 | 0.07 | 2H5-3H1 | 0.07 |
| 2H3-3H1 | 0.18 | 2H6-BH2 | 0.06 |
| 2H4-3H1 | 1.92 | 2H6'-3H1 | 0.16 |
| 2H4-3H2 | 0.08 | 2H6'-3H2 | 0.18 |
| 2H4-4'H3 | 0.06 | 2H6'-3H3 | 0.40 |
| 2H4-4'H5 | 0.09 | 2H6'-BH2 | 0.05 |
| 2H5-3H1 | 0.17 | 3H1-4H1 | 0.05 |
| 2H6-3H1 | 0.35 | 3H2-4H1 | 0.21 |
| 2H6-3H2 | 0.24 | 3H2-4H3 | 0.08 |
| 2H6-4'H3 | 0.19 | 3H3-4H1 | 1.84 |
| 2H6-BH2 | 0.09 | 3H3-4H2 | 0.31 |
| 2H6-CH1 | 0.05 | 3H3-CH2 | 0.08 |
| 2H6'-3H1 | 0.24 | 3H4-4H1 | 0.19 |
| 2H6'-3H2 | 0.19 | 3H4-4'H1 | 0.03 |
| 2H6'-BH2 | 0.06 | 3H4-BH2 | 0.08 |
| 2Ac-AH1 | 0.19 | 3H5-4'H1 | 0.10 |
| 3H1-CH2 | 0.11 | 3H6-4'H1 | 0.90 |
| 3H1-4H1 | 0.09 | 3H6-4'H2 | 0.42 |
| 3H2-4H1 | 0.28 | 3H6'-4'H1 | 0.32 |
| 3H3-4H1 | 1.72 | 4H1-4'H6' | 0.03 |
| 3H3-4H2 | 0.39 | 4H2-CH1 | 1.99 |
| 3H4-4H1 | 0.18 | 4H3-AH1 | 0.04 |
| 3H5-4'H1 | 0.14 | CH1-D1H1 | 0.11 |
| 3H5-4H1 | 0.09 | CH2-D1H1 | 1.44 |
| 3H6-4'H1 | 1.45 | 4'H2-AH1 | 0.20 |
| 3H6-4'H2 | 0.11 | 4'H3-AH1 | 1.09 |
| 3H6-BH5 | 0.15 | 4'H4-AH1 | 0.28 |
| 3H6'-4'H1 | 0.46 | 4'H4-BH1 | 0.09 |
| 4H2-CH1 | 2.08 | 4'H6-BH1 | 0.75 |
| CH1-D1H1 | 0.23 | 4'H6'-AH1 | 0.08 |
| CH2-D1H1 | 1.32 | 4'H6'-BH1 | 0.34 |
| CH3-D1H1 | 0.12 | AH1-D2H1 | 0.11 |
| 4'H2-AH1 | 0.13 | AH2-D2H1 | 1.44 |
| 4'H3-AH1 | 1.19 | BH1-D3H1 | 0.24 |
| 4'H4-AH1 | 0.14 | BH2-D3H1 | 0.84 |
| 4'H6-BH1 | 1.38 | BH3-D3H1 | 0.06 |
| 4'H6'-BH5 | 0.49 | ||
| AH3-BH5 | 0.28 | ||
| BH1-D3H1 | 0.46 | ||
| BH2-D3H1 | 1.09 |
© 2013 by the authors; licensee MDPI, Basel, Switzerland. This article is an open access article distributed under the terms and conditions of the Creative Commons Attribution license ( http://creativecommons.org/licenses/by/3.0/).
Share and Cite
Kamiya, Y.; Yanagi, K.; Kitajima, T.; Yamaguchi, T.; Chiba, Y.; Kato, K. Application of Metabolic 13C Labeling in Conjunction with High-Field Nuclear Magnetic Resonance Spectroscopy for Comparative Conformational Analysis of High Mannose-Type Oligosaccharides. Biomolecules 2013, 3, 108-123. https://doi.org/10.3390/biom3010108
Kamiya Y, Yanagi K, Kitajima T, Yamaguchi T, Chiba Y, Kato K. Application of Metabolic 13C Labeling in Conjunction with High-Field Nuclear Magnetic Resonance Spectroscopy for Comparative Conformational Analysis of High Mannose-Type Oligosaccharides. Biomolecules. 2013; 3(1):108-123. https://doi.org/10.3390/biom3010108
Chicago/Turabian StyleKamiya, Yukiko, Kotaro Yanagi, Toshihiko Kitajima, Takumi Yamaguchi, Yasunori Chiba, and Koichi Kato. 2013. "Application of Metabolic 13C Labeling in Conjunction with High-Field Nuclear Magnetic Resonance Spectroscopy for Comparative Conformational Analysis of High Mannose-Type Oligosaccharides" Biomolecules 3, no. 1: 108-123. https://doi.org/10.3390/biom3010108