Article

Line-Shape Code Comparison through Modeling and Fitting of Experimental Spectra of the C ii 723-nm Line Emitted by the Ablation Cloud of a Carbon Pellet

1
Aix-Marseille Université—CNRS, PIIM UMR7345, 13397 Marseille, France
2
National Institute for Fusion Science, Toki, 509-5292, Japan
3
Sandia National Laboratories, Albuquerque, NM 87185, USA
4
Faculty of Physics, Weizmann Institute of Science, Rehovot 7610001, Israel
*
Author to whom correspondence should be addressed.
Atoms 2014, 2(3), 319-333; https://doi.org/10.3390/atoms2030319
Submission received: 9 May 2014 / Revised: 28 May 2014 / Accepted: 25 June 2014 / Published: 14 July 2014
(This article belongs to the Special Issue Spectral Line Shapes in Plasmas)

Abstract

:
Various codes of line-shape modeling are compared to each other through the profile of the C ii 723-nm line for typical plasma conditions encountered in the ablation clouds of carbon pellets, injected in magnetic fusion devices. Calculations were performed for a single electron density of 1017 cm−3 and two plasma temperatures (T = 2 and 4 eV). Ion and electron temperatures were assumed to be equal (Te = Ti = T). The magnetic field, B, was set equal to either to zero or 4 T. Comparisons between the line-shape modeling codes and two experimental spectra of the C ii 723-nm line, measured perpendicularly to the B-field in the Large Helical Device (LHD) using linear polarizers, are also discussed.
Classification PACS:
52.25.Os; 32.60.+i; 32.70.Jz; 52.70.-m; 52.55.Hc

1. Introduction

Comparing synthetic line profiles in plasmas carried out with different codes and simulation methods is certainly an interesting issue, which can help to validate the underlying models. In order to use them for plasma diagnostics, such models have to be reliable. However, checking the reliability of a model requires its comparison with experimental data. This does not exclude model-model comparisons. Therefore, code comparisons become more challenging if they include confrontation with experimental measurements. Such comparisons, between theory and experiment, were not scheduled in the first workshop on Spectral Line Shapes in Plasmas: code comparison [1]. To fill this gap, data from two experiments were introduced in the second workshop (5–9 August, 2013, Vienna). These experimental cases were aimed to allow detailed discussion on the approaches adopted by different research groups to analyze experimental spectra. To have a better understanding of why different approaches might end up with different best-fit plasma parameters, it was recommended to contributors willing to analyze the proposed experimental data cases to calculate the relevant line profiles for a small prescribed grid of parameters. The first experimental case concerned the C ii 723-nm 1s22s23p 2P°-1s22s23d 2D line emitted by the ablation cloud of a carbon pellet injected in the Large Helical Device (LHD) [2]. The data for this case consisted of two spectra, both measured along a line-of-sight that is nearly perpendicular to the magnetic field line but with a polarizer rotated, either nearly parallel “horizontal”, or nearly perpendicular “vertical”, to the magnetic field (see Figure 1). The second experimental case concerned the Li 460.3-nm 1s22p-1s24d line and its forbidden components. The experimental setup, data processing, and plasma diagnostic techniques are described in [3]. The present paper deals only with the first experimental case, i.e., the C ii 723-nm line.
Figure 1. Geometry of observations for the experimental spectra of the C ii 723-nm line measured from the ablation cloud of a carbon pellet injected in the stellarator LHD.
Atoms 02 00319 g001

2. Description of the Atomic System and the Line-Shape Modeling Codes

In this section, we introduce all the line-shape codes used for the modeling and/or for the fitting of the previously mentioned experimental spectra of the C ii 723-nm line and we briefly describe the atomic physics data necessary for the line profile calculations.

2.1. Description of the Line-Shape Modeling Codes
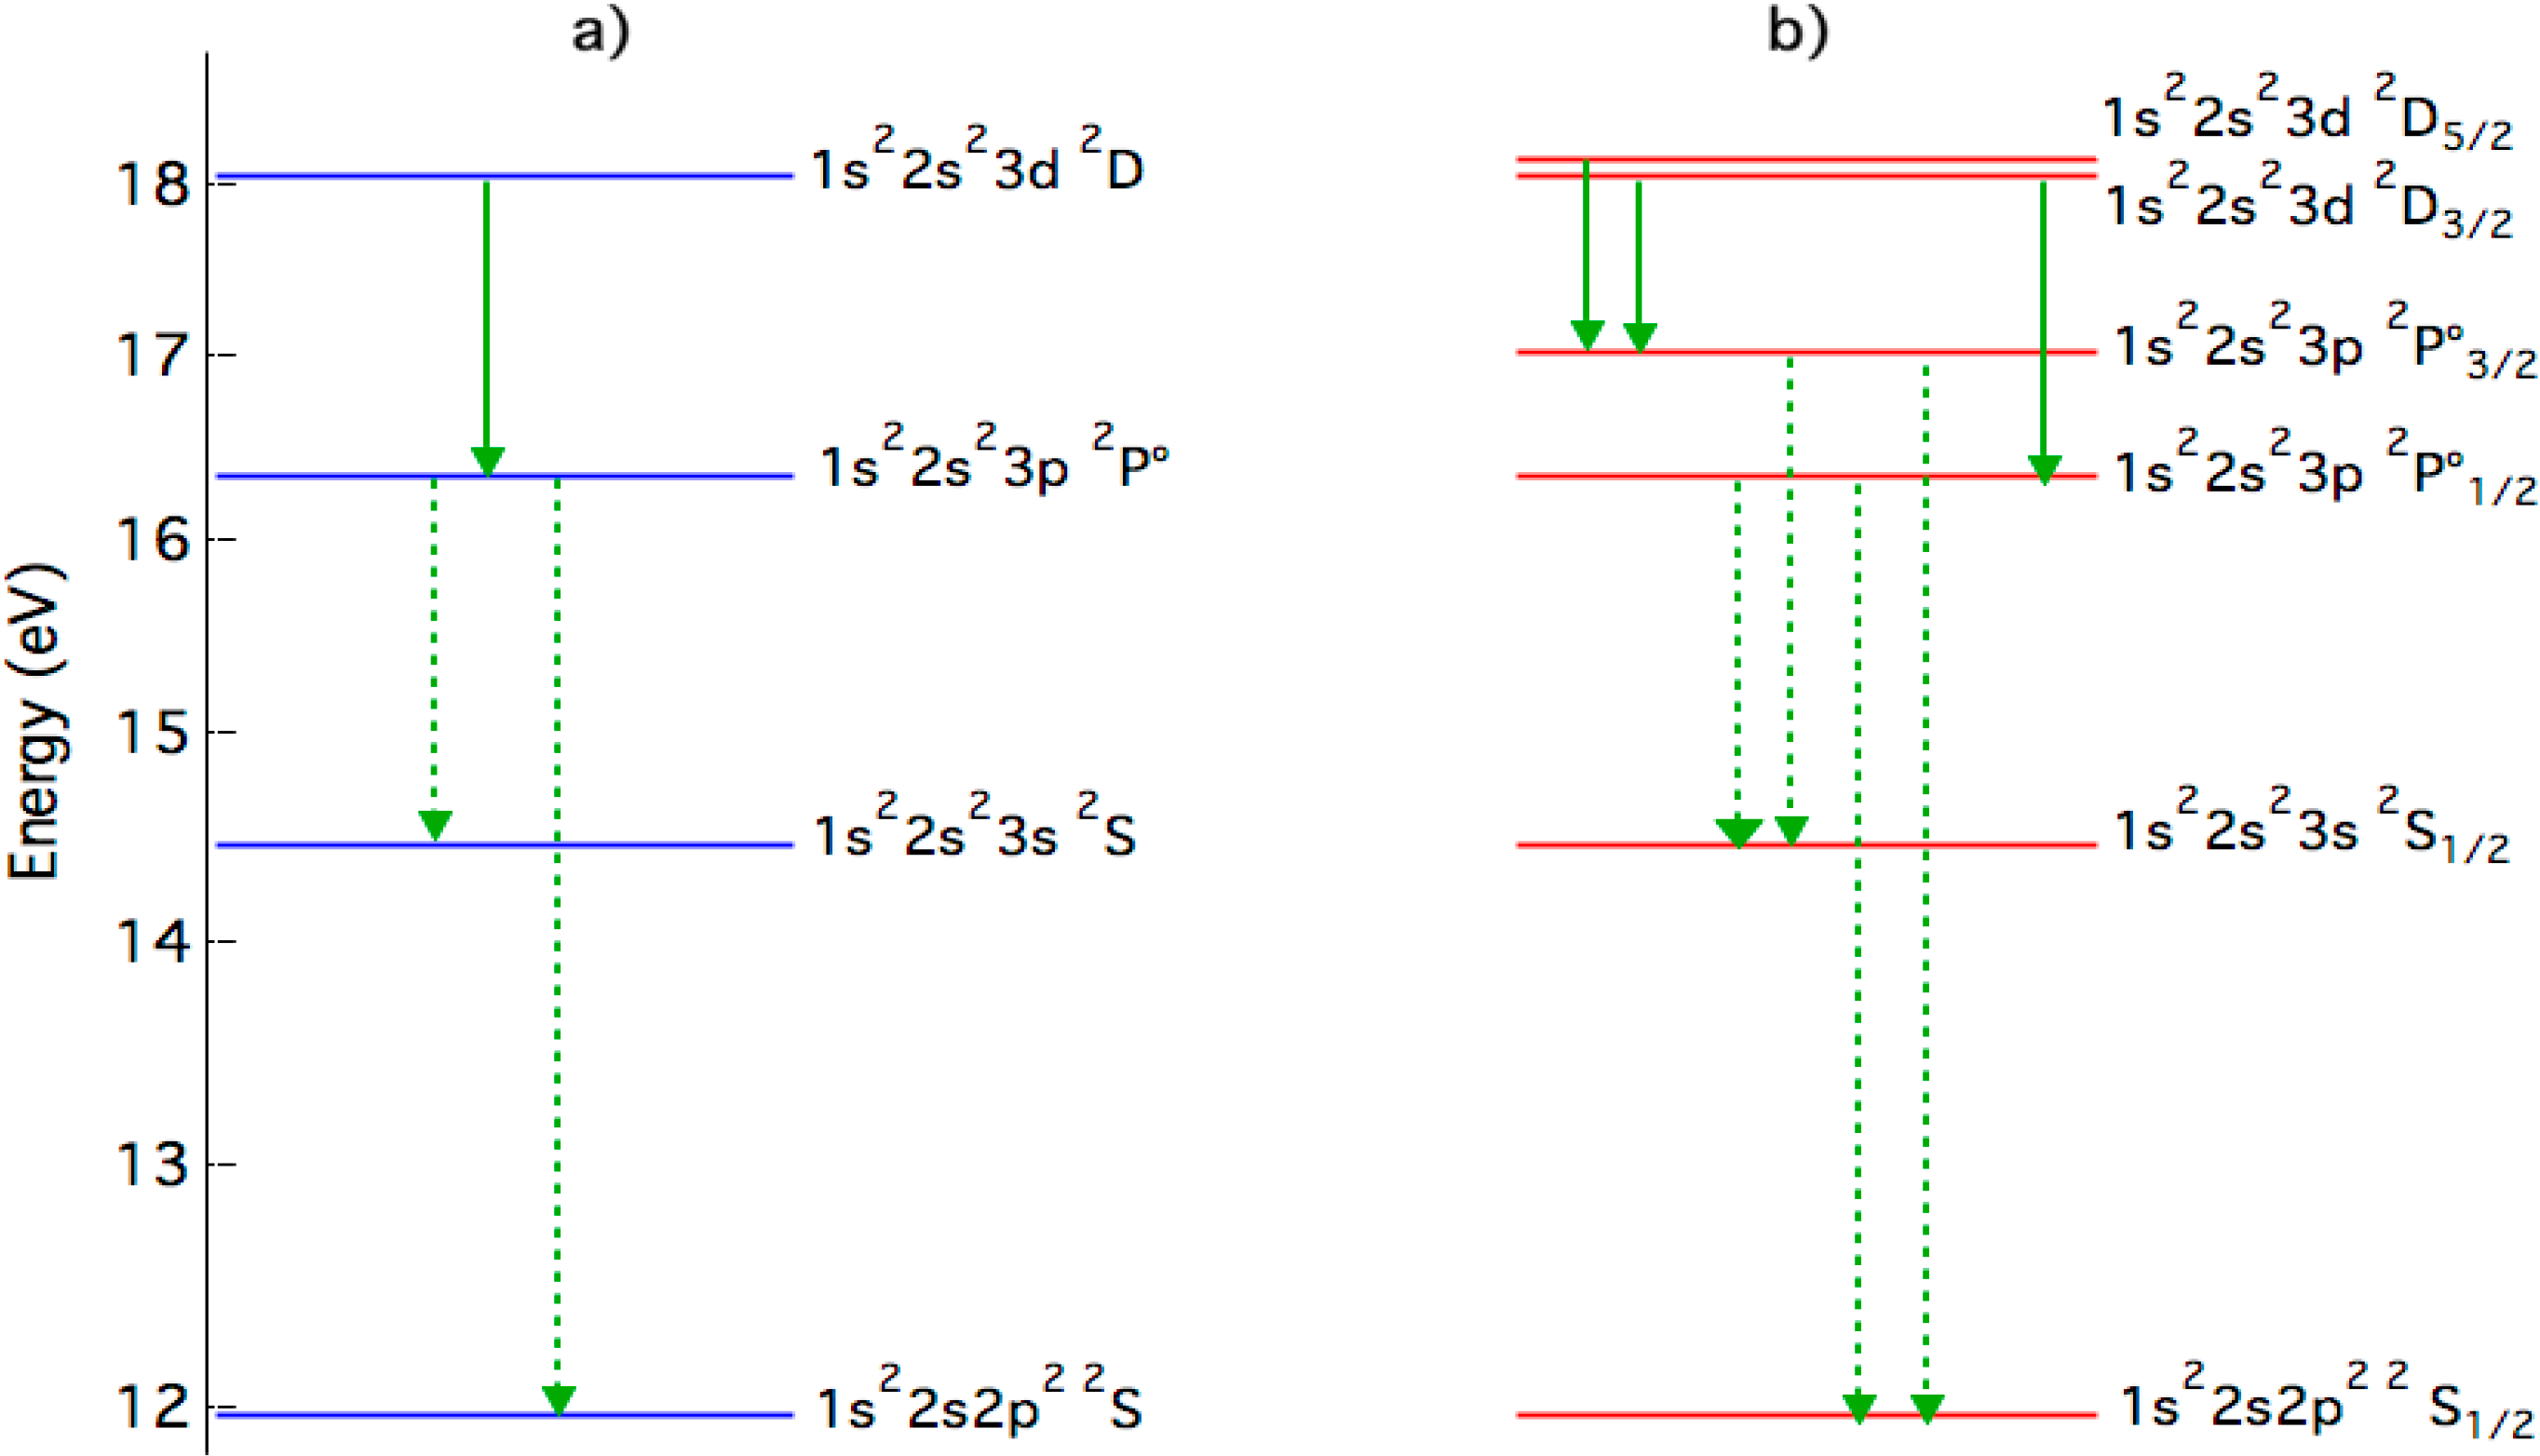
We present here the five numerical simulation codes and models used by the contributors to model the line-shapes of the C ii 723-nm line for four cases sharing the same electron density of ne = 1017 cm−3 but for two distinct values of the electron temperature Te = 2 eV and Te = 4 eV, without and with a magnetic field (B = 4 T). Note that the electron and ion temperatures were assumed equal. Even though there are differences in the treatment of the Stark effect by the various codes, they can be separated into two groups, according to the adopted approach to treat the Zeeman effect. Indeed, the line-shape codes used here can be divided into two groups. Those of the first group treat the Zeeman effect within the weak-field approximation [4,5] in which the magnetic field is a perturbation of the emitter fine-structure energy levels, shown in Figure 2a. This approximation is valid when the fine structure splitting exceeds the Zeeman splitting (ΔEFS >> ΔEZ). Three methods belong to this group: SCRAM (Sandia National Laboratory), PPP-B and WEAKZEE (CNRS/ Aix-Marseille Université). The PPP-B code [6] is an extension of the PPP standard Stark line-shape code [7,8], which accounts for ion dynamics. In PPP-B, the Zeeman effect is described in either the weak-field approximation or the opposite one, i.e., the strong-field approximation [4,5]. The latter is valid when the Zeeman splitting is higher than the fine structure one (ΔEZ >> ΔEFS). Note that, when input MCDF atomic data are used, an asterisk is added to the code name PPP-B which becomes PPP-B *. WEAKZEE is a very simple version of PPP-B where only the electron Stark broadening is accounted for, the ion Stark broadening being neglected. In WEAKZEE, the Zeeman components are dressed by a Lorentzian shape with a given width. The later can be obtained from the Stark-B database [9,10]. In [9], one can find Stark broadening parameters (FWHM: Full Width at Half Maximum) by electrons and ions for few values of the electron density and the electron temperature. For all other temperatures, the Stark widths w (in Å units) can be obtained using the following fit formula [11]:
Log(w) = a0 + a1Log(Te) + a2 [Log(Te)]2 ,
where a0, a1, and a2 are fitting parameters depending on the line, perturbers (ions or electrons) and the electron density. In this relation, the electron temperature is expressed in Kelvin. For the present calculations, the Lorentzian width w used by WEAKZEE was calculated using Equation (1). SCRAM [12,13], which is primarily used for non-LTE diagnostics of emission spectra that cover a wide range of energies and access many charge states, satellites, etc., uses the electron impact approximation for collisional broadening (based on allowed distorted wave transitions among fine structure states), the quasi-static approximation for the ionic Stark broadening, and can interpolate between the weak and strong field limits. Including forbidden collisional transitions increases the widths by about 10%. The second group of codes contains two models: SIMU [14,15] and INTDPH [16] (Weizmann Institute of Science). In these codes, the Zeeman effect is treated non-perturbatively, via a numerical solution of the static (INTDPH) or time-dependent (SIMU) Schrödinger equation. The initial atomic system is that shown on Figure 2a (see also Table 1). More precisely, SIMU is a combination of two codes: a molecular dynamics (MD) simulation of variable complexity and a solver for evolution of an atomic system with the MD field history used as a time-dependent perturbation. INTDPH is another Stark–Zeeman line-shape code using the quasi-static approximation for the ions. In order to account for the electron broadening, the output is convolved with a shifted Lorentzian at the post-processing step. The width and shift of the Lorentzian should be obtained separately from another code or a database. This is a very fast and accurate procedure (when electrons are strictly impact, e.g., for isolated lines). An application of INTDPH to diagnostics of magnetized plasmas can be found in [17]. For the calculations presented here, the impact broadening parameters were inferred from the SIMU line shapes obtained assuming B = 0.
Figure 2. Schematic energy diagrams of the radiator considered for the present study without (a) and with (b) the fine structure effect. Energy splitting between the 1s22s23p 2P° and 1s22s23d 2D doublets is exaggerated (magnified by a factor of 500) for both of levels. Arrows represent radiative dipolar transitions with solid ones representing those transitions considered for the present study.
Atoms 02 00319 g002
Table 1. Summary of the atomic data of the 1s22s23s 2S-1s22s23p 2P° and 1s22s23p 2P°-1s22s23d 2D transitions used by the different line-shape codes described in Subsection 2.2. For each transition i→k, the wavenumber σik (cm−1) is given in the 3rd column while either the line strength Sik or the line oscillator fki, both in atomic units, are given in columns 4 and 5. The last column shows the corresponding line-shape codes. The sources of the atomic data are indicated in the table: National Institute for Standard and Technology NIST [18], Multiconfiguration Dirac-Fock MCDF [19], and Flexible Atomic Code FAC [20]. Note that PPP-B and PPP-B* codes differ only by the atomic physics: NIST for PPP-B and MCDF for PPP-B *.
TermsEnergies Ei–Ek (cm−1)σik (cm−1)Sij(a.u)fki(a.u.)Line-Shape Code(s)
3s 2S-3p 2116,537.65–131 731.8015,194.15 0.715(18)INTDPH SIMU
3p 2P°-3d 2D131,731.80–145 550.1313,818.33 0.547(18)INTDPH SIMU
3p 21/2-3d 2D3/2131,724.37–145,549.2713,824.9226.00(18)
//
11.66(19)
13.84(20)
-
-
-
PPP-B
WEAKZEE
PPP-B *
SCRAM
3p 23/2-3d 2D5/2131,735.52–145 550.7013,815.1846.90(18)
//
21.00(19)
33.31(20)
-
-
-
PPP-B
WEAKZEE
PPP-B *
SCRAM
3p 23/2-3d 2D3/2131,735.52–145 549.2713,813.755.21(18)
//
2.33(19)
5.56(20)
-
-
-
PPP-B
WEAKZEE
PPP-B *
SCRAM

2.2. Brief Description of the Atomic System Representing the Emitter

The calculation of the profile of the C ii 723-nm line does not require a complicated atomic data system. However, even though only four energy levels and three dipolar radiative transitions are sufficient, calculations of such atomic physics data is complicated for this weakly charged non-hydrogen-like ion. For our case, different atomic codes give different values of the dipole reduced matrix elements. In the absence of magnetic field, one can use the atomic system shown on Figure 2, where the fine structure effect is shown only for the right part of the figure. In this figure, the fine structure splitting between the 1s22s23p 2P° and 1s22s23d 2D doublets have been magnified by a factor of 500. Energies are expressed with respect to the ground level of the C+ ion, i.e., 1s22s22p 21/2.
All line shape codes require some atomic information of the radiator including the energies, labels and quantum numbers of all the radiator energy levels involved in the considered radiative transitions, as well as the reduced matrix elements of the electric dipole or their squares, known as line strengths. Equivalently to line strengths, one can use line oscillators. Different atomic data have been used for the present code comparison. The atomic data including the electric dipolar matrix transitions were taken from NIST ASD [18]. One of the authors has used atomic data calculated by an MCDF code [19], differing only by reduced matrix elements of the dipole transitions about 1.5 times lower than those extracted from NIST ASD; another has used strength data from FAC [20]. The line strengths and/or line oscillators of the radiative transitions considered here are summarized on Table 1.

3. Cross-Comparison of the Line Profiles Computed with the Different Codes

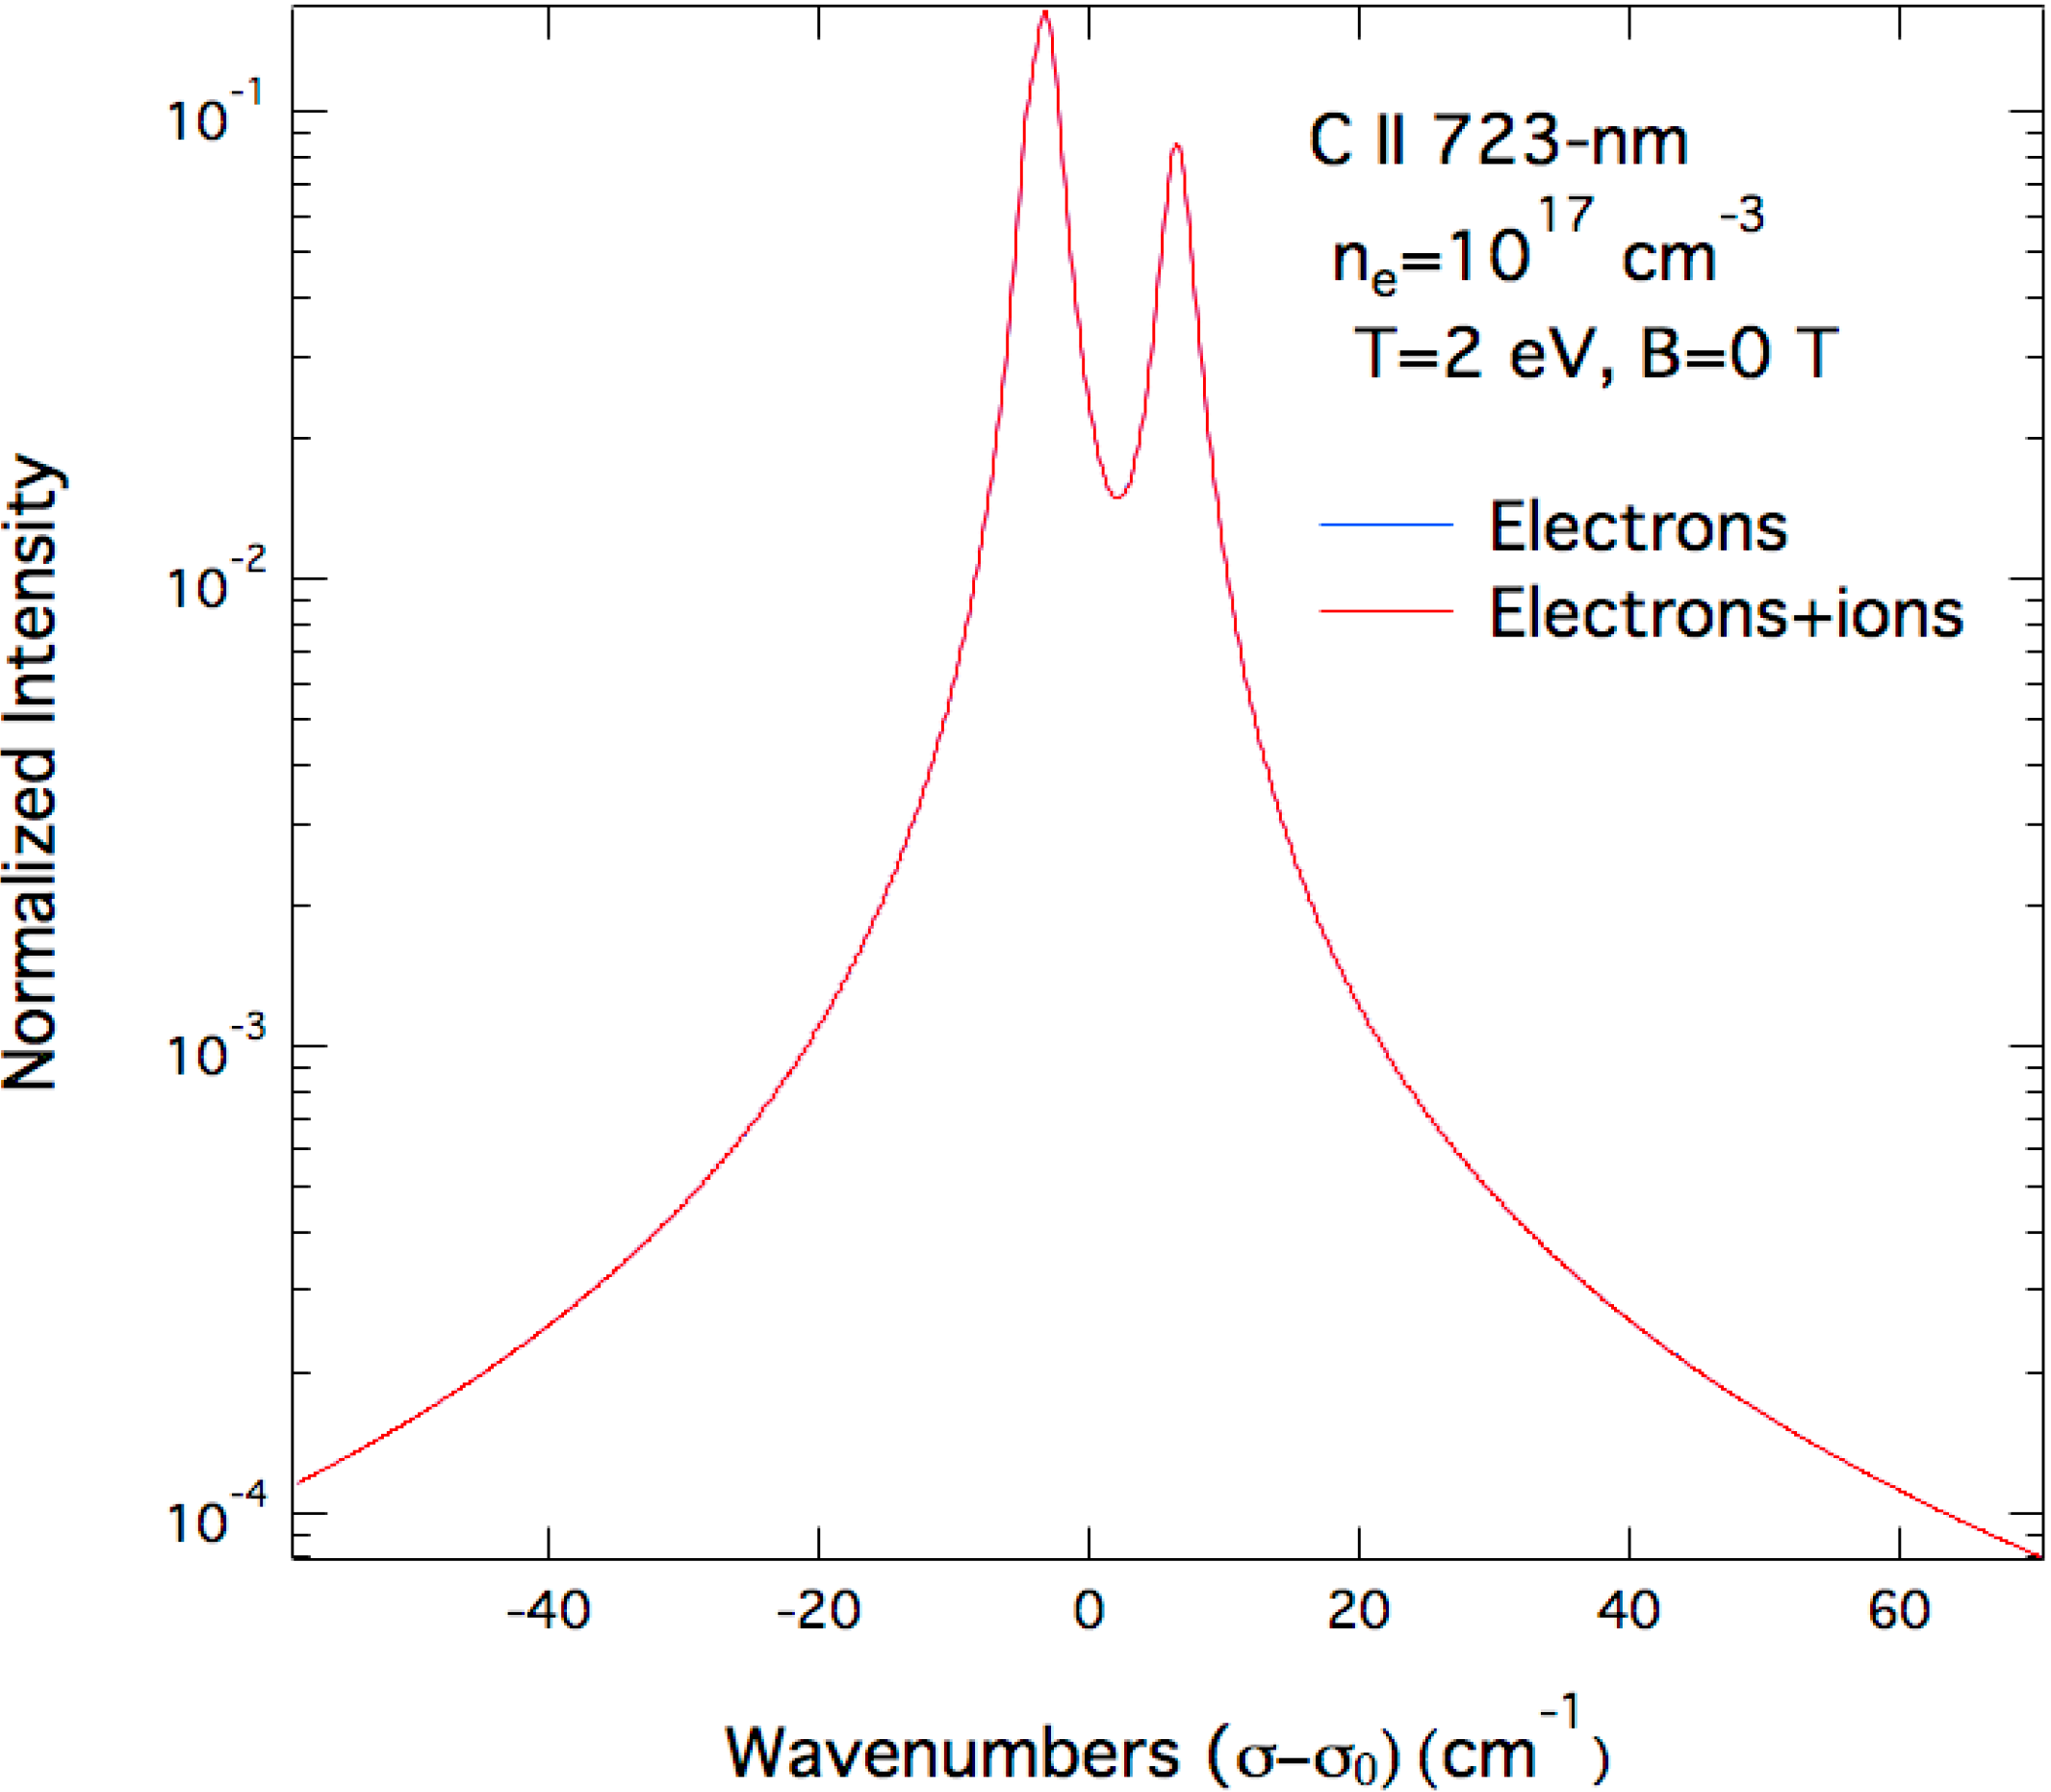
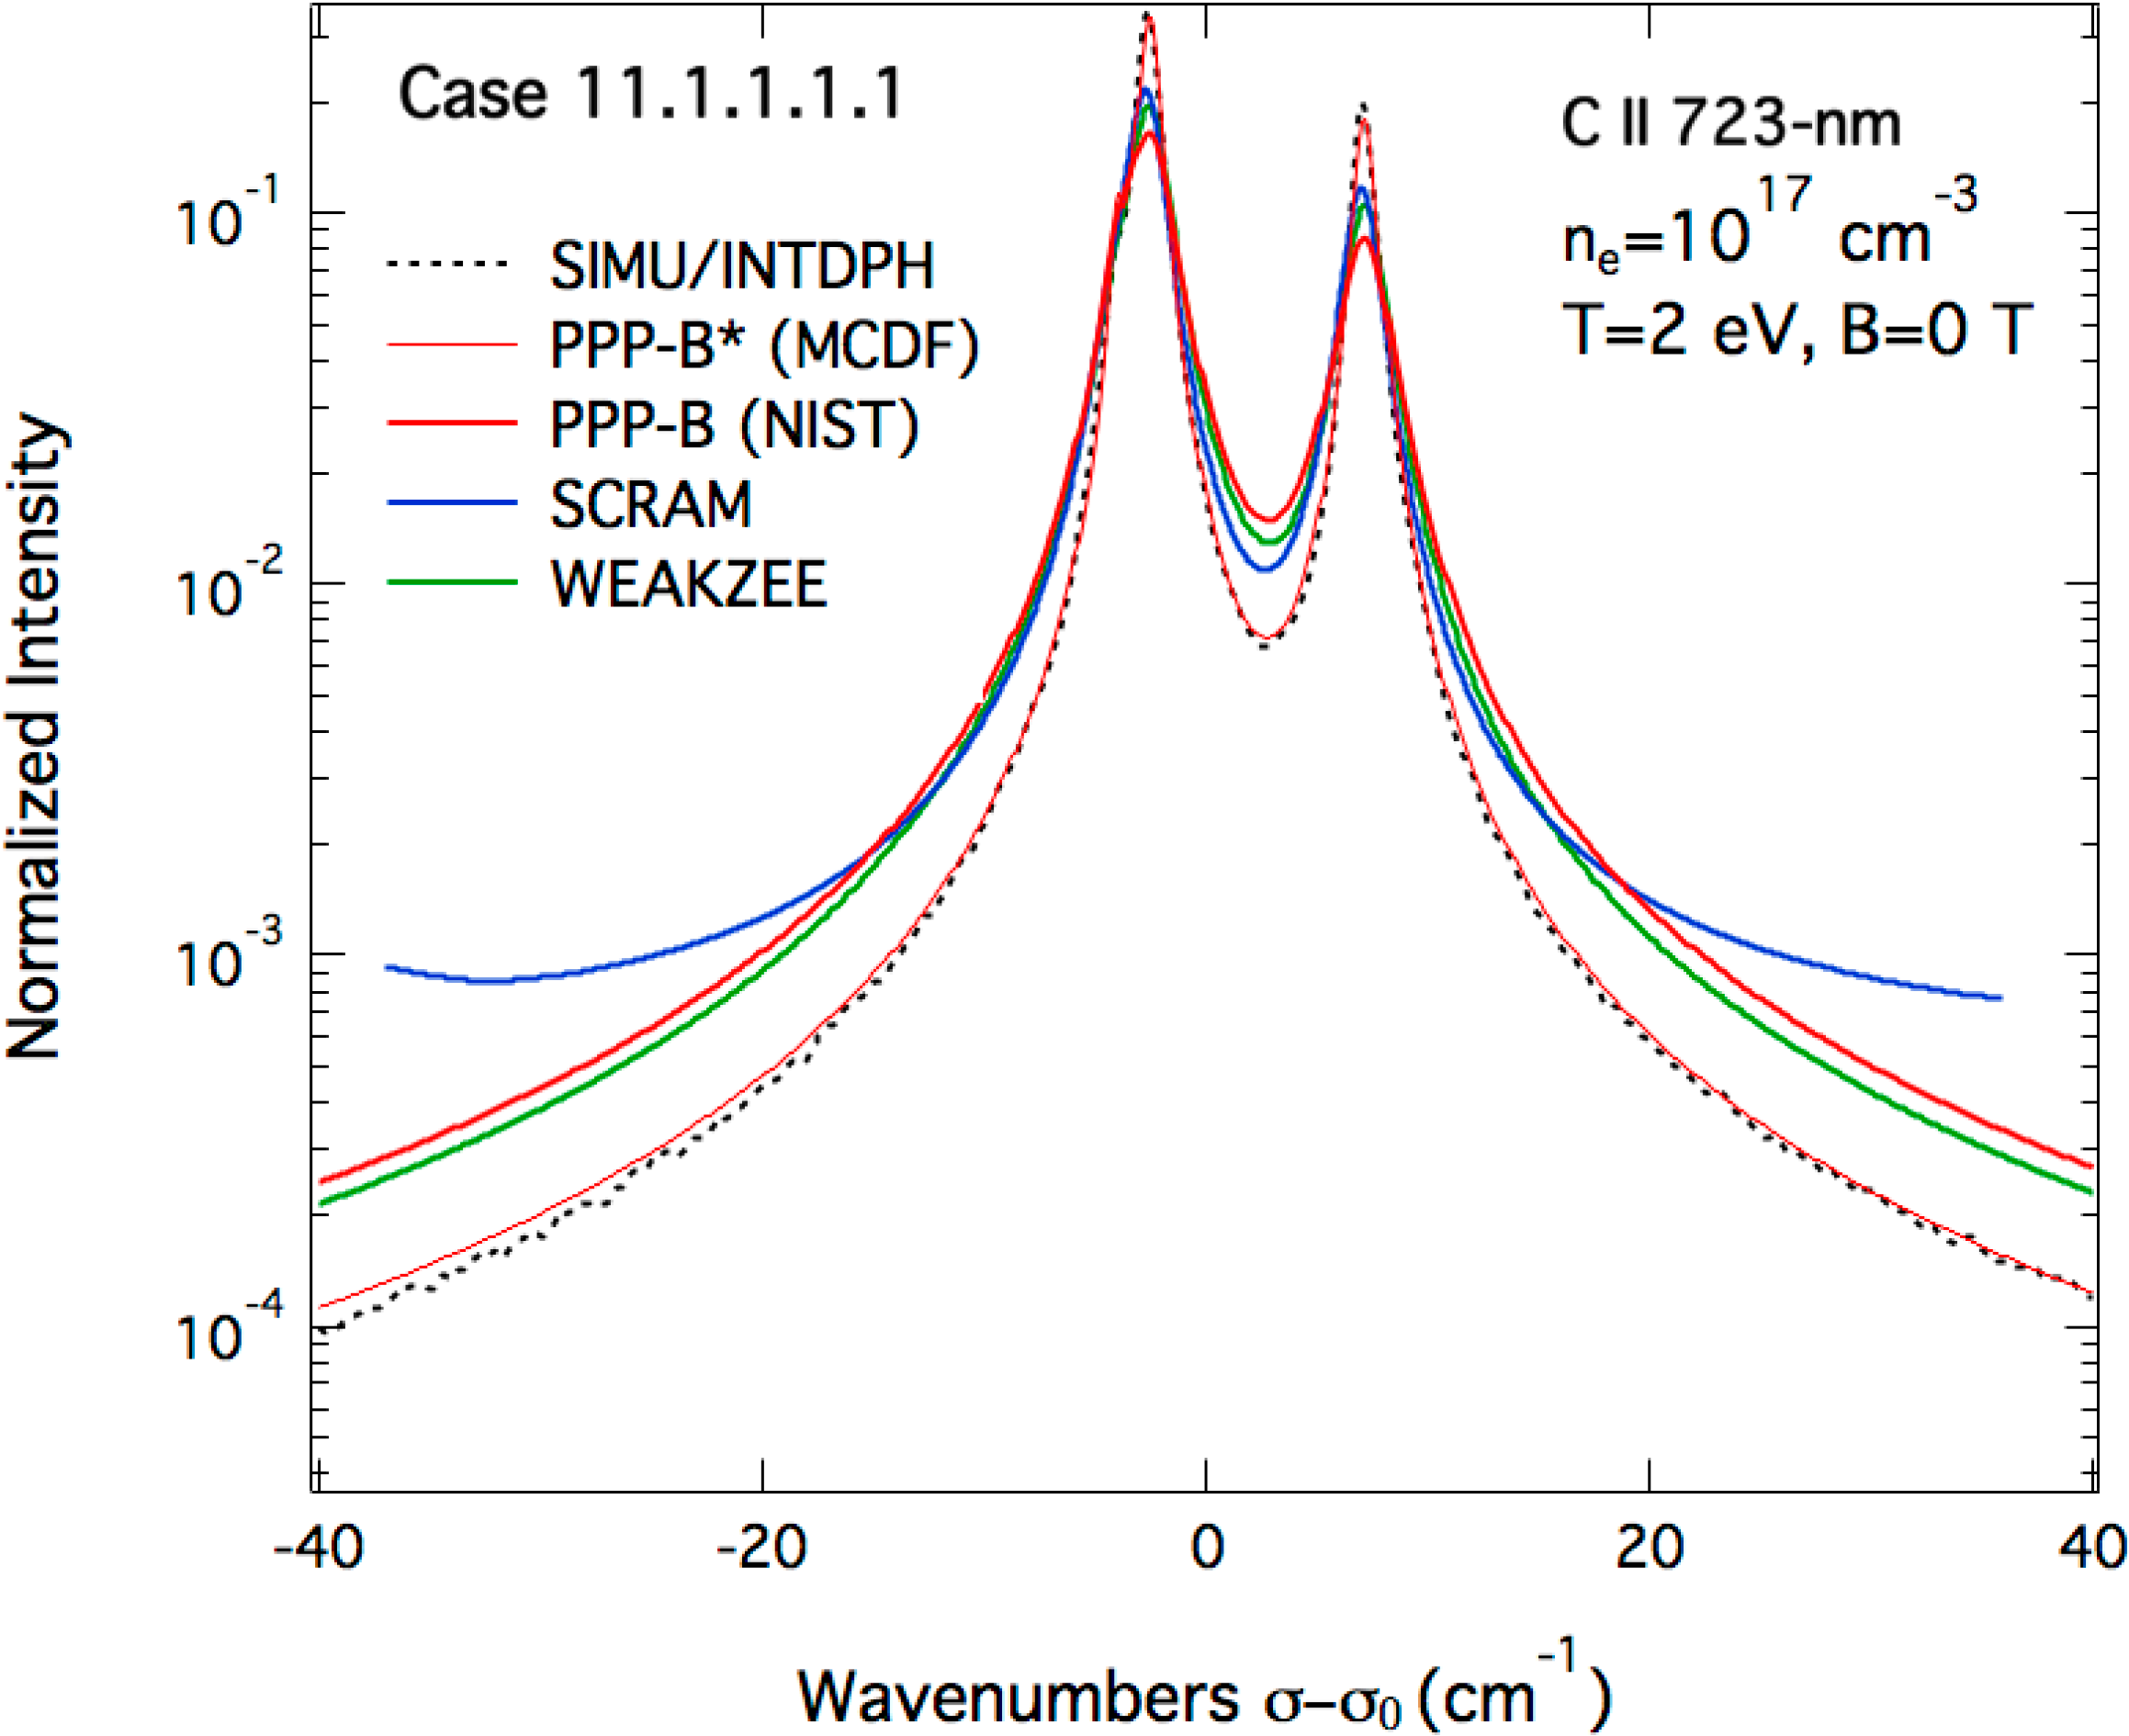
3.1. Magnetic Field-Free Case

Let us start with the modeling of the C ii 723-nm line profiles for the magnetic field-free cases with the following plasma parameters: ne = 1017 cm−3, Te = Ti = 2 eV and Te = Ti = 4 eV. Whatever are the positively charged perturbers (D+ or C+ ions), calculations show that the above line is dominated by electron broadening, the ion contribution being close to zero. This is demonstrated in Figure 3, where the electron broadened profile of the C ii 723 nm line is compared to the full pure Stark profile of the same line. The profiles shown on this figure, calculated with the PPP-B code using atomic data from NIST, demonstrate the dominance of the electron broadening over the ionic one for these typical conditions. Note that, in this paper, all the computed profiles are plotted against the wavenumber shift (in cm−1) with respect to the line center wavenumber σ0.
Before comparing the results of the different codes, it is interesting to discuss briefly the electron broadening which is treated in the frame of the impact theory in all the used codes. Different models and formulae exist for the electron collision operator [21,22]. The PPP-B and PPP-B * (as well as PPP) line shape codes use a modified electron broadening operator. This modified electron collision operator, which is based on the semi-classical GBK model due to Griem, Blaha, and Kepple [23], can be written as follows:
Atoms 02 00319 i002
where:
Atoms 02 00319 i003
Equation (3) arises from conditions on the limits of the integral over impact parameters ρmin and ρmax appearing in Equation (12) of [23]. More precisely, a strong collision term is added and different cutoffs are included in this Equation.
Figure 3. Comparison of Stark profiles of the C ii 723-nm line emitted by a pure carbon plasma (electrons and C+ ions) computed with the following parameters: ne = 1017 cm−3, Te = Ti = 2 eV and B = 0. Dashed line represents the electron broadening only while the solid one accounts for both ions and electrons, all other broadening mechanisms were ignored. Note the use of a semi-logarithmic scale. Both profiles were calculated using PPP-B with atomic data from NIST and by setting B = 0 T.
Atoms 02 00319 g003
Here, me is the electron mass and R is the position operator of the radiator. Cn is a strong collision term whose value depends on the principal quantum number n as: C2 = 1.5, C3 = 1.0, C4 = 0.75, C5 = 0.5 and Cn = 0.4 for n > 5. In Equation (4), EH and ze represent respectively the hydrogen ionization potential and the net charge of the emitter while ωp and Δωαα" designate the electron plasma frequency and the frequency separation between the state α involved in a given transition and its perturbing states αα" [24]. Moreover, the impact limit has been taken, i.e., ∆ω = 0. Equation (2) indicates that the electron interactions with the emitter result in a homogeneous broadening represented by a Lorentzian function whose full width at half maximum (FWHM) is proportional to the plasma electron density ne and inversely proportional to the square root of the electron temperature Te. It should be noted that the dipole reduced matrix elements are involved through the operator R.R present in relation Equation (2). As the line considered here is of the same type as the Li-like (Li i, B iii, N v) 2s-2p, i.e., ∆n = 0 transitions, we will not discuss the validity of impact electronic collision operators such the above one. Readers interested by that issue may refer to the discussion found in [25].
In Figure 8 of [2], various experimental and theoretical data representing Stark broadening widths (FWHM) of the C ii 723-nm line were fitted with a linear function of the plasma electron density. An electron density ne = 1017 cm−3 corresponds to a Stark FWHM of about 0.1 nm or 1.9 cm−1 in terms of wavenumbers. A very close value can be obtained from the Stark-B database [9]. The C ii 723-nm line profiles calculated by the various codes for ne = 1017 cm−3, Te = Tiv = 2 eV and B = 0 are shown on Figure 4. As the profile calculated with WEAKZEE was obtained using Lorentzian functions with FWHM taken from the Stark-B database, it can be considered as a “reference” profile with a Stark width ∆σ0. Several points can be noted from Figure 4. First, the calculations with SIMU and INTDPH as well as PPP-B* (PPP-B code but with MCDF atomic data) give lower Stark widths, i.e., Δσ < Δσ0. Note the agreement between SIMU/INTDPH and PPP-B * despite the differences between the used atomic physics: NIST atomic data for the former and MCDF data for the latter. Second, in term of Stark widths, the profiles obtained with PPP-B slightly higher than (Δσ ≥ Δσ0) while those obtained with SCRAM are very close to (Δσ ≈ Δσ0) the “reference” one. This means that the electronic collision operator given by Stark-B and GBK lead to the close results. This is confirmed in Table 2, which presents the ratios of the Stark FWHM ∆σ to the “reference” value ∆σ0 for the different codes. In terms of line-shapes, it can be seen from Figure 4 that PPP-B agrees with WEAKZEE for the line wings. While SCRAM appears to overestimate the line wings, which is due to its inclusion of continuum emission where the other codes included only the line features. The same remarks and conclusions about both Stark widths and shapes of the C ii 723-nm line can be drawn for the case with ne = 1017 cm−3 and Te = Ti = 4 eV in the absence of the magnetic field (B = 0).
Table 2. Comparison of the Stark Full Width at Half Maximum (FWHM) ∆σ of the C ii 723 nm line extracted from the profiles synthetized by the different codes with respect to a reference FWHM ∆σ0 for ne = 1017 cm−3, Te = Ti = 2 eV and B = 0.
CodePPP-BPPP-B *SIMU/INTDPHSCRAMWEAKZEE
∆σ/∆σ01.20.60.50.91.0

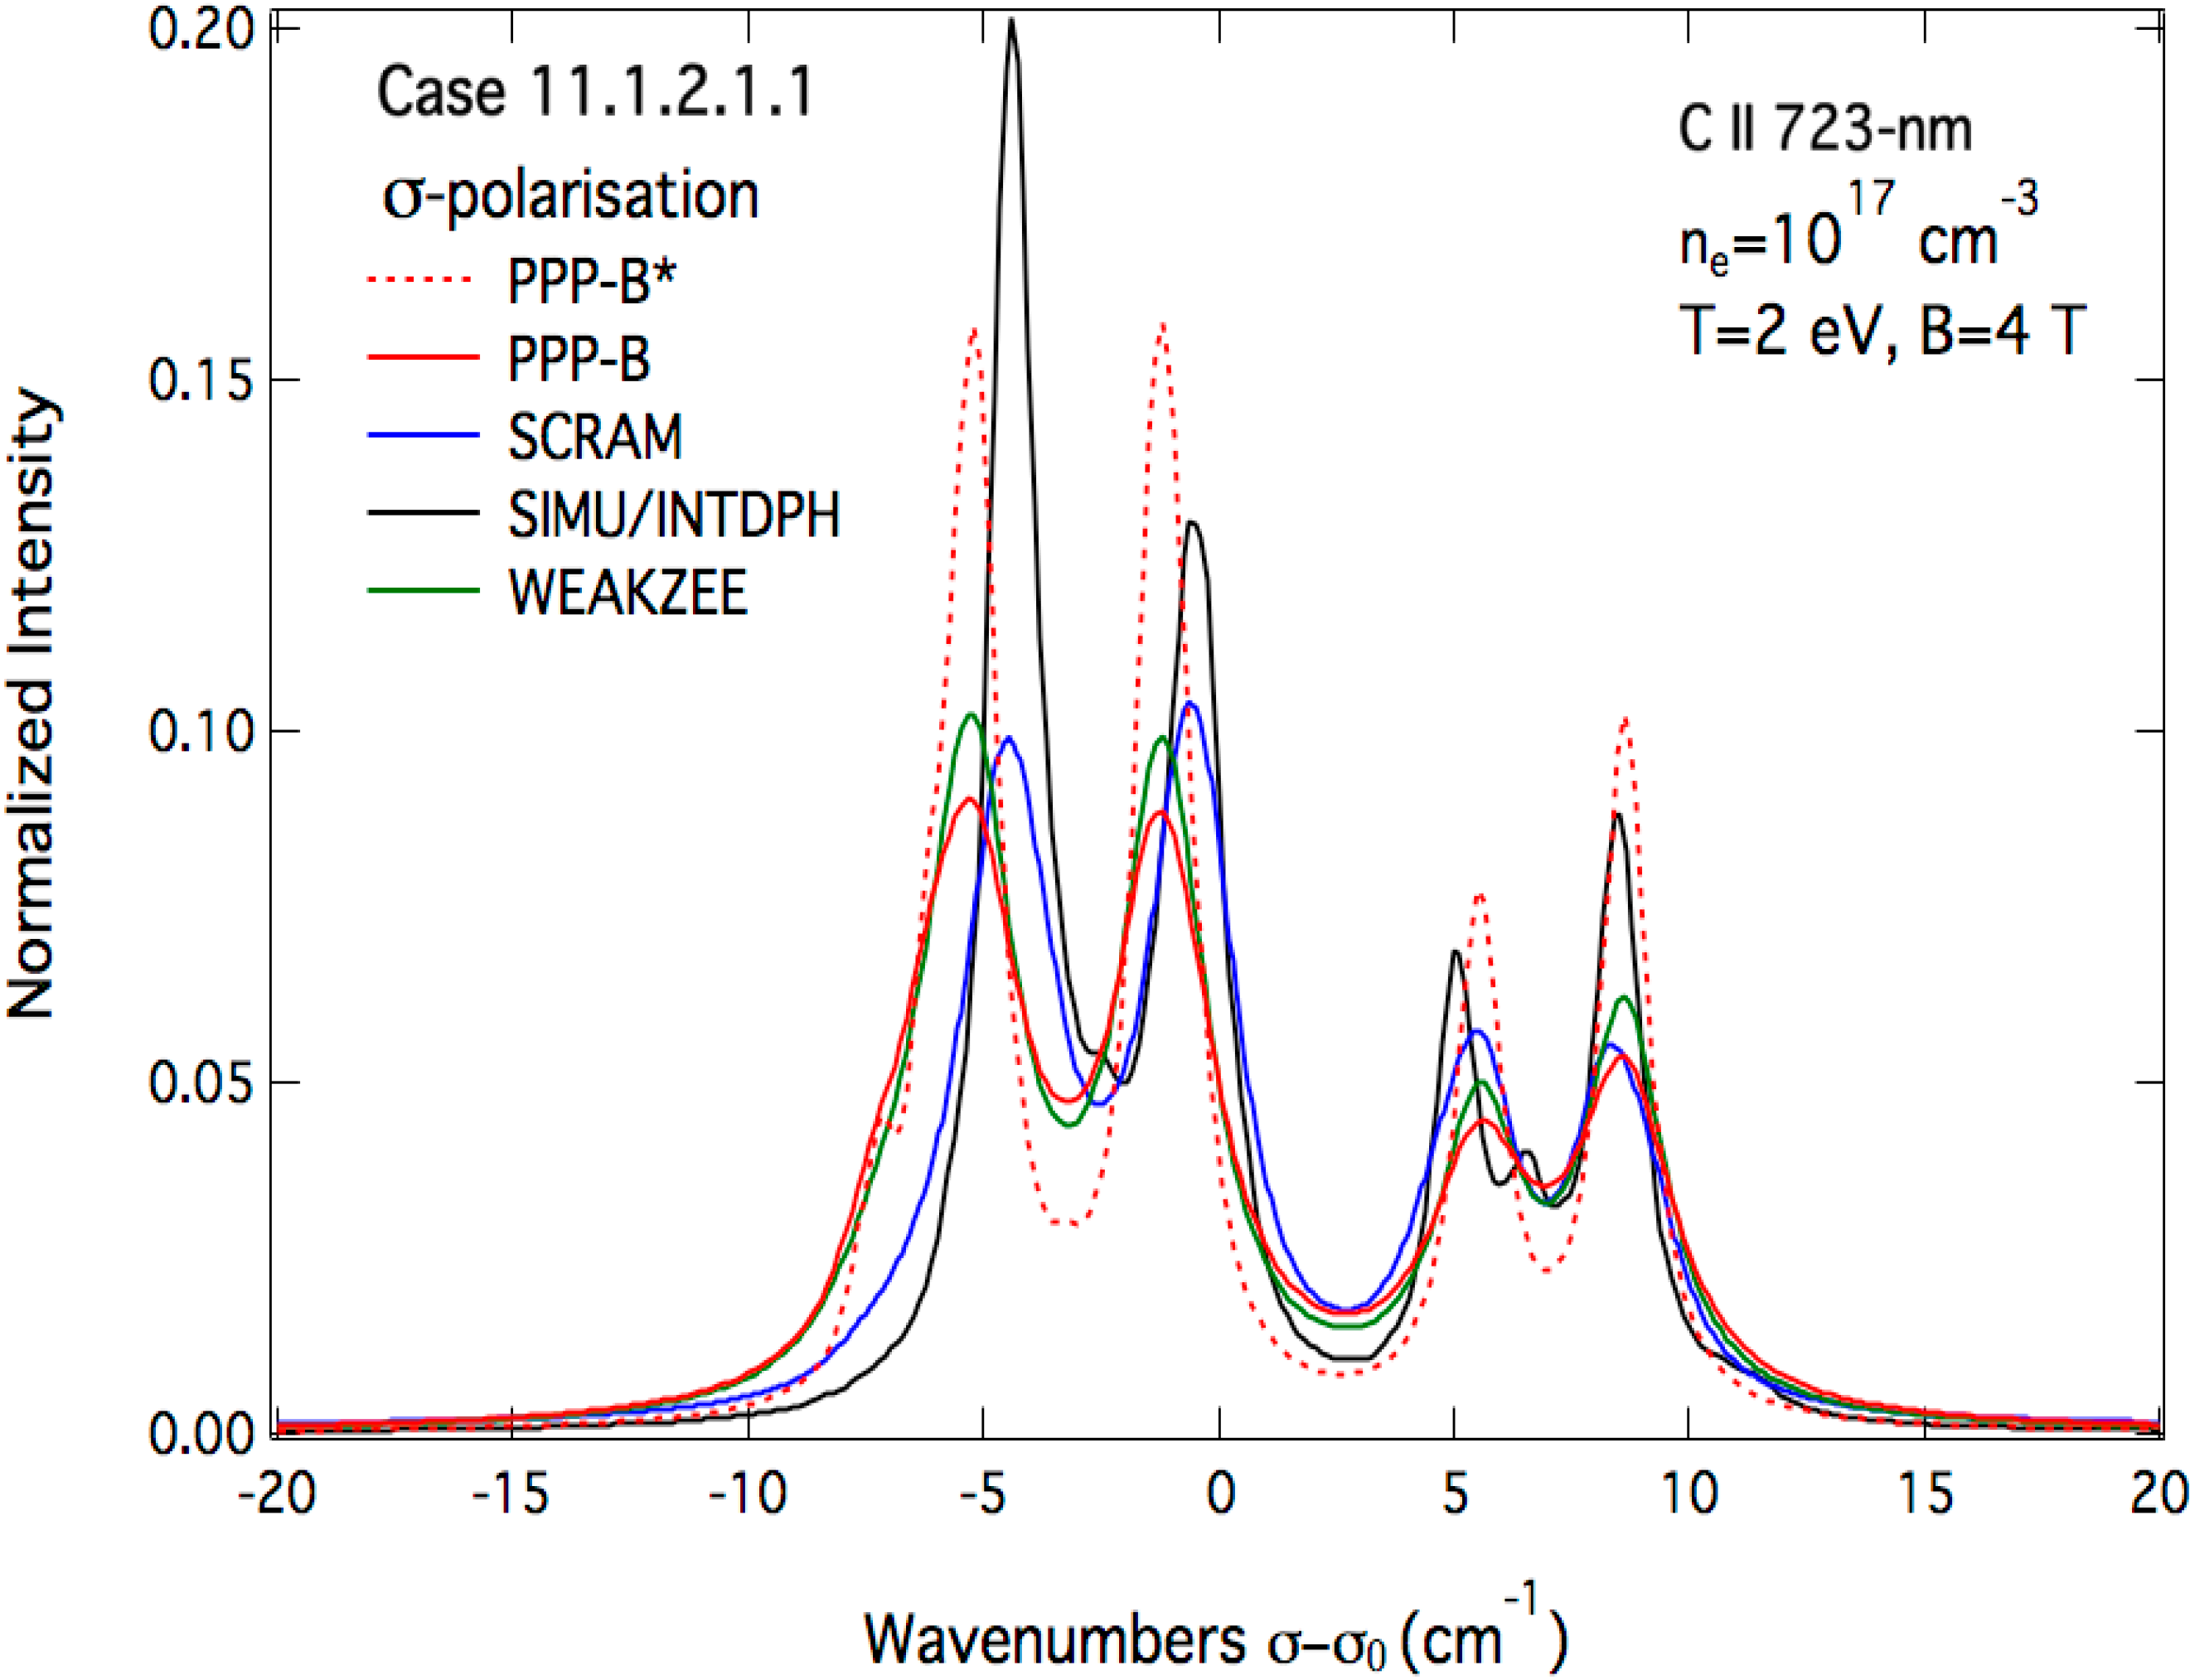
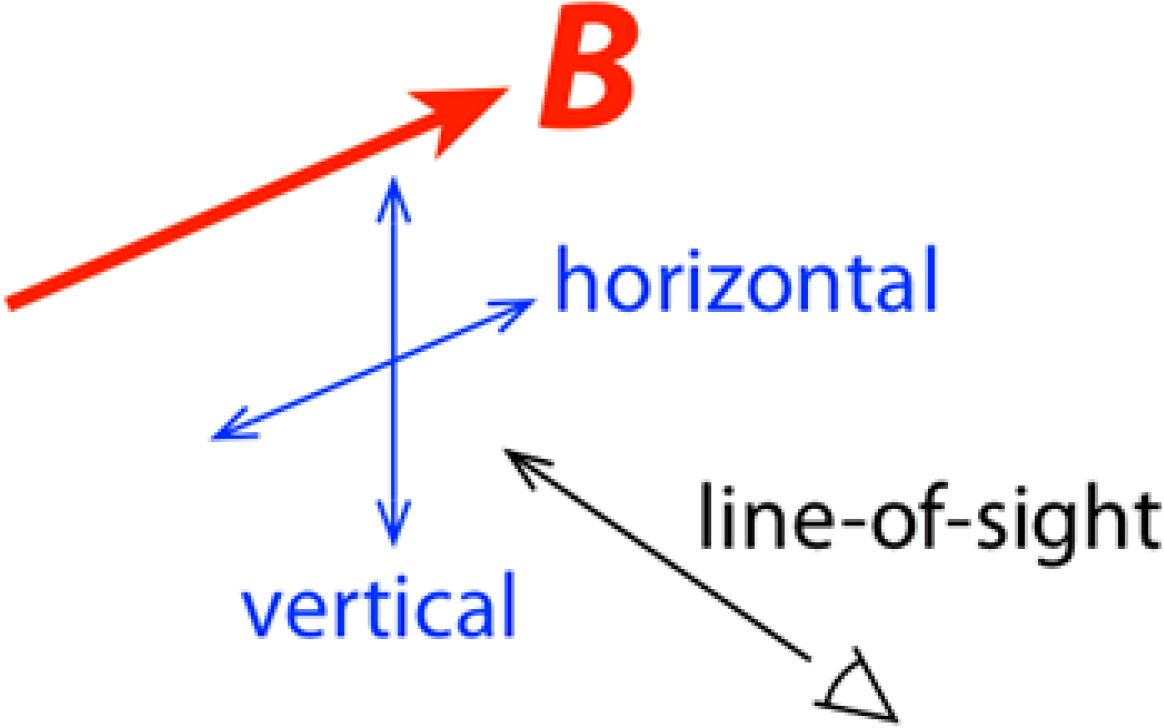
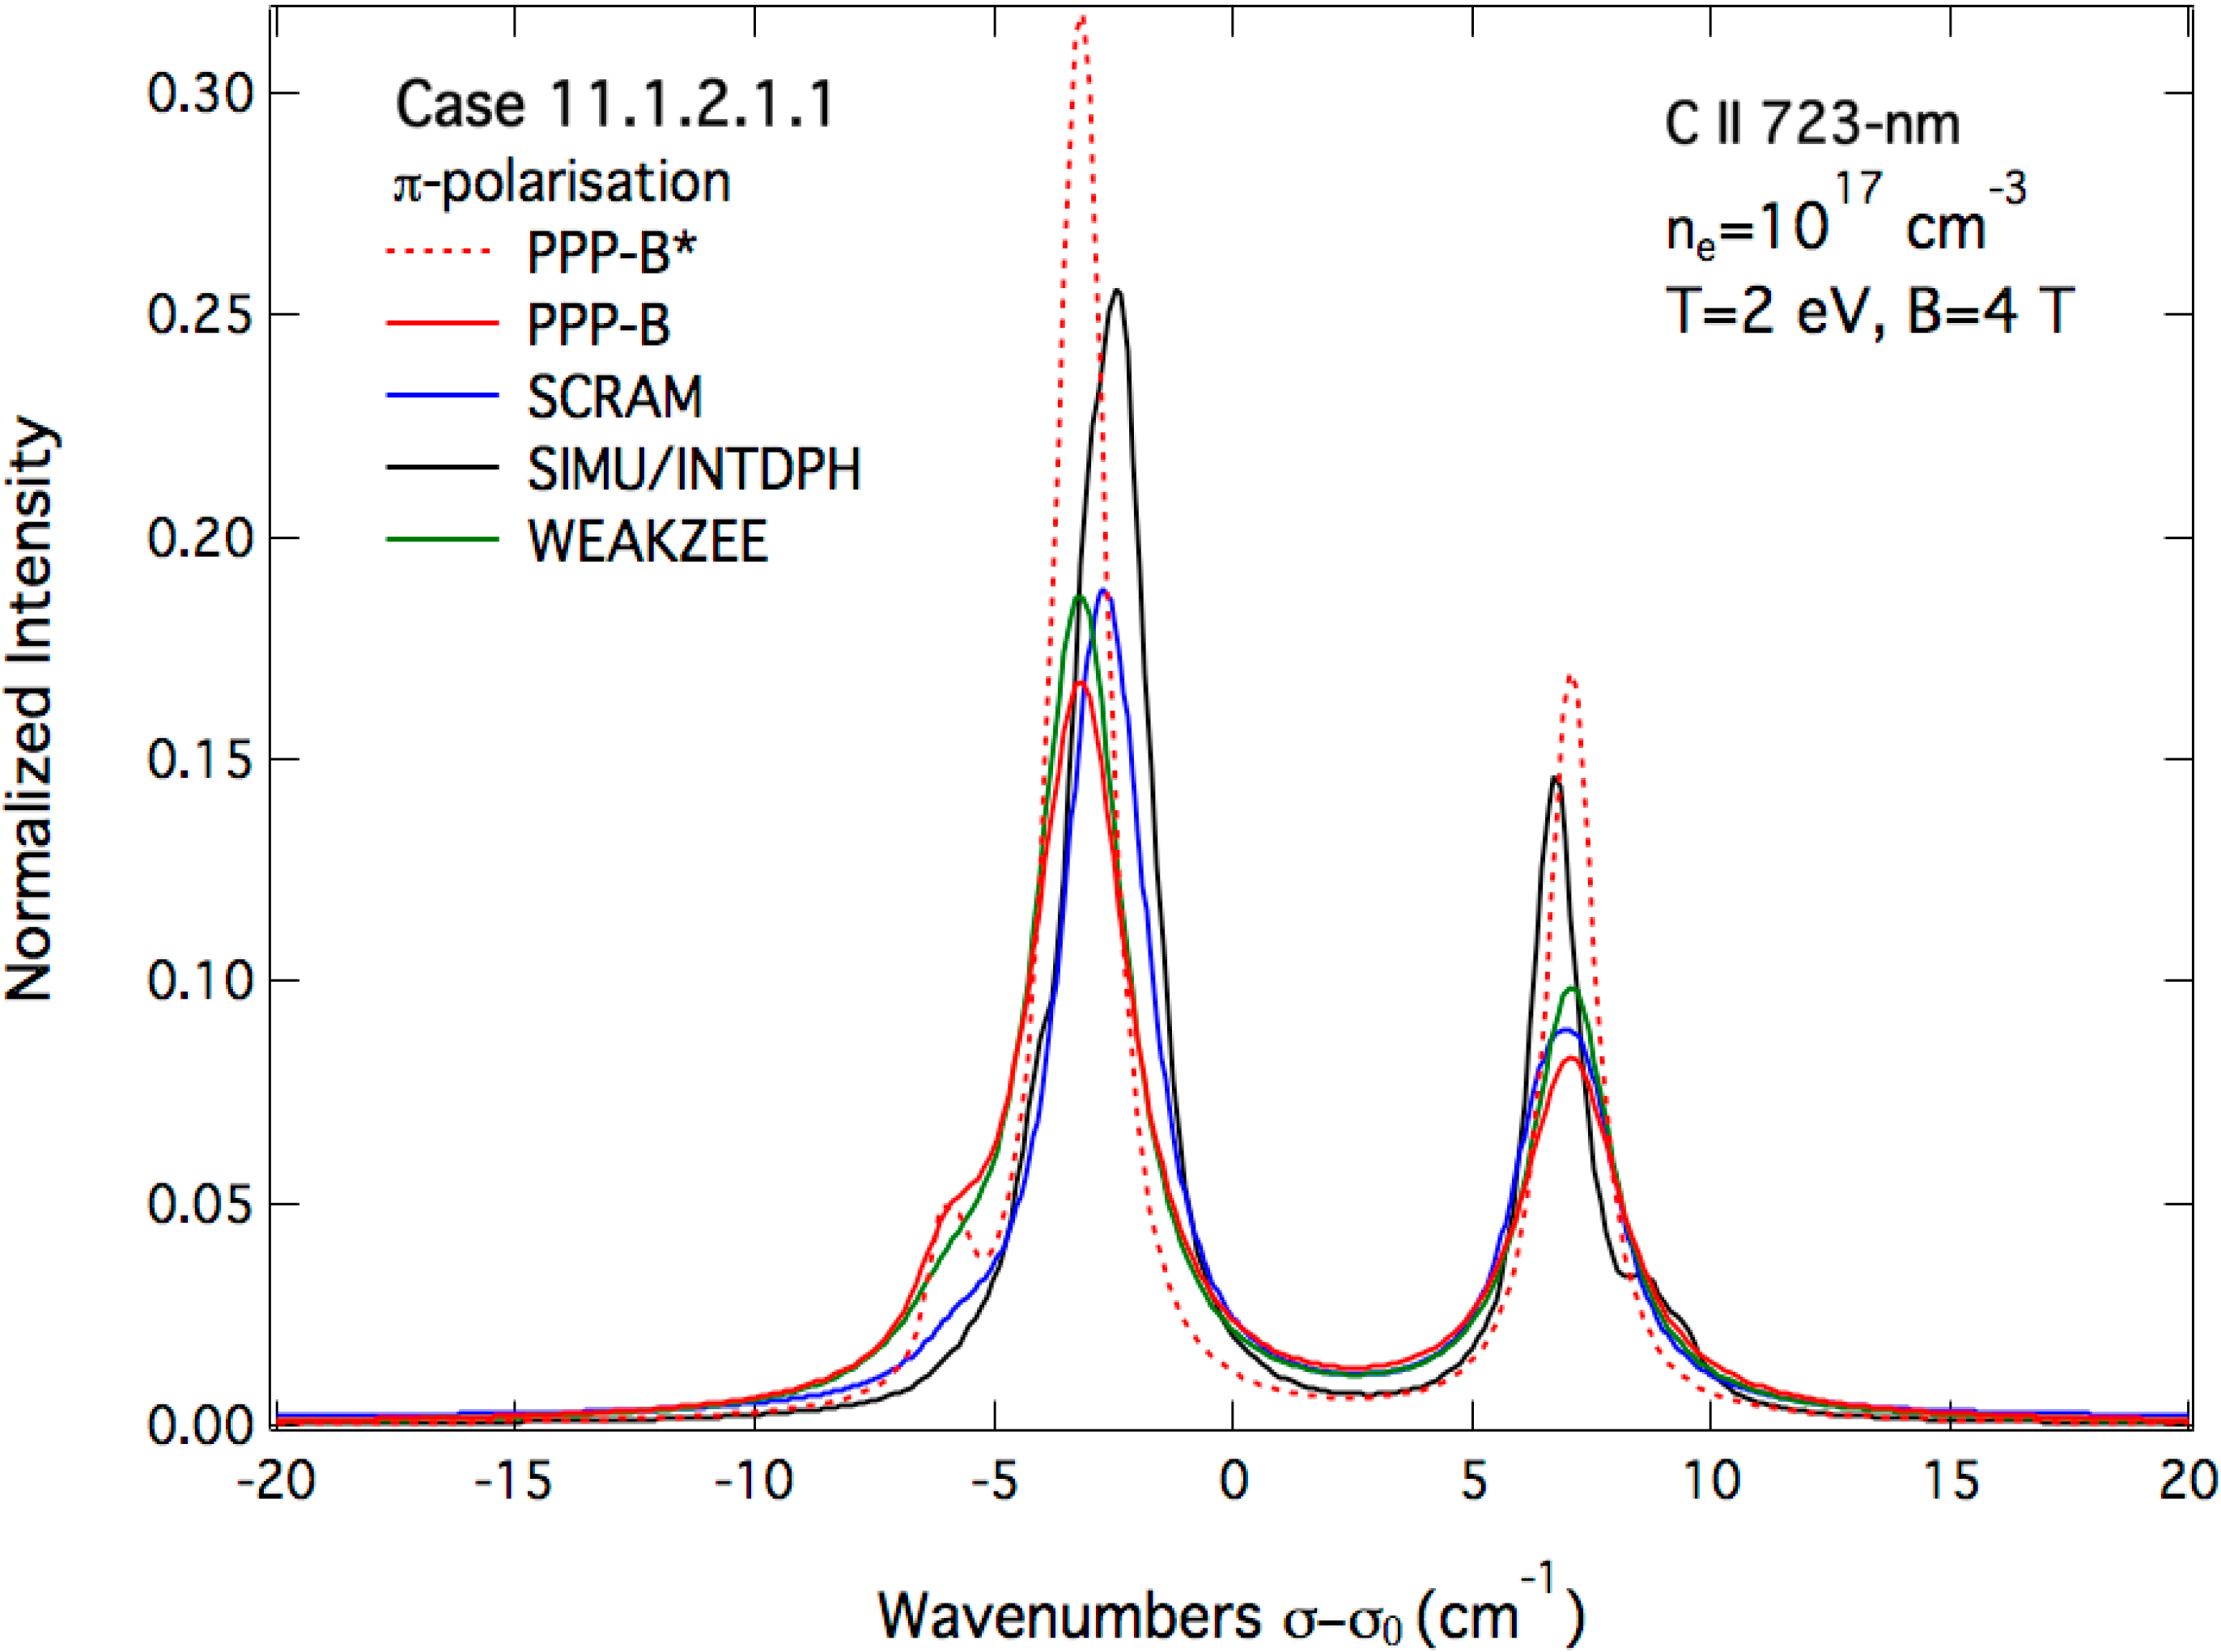
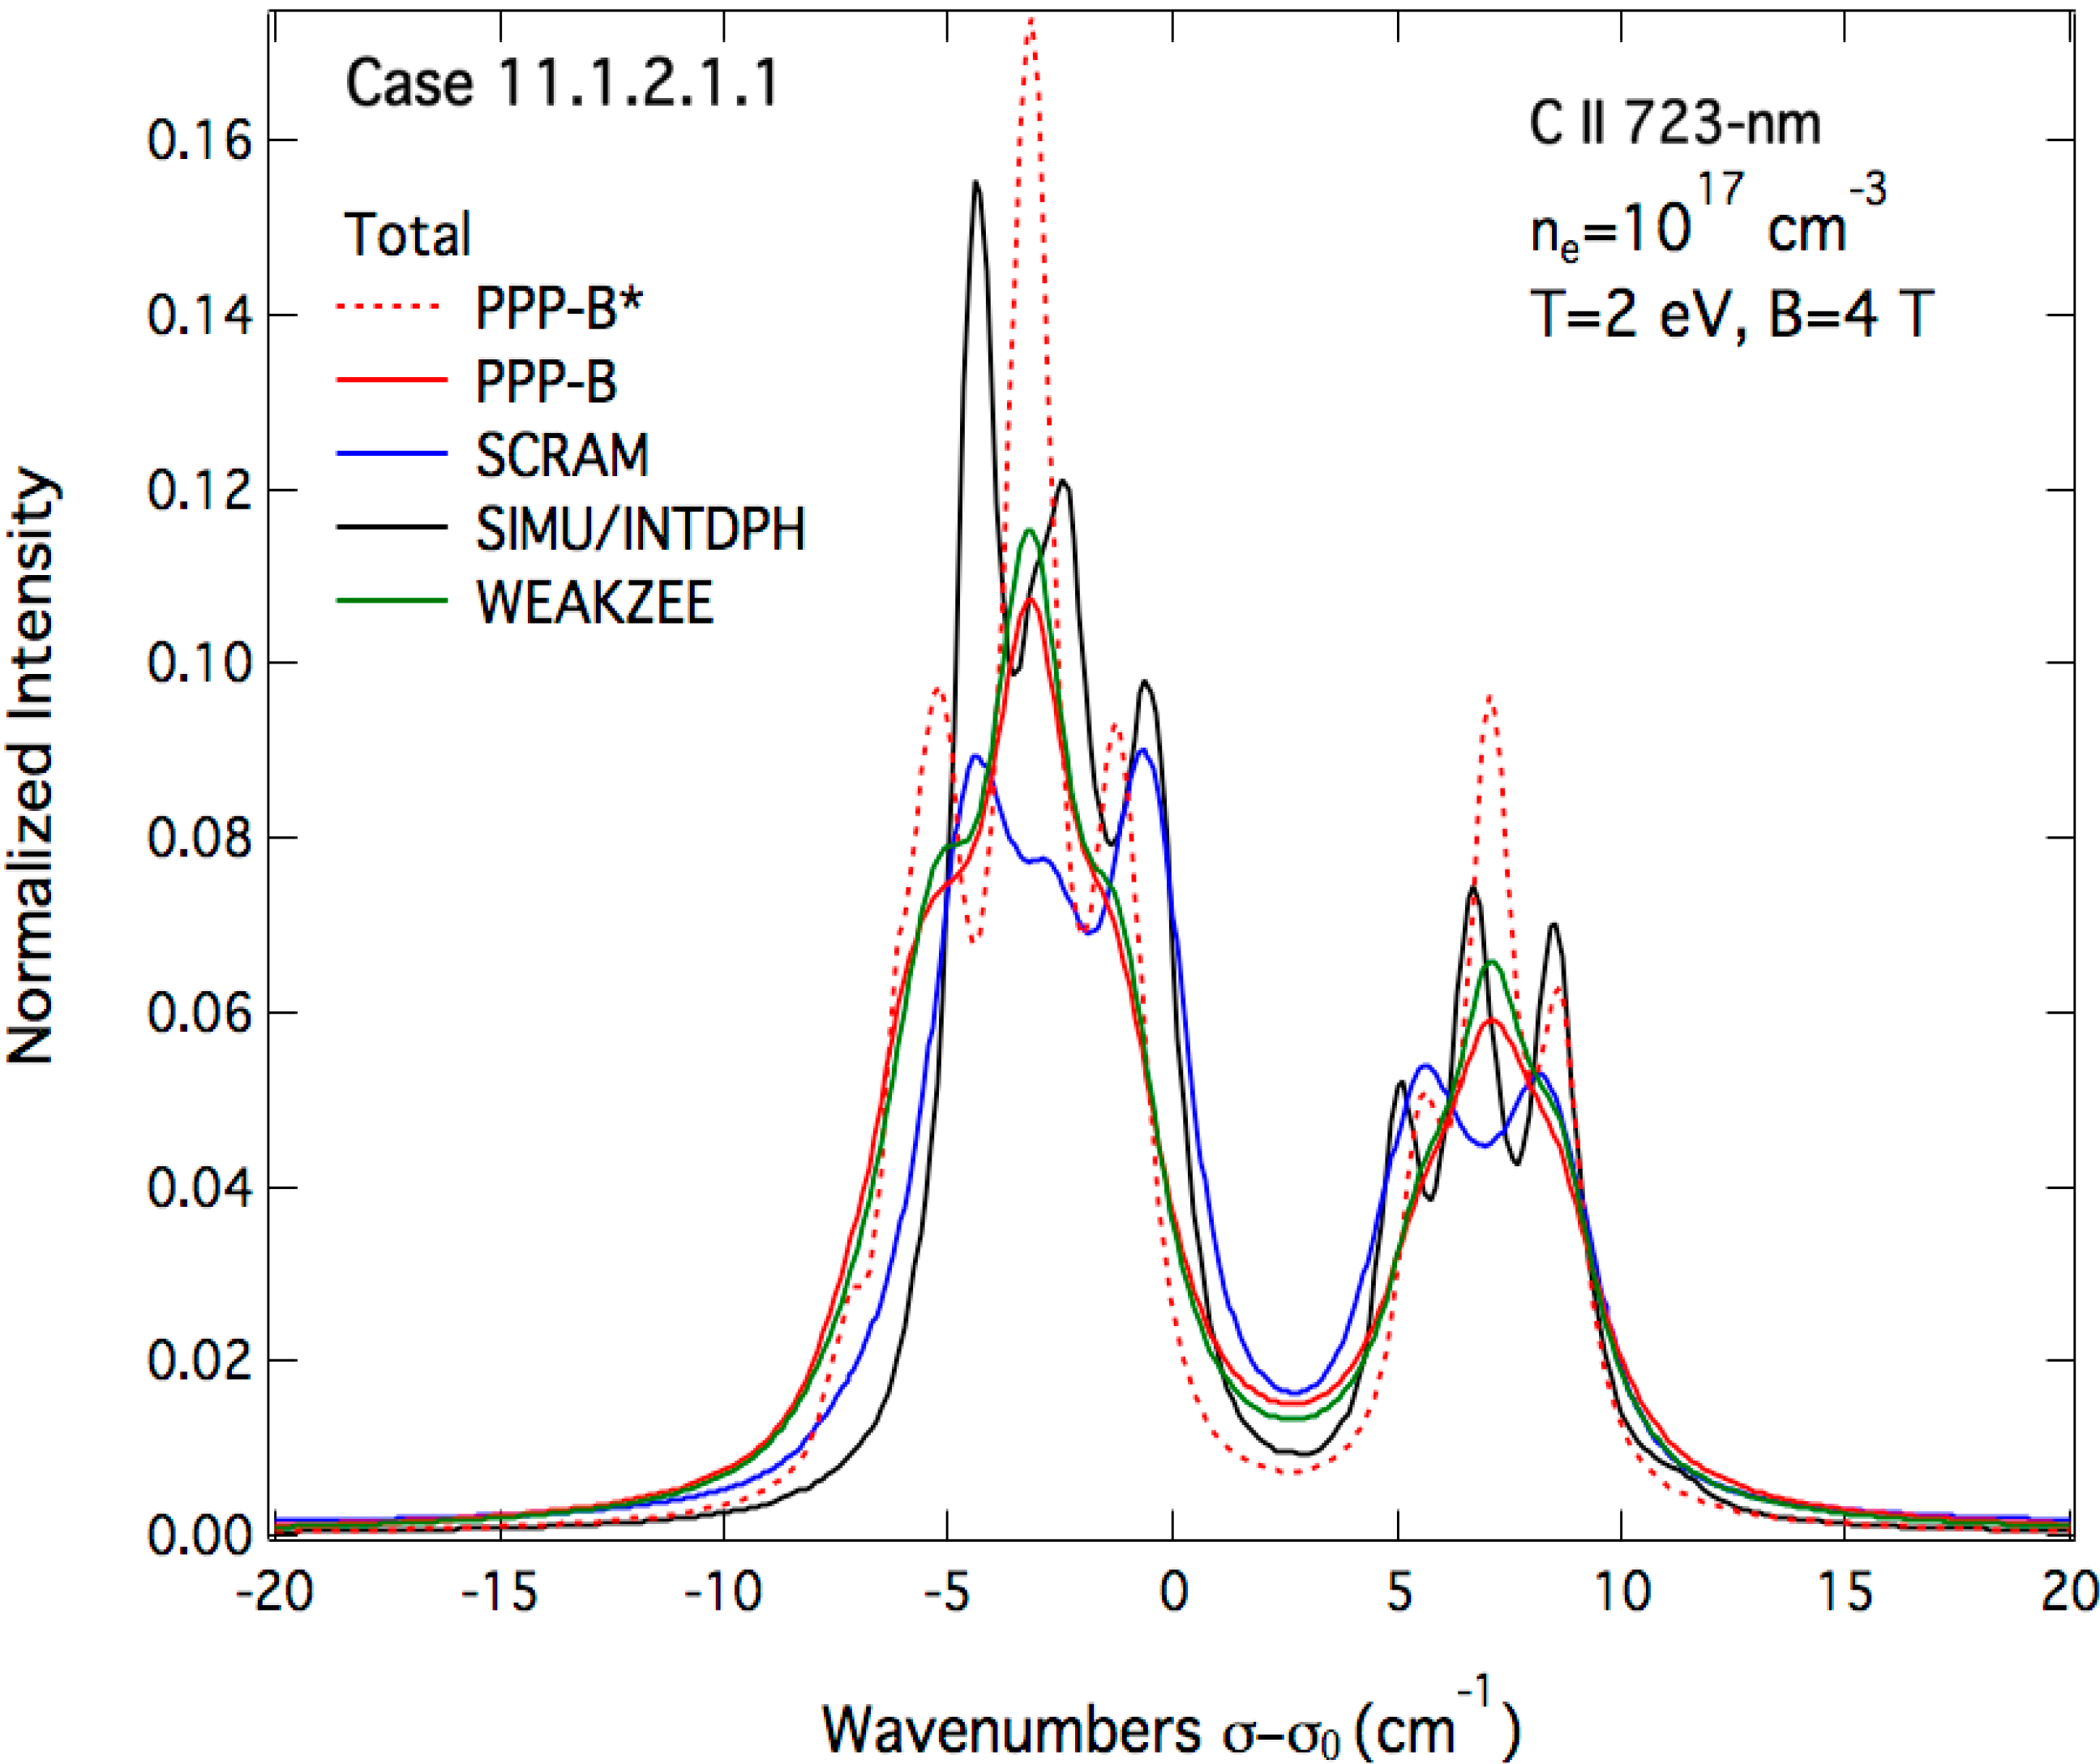
3.2. Magnetic Field Case

Let us now compare the synthetic profiles in the presence of a magnetic field B = 4 T. The presence of the magnetic field imposes a constraint on the radiation polarization. Photons whose polarizations are parallel or perpendicular to the B-field form respectively the π and σ components of the spectral line profile. These components as calculated by the previously mentioned codes are shown in Figure 5 and Figure 6. On the other hand, assuming a perpendicular observation with respect to B, the total spectral line profile is calculated from the σ- and π-polarized ones Iσ and Iπ using the following formula:
Itot(σ) = Iπ(σ) + 2Iσ(σ)
Total profiles are compared on Figure 7.
While the overall agreement between codes in Figure 5, Figure 6 and Figure 7 is quite good within a factor two in terms of Stark FWHM, there are some significant differences: The profiles provided by SIMU/INTDPH show more structures around the line center than the other results. This can be attributed to the fact the Zeeman effect is fully treated by these two codes but at the same time the Stark broadening is smaller than that of the other codes, as illustrated in the B-field free case. Note that for C ii 723-nm line, the fine structure splitting of its lower and upper energy levels are ∆E3p = E(3p 23/2) − E(3p 21/2) ≈ 11.2 cm−1 and ∆E3d = E(3d 2D5/2) − E(3d 2D3/2) ≈ 1.4 cm−1 respectively. The energy splitting of the same levels due to Zeeman effect is about ∆EB ≈ 0.8 cm−1 for B = 2 T and 1.6 cm−1 for B = 4 T. It is clear that for these values of the magnetic field, the Zeeman splitting is comparable to the fine-structure one for the upper energy levels and therefore the use of the weak-field approximation becomes questionable. As for the field-free case, PPP-B * reproduces well the wings computed by both SIMU and INTDPH codes. The profiles computed by WEAKZEE, PPP-B and SCRAM show less features because of the weak-field approximation used to treat the Zeeman effect but the line widths are more correct as compared to those obtained with SIMU/INTDPH. In terms of Stark widths these remarks corroborate those concerning the field-free case. Calculations of profiles of the C ii 723-nm line for the same plasma parameters as above with T = 4 eV instead of 2 eV lead to the same conclusions.
Figure 4. Comparison of synthetic Stark profiles of the C ii 723-nm line emitted by a plasma with ne = 1017 cm−3, Te = Ti = 2 eV and B = 0 in a semi-logarithmic scale. The dashed line represents the profile obtained with the simulation code SIMU. Note that the profile calculated with INTDPH code is not shown here as it is almost identical to the one obtained with SIMU. The solid thick red line represents the profile calculated with the PPP-B code using the most accurate atomic data provided by NIST while the solid thin red line is the one obtained with the same code PPP-B (PPP-B *) but with atomic data calculated with an MCDF code. Solid blue and green lines represent the profiles obtained respectively with SCRAM (which includes continuum as well as line emission) and WEAKZEE.
Atoms 02 00319 g004
Figure 5. Comparison of the Stark–Zeeman σ-component of the C ii 723-nm line as computed by the different line-shape codes for a carbon plasma with the following parameters: ne = 1017 cm−3, Te = Ti = 2 eV and B = 4 T.
Atoms 02 00319 g005
Figure 6. Comparison of the Stark–Zeeman π-component of the C ii 723-nm line as computed by the different line-shape codes for the same conditions as in Figure 5.
Atoms 02 00319 g006
Figure 7. Comparison of the total Stark–Zeeman profiles of the C ii 723-nm line as computed by the different line-shape modeling codes for the same conditions as in Figure 5 and Figure 6 with an angle of observation of 90° with respect to the magnetic field direction.
Atoms 02 00319 g007

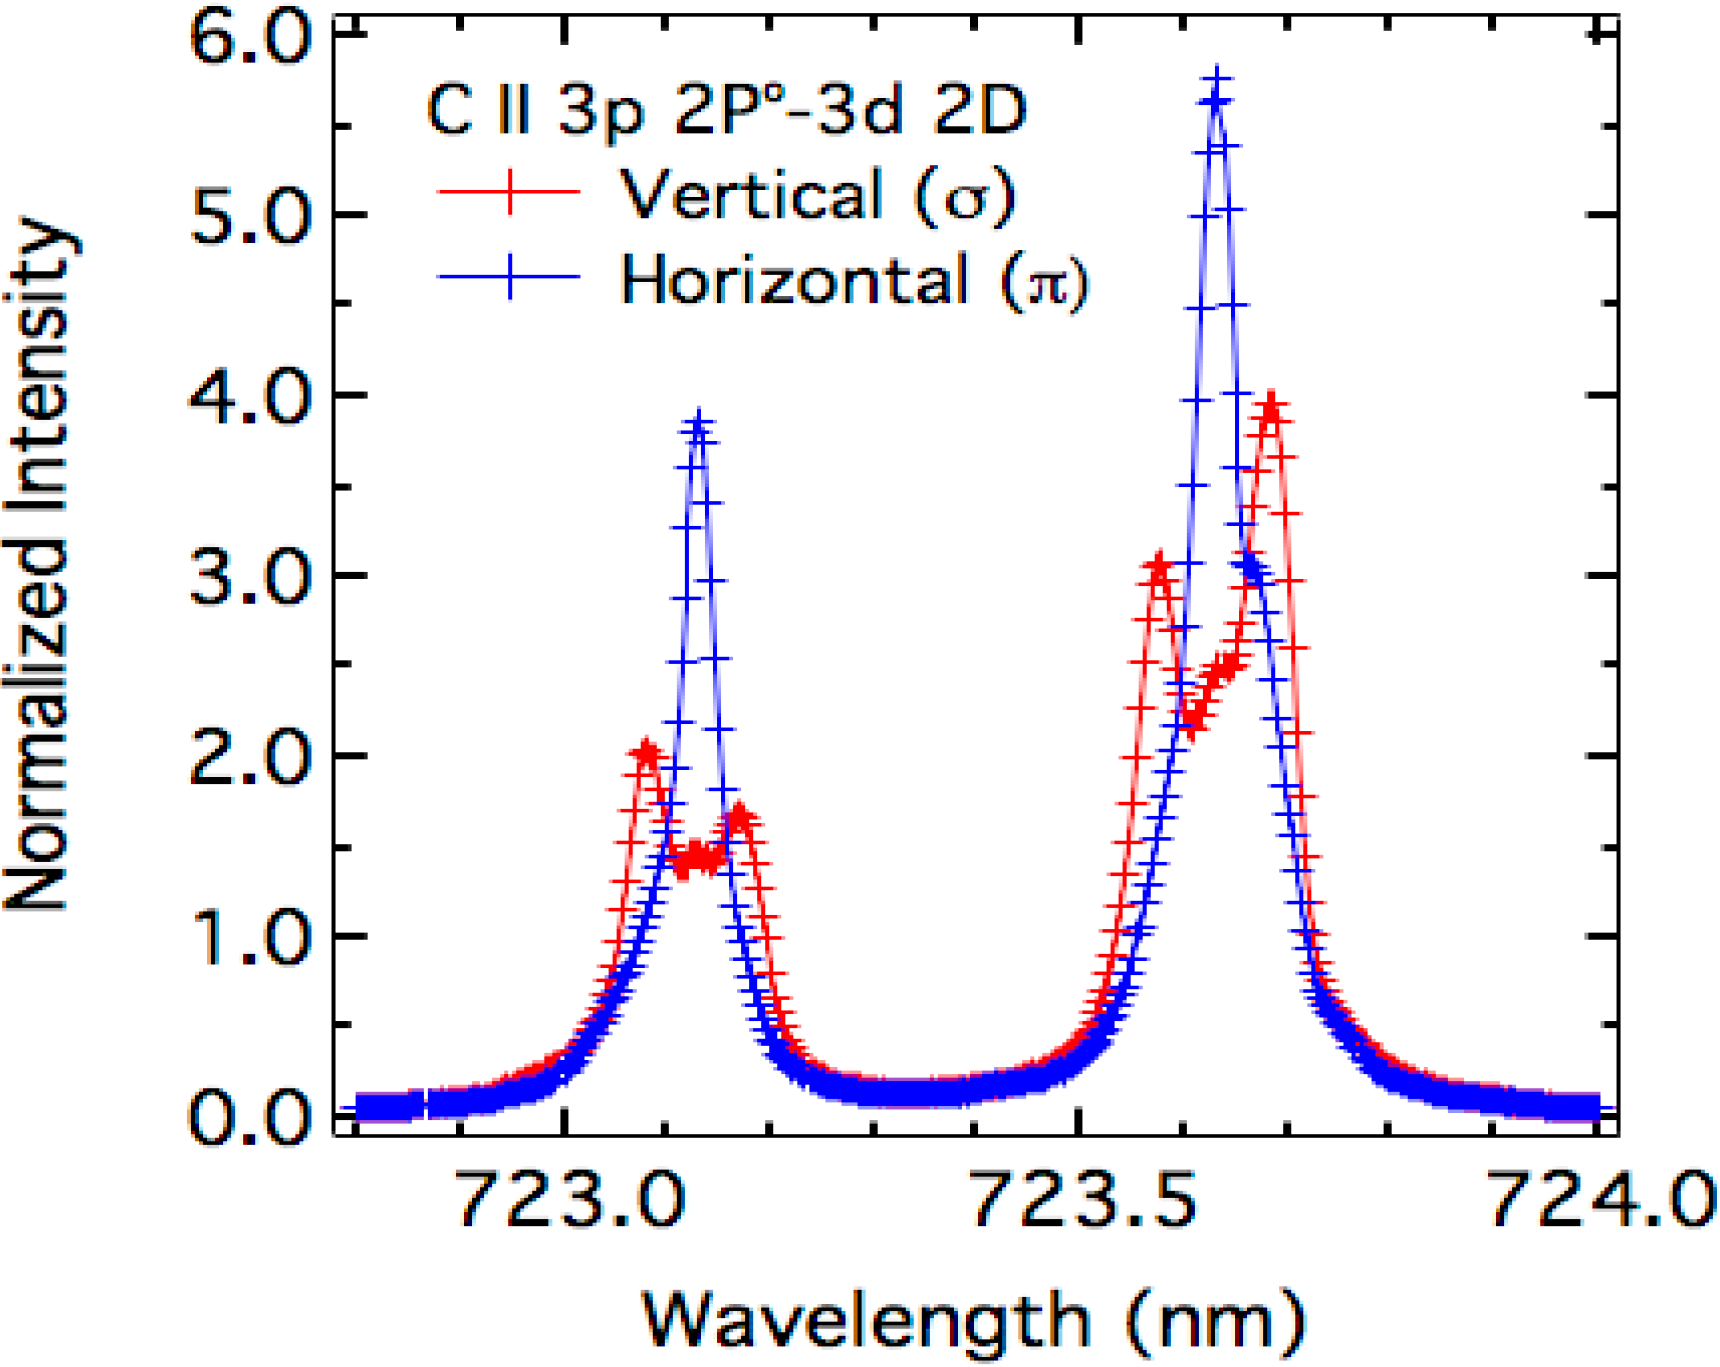
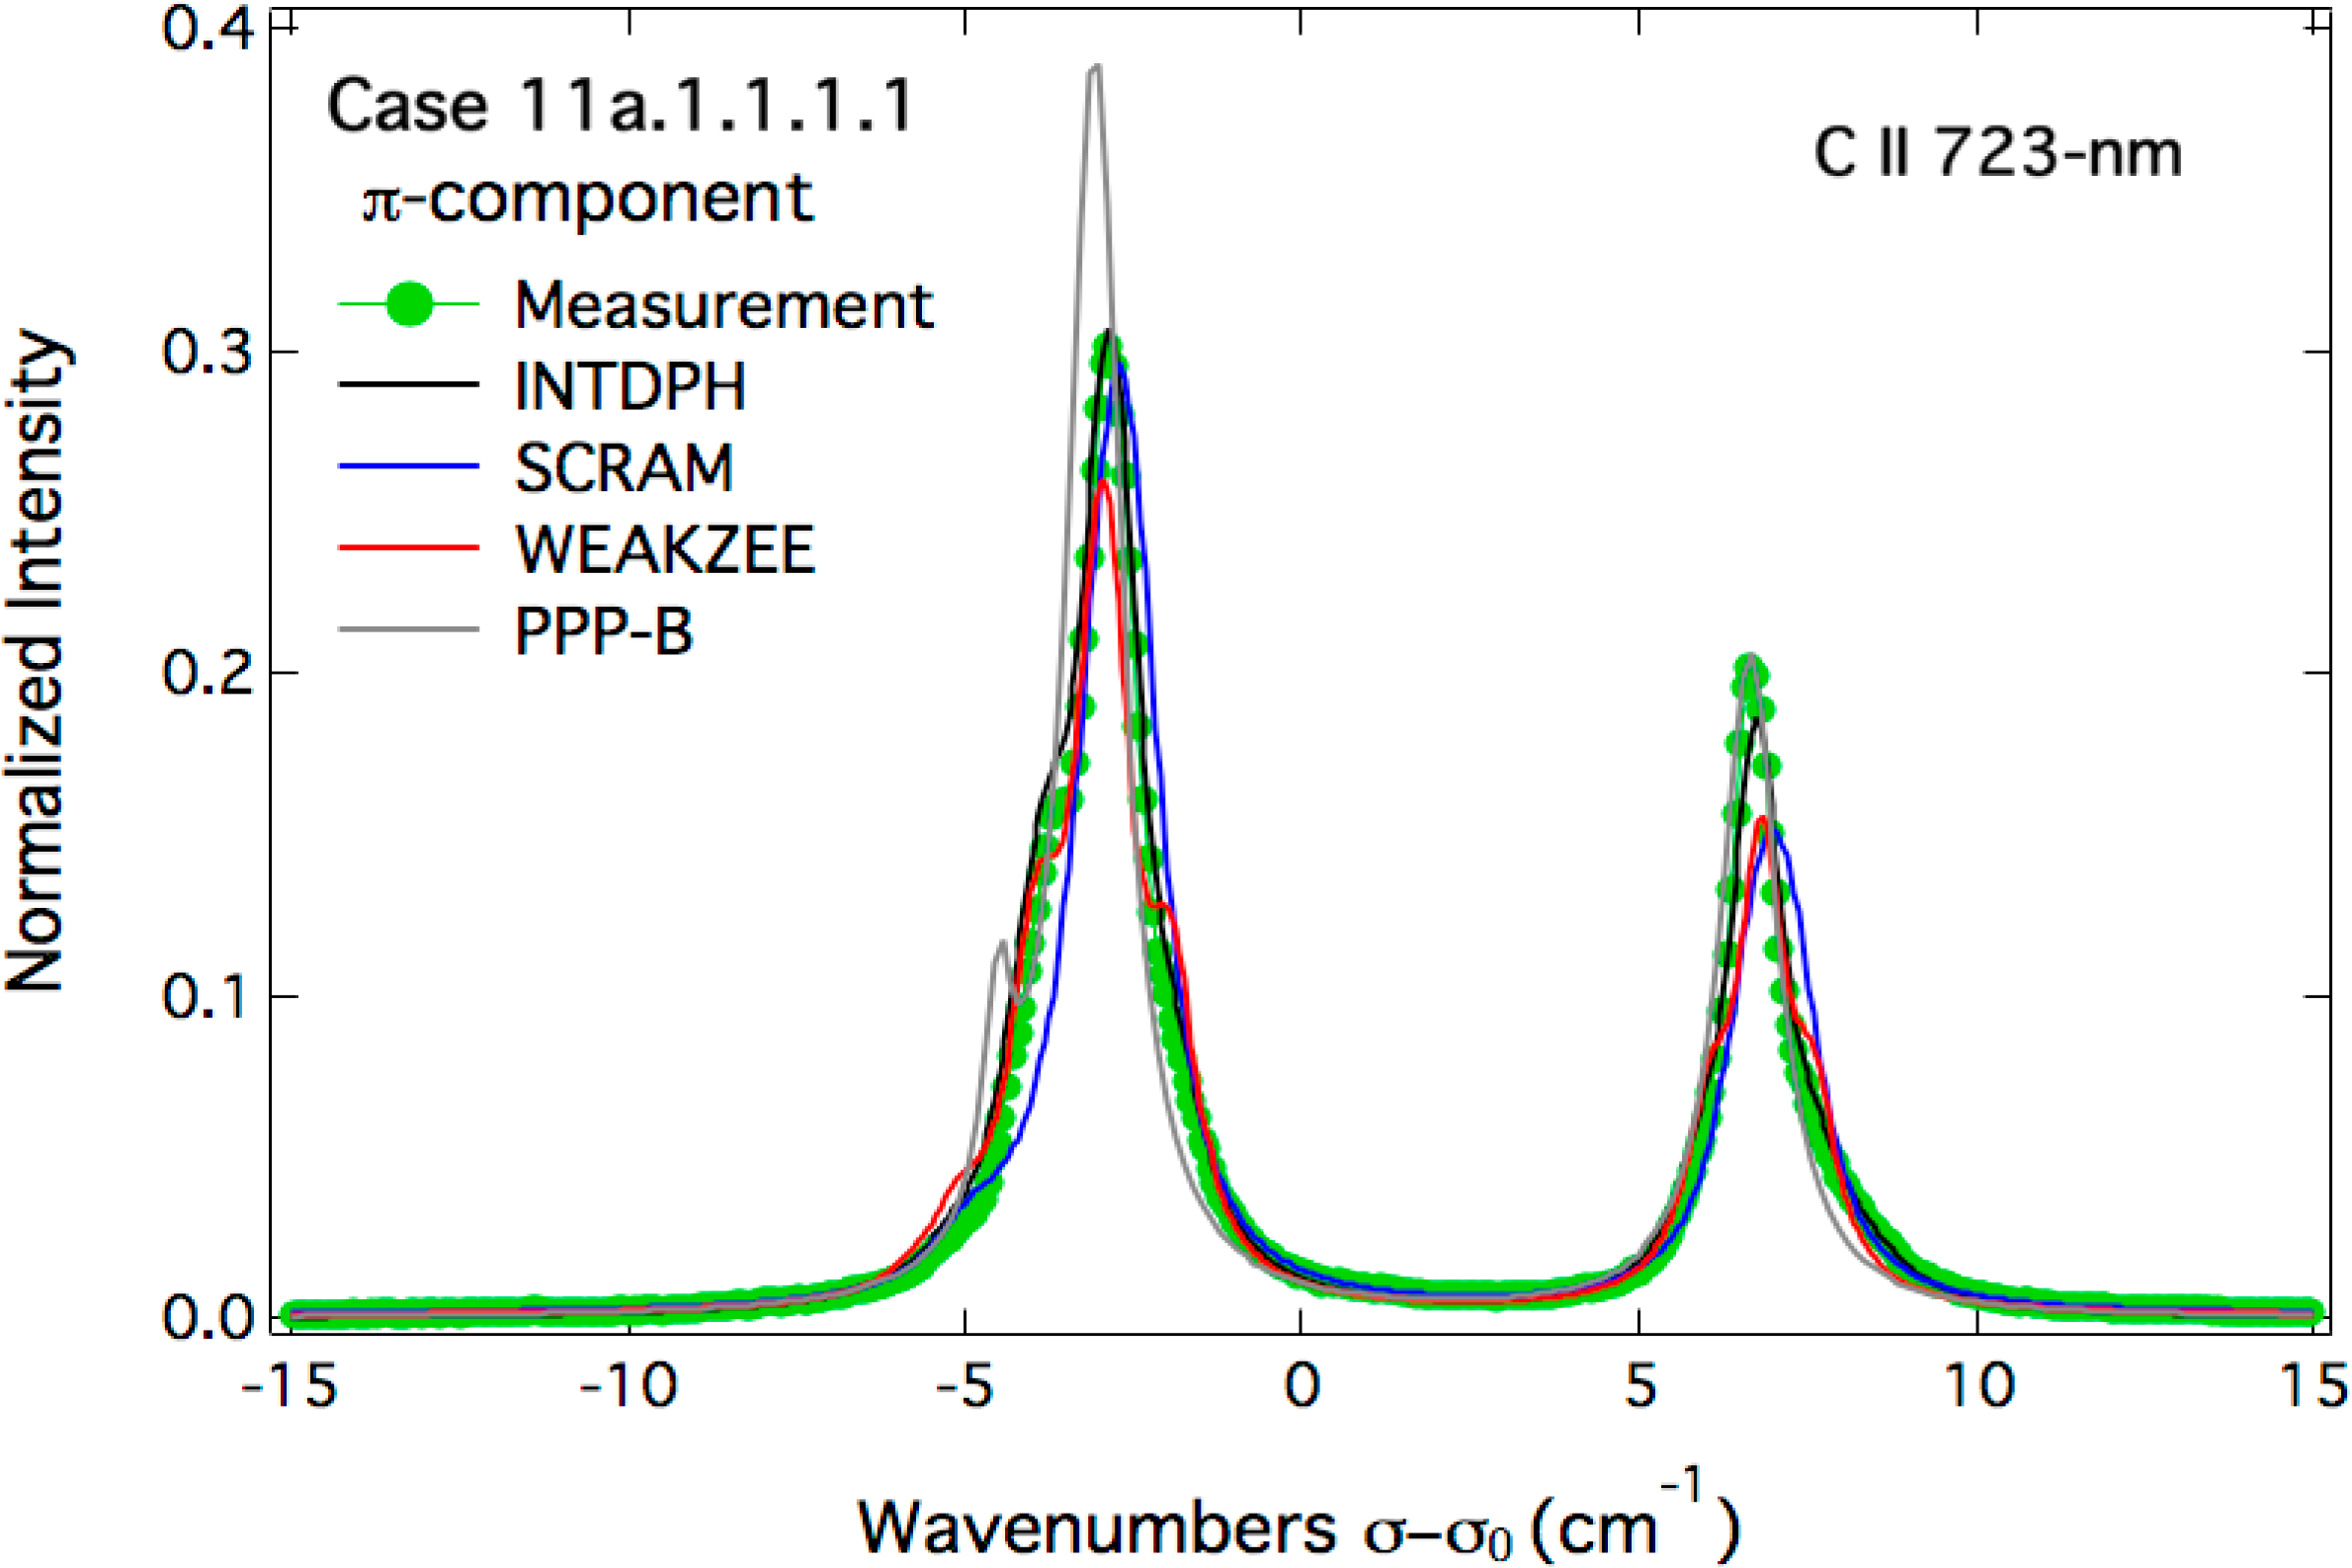
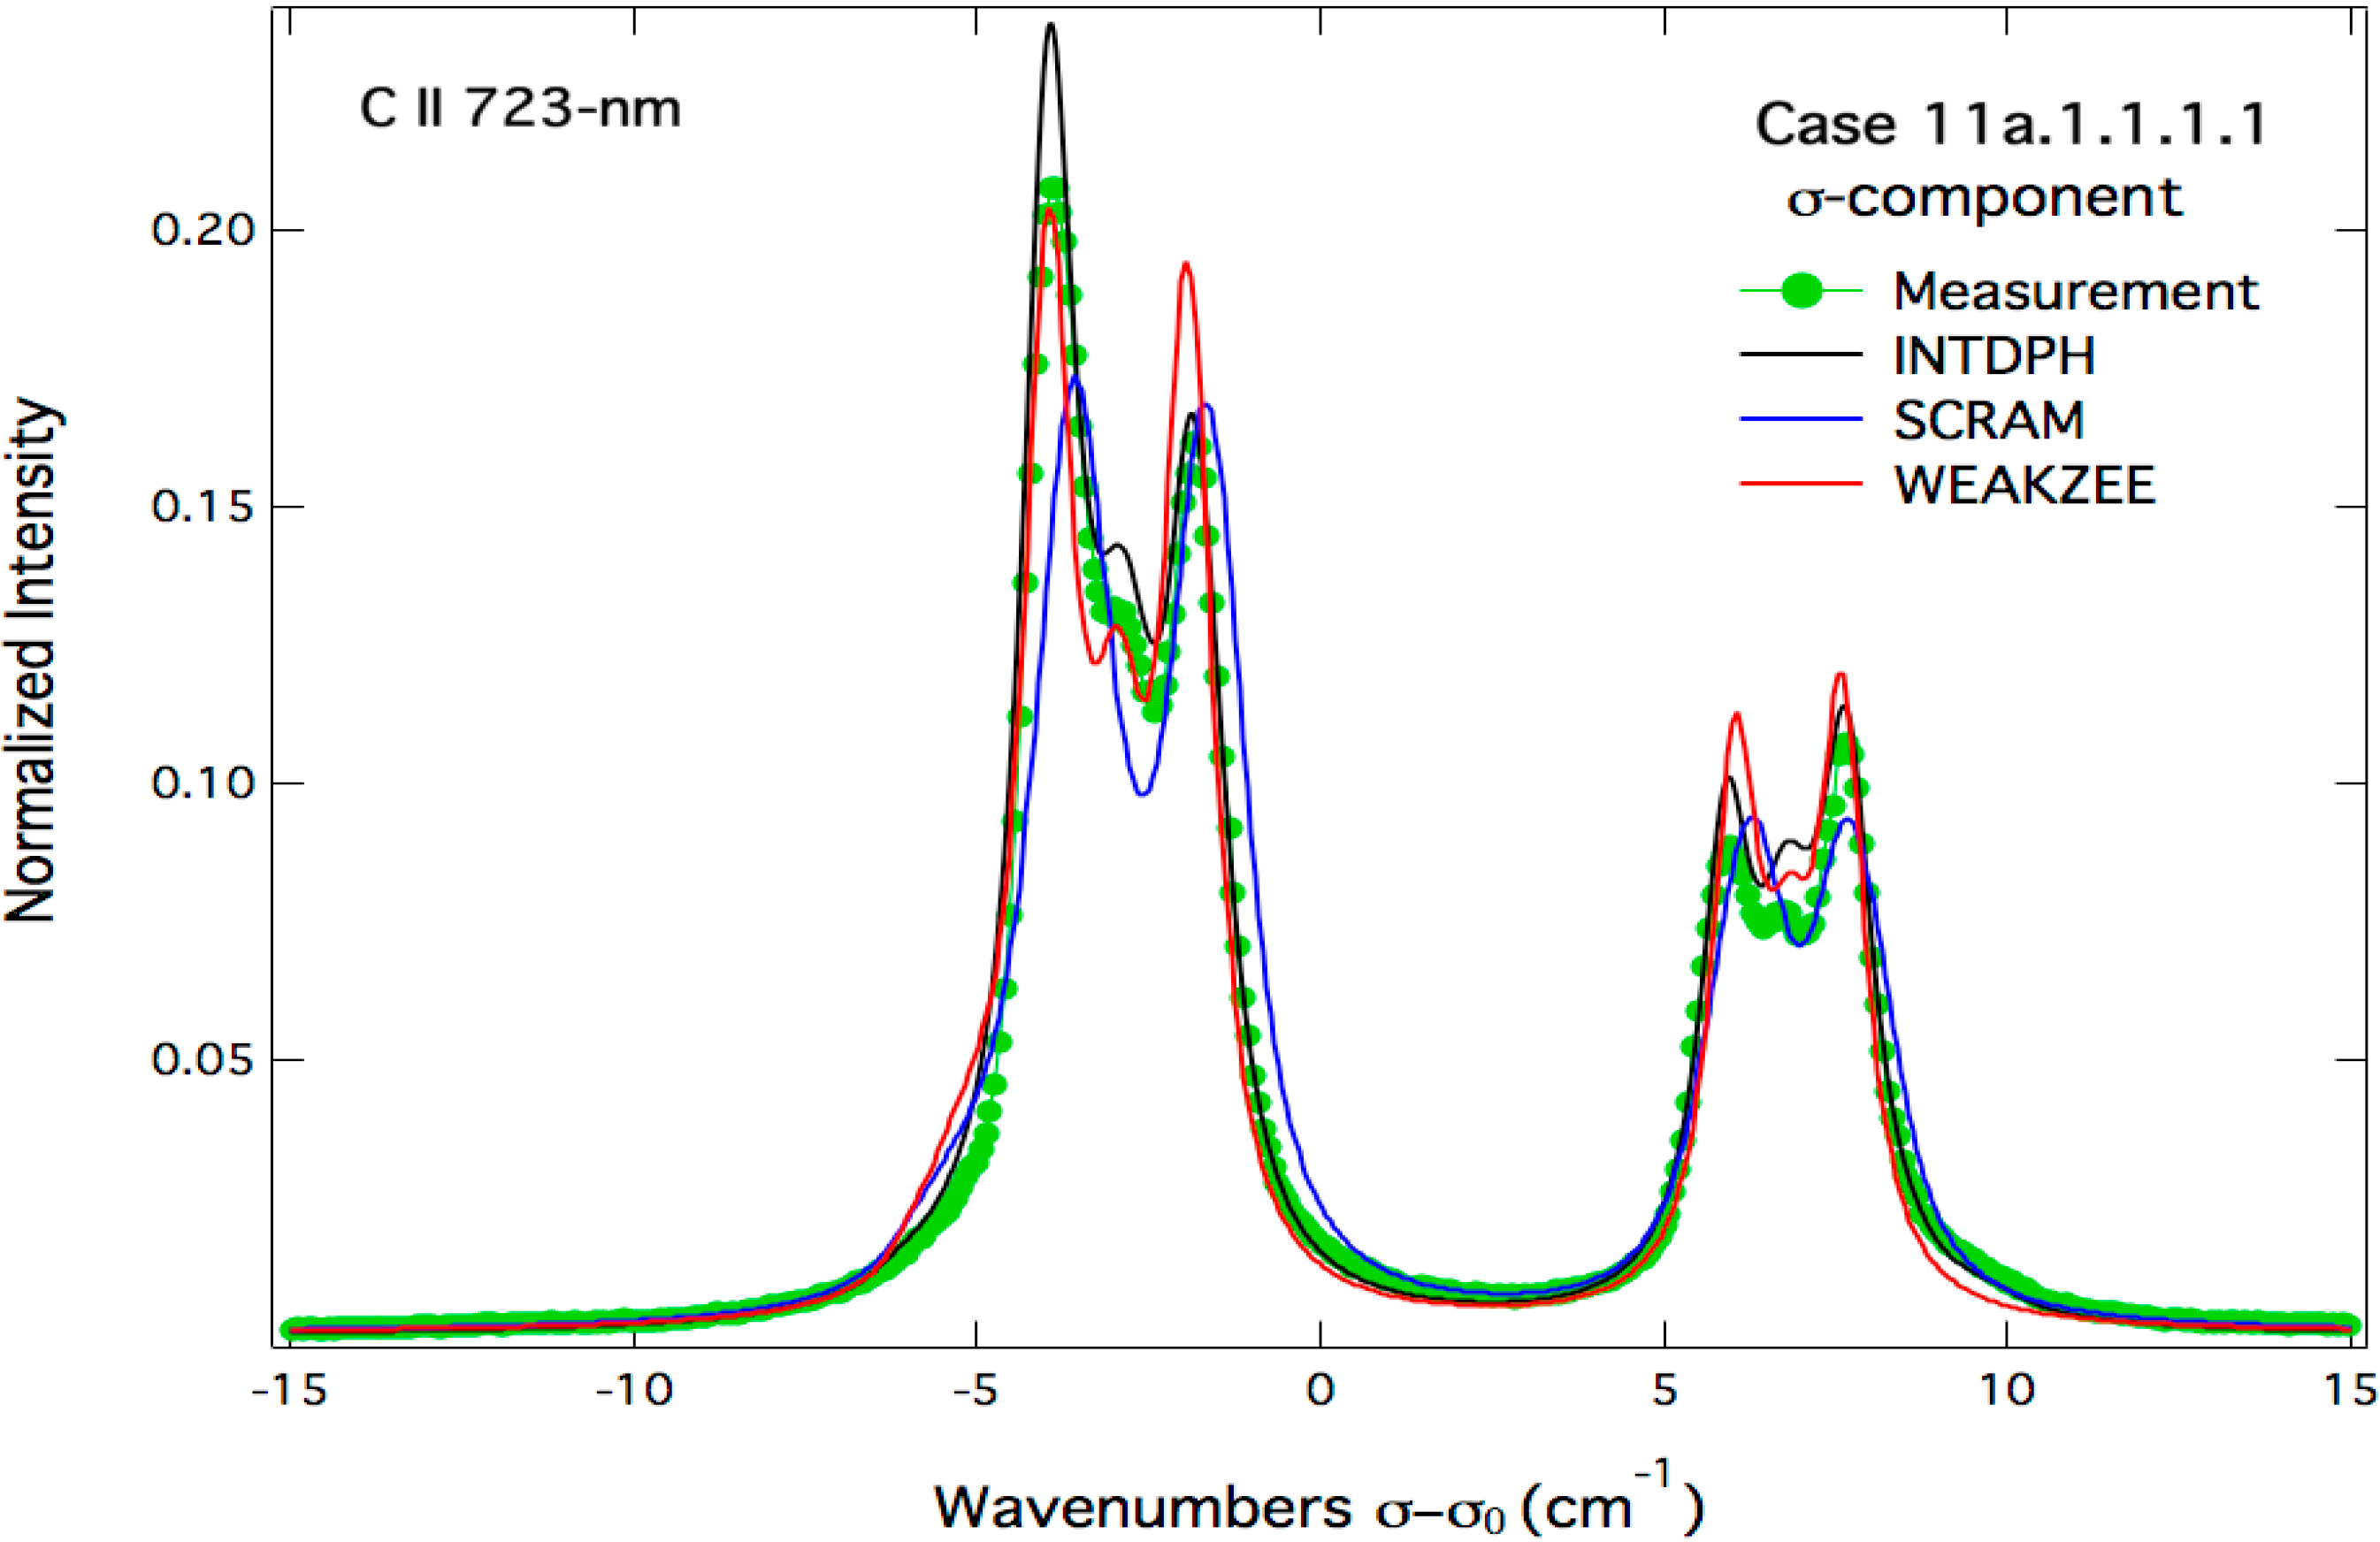
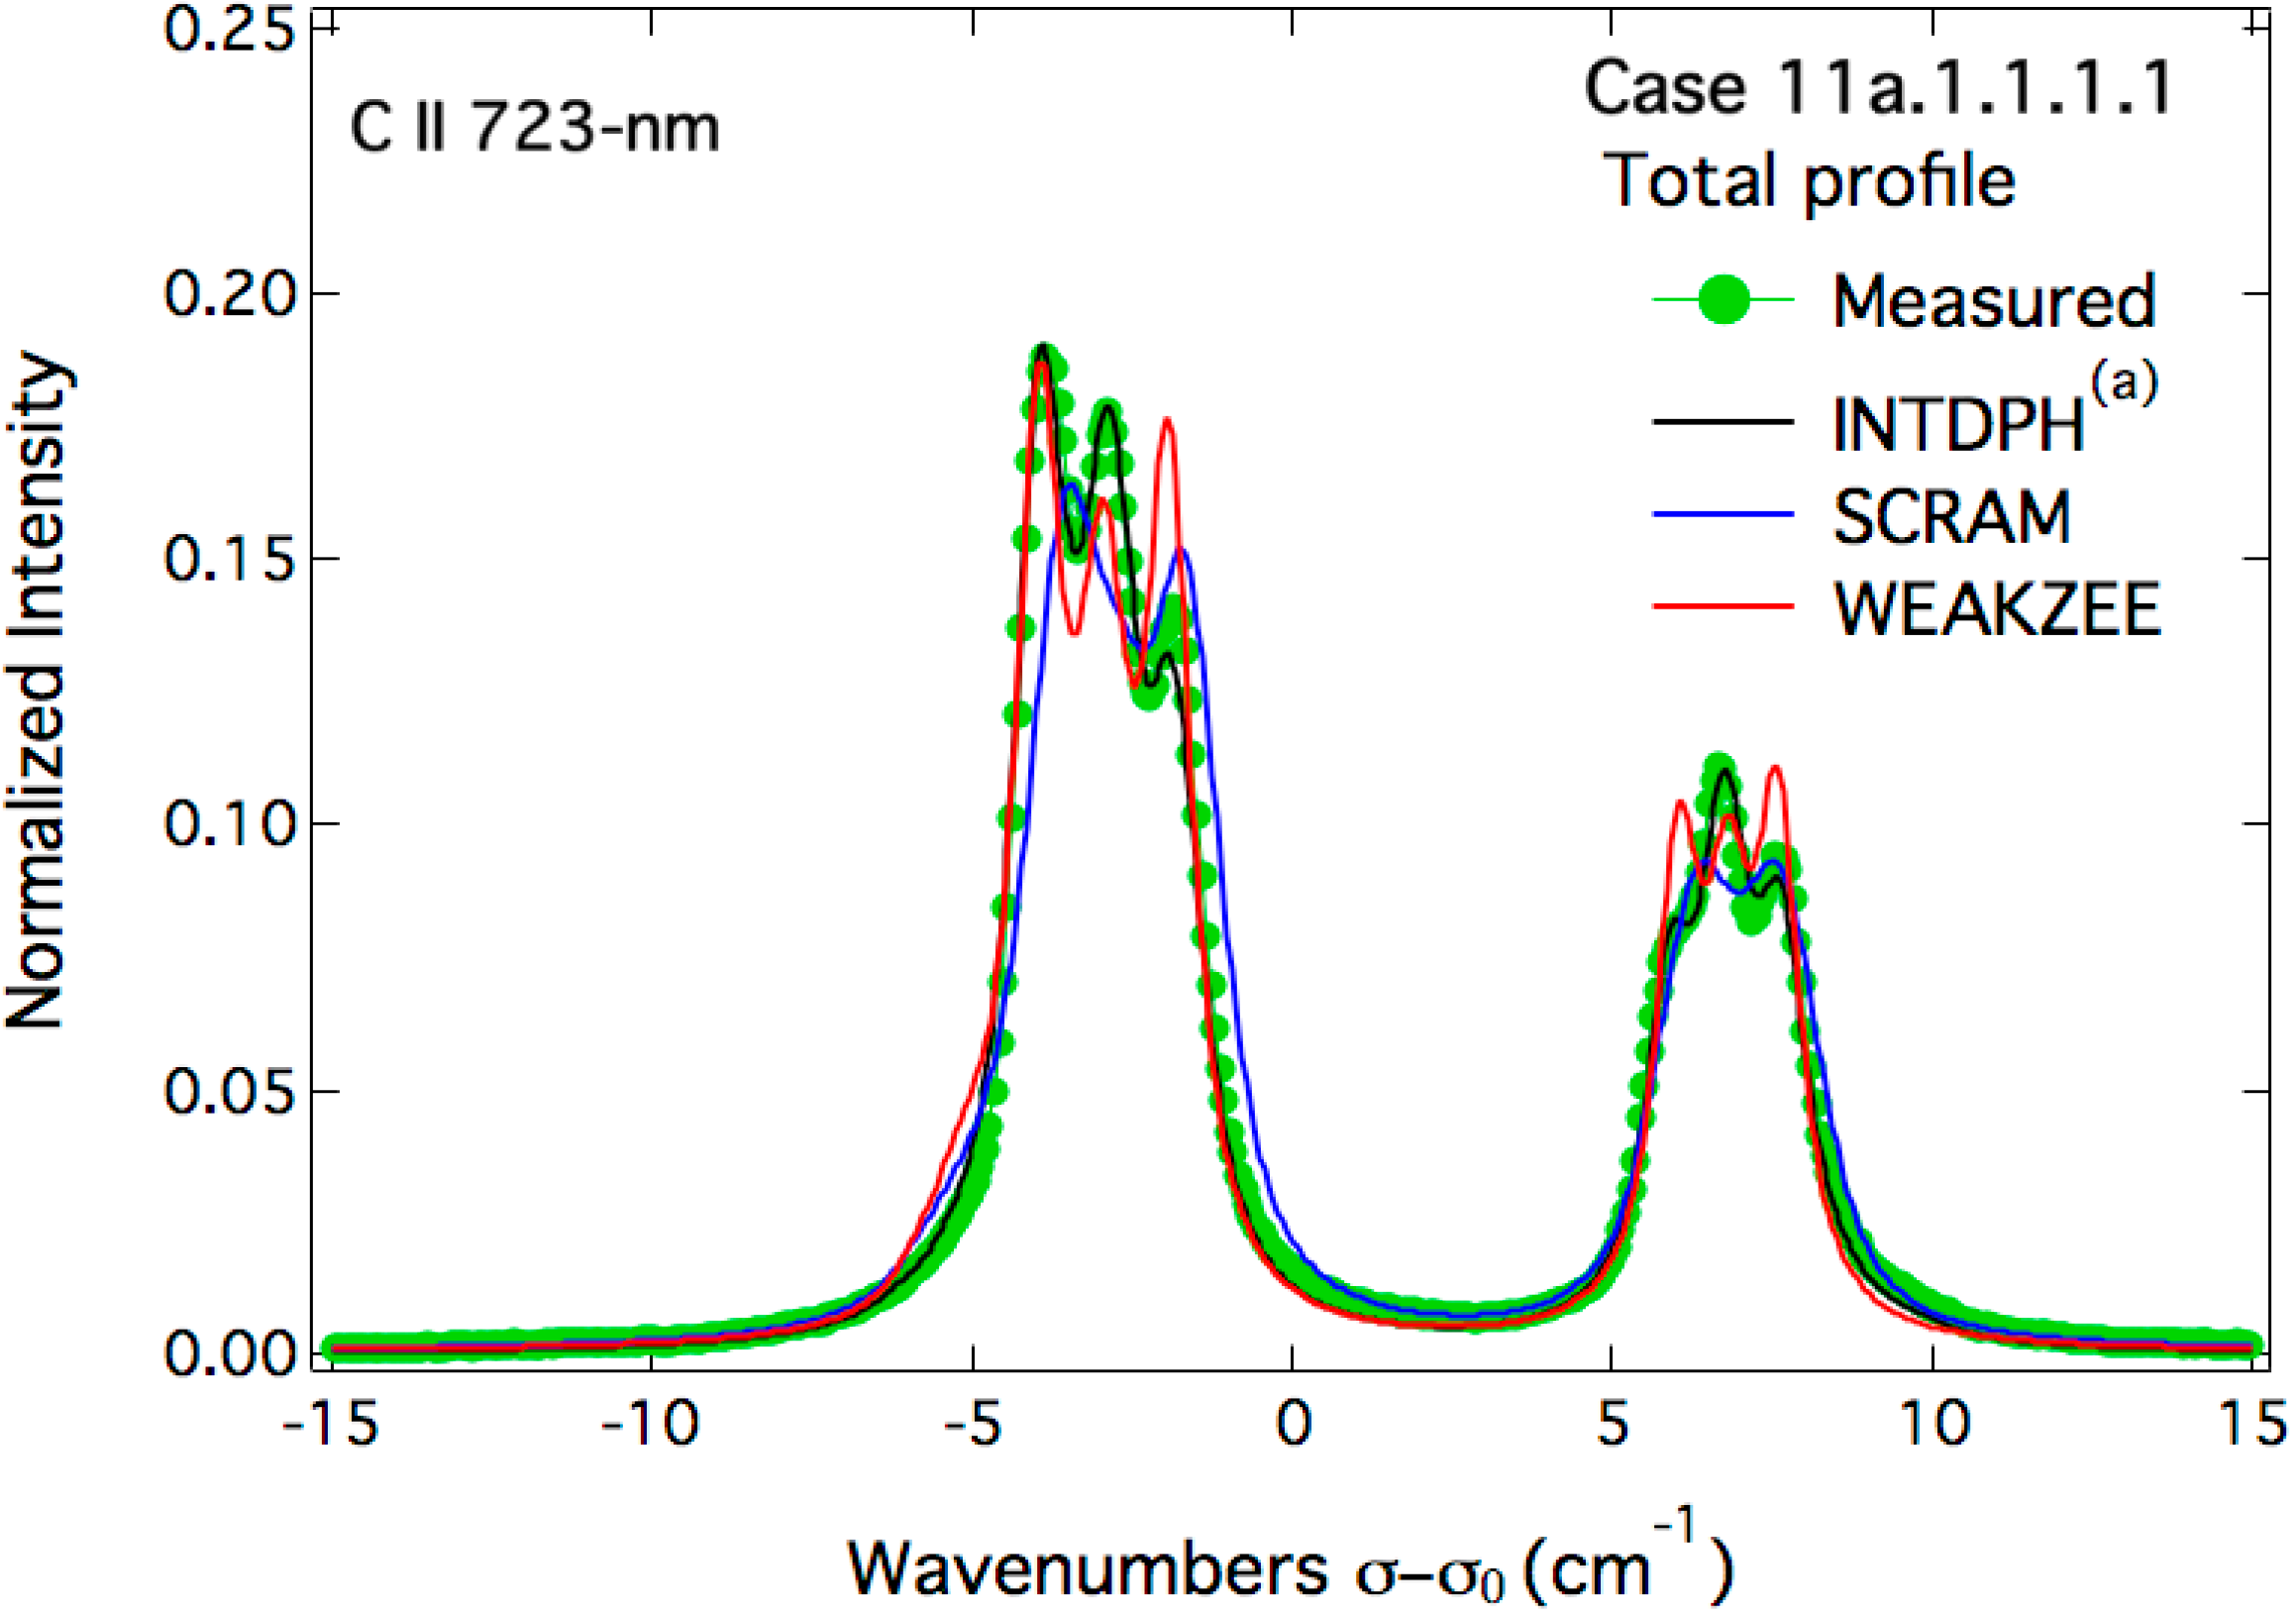
4. Comparison to the Experimental Spectra

As mentioned previously, the experimental data were obtained during the injection of a carbon pellet in the stellarator LHD. As all details concerning the experimental setup, the measurement system and pellet injection in LHD can be found in [2], we give here only the information necessary for the data analysis. The spectra were measured with a very high-resolution visible spectrometer. The instrumental function can be represented by a gaussian function with a FWHM ∆λ1/2 = 0.016 nm as compared to that of the high-resolution spectrometer used for the data of reference [2] (∆λ1/2 = 0.075 nm). The spectra were measured almost perpendicularly to the magnetic field. In addition, thanks to linear polarizers two spectra were obtained: horizontal spectrum (π-polarization) and vertical spectrum (σ-polarization). These spectra are shown in Figure 8. These two spectra were proposed as a challenging case at the 2nd workshop on spectral line shapes in plasmas. Contributors were asked to do their best to fit these spectra in order to find the most reliable set of parameters (magnetic field, angle of observation, electron density and temperature).
Attempts to fit these experimental spectra are shown in Figure 9, Figure 10 and Figure 11 corresponding, respectively, to the σ- and π-polarized spectra and the built un-polarized total spectrum.
Figure 8. Experimental spectra of the C ii 723-nm line as measured in LHD almost perpendicularly to the magnetic field (see Figure 1) using a very high-resolution visible spectrometer and linear polarizers.
Atoms 02 00319 g008
It can be seen from Figure 9, Figure 10 and Figure 11 that none of the line-shape codes were able to fit perfectly the proposed experimental spectra. However, these attempts were fruitful and can be considered reasonably good. Using the code INTDPH, the best fit of the three spectra was obtained with the following parameters: a carbon plasma with an electron density ne = 9 × 1016 cm−3, an equal ion and electron temperatures of 1 eV and a magnetic field B = 2.15 T. In the calculations by the INTDPH code, the static profiles were convolved with a shifted Lorentzian whose shift δσ and FWHM ∆σ were determined using the simulation method SIMU. For the above conditions, the following values were obtained: ∆σ = 0.9 cm−1 and δσ = 0.26 cm−1. Moreover, a contrast ratio of 4:1 was assumed for the polarizers. This is equivalent to assume that the line-of-sight is not strictly perpendicular to the magnetic field or alternatively to the existence of fluctuations of the field direction in the spectroscopic observation volume observed. It should be noted that a pure LS coupling was assumed and the 3p fine splitting was changed from the NIST value 11.15 to 11.24 cm−1 to better fit the data. The second fitting attempt was due to the SCRAM code. Using SCRAM without the ionic Stark broadening, the best-fit calculations were obtained for a magnetic field B = 2 T with the following carbon plasma parameters: an electron density ne = 6 × 1016 cm−3 and an ion/electron temperature T = 2 eV. The angle of observation 0 was set to 90°. The third and last fitting attempt was due to the WEAKZEE method considering only the Stark broadening by electrons. The best fit was obtained for an angle of observation 0 = 70° and the following plasma parameters: electron density ne = 4 × 1016 cm−3, electron/ion temperature T = 2 eV. The B-field value was set to 2 T. In addition, in an attempt to fit at least partially the π-component, a profile calculated with PPP-B (NIST data) was added to the other results shown on Figure 10. Without the use of any fitting procedure but varying only the electron density, the parameters leading to a good agreement with the right peak of the experimental spectrum (in terms of line-shapes and Stark widths) were the following: ne = 4 × 1016 cm−3, T = 2 eV, B = 2 T and 0 = 90°. It should be noted that all calculations were done assuming an optical thin plasma emission zone. The spread of the obtained results concerning the plasma electron density was expected since all the parameters, including the angle of observation, were free for the fitting. Introducing constraints on the angle of observation would result in more consistent results providing the same atomic physics is used. Each of the three methods used to fit the experimental spectra has its own advantages and drawbacks. As previously demonstrated, the electron broadening is correctly accounted for by the WEAKZEE and SCRAM codes while underestimated by the couple of codes SIMU/INTDPH. On the other side, Zeeman effect is correctly treated by SIMU/INTDPH while the weak-field approximation was used by both SCRAM and WEAKZEE methods. Therefore, it is clear that a correct plasma electron diagnostics based of the considered line spectra requires a full treatment of the Zeeman effect as well as the use of the appropriate electron line broadening and this should be integrated by these different line-shape codes.
Figure 9. Fitting attempts of the σ-polarized experimental spectrum of the C ii 723-nm line as measured in LHD. All spectra are normalized to unity.
Atoms 02 00319 g009
Figure 10. Fitting attempts of the π-polarized experimental spectrum of the C ii 723-nm line as measured in LHD. All spectra are normalized to unity.
Atoms 02 00319 g010
Figure 11. Fitting attempts of the un-polarized “experimental” spectrum of the C ii 723-nm line as constructed from σ- and π-polarized spectra of Figure 9 and Figure 10. Superscript (a) indicates that the area of the profile calculated with INTDPH is equal to 0.9 while all other spectra are normalized to unity.
Atoms 02 00319 g011

5. Conclusions

Several line-shapes codes were compared through the modeling of the C ii 723-nm line profile for four situations corresponding to a fixed electron density of 1017 cm−3, two temperatures (T = 2 and 4 eV) with and without the presence of a magnetic field B = 4 T. For these conditions, calculations have shown that the Stark broadening of the above line is mainly due to the plasma electrons. C ii 723-nm line profiles calculated by five line-shape codes have been compared. For the magnetic-field free case (B = 0 T), a relatively good overall agreement has been obtained, despite the significant differences in the code results in terms of Stark width (FWHM) of the C ii 723-nm line. Indeed, the overall agreement between the five line-shape codes is within a factor of 2. Two factors may contribute to this dispersion of the results: differences in the used atomic physics and/or in the electron collision operator. However, the former factor has been dismissed by partial comparisons between line-shape codes using the same more accurate atomic physics data, i.e., from the NIST ASD database. Therefore, the dispersion in Stark widths is attributed to differences in the electron collision operators used by the various line-shape codes. For the case with B = 4 T, the differences in the treatment of the Zeeman effect by the different codes make more difficult the interpretation of the results. However, it is clear that the weak-field approximation adopted by some of the codes is not valid for the upper level of the C ii 723-nm line, i.e., (3d 2D°). Therefore, codes able to deal with intermediate magnetic fields (comparable Zeeman and fine structure splittings of energy levels) are more suitable. In addition to code-code comparisons, σ- and π-polarized experimental spectra of the C ii 723-nm line, measured from the ablation cloud of a carbon pellet injected in LHD, were fitted using several line-shape codes. By letting free all the parameters (magnetic field B, electron density ne, electron/ion temperature T, angle of observation 0), attempts to fit the experimental spectra have shown a large dispersion in the inferred parameters in particular the electron density for which there is a factor of more than 2. However, even though not perfect, these fitting attempts are encouraging and suggest to use the best of each code for the purpose of diagnostics of magnetized plasmas. It is recommended for this case to use a full-treatment of the Zeeman effect and elucidate and reduce the dispersion in the Stark widths due to the electron broadening. This requires more investigations and detailed comparisons with a prescribed atomic system.

Author Contributions

This work is based on the following author contributions: spectral measurements, data—M. Goto; code calculations, comparison with experimental data—all other authors; writing of the manuscript—M. Koubiti with contribution of the other authors.

Conflicts of Interest

The authors declare no conflict of interest.

References

  1. Stambulchik, E. Review of the 1st Spectral line shapes in plasmas: Code comparison. High Energy Density Phys. 2013, 9, 528–534. [Google Scholar] [CrossRef]
  2. Goto, M.; Morita, S.; Koubiti, M. Spectroscopic study of a carbon pellet ablation cloud. J. Phys. B-At. Mol. Opt. Phys. 2010, 43, 144023. [Google Scholar] [CrossRef]
  3. Cvejić, M.; Gavrilović, M.R.; Jovićević, S.; Konjević, N. Stark broadening of Mg i and Mg ii spectral lines and Debye shielding effect in laser induced plasma. Spectrochim. Acta Part B: Atomic Spectrosc. 2013, 85, 20–33. [Google Scholar] [CrossRef]
  4. Condon, E.U.; Shortley, G.H. One-Electron Spectra. In The Theory of Atomic Spectra; Cambridge University Press: London, UK, 1964; pp. 149–157. [Google Scholar]
  5. Weissbluth, M. Static Fields in Atoms and Molecules; Student edition, Academic Press: New York, NY, USA, 1978; pp. 346–355. [Google Scholar]
  6. Ferri, S.; Calisti, A.; Mossé, C.; Mouret, L.; Talin, B.; Gigosos, M.A.; Gonzalès, M.A.; Lisitsa, V. Frequency-fluctuation model applied to Stark–Zeeman spectral line shapes in plasmas. Phys. Rev. E 2011, 84, 026407. [Google Scholar] [CrossRef]
  7. Talin, B.; Calisti, A.; Godbert, L.; Stamm, R.; Lee, R.W.; Klein, L. Frequency-fluctuation model for line-shape calculations in plasma spectroscopy. Phys. Rev. A 1995, 51, 1918. [Google Scholar] [CrossRef]
  8. Calisti, A.; Mossé, C.; Ferri, S.; Talin, B.; Rosmej, F.; Bureyeva, L.A.; Lisitsa, V.A. Dynamic Stark broadening as the Dicke narrowing effect. Phys. Rev. E 2010, 81, 016406. [Google Scholar]
  9. Sahal-Brechot, S.; Dimitrijević, M.S.; Moreau, N. Observatory of Paris, LERMA and Astronomical Observatory of Belgrade Stark-B Database. Available online: http://stark-b.obspm.fr (accessed on 16 April 2014).
  10. Mahmoudi, W.F.; ben Nessib, N.; Sahal-Bréchot, S. Semi-classical calculations of Stark broadeningimpact theory of singly-ionized carbon, nitrogen and oxygen spectral lines. Phys. Scr. 2004, 70, 142. [Google Scholar] [CrossRef]
  11. Sahal-Bréchot, S.; Dimitrijević, M.S.; ben Nessib, N. Comparisons and comments on electron and ion impact profiles of spectral lines. Balt. Astron. 2011, 20, 523–530. [Google Scholar]
  12. Hansen, S.B. Configuration interaction in statistically complete hybrid-structure atomic models. Can. J. Phys. 2011, 89, 633–638. [Google Scholar] [CrossRef]
  13. Hansen, S.B.; Bauche, J.; Bauche-Arnoult, C.; Gu, M.F. Hybrid atomic models for spectroscopic plasma diagnostics. High Energy Density Phys. 2007, 3, 109–114. [Google Scholar] [CrossRef]
  14. Stambulchik, E.; Maron, Y. A study of ion-dynamics and correlation effects for spectral line broadening in plasma: K-shell lines. J. Quant. Spectr. Rad. Transf. 2006, 99, 730–749. [Google Scholar] [CrossRef]
  15. Stambulchik, E.; Alexiou, S.; Griem, H.R.; Kepple, P.C. Stark broadening of high principal quantum number hydrogen Balmer lines in low-density laboratory plasmas. Phys. Rev. E 2007, 75, 016401. [Google Scholar]
  16. Stambulchik, E.; Maron, Y. Effect of high-n and continuum eigenstates on the Stark effect of resonance lines of atoms and ions. Phys. Rev. A 1997, 56, 2713–2719. [Google Scholar] [CrossRef]
  17. Tessarin, S.; Mikitchuk, D.; Doron, R.; Stambulchik, E.; Kroupp, E.; Maron, Y.; Hammer, D.A.; Jacobs, V.L.; Seely, J.F.; Oliver, B.V.; et al. Beyond Zeeman spectroscopy: Magnetic-field diagnostics with Stark-dominated line shapes. Phys. Plasmas 2011, 18, 093301. [Google Scholar] [CrossRef]
  18. Kramida, A.; Ralchenko, Y.; Reader, J.; NIST ASD Team (2013). NIST Atomic Spectra Database (ver. 5.1). Available online: http://physics.nist.gov/asd (accessed on 9 May 2014).
  19. Grant, I.P.; McKenzie, B.J.; Norrington, P.H.; Mayers, D.F.; Pyper, N.C. An atomic multiconfigurational Dirac-Fock package. Comput. Phys. Commun. 1980, 21, 207–231. [Google Scholar] [CrossRef]
  20. Gu, M.F. The Flexible Atomic Code. Can. J. Phys. 2008, 86, 675–689. [Google Scholar]
  21. Calisti, A.; Ferri, S.; Stamm, R.; Talin, B.; Lee, R.W.; Klein, L. Discussion of the validity of binary collision models for electron broadening in plasmas. J. Quant. Spectrosc. Radiat. Transf. 2000, 65, 109–116. [Google Scholar] [CrossRef]
  22. Alexiou, S. Collision operator for isolated ion lines in the standard Stark-broadening theory with applications to the Z scaling of the Li isoelectronic series 3P-3S transition. Phys. Rev. A 1994, 49, 106–119. [Google Scholar] [CrossRef]
  23. Griem, H.R.; Blaha, M.; Kepple, P.C. Stark-profile calculations for Lyman-series lines of one-electron ions in dense plasmas. Phys. Rev. A 1979, 19, 2421–2432. [Google Scholar] [CrossRef]
  24. Calisti, A.; Khelfaoui, F.; Stamm, R.; Talin, B.; Lee, R.W. Model for the line shapes of complex ions in hot and dense plasmas. Phys. Rev. A 1990, 42, 5433–5440. [Google Scholar] [CrossRef]
  25. Alexiou, S.; Dimitrijević, M.S.; Sahal-Brechot, S.; Stambulchik, E.; Duan, B.; Gonzalez-Herrero, D.; Gigosos, M.A. The Second Workshop on Lineshape Code Comparison: Isolated Lines. Atoms 2014, 2, 157–177. [Google Scholar] [CrossRef]

