

Signatures of Quantum Chaos of Rydberg-Dressed Bosons in a Triple-Well Potential

1
School of Physics and Astronomy, University of Nottingham, Nottingham NG7 2RD, UK
2
Department of Physics, Indian Institute of Science Education and Research, Dr. Homi Bhabha Road, Pune 411008, India
3
Centre for the Mathematics and Theoretical Physics of Quantum Non-Equilibrium Systems, University of Nottingham, Nottingham NG7 2RD, UK
*
Author to whom correspondence should be addressed.
Atoms 2023, 11(6), 89; https://doi.org/10.3390/atoms11060089
Submission received: 19 April 2023
/
Revised: 24 May 2023
/
Accepted: 26 May 2023
/
Published: 31 May 2023
(This article belongs to the Special Issue Cold and Rydberg Atoms for Quantum Technologies)
Abstract
:We studied signatures of quantum chaos in dynamics of Rydberg-dressed bosonic atoms held in a one-dimensional triple-well potential. Long-range nearest-neighbor and next-nearest-neighbor interactions, induced by laser dressing atoms to strongly interacting Rydberg states, drastically affect mean-field and quantum many-body dynamics. By analyzing the mean-field dynamics, classical chaos regions with positive and large Lyapunov exponents were identified as a function of the potential well tilting and dressed interactions. In the quantum regime, it was found that level statistics of the eigen-energies gain a Wigner–Dyson distribution when the Lyapunov exponents are large, giving rise to signatures of strong quantum chaos. We found that both the time-averaged entanglement entropy and survival probability of the initial state have distinctively large values in the quantum chaos regime. We further showed that population variances could be used as an indicator of the emergence of quantum chaos. This might provide a way to directly probe quantum chaotic dynamics through analyzing population dynamics in individual potential wells.
1. Introduction
Understanding dynamics of quantum many-body systems has been a lucrative field of study that allows for the exploration of new physics and finding quantum technological applications. Among many experimental platforms, ultracold atoms trapped in optical lattices, due to their high controllability, provide a versatile toolbox for studying quantum many-body phases [1]. One is typically keen to achieve long-range interactions, which allow us to create and probe exotic many-body dynamics. A paradigmatic example is the extended Bose–Hubbard model (EBHM), where rich phases (e.g., superfluid, supersolid and checkboard phases) are obtained [2,3,4,5,6]. Dipolar atoms provide relatively weak long-range interactions [7]. Recent experiments have shown that much stronger long-range interactions can be achieved in electronically high-lying Rydberg states [8]. Long coherence times are realized through Rydberg dressing, where ground-state atoms are weakly coupled to Rydberg states using far off-resonant lasers [9]. Such Rydberg dressing leads to a soft-core-shaped long-range interaction potential between ground-state atoms, where the radius of the soft-core potential is in the order of a few micrometers [9,10,11,12,13,14,15,16].
Existing studies have focused on static and dynamical properties of Rydberg-dressed atoms confined in traps [17,18,19,20,21,22,23] and optical lattices [24,25,26,27,28,29,30,31]. Interaction effects due to the Rydberg dressing have been experimentally demonstrated in optical tweezers [32], optical lattices [33,34,35] and harmonic traps [36]. In optical lattice potentials, such a large soft-core radius is typically much larger than the lattice spacing, as depicted in Figure 1a. The dynamics of Rydberg-dressed bosons are described by an EBHM [14]. In Refs. [31,37], we studied nonlinear and chaotic dynamics of Rydberg-dressed bosons in finite potential wells in the semiclassical regime. In the quantum regime, it is known that the BHM is non-integrable in general, where quantum chaos can be triggered by the competition between coherent hopping and on-site interactions [38,39,40,41,42]. In the presence of long-range interactions, it has been shown that quantum chaos emerges in EBHMs realized with dipolar bosons, which feature nearest-neighbor interactions [43,44]. The respective chaotic properties are characterized by quantities such as level statistics [44], Shannon entropy, and survival probabilities of the initial state [43].
In this work, we investigated signatures of the quantum chaos of Rydberg-dressed bosons in finite one-dimensional traps. Because of the large soft-core radius, our setup allowed us to focus on the dynamics in a region where both nearest-neighbor and next-nearest-neighbor interactions are equally strong. In the semiclassical regime, Lyapunov exponents of the mean-field equations were evaluated numerically. Positive and large-valued Lyapunov exponents were found, signifying the emergence of chaos. The dependence of the Lyapunov exponents on the dressed interaction and tilting of the potential was studied. By diagonalizing quantum many-body Hamiltonians with finite atom numbers, we show that nearest-neighbor level statistics gain a Wigner–Dyson distribution with parameters when the Lyapunov exponents are large. We further characterized signatures of quantum chaos through analyzing quantum many-body dynamics. It was found that the time-averaged entanglement entropy shows a similar dependence on the parameters to that of the level statistics and Lyapunov exponents. Features of quantum chaos can be captured by variances of the population in different potential wells, which might provide a way to directly probe the quantum chaos.
The structure of the paper is as follows. In Section 2, we introduce the system and model Hamiltonian. Section 3 is divided into three sub-sections. In Section 3.1, the level statistics of the system are studied. Parameters corresponding to Wigner–Dyson distribution are found. In Section 3.2, dynamics of the entanglement entropy are investigated. The time-averaged entanglement entropy gains larger values in the quantum chaos regime. In Section 3.3, we evaluate the survival probability of the initial state and particle numbers in different potential wells. Population variance in different regimes is examined. Conclusions are given in Section 4.
2. Model
We considered N bosonic atoms confined in a one-dimensional chain with L sites. As depicted in Figure 1a, the Rydberg-dressed soft-core potential induces interactions between atoms in different sites. The dynamics of this model are described by an extended Bose–Hubbard model [14] (ℏ = 1):
where and are bosonic annihilation and creation operators acting on site j, with the corresponding number operator . Here, denotes the pair of nearest-neighbour indices. Parameter describes a local tilt of the potential well, in which represents the level bias between neighboring sites. J denotes the hopping rate of atoms between neighboring sites. The s-wave interaction is characterized by , with and m being the s-wave scattering length and mass of the atom [45]. The long-range soft-core interaction induced by the Rydberg dressing is given by , where , d, and are an effective dispersion coefficient, lattice constant and soft-core radius, respectively.
Hilbert space of the EBHM is given by . When , it increases rapidly when N is large. For example, when . Resulting numerical calculations become difficult in unit-filling situations. In this work, we focused on large filling regime () in a minimal trapping setting, i.e., Rydberg-dressed bosons trapped in triple-well potential (). Here, the dimension of the Hilbert space was , which is quadratic with N. This allowed us to deal with large particle numbers . Due to the high filling , we could also directly compare the quantum many-body calculations with mean-field results.
With the above consideration, we obtained the Hamiltonian of the three-well system,
where we defined , and . We neglected constant terms that will not affect many-body dynamics. In following numerical analysis, we scaled the Hamiltonian with respect to J. For concreteness, we chose parameters such that the effective on-site interaction vanishes but nearest-neighbor (NN) interaction is strong, i.e., and [31]. The latter can be achieved by tuning the s-wave scattering length through Feshbach resonance [45]. This allows us to concentrate on effects due to the long-range interactions.
3. Results
Before discussing many-body calculations of the EBHM, we show the signature of chaos of this model in the semiclassical limit [31,37]. In the semiclassical (mean-field) calculation, one replaces the bosonic operators () with complex classical fields (). The mean-field calculation is relatively simple, as the number of complex fields is equal to the number of site L. More details of the semiclassical calculations can be found in Refs. [31,37]. A key figure of merit in the mean-field calculation is Lyapunov exponents. Positive and large Lyapunov exponents indicate the emergence of classical chaos. This means that perturbations to initial states will grow exponentially with time. Examples of Lyapunov exponents are shown in Figure 1b,c. In Figure 1b, Lyapunov exponent is close to zero when (fixing ), where dynamics are linear. Positive is found at around , and it reaches its maximum at around . Focusing on this strong interaction region (), we calculated Lyapunov exponents by varying the tilting . We found that increases with an increasing , and achieves its maximum at around .
We now turn to analyzing static and dynamics properties of the three-well system with finite N. By numerically diagonalizing Hamiltonian (2) eigenstates, and eigenvalue were obtained. Here, is the probability amplitude of Fock state in which denotes the number of particles at the i-th site. Statistical distributions of provide valuable information on whether the system is integrable or chaotic [46]. If the system is integrable, corresponding energy levels are not correlated, and are not prohibited from direct crossing when varying parameters [47,48,49], whereas, in the quantum chaotic region, energy levels are correlated and crossings are avoided [46,50]. In the weak interaction limit (i.e., Figure 2a), atom hopping dominates dynamics such that the system is integrable [51]. As we increase to 7.0, we can see that anti-crossings start to appear, which indicate the emergence of quantum chaos (Figure 2b). When fixing , we show eigen-energies in the interval in Figure 3a and in Figure 3b. The difference is that both direct and avoided crossings are found in Figure 3a, whereas only avoided crossings are encountered when is large, as shown in Figure 3b.
3.1. Level Statistics
To understand the different behaviors of the eigen-energies, we analyzed statistics of the nearest-neighbor spacing s between energy levels. The probability distribution of the spacing s can be used to distinguish integrable and chaotic dynamics [46]. For integrable systems, follows the Poissonian distribution,
For chaotic systems, their level spacing corresponds to the Gaussian orthogonal ensemble (GOE) [52]. Distribution changes to the Wigner–Dyson (WD) distribution [53],
In realistic situations, the level spacing will typically not follow the Poissonian or WD distribution exactly. can be fitted by the Brody distribution [54],
where is a chaos indicator and b depends on ,
where is the gamma function. Here, measures the repulsion of the levels, also known as the level repulsion exponent. For chaotic systems, , where the Brody distribution recovers the WD profile, whereas in integrable systems, where the Brody distribution becomes the Poissonian distribution.
After carrying out the standard unfolding procedure [46], the level statistics were calculated and fitted with Equation (5). Values of were extracted and are shown in Figure 2c and Figure 3c, respectively. Fixing , it was found that is small when . In this region, the level statistics follow the Poissonian distribution, as illustrated in Figure 2d. Then, keeps increasing with am increasing until , where the level statistics display the WD distribution i.e., Figure 2e. Hence, the system enters the quantum chaos regime. Further increasing U, decreases gradually, where the statistics follow the Poissonian distribution again, i.e., Figure 2f. The results show that our model is largely integrable in the weakly and strongly interacting regimes, which is similar to the Bose–Hubbard model [40]. The trend of shown in Figure 2c is consistent with the Lyapunov exponent shown in Figure 1b.
In Figure 3c, we plot as a function of . Similar to the Lyapunov exponents shown in Figure 1c, the maximal value of is found around , where dynamics are strongly quantum chaotic. Values of decrease quickly when or , where the triple-well system becomes integrable. Examples of corresponding level distributions are shown in Figure 3d–f. The levels approximately follow a Poissonian distribution when , i.e., Figure 3d, or , i.e., Figure 3f, whereas they follow a WD distribution when , i.e., Figure 3e.
3.2. Entanglement Entropy
In this section, we analyze the entanglement entropy of our model. The three wells were divided into subsystems of the left well (part A) and the other two wells (part B). Entanglement entropy with respect to subsystem A is given by [55]
where is the reduced density matrix by tracing out the subsystem B from the density matrix of the whole system. Entanglement entropy measures how much subsystem A and B are intertwined with each other. For the three-well bosonic system, it has a maximal value , which only depends on the total number of atoms of the whole system (see Appendix A for calculations).
To evaluate the entanglement entropy numerically, we started with an initial state . The time-dependent many-body state was expanded in the Fock basis,
in which we defined . Given the time-dependent many-body state in the Fock basis, the entanglement entropy can be evaluated.
In Figure 4a, the dynamical evolution of is shown for , and , with initial state and . The entropy initially increases monotonically for a short period of time and then fluctuates around a constant value with small amplitudes. Here, the saturation values of depend on . If one increases U, amplitudes of the fluctuation will be further reduced. To explore the dependence of the entropy on parameters, we numerically calculated time-averaged and normalized entanglement entropy, , where . The normalization could partially eliminate the dependence of on N. In the numerical calculation, we chose to avoid the influence due to the initial stage of the entropy. We set in calculations, as saturates when . It is important to note that long-time behaviors of are independent of the initial configurations, though details of the dynamics depend on the configuration. By focusing on initially, we can compare dynamics of various parameters. This is particularly useful when .
The results of as a function of U are shown in Figure 4b, where was fixed to be 2.5. It is small when . then increases with U and gains its peak value at . The peak value is close to the upper bound when N is large (e.g., ). Further increasing U, decreases gradually. This leads to a similar pattern to , i.e., Figure 2c. Importantly, we note that the maximal appears at the same as that of . Hence, both predict the position of quantum chaos as indicated by level statistics, i.e., Figure 2. We note that is shifted upwards (increased) globally when N is increased. Such a dependence is different from , where increasing N will suppress the fluctuation and lead to a better fitting.
In Figure 4c,d, we show the dependence of the entanglement entropy on while fixing . The entanglement entropy first increases rapidly with time and then saturates when , as depicted in Figure 4c. The saturation varies with . To explore this dependence, we evaluated the normalized average entropy , and show the results in Figure 4d. first increases with , reaches peak values around and then decreases with an increasing . Such a pattern is similar to the dependence of on , as seen in Figure 3c. Increasing atom number N, the profile of is largely unchanged, but is shifted globally upwards.
3.3. Survival Probability and Variance of Populations
The survival probability gives the probability of finding initial state at time t. In the long time limit, will stay in close proximity to that of GOE matrices if the dynamics are chaotic. The survival probability of GOEs saturates at [56] at the long time limit, which depends only on the dimension D of the Hilbert space. This provides a way to characterize chaotic quantum dynamics. Considering initial state (), the respective survival probability is
where denotes the probability amplitude of the initial state .
In Figure 5, we plot the moving average of the survival probability within temporal windows of constant size together with the saturation value of the survival probability of GOE matrices with . From Figure 5a, it can be seen that the long time limit of the survival probability at is in close proximity to the GOE. We can also see that the system significantly deviates from GOE when is away from . The evolution of the survival probability for different U is shown in Figure 5b. In the long time limit, the survival probability approaches that of the GOE when . This seemingly contradicts the prediction based on and entropy. However, we note that the system is already in the chaotic regime with the two parameters. It is not so surprising that the long-time survival probability is so close. On the other hand, the survival probabilities are generally close to each other in all the cases (note the logarithmic scale in Figure 5), where values of the survival probability are very small. These observation means that they are difficult to observe in cold atom experiments. In the following, we will show that variances of populations in different potential wells can be used to identify chaotic dynamics. We will show that the population variance exhibits different behaviors in the chaotic region by varying parameter U and . Changes in the variance are sizable, which might provide a plausible way to probe signatures of quantum chaos in the triple-well system.
We numerically evaluated population in the i-th site with initial state . The time-averaged variance of the populations in the three wells is defined as
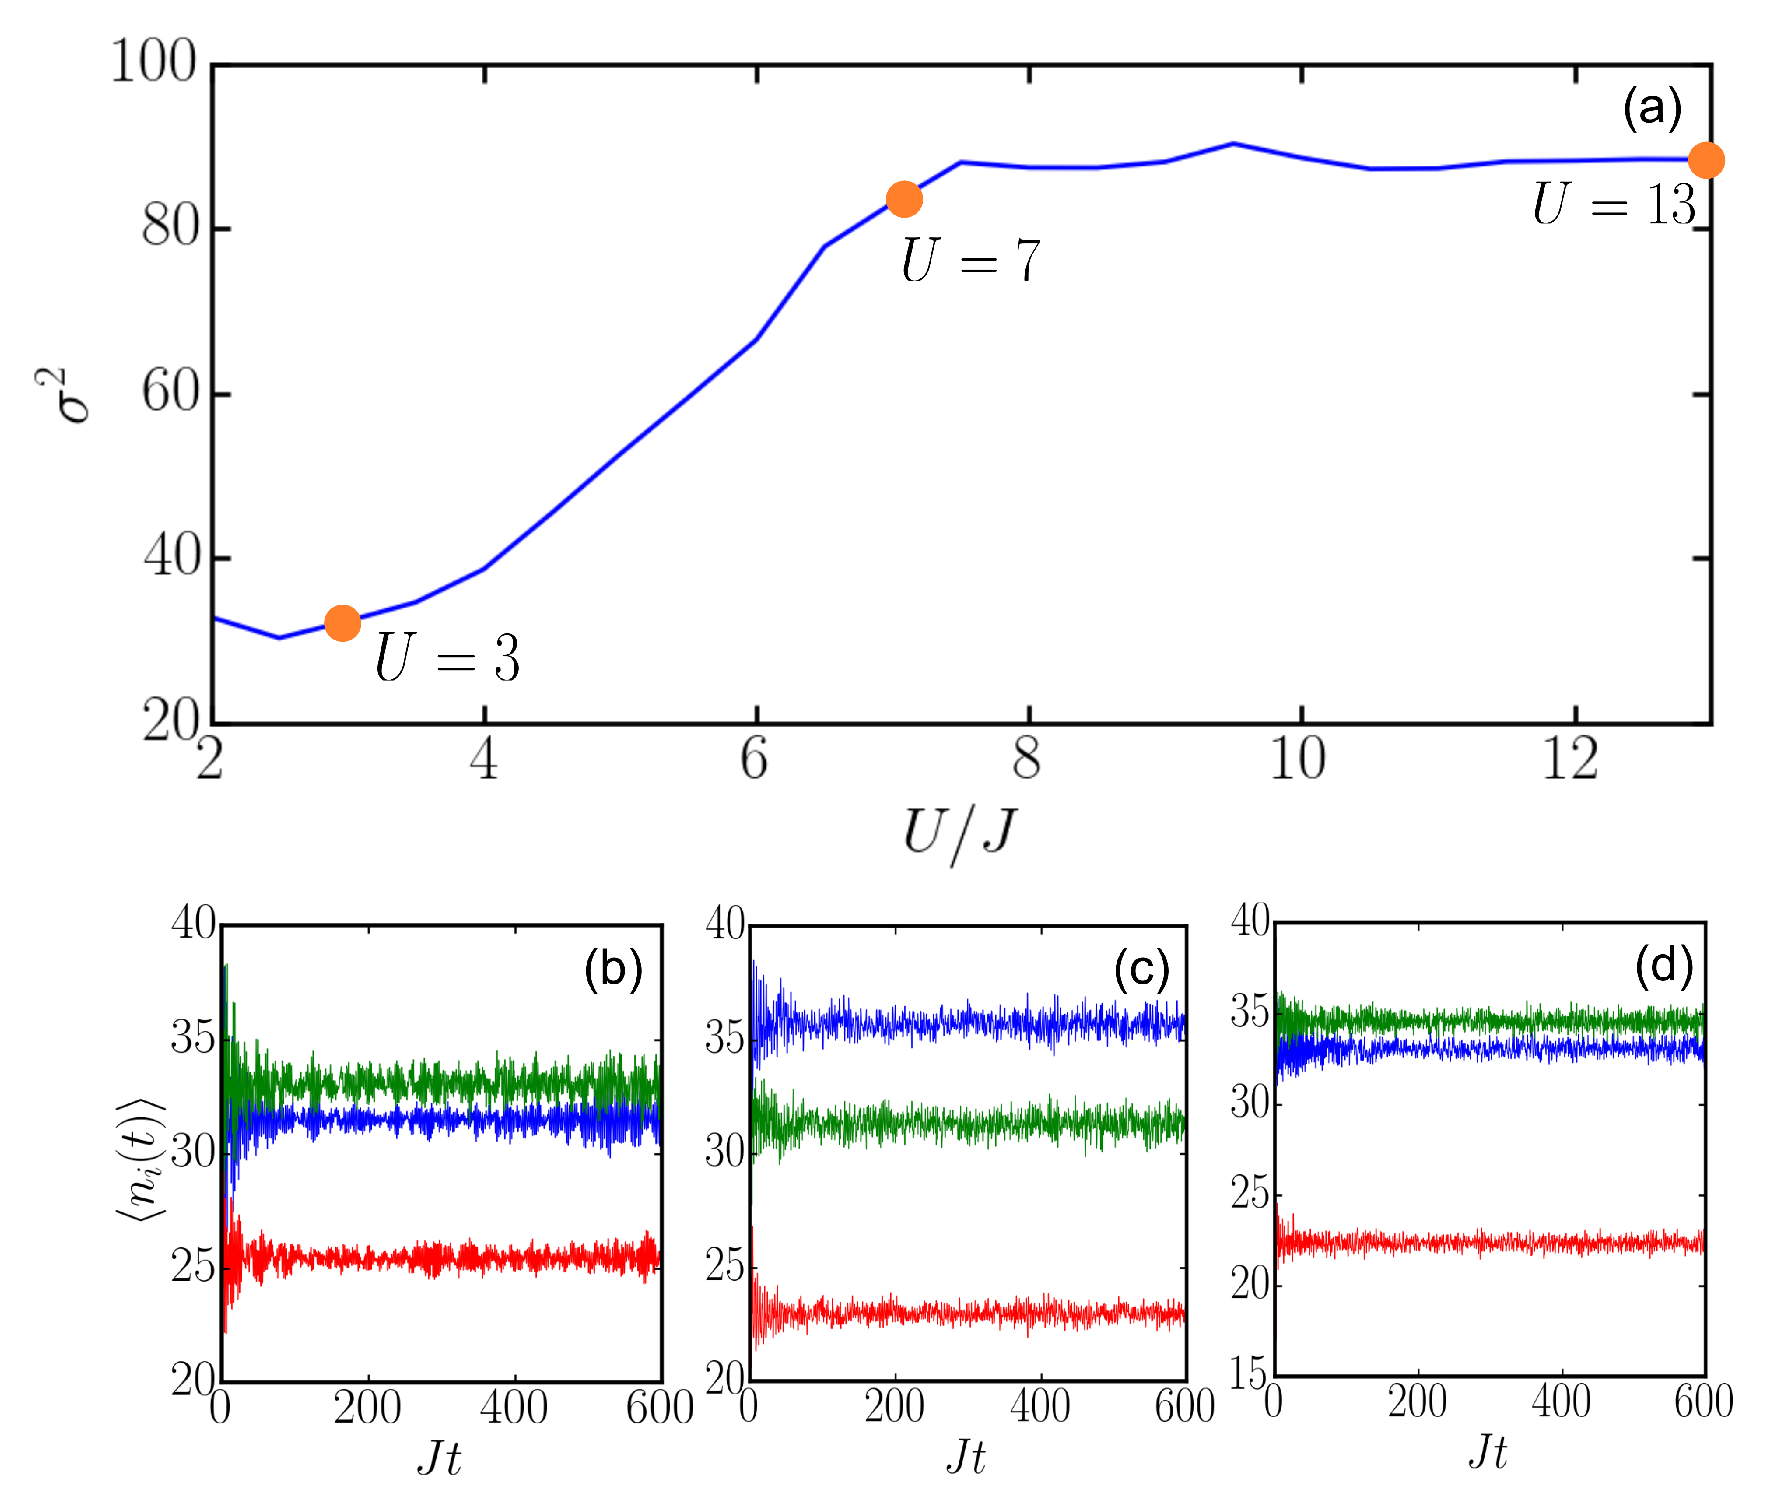
where . Figure 6 shows dependences of the variance on and with . Here, first increases, gains a peak value at around and then decreases with an increasing . This dependence is similar to that of the Lyapunov exponent, i.e., Figure 1c, chaos indicator, i.e., Figure 3c, and entanglement entropy, i.e., Figure 5d. Hence, the similar profiles indicate that one could measure the variance to identify chaotic dynamics. Furthermore, we show the variance as a function of in Figure 7. We find that the variance first increases with an increasing and then saturates at around 90. Hence, the variance becomes insensitive if we further increase U. This could be attributed to the fact that strong interactions suppress hopping and hence reduce the population variance. Though the profile is different from other chaos indicators in this case, we notice that the saturation starts from . This corresponds to the parameter where other chaos indicators arrive at their maximal values.
4. Discussion and Conclusions
In this work, we studied quantum dynamics of Rydberg-dressed bosons within a triple-well setup. In the semiclassical regime, we identified parameter regions where Lyapunov exponents are large. Through diagonalizing the Hamiltonian, we showed that the level statistics fulfil the Wigner–Dyson distribution in the parameter region where the Lyapunov exponents are maximal, which indicates the emergence of quantum chaos in this system. By analyzing the quantum many-body dynamics, we showed that time-averaged entanglement entropy has a similar dependence on U and . We showed that the survival probability exhibits a similar dependence on U and to that of the level statistics and Lyapunov exponents. Our numerical calculations show that the time-averaged variance of the population could be used to provide chaotic dynamics.
Author Contributions
Numerical calculation, T.Y. and M.C.; formal analysis, T.Y. and W.L.; writing—original draft preparation, T.Y. and M.C.; writing—review and editing, R.N. and W.L.; supervision, W.L. All authors have read and agreed to the published version of the manuscript.
Funding
This research is partially funded by the EPSRC through Grant Nos. EP/W015641/1 and EP/W524402/1.
Data Availability Statement
The data generated for this paper are available with doi: https://doi.org/10.5281/zenodo.7615623.
Acknowledgments
T.Y. would like to thank T. Hamlyn for useful discussions and critical reading of the draft. We thank Lea Santos for a critical comment on the saturation value in Figure 5.
Conflicts of Interest
The authors declare no conflict of interest.
Appendix A. Saturation Values of
In this appendix, we derive the maximal entanglement entropy following Ref. [57]. Given a bosonic system bipartited into two subsystems A and B, the full Hilbert space can be written in the form
in which and are numbers of particles in subsystem A and B.
A quantum state can be expanded using the Fock basis,
in which and denote the dimensions of and , respectively, and and form the computational basis of and , respectively.
For the sake of simplicity, we can project into a certain sector of forming so that we do not need to consider the first summation in Equation (A2) and we have in the form
By applying the singular value decomposition (SVD) onto the matrix , we can rewrite such a matrix into the form
in which U is a semi-unitary matrix, is a diagonal matrix with non-negative real numbers and V is a semi-unitary matrix. After applying Schmidt decomposition, Equation (A4) can be rewritten as
in which , are elements of , and and are the first columns of matrices U and V, respectively.
The entanglement entropy with respect to -sector can therefore be easily calculated:
The total entanglement entropy can be computed by summing over all possible sectors:
For a bosonic system with L sites in total and sites in subsystem A, Equation (A8) can be rewritten:
In our triple-well setup, subsystem A only contains the first site. Therefore the upper bound of entanglement entropy only depends on the total number of particles:
References
- Bloch, I.; Dalibard, J.; Zwerger, W. Many-body physics with ultracold gases. Rev. Mod. Phys. 2008, 80, 885. [Google Scholar] [CrossRef]
- Góral, K.; Santos, L.; Lewenstein, M. Quantum Phases of Dipolar Bosons in Optical Lattices. Phys. Rev. Lett. 2002, 88, 170406. [Google Scholar] [CrossRef]
- Trefzger, C.; Menotti, C.; Capogrosso-Sansone, B.; Lewenstein, M. Ultracold dipolar gases in optical lattices. J. Phys. B At. Mol. Opt. Phys. 2011, 44, 193001. [Google Scholar] [CrossRef]
- Rossini, D.; Fazio, R. Phase diagram of the extended Bose–Hubbard model. New J. Phys. 2012, 14, 065012. [Google Scholar] [CrossRef]
- Ejima, S.; Lange, F.; Fehske, H. Spectral and entanglement properties of the bosonic Haldane insulator. Phys. Rev. Lett. 2014, 113, 020401. [Google Scholar] [CrossRef]
- Xiong, B.; Fischer, U.R. Interaction-induced coherence among polar bosons stored in triple-well potentials. Phys. Rev. A 2013, 88, 063608. [Google Scholar] [CrossRef]
- Chomaz, L.; Ferrier-Barbut, I.; Ferlaino, F.; Laburthe-Tolra, B.; Lev, B.L.; Pfau, T. Dipolar Physics: A Review of Experiments with Magnetic Quantum Gases. Rep. Prog. Phys. 2022, 86, 026401. [Google Scholar] [CrossRef]
- Saffman, M.; Walker, T.G.; Mølmer, K. Quantum Information with Rydberg Atoms. Rev. Mod. Phys. 2010, 82, 2313. [Google Scholar] [CrossRef]
- Bouchoule, I.; Molmer, K. Spin squeezing of atoms by the dipole interaction in virtually excited Rydberg states. Phys. Rev. A 2002, 65, 041803. [Google Scholar] [CrossRef]
- Henkel, N.; Nath, R.; Pohl, T. Three-Dimensional Roton Excitations and Supersolid Formation in Rydberg-Excited Bose-Einstein Condensates. Phys. Rev. Lett. 2010, 104, 195302. [Google Scholar] [CrossRef]
- Honer, J.; Weimer, H.; Pfau, T.; Büchler, H.P. Collective many-body interaction in rydberg dressed atoms. Phys. Rev. Lett. 2010, 105, 160404. [Google Scholar] [CrossRef] [PubMed]
- Pupillo, G.; Micheli, A.; Boninsegni, M.; Lesanovsky, I.; Zoller, P. Strongly correlated gases of rydberg-dressed atoms: Quantum and classical dynamics. Phys. Rev. Lett. 2010, 104, 223002. [Google Scholar] [CrossRef] [PubMed]
- Johnson, J.E.; Rolston, S.L. Interactions between Rydberg-dressed atoms. Phys. Rev. A 2010, 82, 033412. [Google Scholar] [CrossRef]
- Li, W.; Hamadeh, L.; Lesanovsky, I. Probing the interaction between Rydberg-dressed atoms through interference. Phys. Rev. A 2012, 85, 053615. [Google Scholar] [CrossRef]
- Xiong, B.; Jen, H.H.; Wang, D.W. Topological superfluid by blockade effects in a Rydberg-dressed Fermi gas. Phys. Rev. A 2014, 90, 013631. [Google Scholar] [CrossRef]
- Hsueh, C.H.; Wang, C.W.; Wu, W.C. Vortex structures in a rotating Rydberg-dressed Bose-Einstein condensate with the Lee-Huang-Yang correction. Phys. Rev. A 2020, 102, 063307. [Google Scholar] [CrossRef]
- Maucher, F.; Henkel, N.; Saffman, M.; Królikowski, W.; Skupin, S.; Pohl, T. Rydberg-induced solitons: Three-dimensional self-trapping of matter waves. Phys. Rev. Lett. 2011, 106, 170401. [Google Scholar] [CrossRef]
- Cinti, F.; MacRì, T.; Lechner, W.; Pupillo, G.; Pohl, T. Defect-induced supersolidity with soft-core bosons. Nat. Commun. 2014, 5, 4235. [Google Scholar] [CrossRef]
- Mukherjee, R.; Ates, C.; Li, W.; Wüster, S. Phase-Imprinting of Bose-Einstein Condensates with Rydberg Impurities. Phys. Rev. Lett. 2015, 115, 040401. [Google Scholar] [CrossRef]
- Hsueh, C.H.; Tsai, Y.C.; Wu, W.C. Excitations of one-dimensional supersolids with optical lattices. Phys. Rev. A 2016, 93, 063605. [Google Scholar] [CrossRef]
- McCormack, G.; Nath, R.; Li, W. Dynamical excitation of maxon and roton modes in a Rydberg-Dressed Bose-Einstein Condensate. Phys. Rev. A 2020, 102, 023319. [Google Scholar] [CrossRef]
- Li, Y.; Cai, H.; Wang, D.w.; Li, L.; Yuan, J.; Li, W. Many-Body Chiral Edge Currents and Sliding Phases of Atomic Spin Waves in Momentum-Space Lattice. Phys. Rev. Lett. 2020, 124, 140401. [Google Scholar] [CrossRef]
- Zhou, Y.; Nath, R.; Wu, H.; Lesanovsky, I.; Li, W. Multipolar Fermi-surface Deformation in a Rydberg-dressed Fermi Gas with Long-Range Anisotropic Interactions. Phys. Rev. A 2021, 104, L061302. [Google Scholar] [CrossRef]
- Lauer, A.; Muth, D.; Fleischhauer, M. Transport-induced melting of crystals of Rydberg dressed atoms in a one-dimensional lattice. New J. Phys. 2012, 14, 095009. [Google Scholar] [CrossRef]
- Lan, Z.; Minar, J.; Levi, E.; Li, W.; Lesanovsky, I. Emergent Devil’s Staircase without Particle-Hole Symmetry in Rydberg Quantum Gases with Competing Attractive and Repulsive Interactions. Phys. Rev. Lett. 2015, 115, 203001. [Google Scholar] [CrossRef] [PubMed]
- Angelone, A.; Mezzacapo, F.; Pupillo, G. Superglass Phase of Interaction-Blockaded Gases on a Triangular Lattice. Phys. Rev. Lett. 2016, 116, 135303. [Google Scholar] [CrossRef]
- Chougale, Y.; Nath, R. Ab initio calculation of Hubbard parameters for Rydberg-dressed atoms in a one-dimensional optical lattice. J. Phys. B At. Mol. Opt. Phys. 2016, 49, 144005. [Google Scholar] [CrossRef]
- Li, Y.; Geißler, A.; Hofstetter, W.; Li, W. Supersolidity of lattice bosons immersed in strongly correlated Rydberg dressed atoms. Phys. Rev. A 2018, 97, 023619. [Google Scholar] [CrossRef]
- Zhou, Y.; Li, Y.; Nath, R.; Li, W. Quench dynamics of Rydberg-dressed bosons on two-dimensional square lattices. Phys. Rev. A 2020, 101, 013427. [Google Scholar] [CrossRef]
- Barbier, M.; Geißler, A.; Hofstetter, W. Decay-dephasing-induced steady states in bosonic Rydberg-excited quantum gases in an optical lattice. Phys. Rev. A 2019, 99, 033602. [Google Scholar] [CrossRef]
- McCormack, G.; Nath, R.; Li, W. Nonlinear dynamics of Rydberg-dressed Bose-Einstein condensates in a triple-well potential. Phys. Rev. A 2020, 102, 063329. [Google Scholar] [CrossRef]
- Jau, Y.Y.; Hankin, A.M.; Keating, T.; Deutsch, I.H.; Biedermann, G.W. Entangling atomic spins with a Rydberg-dressed spin-flip blockade. Nat. Phys. 2016, 12, 3487. [Google Scholar] [CrossRef]
- Zeiher, J.; Van Bijnen, R.; Schauß, P.; Hild, S.; Choi, J.Y.; Pohl, T.; Bloch, I.; Gross, C. Many-body interferometry of a Rydberg-dressed spin lattice. Nat. Phys. 2016, 12, 3835. [Google Scholar] [CrossRef]
- Zeiher, J.; Choi, J.Y.; Rubio-Abadal, A.; Pohl, T.; Van Bijnen, R.; Bloch, I.; Gross, C. Coherent many-body spin dynamics in a long-range interacting Ising chain. Phys. Rev. X 2017, 7, 041063. [Google Scholar] [CrossRef]
- Guardado-Sanchez, E.; Spar, B.M.; Schauss, P.; Belyansky, R.; Young, J.T.; Bienias, P.; Gorshkov, A.V.; Iadecola, T.; Bakr, W.S. Quench Dynamics of a Fermi Gas with Strong Nonlocal Interactions. Phys. Rev. X 2021, 11, 021036. [Google Scholar] [CrossRef]
- Borish, V.; Marković, O.; Hines, J.A.; Rajagopal, S.V.; Schleier-Smith, M. Transverse-Field Ising Dynamics in a Rydberg-Dressed Atomic Gas. Phys. Rev. Lett. 2020, 124, 063601. [Google Scholar] [CrossRef]
- McCormack, G.; Nath, R.; Li, W. Hyperchaos in a Bose-Hubbard chain with Rydberg-Dressed interactions. Photonics 2021, 8, 554. [Google Scholar] [CrossRef]
- de la Cruz, J.; Lerma-Hernández, S.; Hirsch, J.G. Quantum chaos in a system with high degree of symmetries. Phys. Rev. E 2020, 102, 032208. [Google Scholar] [CrossRef]
- Choy, T.; Haldane, F. Failure of Bethe-Ansatz solutions of generalisations of the Hubbard chain to arbitrary permutation symmetry. Phys. Lett. A 1982, 90, 83–84. [Google Scholar] [CrossRef]
- Kolovsky, A.R.; Buchleitner, A. Quantum chaos in the Bose-Hubbard model. Europhys. Lett. (EPL) 2004, 68, 632–638. [Google Scholar] [CrossRef]
- Oelkers, N.; Links, J. Ground-state properties of the attractive one-dimensional Bose-Hubbard model. Phys. Rev. B 2007, 75, 115119. [Google Scholar] [CrossRef]
- Nakerst, G.; Haque, M. Eigenstate thermalization scaling in approaching the classical limit. Phys. Rev. E 2021, 103, 042109. [Google Scholar] [CrossRef] [PubMed]
- Wittmann W., K.; Castro, E.R.; Foerster, A.; Santos, L.F. Interacting bosons in a triple well: Preface of many-body quantum chaos. Phys. Rev. E 2022, 105, 034204. [Google Scholar] [CrossRef]
- Kollath, C.; Roux, G.; Biroli, G.; Läuchli, A.M. Statistical properties of the spectrum of the extended Bose–Hubbard model. J. Stat. Mech. Theory Exp. 2010, 2010, P08011. [Google Scholar] [CrossRef]
- Pethick, C.J.; Smith, H. Microscopic theory of the Bose gas. In Bose–Einstein Condensation in Dilute Gases; Cambridge University Press: Cambridge, UK, 2008. [Google Scholar] [CrossRef]
- Haake, F. Quantum signatures of chaos. In Quantum Coherence in Mesoscopic Systems; Springer: Cham, Switzerland, 1991; pp. 583–595. [Google Scholar]
- Berry, M.V.; Tabor, M. Level clustering in the regular spectrum. Proc. R. Soc. Lond. A Math. Phys. Sci. 1977, 356, 375–394. [Google Scholar]
- Chirikov, B.V.; Shepelyansky, D.L. Shnirelman Peak in Level Spacing Statistics. Phys. Rev. Lett. 1995, 74, 518–521. [Google Scholar] [CrossRef] [PubMed]
- Pandey, A.; Ramaswamy, R. Level spacings for harmonic-oscillator systems. Phys. Rev. A 1991, 43, 4237–4243. [Google Scholar] [CrossRef]
- Guhr, T.; Müller-Groeling, A.; Weidenmüller, H.A. Random-matrix theories in quantum physics: Common concepts. Phys. Rep. 1998, 299, 189–425. [Google Scholar] [CrossRef]
- Castro, E.R.; Chávez-Carlos, J.; Roditi, I.; Santos, L.F.; Hirsch, J.G. Quantum-Classical Correspondence of a System of Interacting Bosons in a Triple-Well Potential. Quantum 2021, 5, 563. [Google Scholar] [CrossRef]
- Bohigas, O.; Giannoni, M.J.; Schmit, C. Characterization of Chaotic Quantum Spectra and Universality of Level Fluctuation Laws. Phys. Rev. Lett. 1984, 52, 1–4. [Google Scholar] [CrossRef]
- Wigner, E.P. Characteristic Vectors of Bordered Matrices With Infinite Dimensions. Ann. Math. 1955, 62, 548–564. [Google Scholar] [CrossRef]
- Brody, T.A.; Flores, J.; French, J.B.; Mello, P.A.; Pandey, A.; Wong, S.S.M. Random-matrix physics: Spectrum and strength fluctuations. Rev. Mod. Phys. 1981, 53, 385–479. [Google Scholar] [CrossRef]
- von Neumann, J. Mathematische Grundlagen der Quantenmechanik; Springer: Berlin/Heidelberg, Germany, 1996. [Google Scholar] [CrossRef]
- Schiulaz, M.; Torres-Herrera, E.J.; Santos, L.F. Thouless and relaxation time scales in many-body quantum systems. Phys. Rev. B 2019, 99, 174313. [Google Scholar] [CrossRef]
- Faiez, D.; Šafránek, D. How much entanglement can be created in a closed system. Phys. Rev. B 2020, 101, 060401. [Google Scholar] [CrossRef]
Figure 1.
(a) Three-well trapping potential and soft-core-shaped interaction between Rydberg-dressed atoms. The soft-core radius is larger than the distance between neighboring sites. By tuning , both the nearest-neighbor and next-nearest-neighbor interaction can be made to be strong. (b,c) Lyapunov exponents in the semiclassical regime. Parameters are and in (b) and (c), respectively. See text for details.
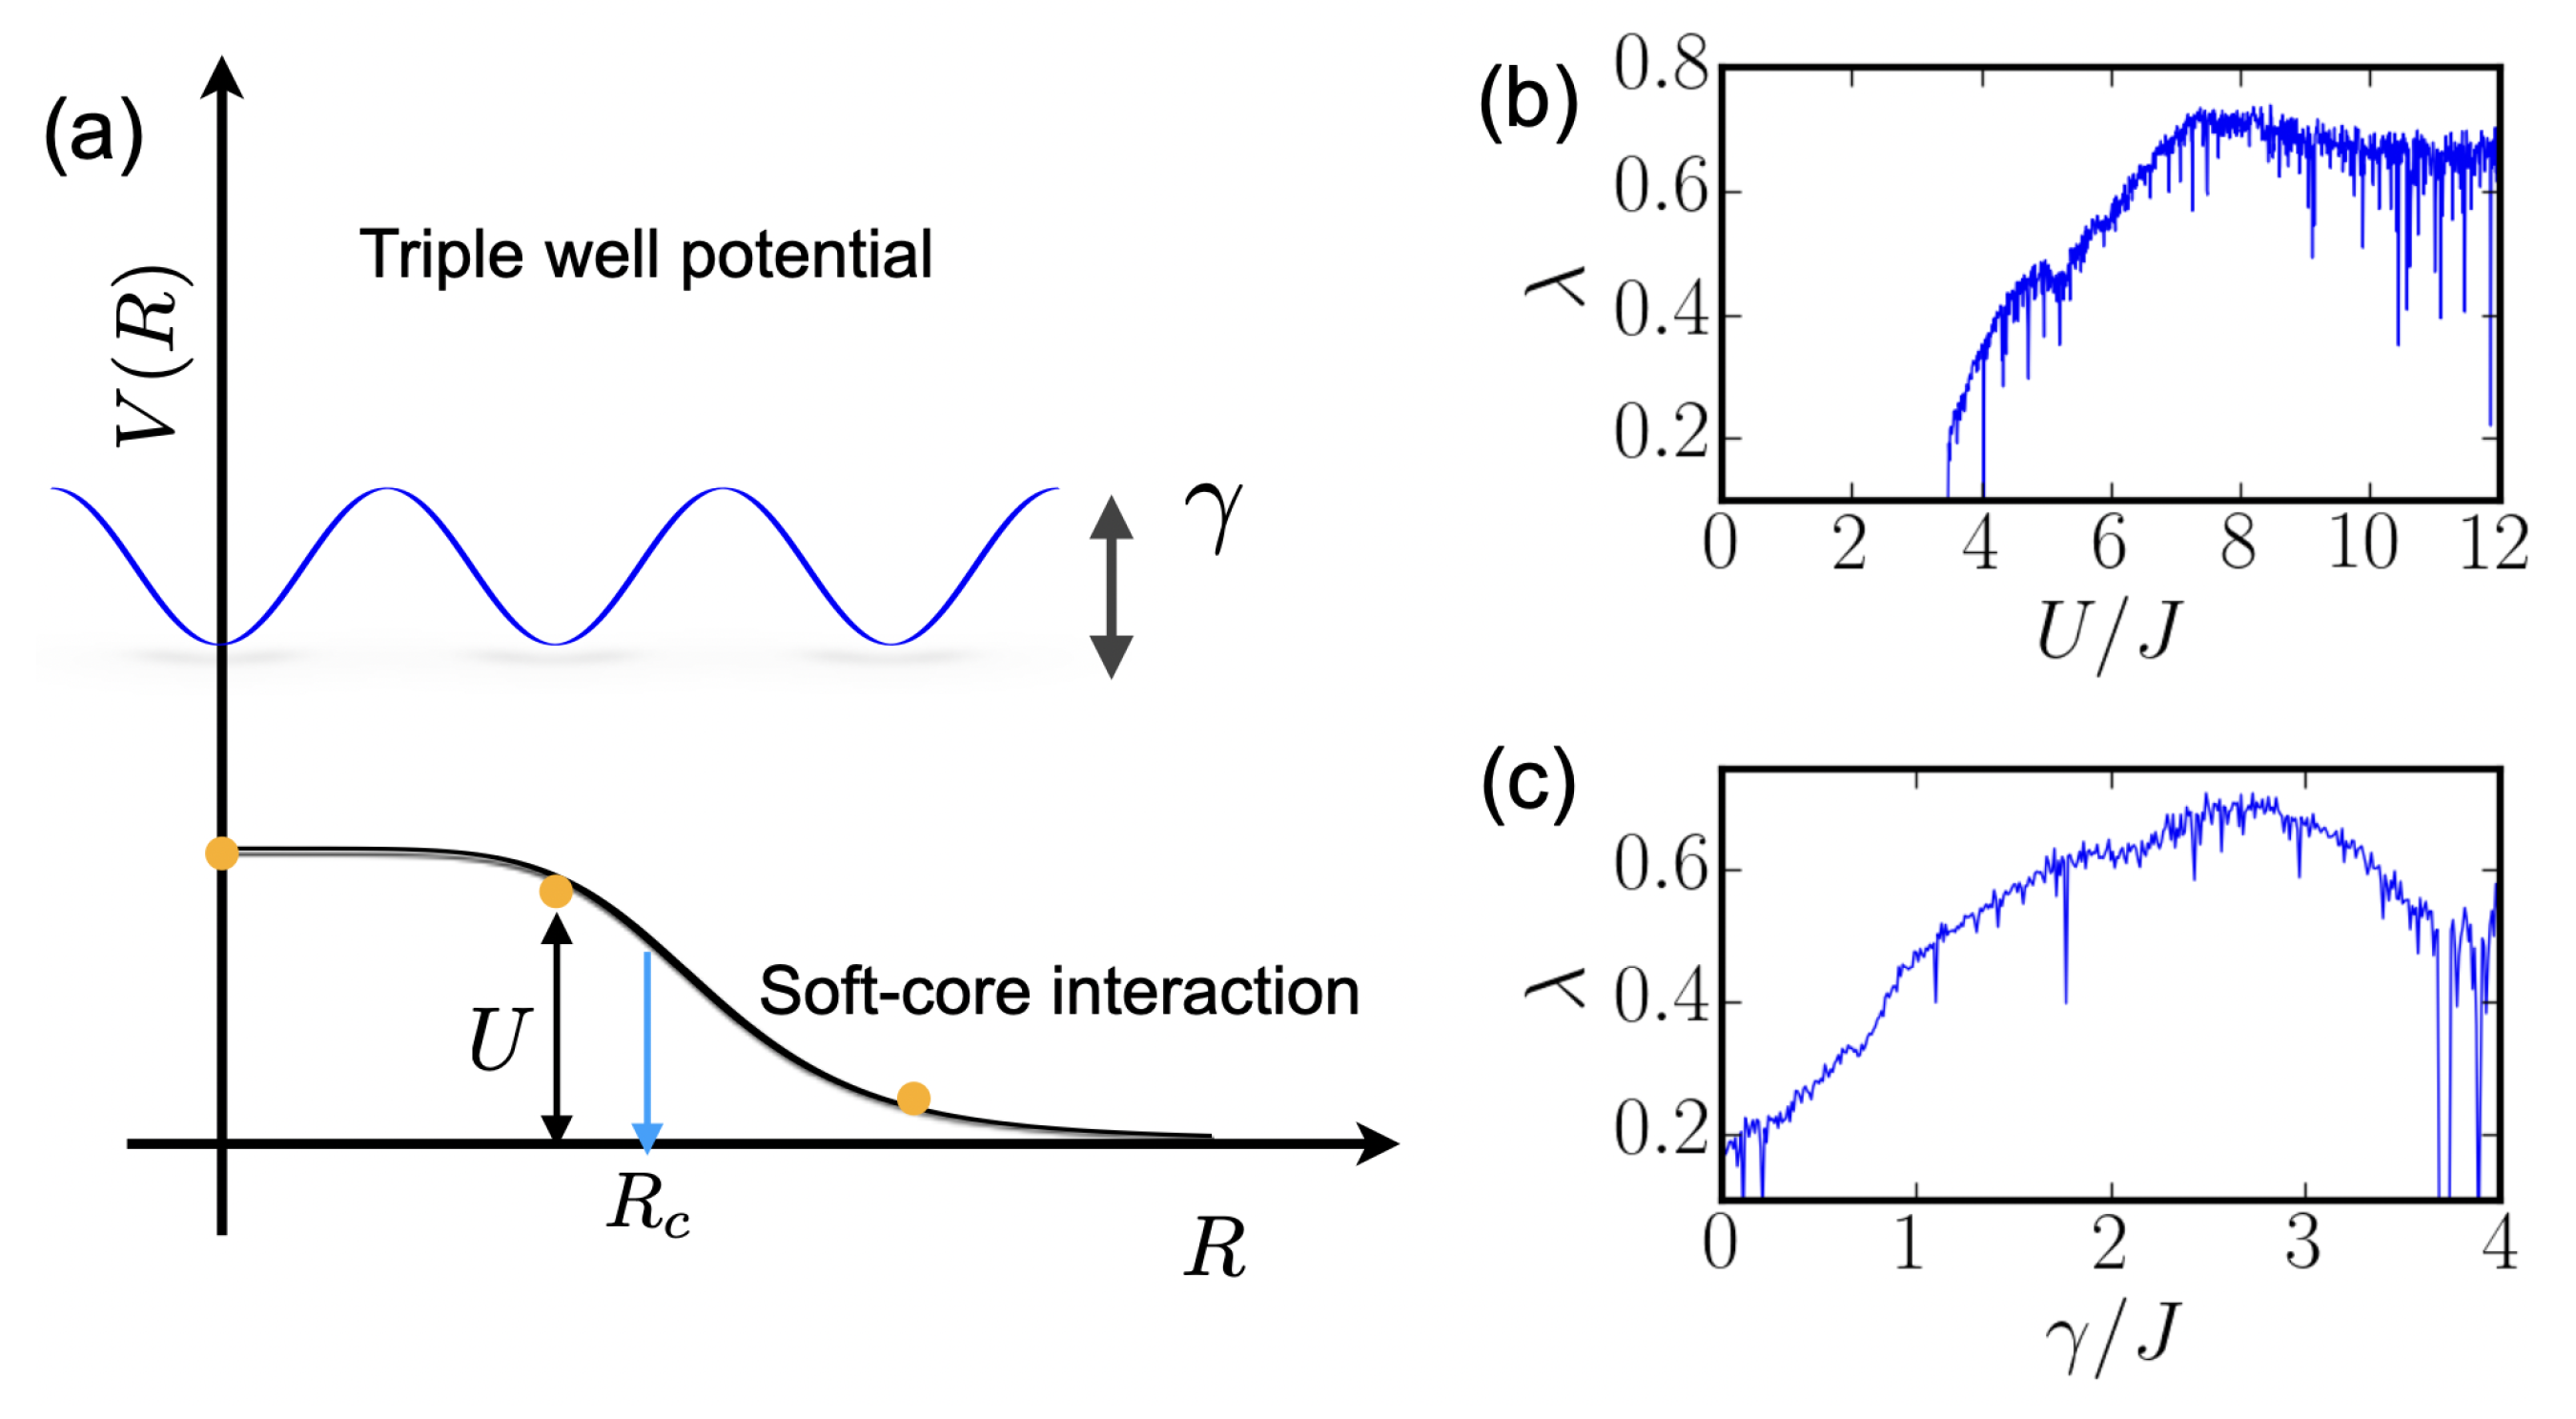
Figure 2.
(a,b) Eigenspectrum as a function of . When U is large, avoided crosses are found. In the calculation, and . (c) Chaos indicator as a function of . Maximal is found at around , where the level spacing approaches the WD distribution. (d–f) show examples of level spacing distributions. In (d–f), is fixed to be 3, 7 and 13, respectively. The dashed blue and solid red lines in (d–f) are the Poissonian and WD distribution, respectively. When , the level is close to the WD distribution. Other parameters are and in (d–f).

Figure 3.
(a,b) Eigenspectra at different intervals of with and . Direct and avoided level crossings are found in (a). In (b), only avoided level crossings are found. (c) Chaos indicator as a function of . Around , reaches the maximal value, where the level spacing approaches the WD distribution. (d–f) show examples of level spacing distributions. In (d–f), is fixed to be 0, 2.5 and 7, respectively. The dashed blue and solid red lines in (d–f) represent the Poissonian and WD distribution, respectively. When , the levels approach the WD distribution. Other parameters are and in (d–f).

Figure 4.
(a) Dynamical evolution of entanglement entropy for , and . (b) Normalized average entropy as a function of for different N. (c) Dynamical evolution of for , and . (d) with respect to for different N. In (a,b) panels, . In (c,d) panels, is fixed to be 7.0.
Figure 4.
(a) Dynamical evolution of entanglement entropy for , and . (b) Normalized average entropy as a function of for different N. (c) Dynamical evolution of for , and . (d) with respect to for different N. In (a,b) panels, . In (c,d) panels, is fixed to be 7.0.

Figure 5.
Moving averages of survival probabilities. We set the temporal window size to be in numerical calculations. was fixed to be 7.0 in (a). was fixed be 2.5 in (b). The dashed blue lines in both panels denote the saturation value of survival probability of GOE matrices. The insets of both panels show the moving averages of survival probabilities beyond . In both panels, .
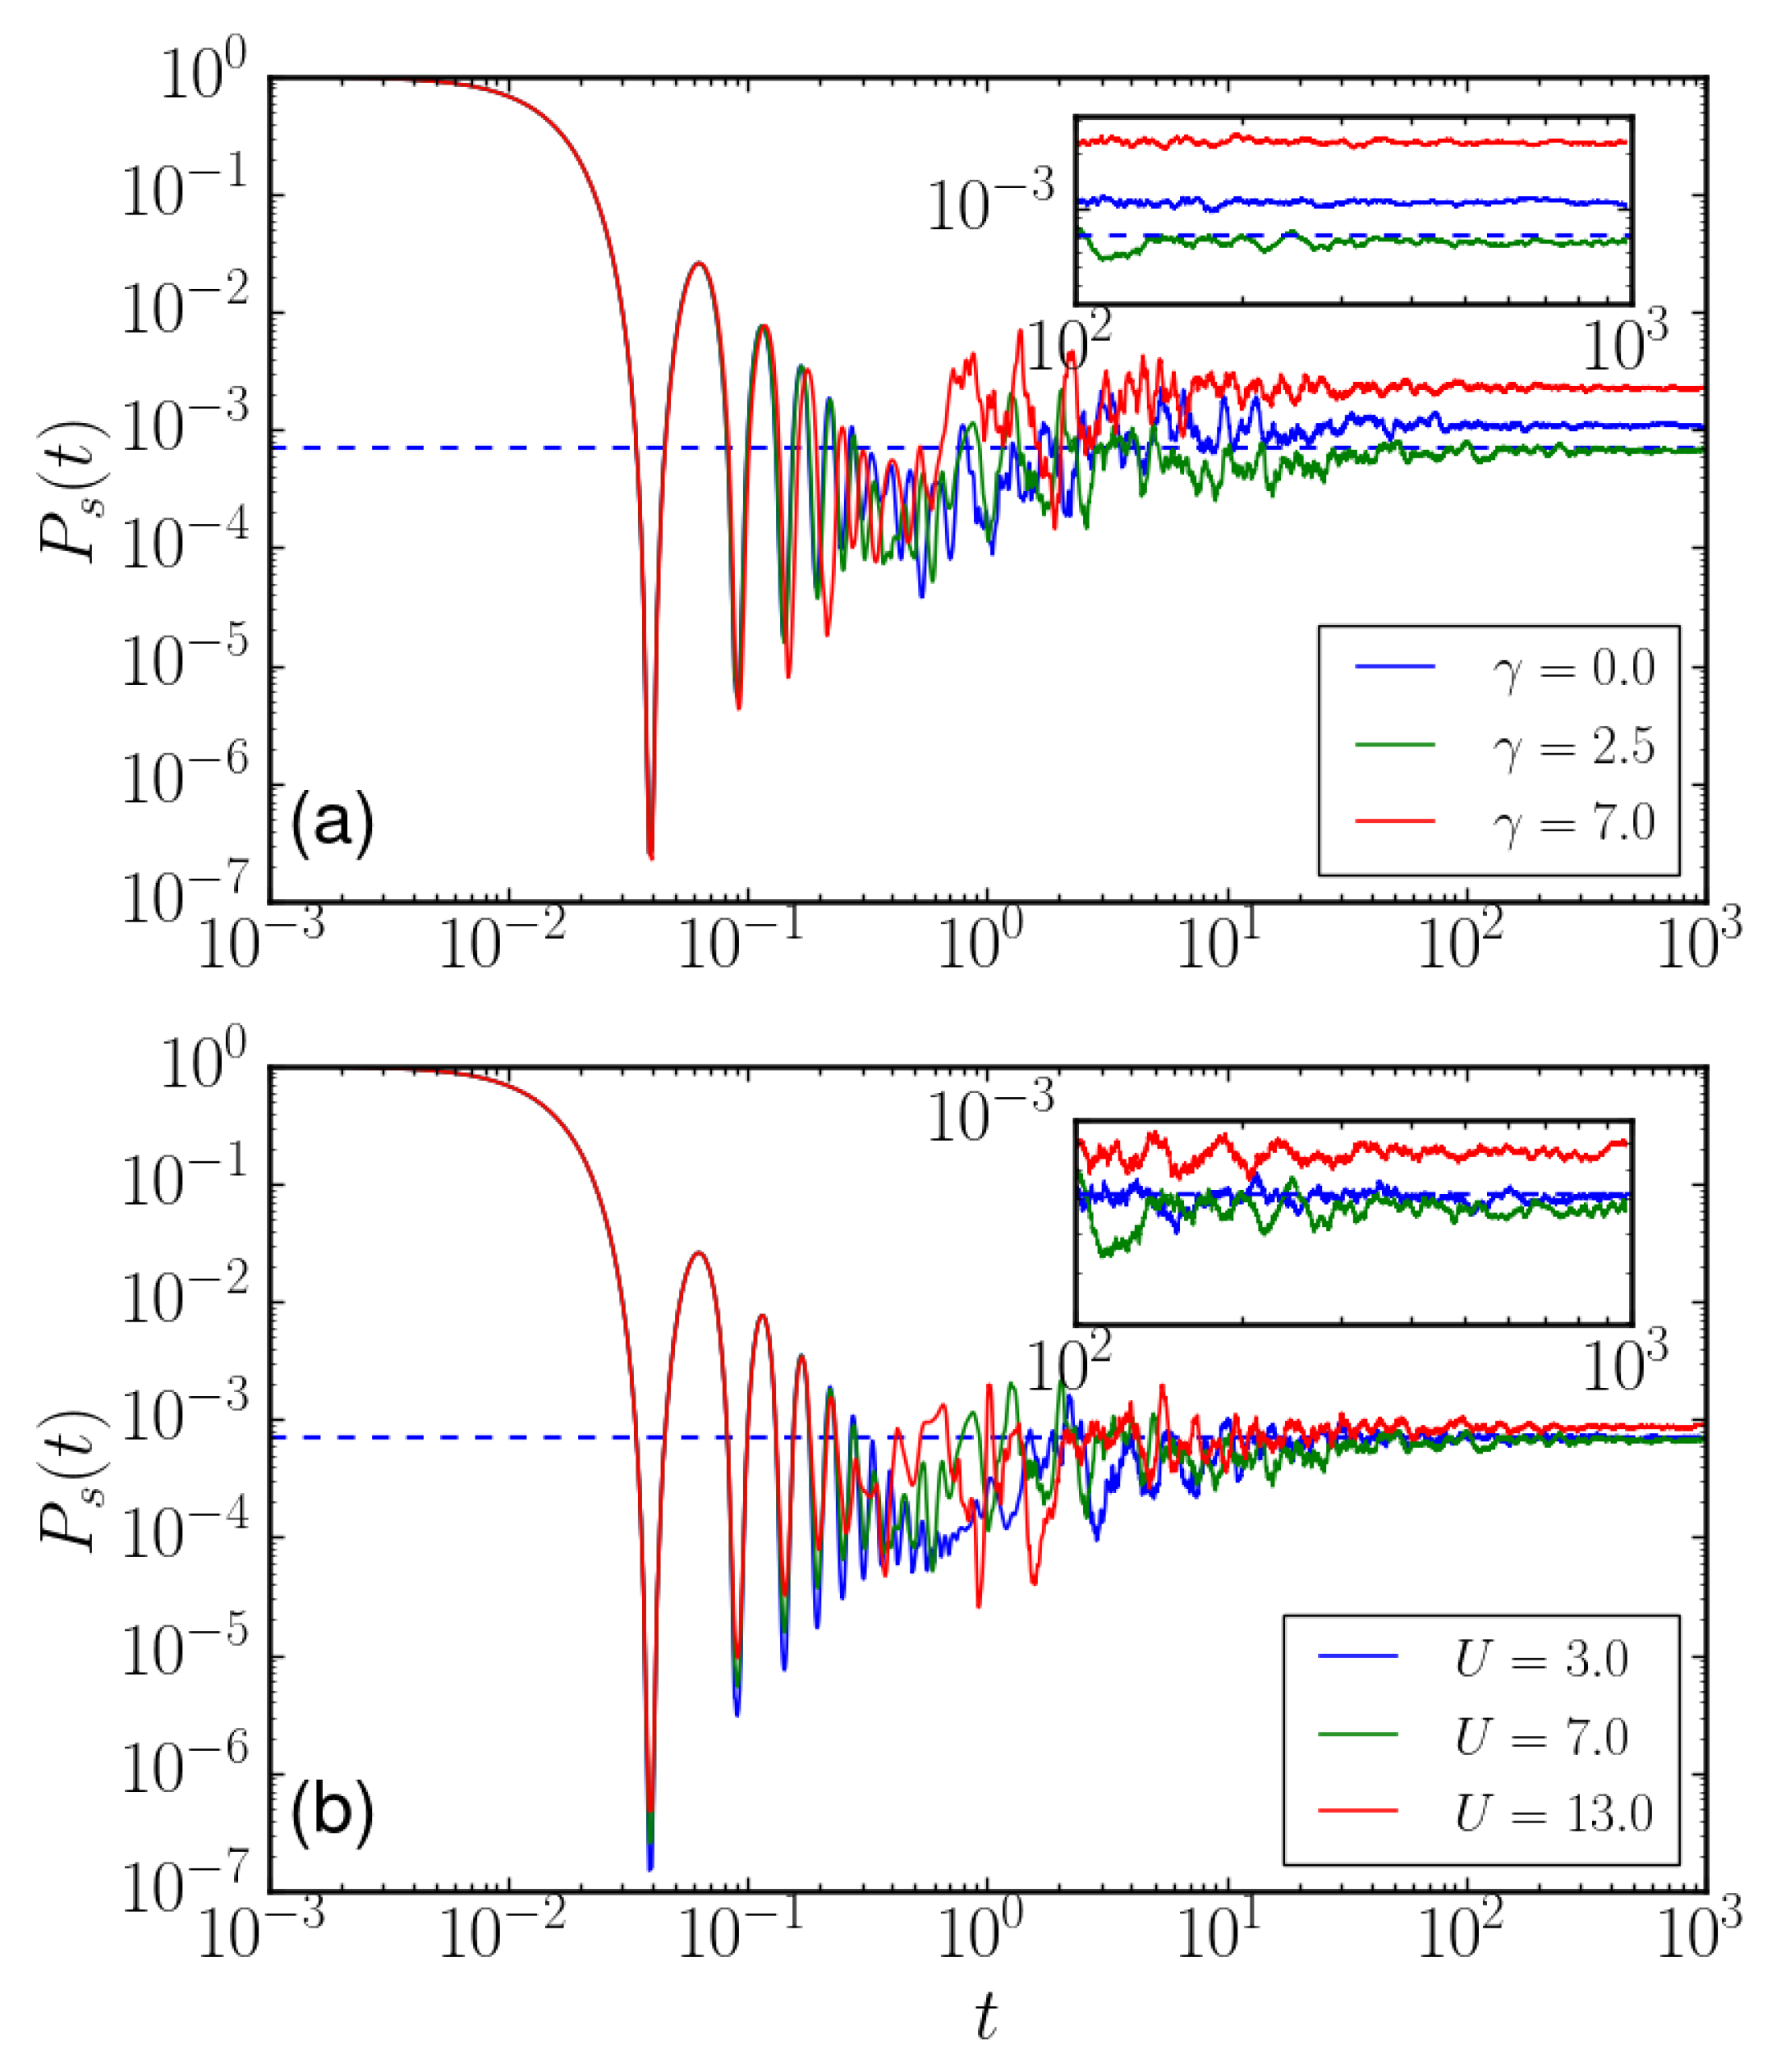
Figure 6.
(a) Population variances with respect to . Evolution of population when (b), (c) and (d). In these panels, blue, green and red lines denote the expectation values in the leftmost, middle and rightmost site, respectively. In all panels, we choose and .
Figure 6.
(a) Population variances with respect to . Evolution of population when (b), (c) and (d). In these panels, blue, green and red lines denote the expectation values in the leftmost, middle and rightmost site, respectively. In all panels, we choose and .
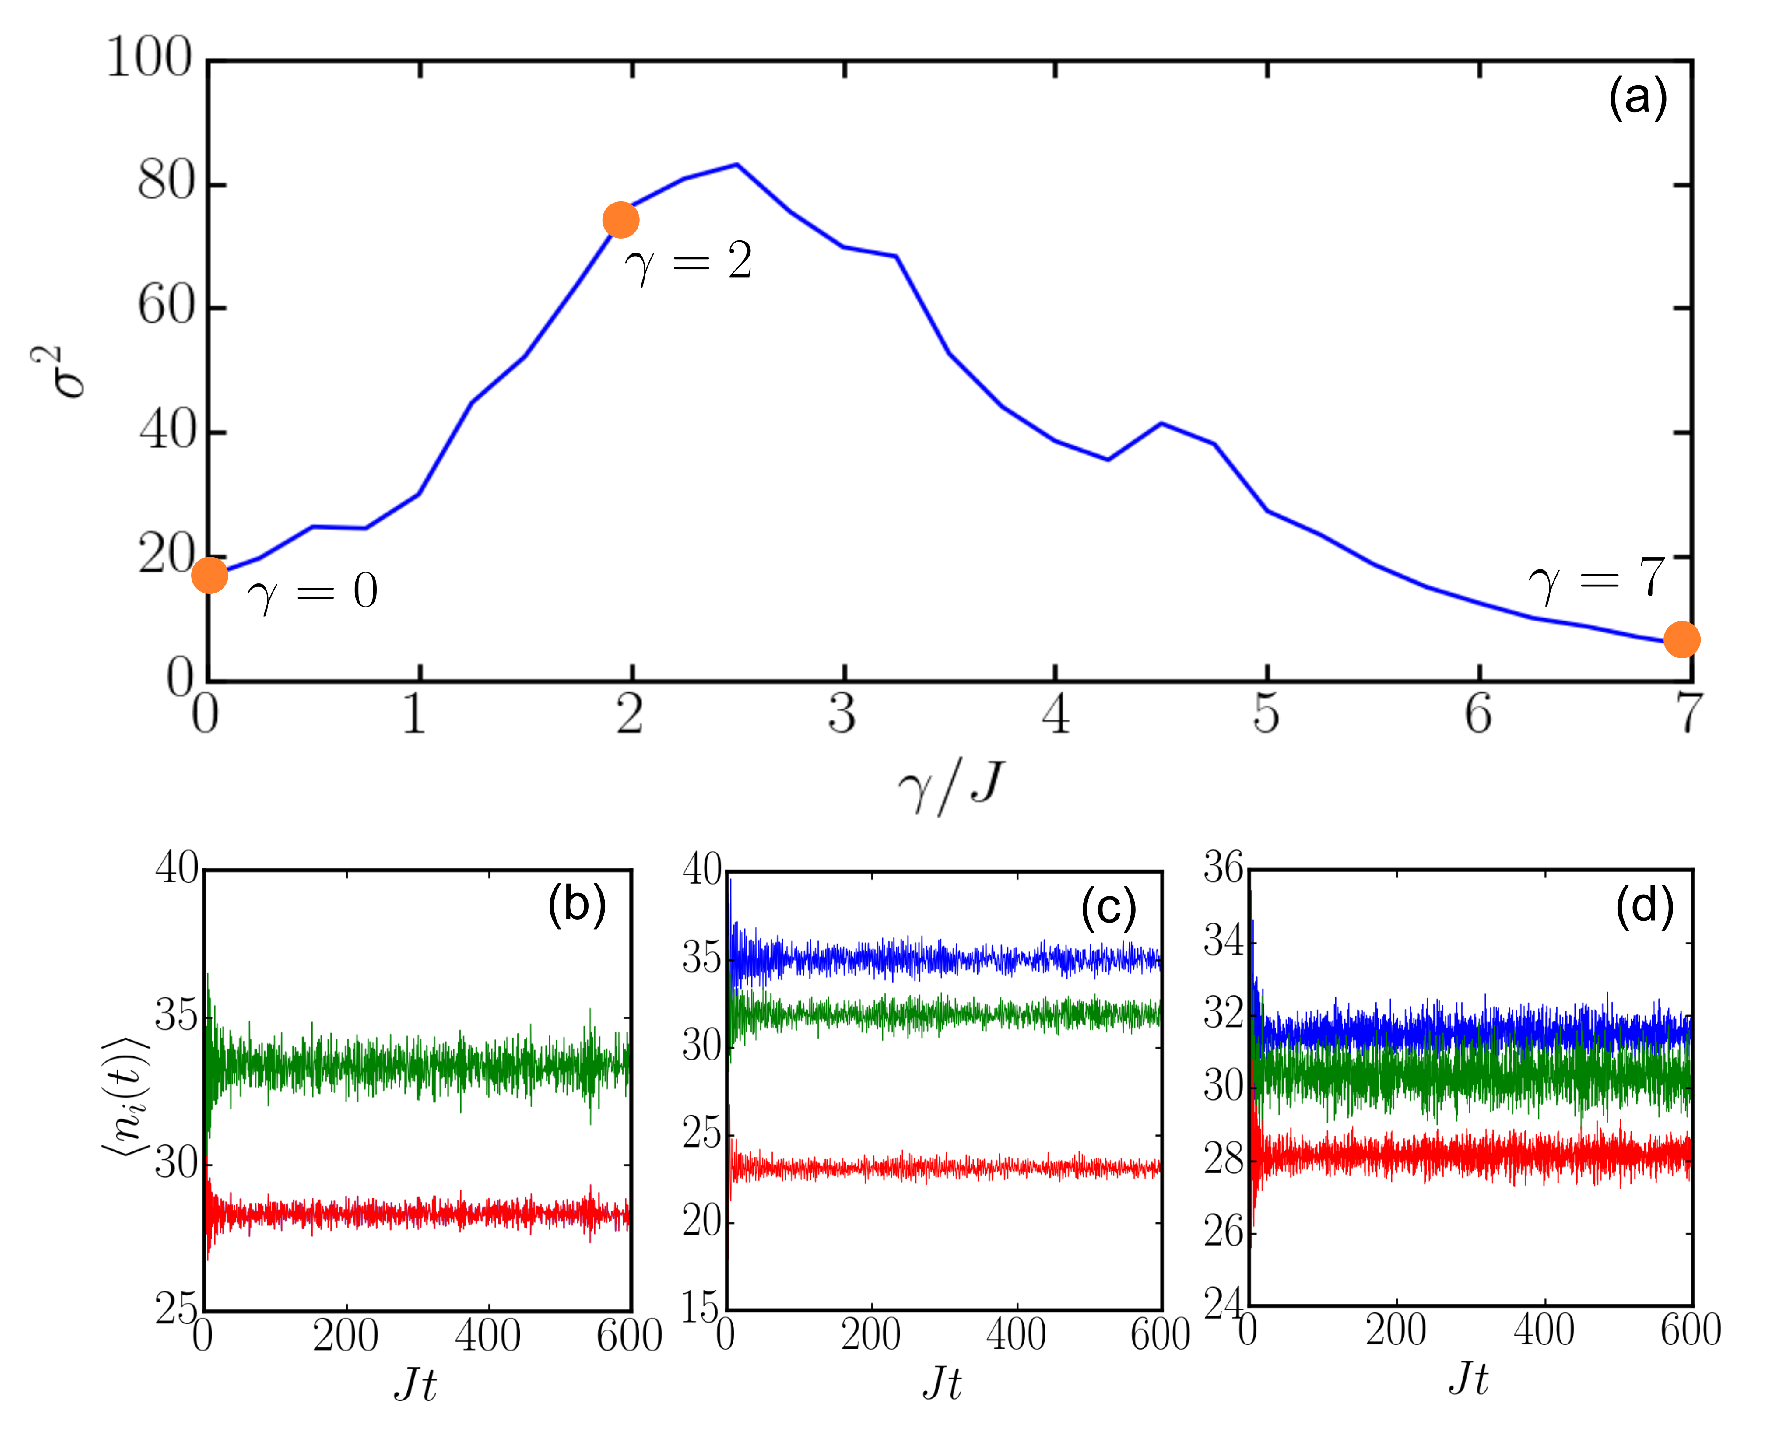
Figure 7.
(a) Population variances with respect to U. Evolution of populations when (b), (c) and (d). In each panel, blue, green and red lines denote the population in the leftmost, middle and rightmost site, respectively. In the calculation, and .
Figure 7.
(a) Population variances with respect to U. Evolution of populations when (b), (c) and (d). In each panel, blue, green and red lines denote the population in the leftmost, middle and rightmost site, respectively. In the calculation, and .
Disclaimer/Publisher’s Note: The statements, opinions and data contained in all publications are solely those of the individual author(s) and contributor(s) and not of MDPI and/or the editor(s). MDPI and/or the editor(s) disclaim responsibility for any injury to people or property resulting from any ideas, methods, instructions or products referred to in the content. |
© 2023 by the authors. Licensee MDPI, Basel, Switzerland. This article is an open access article distributed under the terms and conditions of the Creative Commons Attribution (CC BY) license (https://creativecommons.org/licenses/by/4.0/).
Share and Cite
MDPI and ACS Style
Yan, T.; Collins, M.; Nath, R.; Li, W. Signatures of Quantum Chaos of Rydberg-Dressed Bosons in a Triple-Well Potential. Atoms 2023, 11, 89. https://doi.org/10.3390/atoms11060089
AMA Style
Yan T, Collins M, Nath R, Li W. Signatures of Quantum Chaos of Rydberg-Dressed Bosons in a Triple-Well Potential. Atoms. 2023; 11(6):89. https://doi.org/10.3390/atoms11060089
Chicago/Turabian StyleYan, Tianyi, Matthew Collins, Rejish Nath, and Weibin Li. 2023. "Signatures of Quantum Chaos of Rydberg-Dressed Bosons in a Triple-Well Potential" Atoms 11, no. 6: 89. https://doi.org/10.3390/atoms11060089
Note that from the first issue of 2016, this journal uses article numbers instead of page numbers. See further details here.