
Development of an Optimized Protocol for NMR Metabolomics Studies of Human Colon Cancer Cell Lines and First Insight from Testing of the Protocol Using DNA G-Quadruplex Ligands as Novel Anti-Cancer Drugs

 , ,
, ,  ,
, 
Abstract
:
1. Introduction

2. Materials and Methods
2.1. Materials
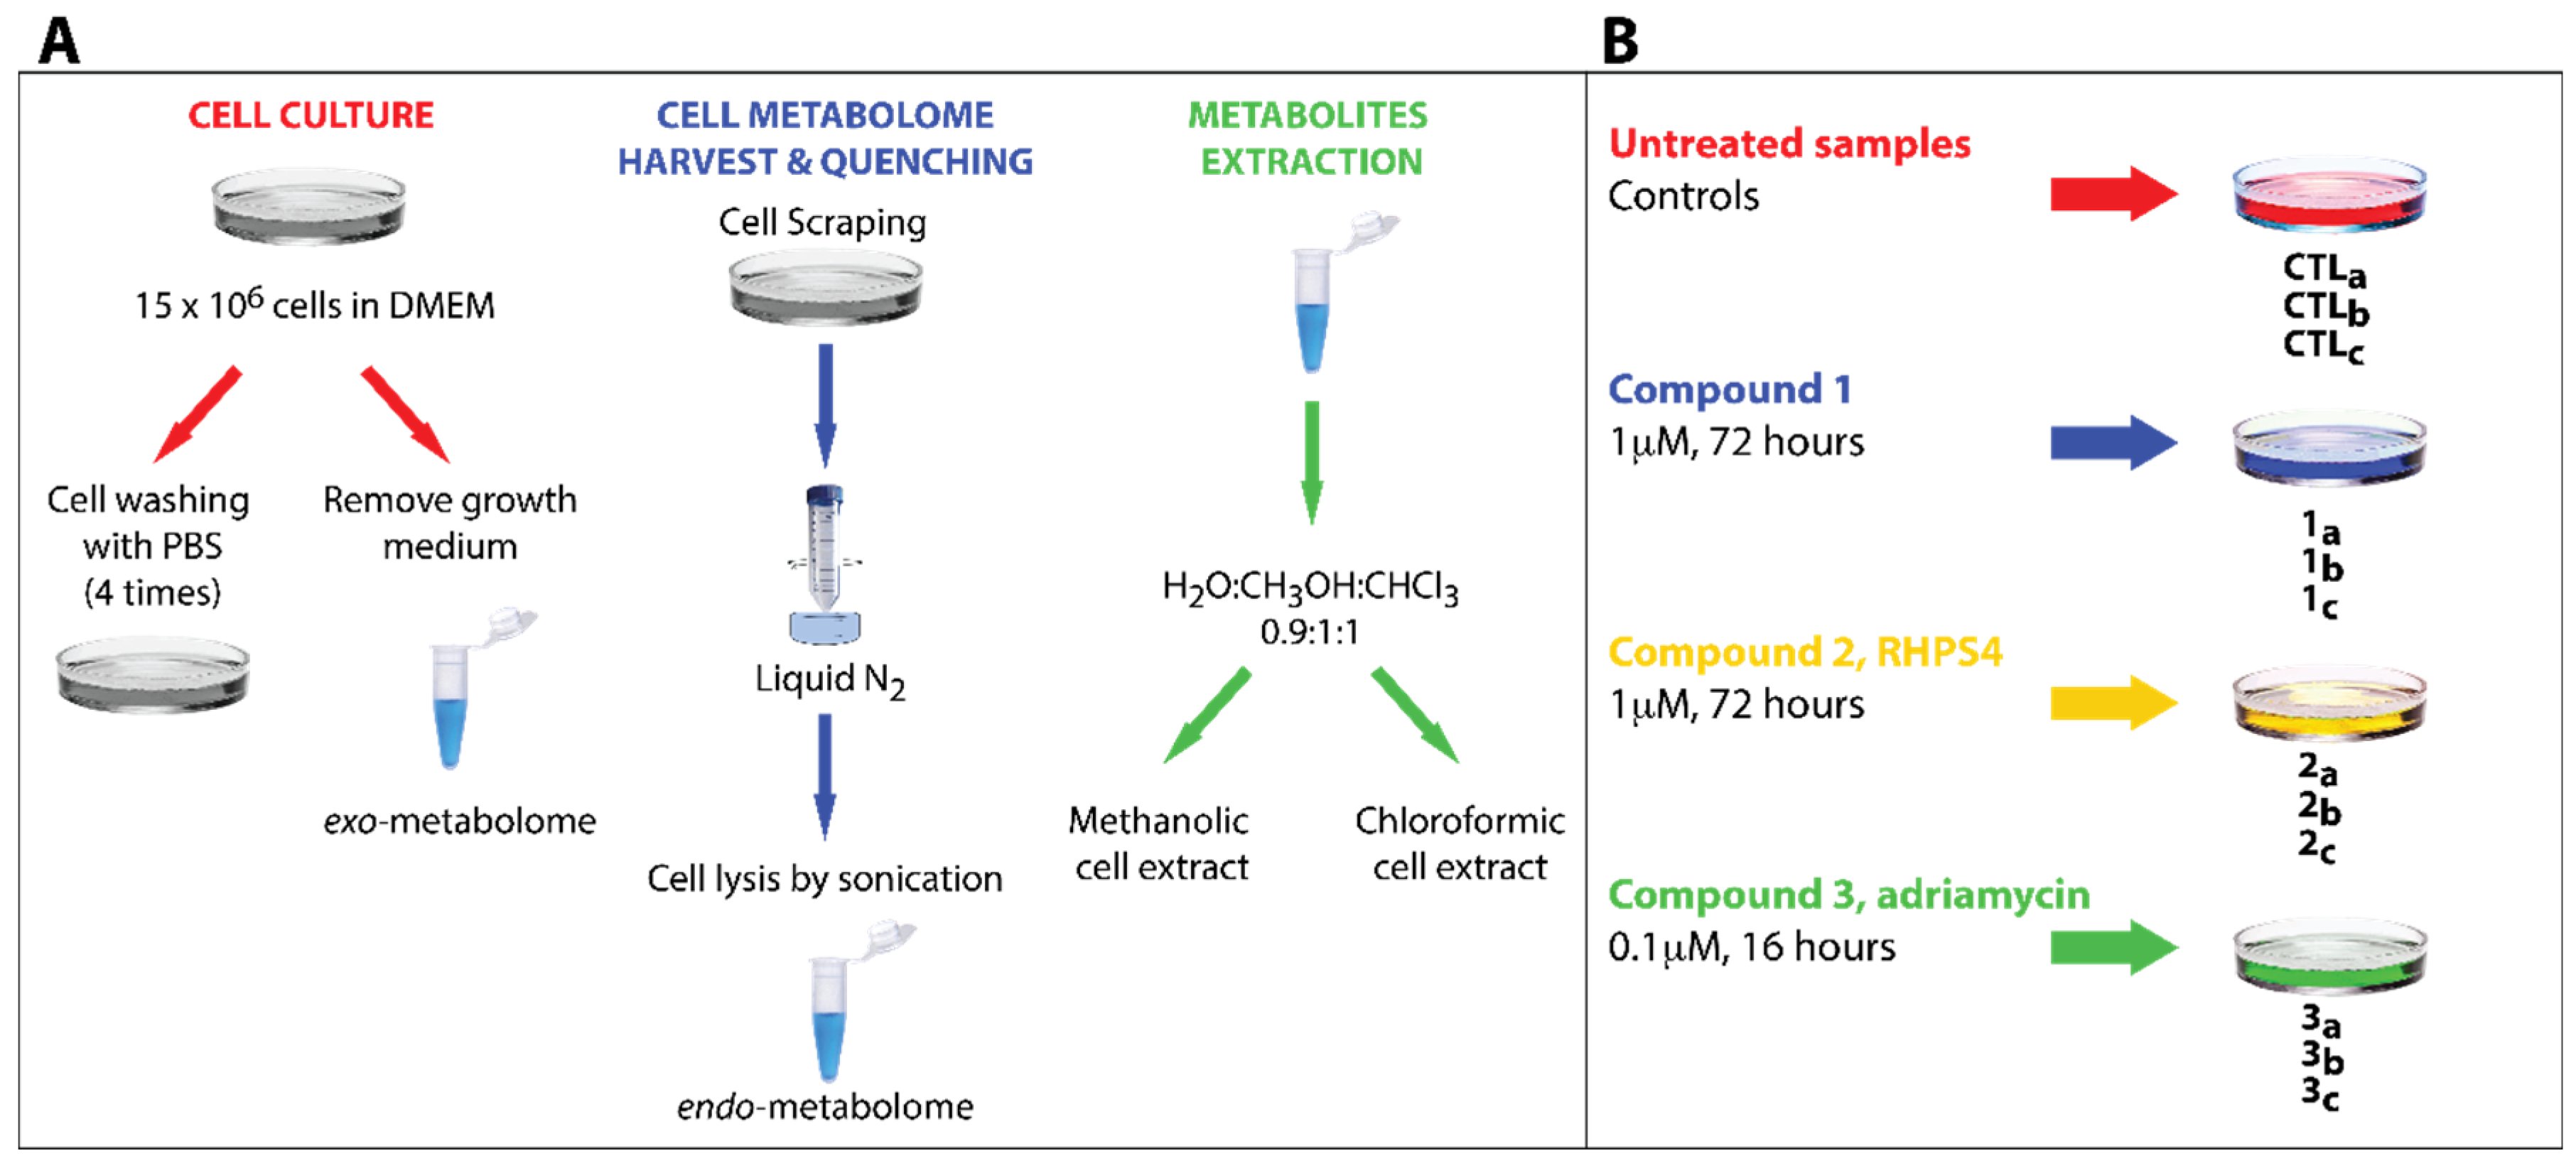
2.2. Cell Culture
2.3. Anti-Cancer Drug Treatments
2.4. Cell Metabolome Quenching
2.5. Metabolites Extraction for NMR Analysis
2.6. Sample Preparation for NMR Analysis
2.7. NMR Spectroscopy of Cell Extracts
2.8. NMR Data Reduction and Processing
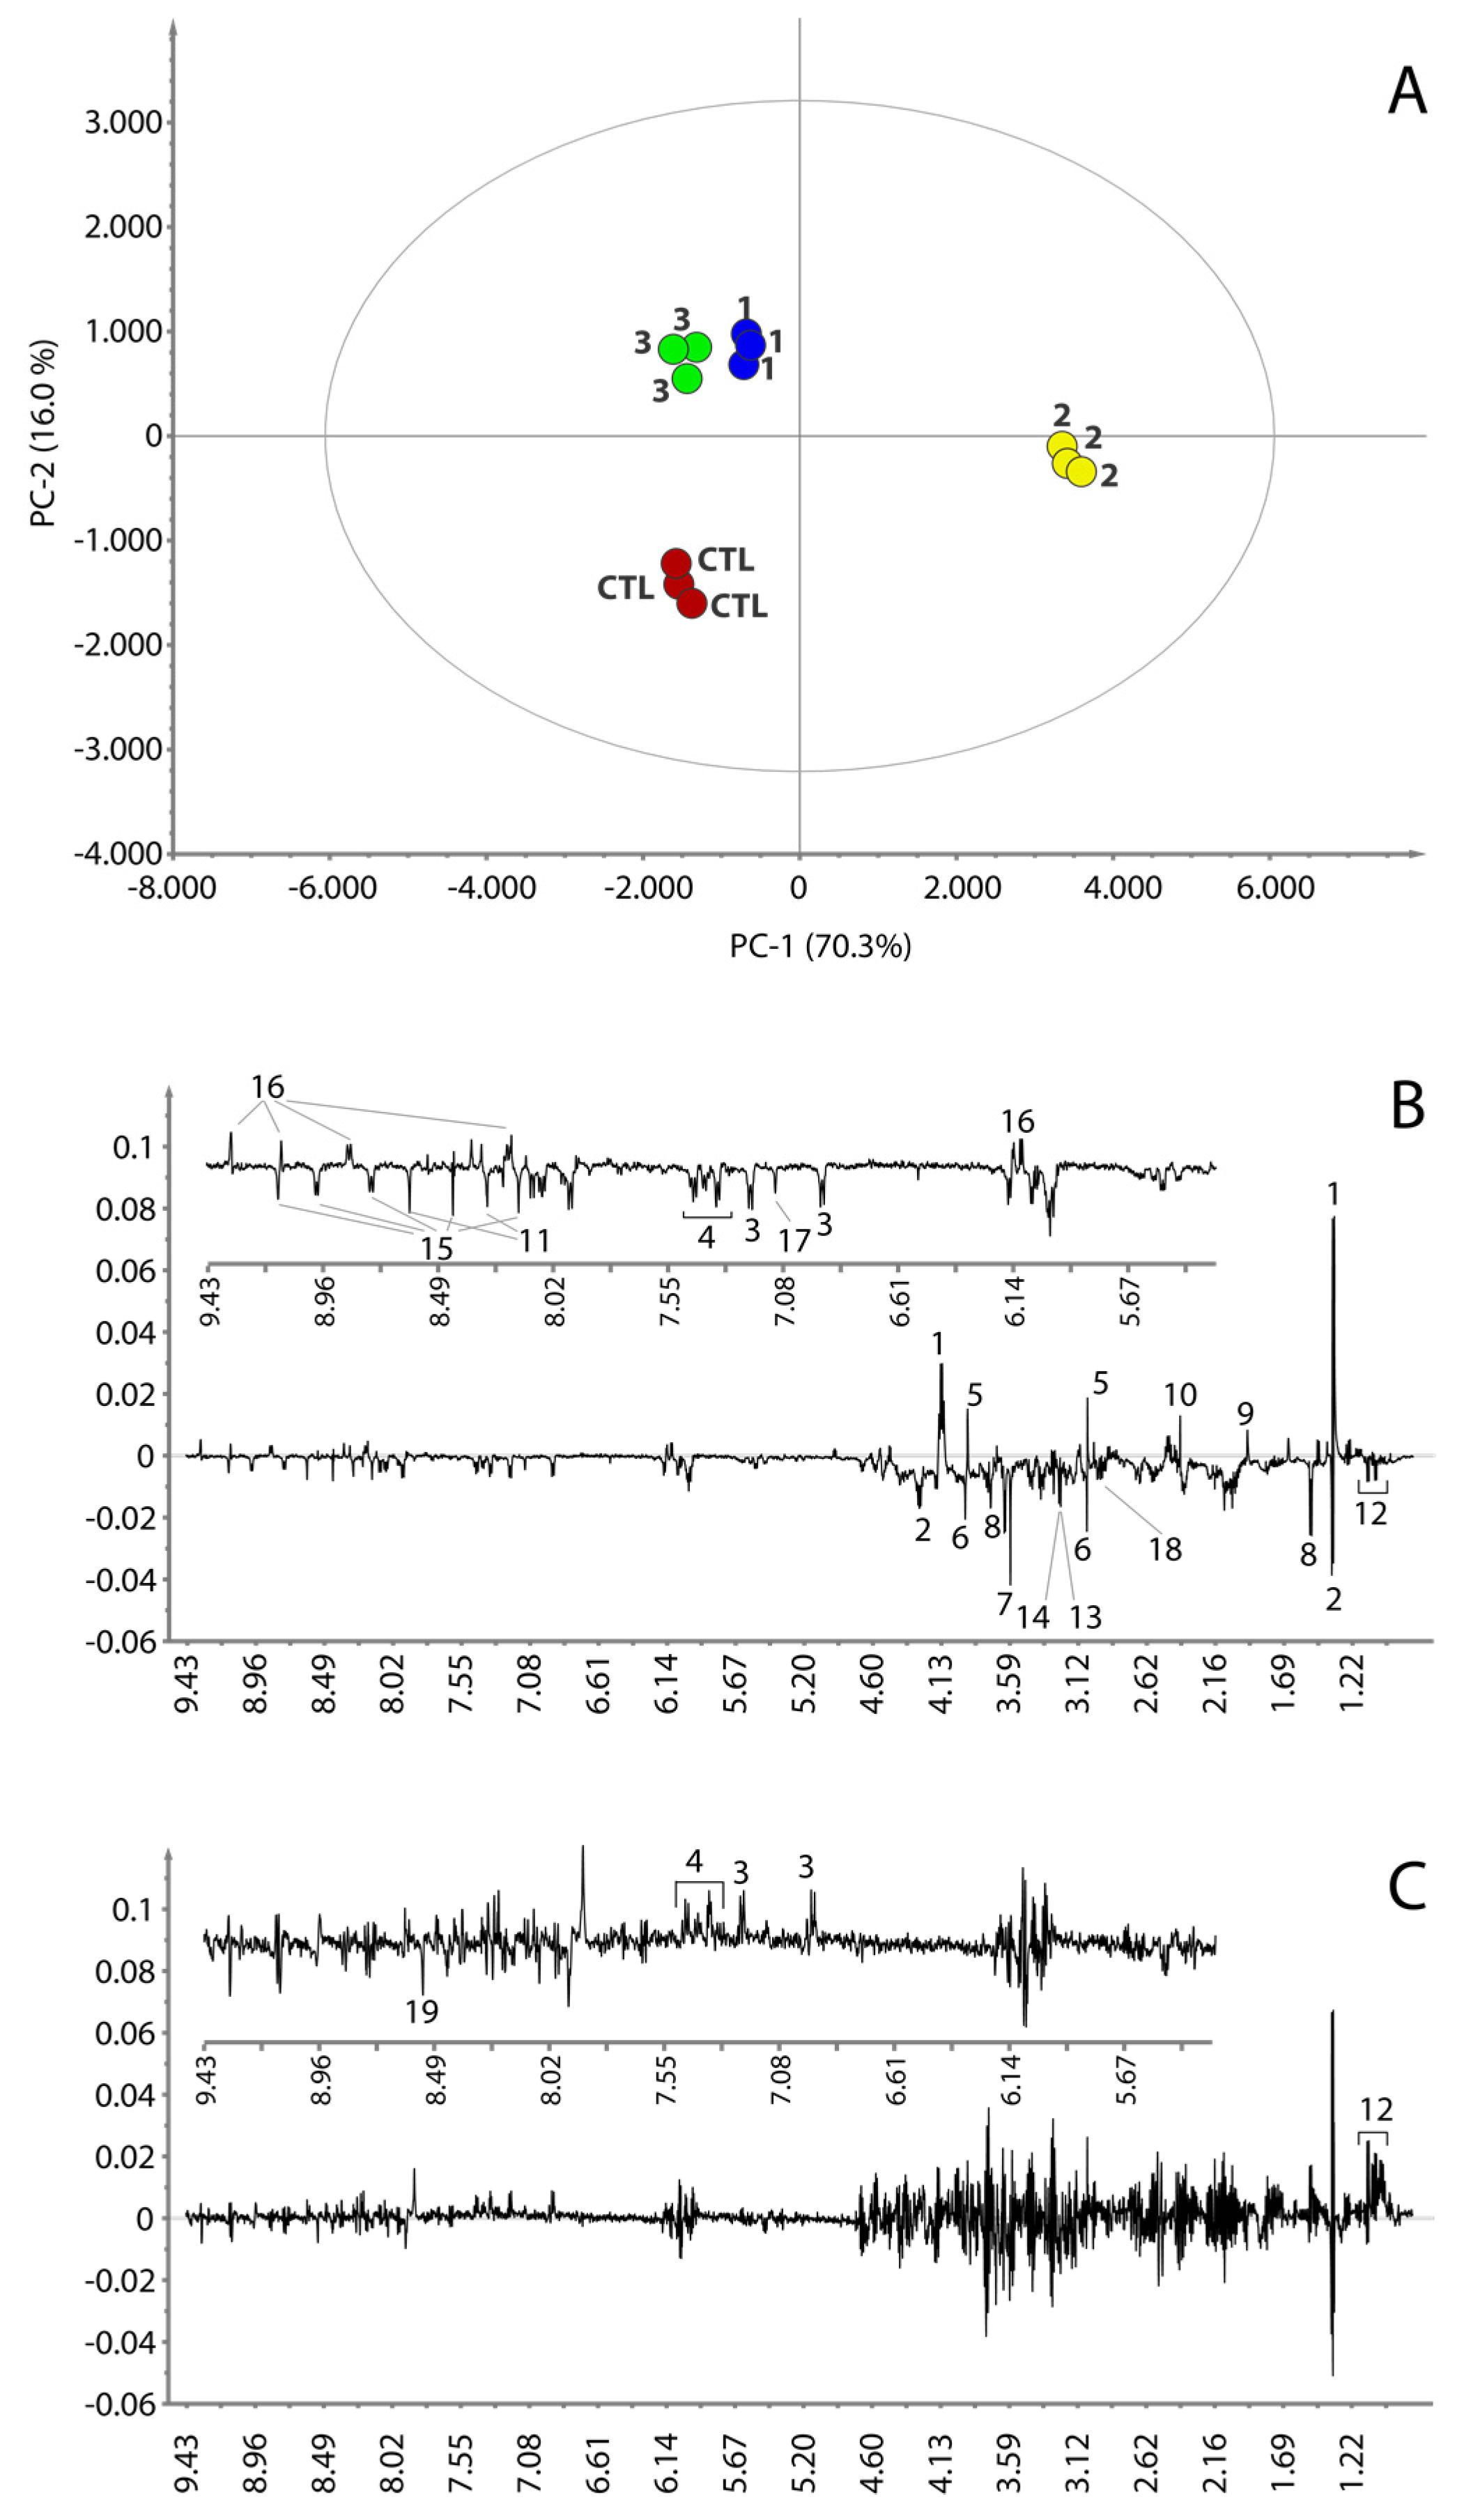
2.9. Multivariate Data Analysis
2.10. Metabolite Identification
2.11. Statistical Total Correlation Spectroscopy Analysis
2.12. Metabolic Pathways Identification
2.13. Statistics
3. Results and Discussion
3.1. Optimization of the Quenching and Extraction Procedures
3.2. Experimental Design

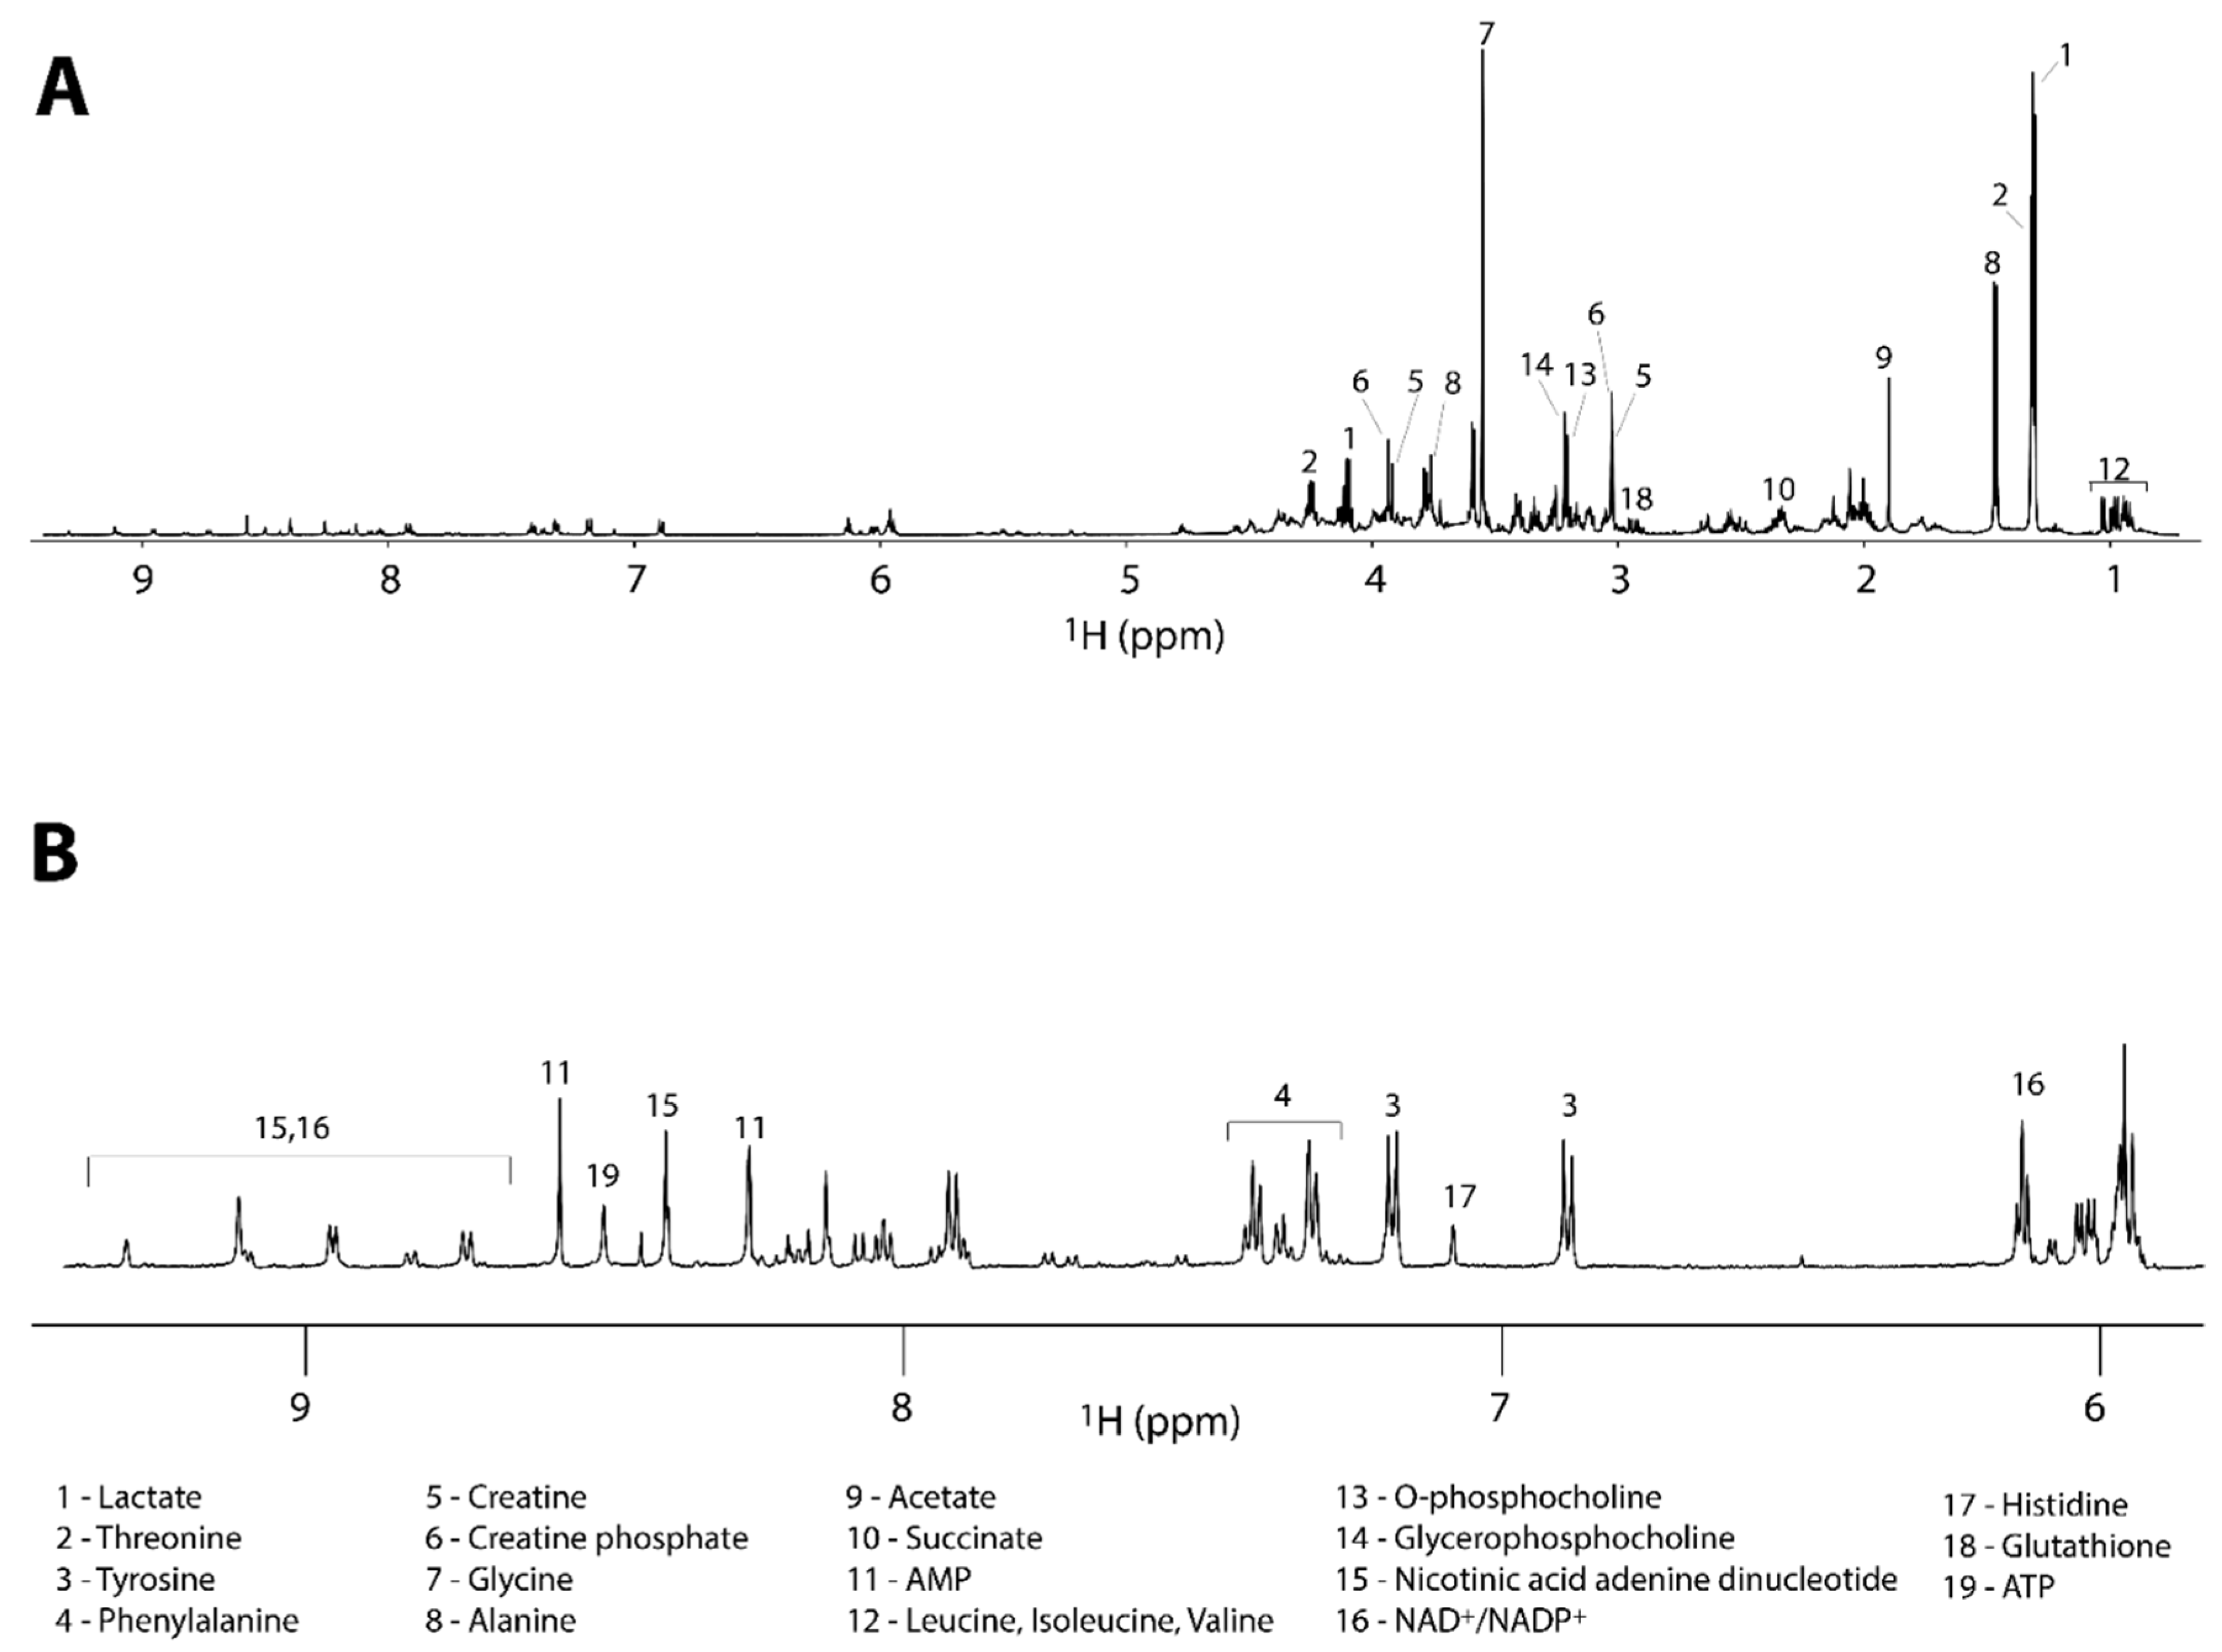
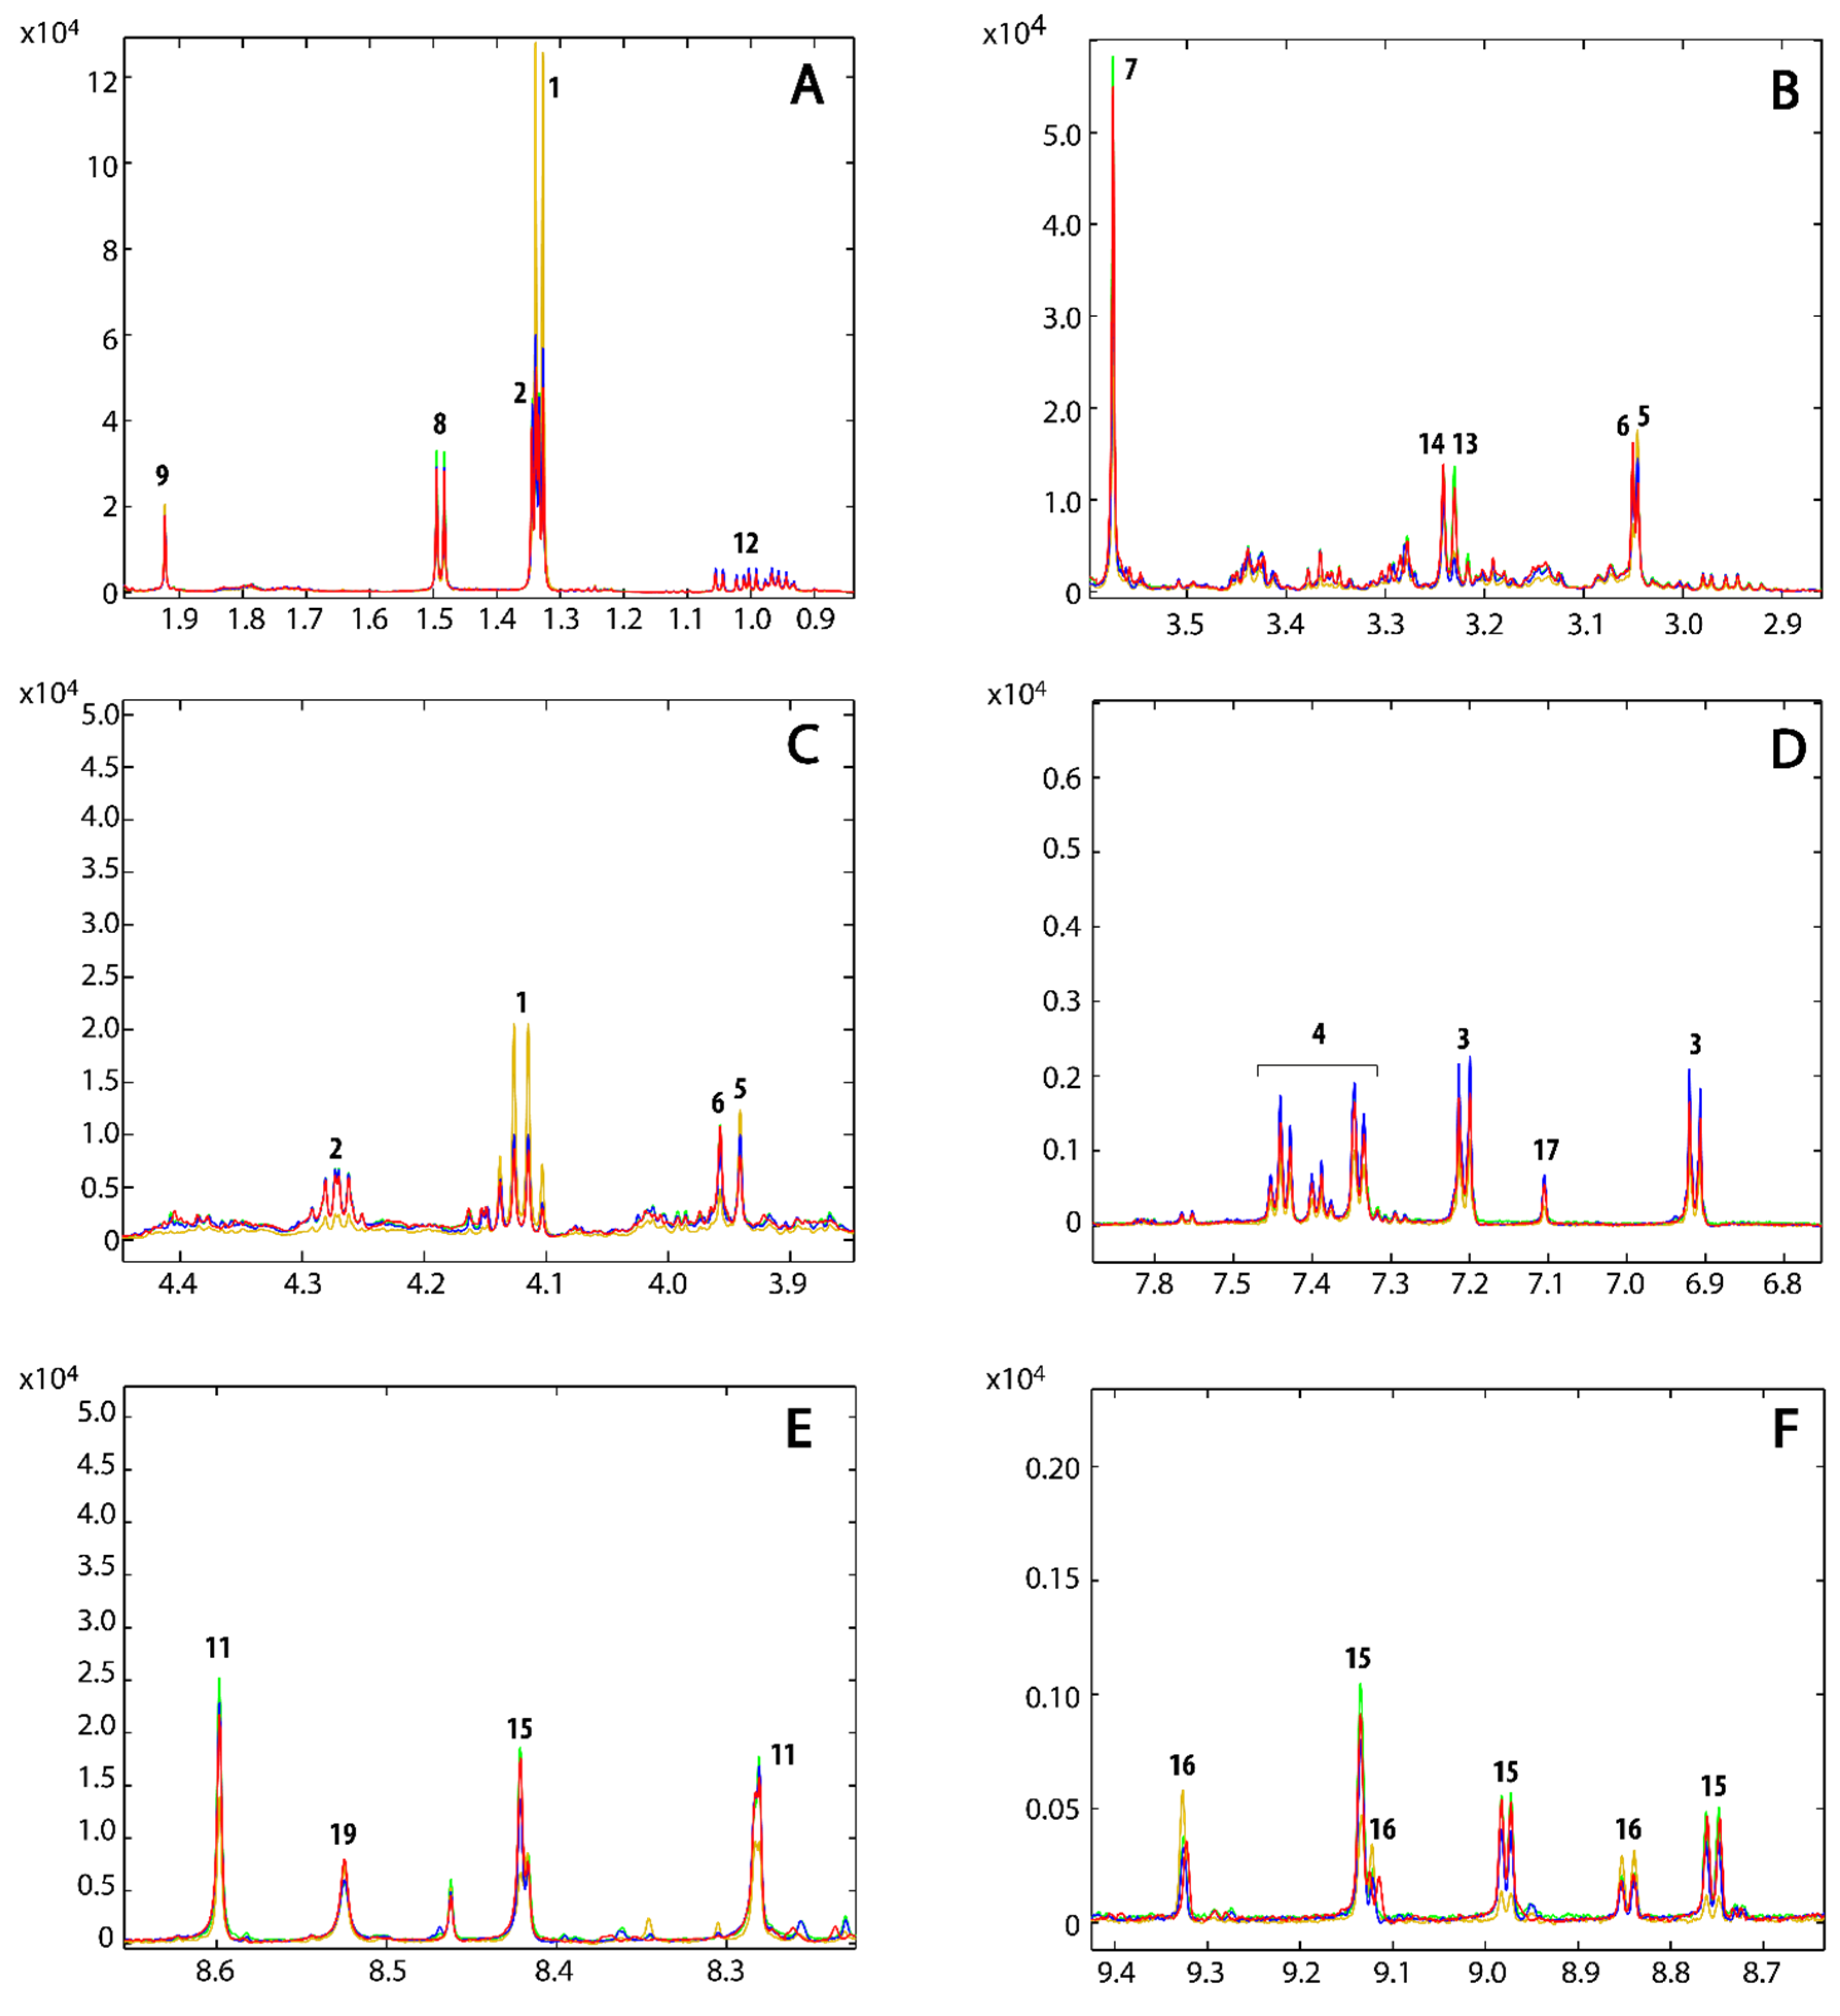
| Identification Number | Metabolites | Chemical Shifts (ppm) | Compound 1 | Compound 2 | Compound 3 |
|---|---|---|---|---|---|
| 1 | Lactate | 1.33(d) | +19% ± 4% | +165% ± 18% | +18 ± 10% |
| 4.13(q) | |||||
| 2 | Threonine | 1.34(d) | +14% ± 4% | −46% ± 2% | +17 ± 8% |
| 4.27(m) | |||||
| 3 | Tyrosine | 6.91(m) | +28% ± 3% | −36% ± 3% | +17±5% |
| 7.21(m) | |||||
| 4 | Phenylalanine | 7.34(d) | +23% ± 1% | −34% ± 2% | +13% ± 3% |
| 7.39(m) | |||||
| 7.44(m) | |||||
| 5 | Creatine | 3.04(s) | +23% ± 2% | +49% ± 10% | +19% ± 5% |
| 3.95(s) | |||||
| 6 | Creatine phosphate | 3.05(s) | −13% ± 5% | −55% ± 2% | 0 ± 9% |
| 3.96(s) | |||||
| 7 | Glycine | 3.58(s) | −8% ± 4% | −43% ± 4% | +6 ± 9% |
| 8 | Alanine | 1.49(d) | +2% ± 3% | −29 ± 5% | +15 ± 9% |
| 3.81(q) | |||||
| 9 | Acetate | 1.92(s) | 0 ± 20% | +14% ± 1% | 0% ± 50% |
| 10 | Succinate | 2.39(s) | +7% ± 1% | +122% ± 122% | +13% ± 1% |
| 11 | AMP | 4.02(dd) | +5 ± 4% | −36 ± 5% | +16% ± 8% |
| 4.36(dd) | |||||
| 4.51(dd) | |||||
| 8.28(s) | |||||
| 8.59(s) | |||||
| 12 | Isoleucine, Leucine, Valine | 0.94(t) | +29% ± 4% | −11% ± 5% | +15% ± 9% |
| 1.02(d) | |||||
| 0.97(d) | |||||
| 0.99(d) | |||||
| 1.05(d) | |||||
| 13 | O-Phosphocholine | 3.23(s) | −68% ± 1% | −61% ± 1% | +21% ± 7% |
| 4.17(m) | |||||
| 14 | Glycerophosphocholine | 3.24(s) | −20% ± 2% | −33% ± 4% | −1% ± 6% |
| 15 | Nicotinic acid adenine dinucleotide (NAAD) | 8.06(t) | −12% ± 2% | −48% ± 3% | +15% ± 2% |
| 8.15(s) | |||||
| 8.42(s) | |||||
| 8.75(d) | |||||
| 8.95(d) | |||||
| 9.13(s) | |||||
| 16 | NAD+/NADP+ | 6.10(d) | −8% ± 2% | +62% ± 11% | +6% ± 6% |
| 8.18(m) | |||||
| 8.84(d) | |||||
| 9.12(d) | |||||
| 9.32(s) | |||||
| 17 | Histidine | 7.10(d) | +24% ± 1% | −52% ± 3% | +14% ± 2% |
| 7.86(d) | |||||
| 18 | Glutathione | 2.97(dd) | +9% ± 2% | −43% ± 9% | +13% ± 4% |
| 4.57(q) | |||||
| 2.58(m) | |||||
| 19 | ATP | 8.52(s) | −24% ± 7% | −8% ± 4% | −26% ± 6% |
3.3. Metabolic Profile


3.4. Metabolic Pathways Analysis
4. Conclusions
Supplementary Materials
Acknowledgments
Author Contributions
Conflicts of Interest
References
- Griffin, J. Metabonomics: NMR spectroscopy and pattern recognition analysis of body fluids and tissues for characterisation of xenobiotic toxicity and disease diagnosis. Curr. Opin. Chem. Biol. 2003, 7, 648–654. [Google Scholar] [CrossRef] [PubMed]
- Andrew Clayton, T.; Lindon, J.C.; Cloarec, O.; Antti, H.; Charuel, C.; Hanton, G.; Provost, J.-P.; Le Net, J.-L.; Baker, D.; Walley, R.J.; et al. Pharmaco-metabonomic phenotyping and personalized drug treatment. Nature 2006, 440, 1073–1077. [Google Scholar] [CrossRef] [PubMed]
- Robertson, D.G. Metabonomics in Toxicology: A Review. Toxicol. Sci. 2005, 85, 809–822. [Google Scholar] [CrossRef] [PubMed]
- Savorani, F.; Rasmussen, M.A.; Mikkelsen, M.S.; Engelsen, S.B. A primer to nutritional metabolomics by NMR spectroscopy and chemometrics. Food Res. Int. 2013, 54, 1131–1145. [Google Scholar] [CrossRef]
- Tang, J. Microbial Metabolomics. Curr. Genom. 2011, 12, 391–403. [Google Scholar] [CrossRef] [PubMed]
- Cuperlović-Culf, M.; Barnett, D.A.; Culf, A.S.; Chute, I. Cell culture metabolomics: Applications and future directions. Drug Discov. Today 2010, 15, 610–621. [Google Scholar] [CrossRef] [PubMed]
- Zhang, A.; Sun, H.; Xu, H.; Qiu, S.; Wang, X. Cell Metabolomics. OMICS 2013, 17, 495–501. [Google Scholar] [CrossRef] [PubMed]
- Bai, J.; Wang, M.X.; Chowbay, B.; Ching, C.B.; Chen, W.N. Metabolic profiling of HepG2 cells incubated with S(−) and R(+) enantiomers of anti-coagulating drug warfarin. Metabolomics 2011, 7, 353–362. [Google Scholar] [CrossRef] [PubMed]
- Panopoulos, A.D.; Yanes, O.; Ruiz, S.; Kida, Y.S.; Diep, D.; Tautenhahn, R.; Herrerías, A.; Batchelder, E.M.; Plongthongkum, N.; Lutz, M.; et al. The metabolome of induced pluripotent stem cells reveals metabolic changes occurring in somatic cell reprogramming. Cell. Res. 2012, 22, 168–177. [Google Scholar] [CrossRef] [PubMed]
- Serkova, N.; Glunde, K. Metabolomics of Cancer. In Tumor Biomarker Discovery SE -20; Tainsky, M.A., Ed.; Methods in Molecular Biology; Humana Press: New York, NY, USA, 2009; Volume 520, pp. 273–295. [Google Scholar]
- Jemal, A.; Bray, F.; Center, M.M.; Ferlay, J.; Ward, E.; Forman, D. Global cancer statistics. CA Cancer J. Clin. 2011, 61, 69–90. [Google Scholar] [CrossRef] [PubMed]
- Frezza, C.; Zheng, L.; Tennant, D.A.; Papkovsky, D.B.; Hedley, B.A.; Kalna, G.; Watson, D.G.; Gottlieb, E. Metabolic profiling of hypoxic cells revealed a catabolic signature required for cell survival. PLoS ONE 2011. [Google Scholar] [CrossRef] [PubMed] [Green Version]
- Kotze, H.L.; Armitage, E.G.; Sharkey, K.J.; Allwood, J.W.; Dunn, W.B.; Williams, K.J.; Goodacre, R. A novel untargeted metabolomics correlation-based network analysis incorporating human metabolic reconstructions. BMC Syst. Biol. 2013, 7, 107. [Google Scholar] [CrossRef] [PubMed]
- Loftus, N.J.; Lai, L.; Wilkinson, R.W.; Odedra, R.; Wilson, I.D.; Barnes, A.J. Global Metabolite Profiling of Human Colorectal Cancer Xenografts in Mice Using HPLC–MS/MS. J. Proteome Res. 2013, 12, 2980–2986. [Google Scholar] [CrossRef] [PubMed]
- Tolstikov, V.; Nikolayev, A.; Dong, S.; Zhao, G.; Kuo, M.-S. Metabolomics analysis of metabolic effects of nicotinamide phosphoribosyltransferase (NAMPT) inhibition on human cancer cells. PLoS ONE 2014. [Google Scholar] [CrossRef] [PubMed]
- Aftab, O.; Engskog, M.K.R.; Haglöf, J.; Elmsjö, A.; Arvidsson, T.; Pettersson, C.; Hammerling, U.; Gustafsson, M.G. NMR Spectroscopy-Based Metabolic Profiling of Drug-Induced Changes in Vitro Can Discriminate between Pharmacological Classes. J. Chem. Inf. Model. 2014, 54, 3251–3258. [Google Scholar] [CrossRef] [PubMed]
- Balasubramanian, S.; Neidle, S. G-quadruplex nucleic acids as therapeutic targets. Curr. Opin. Chem. Biol. 2009, 13, 345–353. [Google Scholar] [CrossRef] [PubMed]
- Brooks, T.A.; Kendrick, S.; Hurley, L. Making sense of G-quadruplex and i-motif functions in oncogene promoters. FEBS J. 2010, 277, 3459–3469. [Google Scholar] [CrossRef] [PubMed]
- Biffi, G.; Tannahill, D.; McCafferty, J.; Balasubramanian, S. Quantitative Visualization of DNA G-quadruplex Structures in Human Cells. Nat. Chem. 2013, 5, 182–186. [Google Scholar] [CrossRef] [PubMed]
- Bidzinska, J.; Cimino-Reale, G.; Zaffaroni, N.; Folini, M. G-quadruplex structures in the human genome as novel therapeutic targets. Molecules 2013, 18, 12368–12395. [Google Scholar] [CrossRef] [PubMed]
- Cosconati, S.; Rizzo, A.; Trotta, R.; Pagano, B.; Iachettini, S.; de Tito, S.; Lauri, I.; Fotticchia, I.; Giustiniano, M.; Marinelli, L.; et al. Shooting for Selective Druglike G-Quadruplex Binders: Evidence for Telomeric DNA Damage and Tumor Cell Death. J. Med. Chem. 2012, 55, 9785–9792. [Google Scholar] [CrossRef] [PubMed]
- Read, M.; Harrison, R.J.; Romagnoli, B.; Tanious, F.A.; Gowan, S.H.; Reszka, A.P.; Wilson, W.D.; Kelland, L.R.; Neidle, S. Structure-based design of selective and potent G quadruplex-mediated telomerase inhibitors. Proc. Natl. Acad. Sci. USA 2001, 98, 4844–4849. [Google Scholar] [CrossRef] [PubMed]
- Di Leva, F.S.; Zizza, P.; Cingolani, C.; D’Angelo, C.; Pagano, B.; Amato, J.; Salvati, E.; Sissi, C.; Pinato, O.; Marinelli, L.; et al. Exploring the Chemical Space of G-Quadruplex Binders: Discovery of a Novel Chemotype Targeting the Human Telomeric Sequence. J. Med. Chem. 2013, 56, 9646–9654. [Google Scholar] [CrossRef] [PubMed]
- Leonetti, C.; Amodei, S.; D’Angelo, C.; Rizzo, A.; Benassi, B.; Antonelli, A.; Elli, R.; Stevens, M.F.G.; D’Incalci, M.; Zupi, G.; et al. Biological Activity of the G-Quadruplex Ligand RHPS4 (3,11-Difluoro-6,8,13-trimethyl-8H-quino[4,3,2-kl]acridinium methosulfate) Is Associated with Telomere Capping Alteration. Mol. Pharmacol. 2004, 66, 1138–1146. [Google Scholar] [CrossRef] [PubMed]
- Young, R.C.; Ozols, R.F.; Myers, C.E. The Anthracycline Antineoplastic Drugs. N. Engl. J. Med. 1981, 305, 139–153. [Google Scholar] [CrossRef] [PubMed]
- Salvati, E.; Leonetti, C.; Rizzo, A.; Scarsella, M.; Mottolese, M.; Galati, R.; Sperduti, I.; Stevens, M.F.G.; D’Incalci, M.; Blasco, M.; et al. Telomere damage induced by the G-quadruplex ligand RHPS4 has an antitumor effect. J. Clin. Investig. 2007, 117, 3236–3247. [Google Scholar] [CrossRef] [PubMed]
- Bligh, E.G.; Dyer, W.J. A rapid method of total lipid extraction and purification. Can. J. Biochem. Physiol. 1959, 37, 911–917. [Google Scholar] [CrossRef] [PubMed]
- Savorani, F.; Tomasi, G.; Engelsen, S.B. icoshift: A versatile tool for the rapid alignment of 1D NMR spectra. J. Magn. Reson. 2010, 202, 190–202. [Google Scholar] [CrossRef] [PubMed]
- Eriksson, L.; Johansson, E.; Kettaneh-Wold, N.; Wold, S. Introduction to Multi- and Megavariate Data Anaysis Using Projection Methods (PCA & PLS); Umetrics: Umeå, Sweden, 1999. [Google Scholar]
- Hotelling, H. Analysis of a complex of statistical variables into principal components. J. Educ. Psychol. 1933, 24, 417–441. [Google Scholar] [CrossRef]
- Martens, H.A.; Dardenne, P. Validation and verification of regression in small data sets. Chemom. Intell. Lab. Syst. 1998, 44, 99–121. [Google Scholar] [CrossRef]
- Wishart, D.S.; Jewison, T.; Guo, A.C.; Wilson, M.; Knox, C.; Liu, Y.; Djoumbou, Y.; Mandal, R.; Aziat, F.; Dong, E.; et al. HMDB 3.0—The Human Metabolome Database in 2013. Nucleic Acids Res. 2013, 41, D801–D807. [Google Scholar] [CrossRef] [PubMed]
- Bertini, I.; Hu, X.; Luchinat, C. Global metabolomics characterization of bacteria: Pre-analytical treatments and profiling. Metabolomics 2014, 10, 241–249. [Google Scholar] [CrossRef]
- Duarte, I.F.; Marques, J.; Ladeirinha, A.F.; Rocha, C.; Lamego, I.; Calheiros, R.; Silva, T.M.; Marques, M.P.M.; Melo, J.B.; Carreira, I.M.; et al. Analytical Approaches toward Successful Human Cell Metabolome Studies by NMR Spectroscopy. Anal. Chem. 2009, 81, 5023–5032. [Google Scholar] [CrossRef] [PubMed]
- Wang, X.; Hu, M.; Feng, J.; Liu, M.; Hu, J. 1H NMR metabolomics study of metastatic melanoma in C57BL/6J mouse spleen. Metabolomics 2014, 10, 1129–1144. [Google Scholar] [CrossRef] [PubMed]
- Cloarec, O.; Dumas, M.-E.; Craig, A.; Barton, R.H.; Trygg, J.; Hudson, J.; Blancher, C.; Gauguier, D.; Lindon, J.C.; Holmes, E.; et al. Statistical Total Correlation Spectroscopy: An Exploratory Approach for Latent Biomarker Identification from Metabolic 1H NMR Data Sets. Anal. Chem. 2005, 77, 1282–1289. [Google Scholar] [CrossRef] [PubMed]
- Xia, J.; Psychogios, N.; Young, N.; Wishart, D.S. MetaboAnalyst: A web server for metabolomic data analysis and interpretation. Nucleic Acids Res. 2009, 37, W652–W660. [Google Scholar] [CrossRef] [PubMed]
- Martineau, E.; Tea, I.; Loaëc, G.; Giraudeau, P.; Akoka, S. Strategy for choosing extraction procedures for NMR-based metabolomic analysis of mammalian cells. Anal. Bioanal. Chem. 2011, 401, 2133–2142. [Google Scholar] [CrossRef] [PubMed]
- Wenzel, U.; Schoberl, K.; Lohner, K.; Daniel, H. Activation of mitochondrial lactate uptake by flavone induces apoptosis in human colon cancer cells. J. Cell. Physiol. 2005, 202, 379–390. [Google Scholar] [CrossRef] [PubMed]
- Cao, B.; Li, M.; Zha, W.; Zhao, Q.; Gu, R.; Liu, L.; Shi, J.; Zhou, J.; Zhou, F.; Wu, X.; et al. Metabolomic approach to evaluating adriamycin pharmacodynamics and resistance in breast cancer cells. Metabolomics 2013, 9, 960–973. [Google Scholar] [CrossRef] [PubMed]
- Krishnan, P.; Kruger, N.J.; Ratcliffe, R.G. Metabolic fingerprinting and profiling in plants using NMR. J. Exp. Bot. 2005, 56, 255–265. [Google Scholar] [CrossRef] [PubMed]
© 2016 by the authors; licensee MDPI, Basel, Switzerland. This article is an open access article distributed under the terms and conditions of the Creative Commons by Attribution (CC-BY) license (http://creativecommons.org/licenses/by/4.0/).
Share and Cite
Lauri, I.; Savorani, F.; Iaccarino, N.; Zizza, P.; Pavone, L.M.; Novellino, E.; Engelsen, S.B.; Randazzo, A. Development of an Optimized Protocol for NMR Metabolomics Studies of Human Colon Cancer Cell Lines and First Insight from Testing of the Protocol Using DNA G-Quadruplex Ligands as Novel Anti-Cancer Drugs. Metabolites 2016, 6, 4. https://doi.org/10.3390/metabo6010004
Lauri I, Savorani F, Iaccarino N, Zizza P, Pavone LM, Novellino E, Engelsen SB, Randazzo A. Development of an Optimized Protocol for NMR Metabolomics Studies of Human Colon Cancer Cell Lines and First Insight from Testing of the Protocol Using DNA G-Quadruplex Ligands as Novel Anti-Cancer Drugs. Metabolites. 2016; 6(1):4. https://doi.org/10.3390/metabo6010004
Chicago/Turabian StyleLauri, Ilaria, Francesco Savorani, Nunzia Iaccarino, Pasquale Zizza, Luigi Michele Pavone, Ettore Novellino, Søren Balling Engelsen, and Antonio Randazzo. 2016. "Development of an Optimized Protocol for NMR Metabolomics Studies of Human Colon Cancer Cell Lines and First Insight from Testing of the Protocol Using DNA G-Quadruplex Ligands as Novel Anti-Cancer Drugs" Metabolites 6, no. 1: 4. https://doi.org/10.3390/metabo6010004
APA StyleLauri, I., Savorani, F., Iaccarino, N., Zizza, P., Pavone, L. M., Novellino, E., Engelsen, S. B., & Randazzo, A. (2016). Development of an Optimized Protocol for NMR Metabolomics Studies of Human Colon Cancer Cell Lines and First Insight from Testing of the Protocol Using DNA G-Quadruplex Ligands as Novel Anti-Cancer Drugs. Metabolites, 6(1), 4. https://doi.org/10.3390/metabo6010004