Flexible and Scalable Software Defined Radio Based Testbed for Large Scale Body Movement
by
 and
and
Aboajeila Milad Ashleibta
1, 
Adnan Zahid
1,
Syed Aziz Shah
2,
Qammer H. Abbasi
1,* and
Muhammad Ali Imran
1 1
James Watt School of Engineering, University of Glasgow, Glasgow G12 8QQ, UK
2
Centre for Intelligent Healthcare, Coventry University, Coventry CV1 5FB, UK
*
Author to whom correspondence should be addressed.
Electronics 2020, 9(9), 1354; https://doi.org/10.3390/electronics9091354
Submission received: 22 July 2020
/
Revised: 12 August 2020
/
Accepted: 17 August 2020
/
Published: 20 August 2020
(This article belongs to the Special Issue Antennas for Wearable and Implantable Applications)
Abstract
:Human activity (HA) sensing is becoming one of the key component in future healthcare system. The prevailing detection techniques for IHA uses ambient sensors, cameras and wearable devices that primarily require strenuous deployment overheads and raise privacy concerns as well. This paper proposes a novel, non-invasive, easily-deployable, flexible and scalable test-bed for identifying large-scale body movements based on Software Defined Radios (SDRs). Two Universal Software Radio Peripheral (USRP) models, working as SDR based transceivers, are used to extract the Channel State Information (CSI) from continuous stream of multiple frequency subcarriers. The variances of amplitude information obtained from CSI data stream are used to infer daily life activities. Different machine learning algorithms namely K-Nearest Neighbour, Decision Tree, Discriminant Analysis and Naïve Bayes are used to evaluate the overall performance of the test-bed. The training, validation and testing processes are performed by considering the time-domain statistical features obtained from CSI data. The K-nearest neighbour outperformed all aforementioned classifiers, providing an accuracy of 89.73%. This preliminary non-invasive work will open a new direction for design of scalable framework for future healthcare systems.
1. Introduction
Human motion and activity detection have received considerable attention in recent years due to its applications in many emerging indoor environments such as healthcare systems, intrusion detection, search and rescue. Notable applications include monitoring patients, fall detection for elderly and physically challenged individuals [1]. Many human recognition systems have been introduced such as smart homes with human motion detection [2], and wearable acoustic sensors for detecting human behavior [3]. The non-invasive, non-contact channel state information (CSI)-based human activity detection using commercial Wi-Fi devices has been extensively used for detecting activities of daily living as it uses small wireless devices such as Wi-Fi router, a network interface card and off-the-shelf antennas operating at 2.4 GHz. Radar-based systems have also been used for tracking human presence by using frequency modulated continuous-wave (FMCW) and orthogonal frequency division multiplexing (OFDM) systems [4]. In addition, several other research works have demonstrated the detection of human motion based on wireless signals and exploitation of Wi-Fi signals as in [5].
In addition, Human Activity recognition based on Wi-Fi channel state information and Machine Learning has been presented in [6]. Another work provides a principle component analysis method that select the appropriate data from the CSI of wireless signal caused by human motion based on Wi-Fi router [7]. In addition, CSI extracted from human behaviour based on commodity Wi-Fi device is presented in [8]. The use of wireless CSI-based signal for activity detection system has provided several advantages, such as CSI can capture the small scale multipath propagation using OFDM over multiple sub-carriers, also it provides solutions and resolve the battery issues as compared to wearable sensing devices and also provide wider coverage areas as compared to cameras-based systems [9].
The CSI-based system has the capability to detect human behaviour through the walls and complex scenarios compared to the other traditional techniques. It is independent of lighting intensity and does not require carrying any wearable device on the human‘s body. This provided basis for CSI extracted from Wi-Fi signals to detect human presence in private places where, cameras systems cannot be used [10]. Hence, the CSI wireless technology has emerged as a ubiquitous solution for presence detection. Although prior studies offer adequate solution for the detection of human activities in an indoor settings using a Wi-Fi signal. However, the main limitation of extracted CSI data from off-the-shelf small wireless devices is the limitation of only 30 sub-carriers that are revealed. In addition, the data obtained are inconsistent, therefore affecting the overall performance of the system. The loss of OFDM sub-carriers sometimes loses valuable information.
The CSI data obtained using off-the-shelf wireless devices use low-cost Intel 5300 network interface card (NIC) that intrinsically reports only group of 30 data subcarriers. However, the total transmitted by Wi-Fi router is 56. In addition, single or multiple subcarriers carry particular information such as various body motions (i.e., sitting down, standing up, walking and so on). The subcarriers from 31 to 56 that are not revealed by NIC sometimes carry specific body motion. In addition, the frequency range, power level and operating frequency is fixed with NIC [11,12].
The research work done prior to this one used off-the-shelf wireless device such as Wi-Fi router (transmitter), network interface card (NIC) that presented numerous limitations. For instance, the transmitter used sent a group of 56 subcarriers, however the NIC only reported 30 subcarriers, nearly 46% of the information lost in this case. In addition, the power level of transmitter was not flexible and could not be modified according to particular human activity. The phase information retrieved through these small wireless devices was also inapplicable due to presence of random noise. In this work, we have used software-defined-radio model University Software Radio Peripherals (USRPs) by transmitting and receiving N number of multiple OFDM subcarriers as compared to its counterpart where limited numbers are available. The proposed system also allows us to modify the power level of transceiver model, change the operating frequency, use self-design antennas and change the number of subcarriers in real-time. The results obtained using USRP based wireless sensing for activities of daily living are highly accurate as compared to off-the-shelf wireless devices each time when activities and experiments are performed.
The main novelty of our work is the design of a flexible, scalable wireless sensing driven by USRP in conjunction with machine learning algorithm to detect human activities. This system can also be used to detect intricate body movements such as respiratory rate of a person by increasing the operating frequency, that enhances the range resolution.
This paper reports three major contributions which are summarized as follows.
- 1.
- The first one is development of a flexible and scalable transmitter and receiver model of Software Defined Radio Based test-bed that can transmit and received N number of multiple sub-carriers to extract wireless channel state information that carry information for activities of daily living. This system provides high level of accuracy for subtle changes in environment that are associated to different human activities.
- 2.
- The second one is development of a transceiver model on a software level which allows us to change the operating frequency, number of subcarriers, power level and antennas that modifies the range-resolution in real-time.
- 3.
- The third one is application of four machine learning algorithms and provide real time classification on the collected data for human activities and provide high classification accuracy for empirical results which can help in future to do proactive detection for health of subject.
The rest of the paper is organized as follows. We first review the related work in Section 2. In Section 3, the overview of design software defined radio based on human activity recognition is presented. In Section 4 the experimental setup and system parameters are described. In Section 5, we show the result and evaluate its performance. Finally Section 6 concludes the paper.
2. Related Work
This section provides comprehensive literature review on detection technique for human presence that has been sub-divided into three parts: Received Signal Strength Indicator system (RSSI), CSI based system and radar system respectively.
2.1. Received Signal Strength Indicator
The RSSI system has been used to recognize human movement recently. For instance, the work in [13] made use of RF-channel to design passive and active system for human activity detection based on the variations of RSSI signal caused by human motion. Similarly, the authors in [14] implemented a radio frequency signal based on USRP to recognize human activity from non-cooperative subjects to track human movement such as, walking, lying, crawling and standing actions and achieved high accuracy rate. In [15], the Wi-Fi-based system was designed for detecting human hand motion and address the effect of some hand motion gestures surrounded by the vicinity of the receiver based on the RSSI values and the average achieved accuracy in this system was 96%. However, RSSI based systems have limited accuracy due to the effect of environment changes on the received signal that may leads to false detection, although some approaches used Software Defined Radios (SDR) to increase the detection accuracy but still less than CARM which is present in CSI based activity recognition schemes.
2.2. Channel State Information
Several researchers have focused on different approaches and technologies for human activity detection based on CSI signal. This sub-section reviews existing literature available on CSI Wi-Fi to recognize human activity in an indoor environment recently, such as the work done in [16] which was able to extract the CSI based on Wi-Fi signal in home and present the Doppler shift of human motion in the Wi-Fi coverage area. In [17], the CSI based on Wi-Fi signals recognizes human behaviour in two different locations and address the effect of the environment on the received signal to introduce the change in CSI of human motion detection. In addition, the author in [18] presented the estimation of human’s walking direction based on Wi-Fi channel state information in an indoor environment.
The research work published in [19] have presented human detection using non-linear techniques to extract CSI by examining the amounts of non-linear correlations between subcarriers. The work of [20] made use spatial diversity based on Wi-Fi to extract the CSI of human present in the dead zone. Some authors have also considered CSI based Wi-Fi signal in fall detection areas. Therefore, Wi-Fi fall detection accomplished acceptable performance recently, such as in [21], providing deep fall detection using Wi-Fi spectrograms that present the propagation of Wi-Fi CSI signal based on the variations of human through different places of the environment. In addition, in [22], Wi-Fi multi-stage and CSI have been presented fall detection to distinguish falling action and sitting action. However, CSI-based human activity recognition HAR is still in its growing stages and needs more improvement. Besides, CSI based on Wi-Fi signal to recognise human movement exploiting low-cost small wireless devices such as Wi-Fi router, network interface card. The main limitation of using these devices is the scalability, flexibility and under-reporting all group of subcarriers. On the other hand, in our system, the operating frequency, power-level of number of subcarriers are flexible and can be changed in real-time. Besides, the multiple parameter values are tested due to the software flexibility that can be used for multiple applications and wireless standards as shown in Table 1 and Table 2. in the manuscript. For instance, our system used N number of multiple subcarriers (64, 128, 256, 512, 1024 and 2048) contrary to human activity recognition systems rely on off-the-shelf devices such as Wi-Fi router, network interface card, limited number of frequency subcarriers. In addition, the gain can be increased to covered long distance detection area once we used antenna with high gain.We have used Universal Software Radio Peripheral (USRP) where the hardware can be controlled over the software and the ease in implementation of signal processing algorithms and the ability to reuse hardware encourages researchers to choose Universal Software Radio Peripheral (USRP) for their applications.
2.3. Radar Based System
The radar system provides adequate knowledge to analyze human motion detection and has been widely used for human activity recognition in recent years. For example, the work in [23] presented a radar signal for human gait detection. The system designed a feature mechanism to extract six features from human behavior signature using Short Time Fast Fourier Transform (STFT). Furthermore, other studies [24] have provided human detection based on Doppler radar signal to identify the human subjects using a physical characteristic of target. Besides, the work presented in [25] provide radar system operated at 60 Ghz frequency and have limited coverage area due to the smaller wavelength. However, technologies such as Doppler radar and frequency modulated carrier wave FMCW having higher distance resolution and bandwidth of about 1.79 Ghz. [26]. whereas, Wi-Fi system having only bandwidth of 20 Mhz. [27]. hence recognion systems based on Radar are reliable but expensive.
3. System Overview
In this section, Figure 1 shows the block diagram of the MATLAB Simulink model, also we discuss the working principle of generating the channel sensing model using Universal Software Radio Peripheral Platform (USRP).
3.1. Transmission of Multiple Frequency Carrier
Initially, the transmitter model based on OFDM transmitting multiple subcarriers was designed using MATLAB/Simulink in the host computer to generate the transmitted data through the USRP, and transmitting it using an omni directional antenna. This antenna operated to work in the frequency range from 2.4–2.5 GHz to 4.9–5.9 GHz and 3 dB gain. In addition, it is highly recommended for USRP X300/310. Furthermore, directional antennas and Yagi antennas have also been tested on our system and provide similar results. The key advantage of using omni-directional antennas is that it can detect human activities in line-of-sight and non-line-of-sight. After that the generated random bits are sampled and obtained by the signal from the workspace at successive sample times, the random bits have 0.75 probability. Then these bits are converted into symbols and can be mapped using any modulation scheme due to the software flexibility to constitute symbols of source data. These source data symbols are in complex domain. They contain modulation constellation points. During designing the Simulink, we tested basic quadrature phase shift keying (QPSK) transmitter and receiver examples with Simulink and it worked properly. Besides, the performance of QPSK is better than QAM. Consequently, we use QPSK modulation scheme on our own software defined Simulink model. Furthermore, the 4 QAM modulation scheme is tested and works properly with our Simulink design. Next, the quadrature phase shift keying QPSK modulation scheme is used to convert the bits into symbols, every two bits is one symbol and mapped into phase shift format, two bits can also be used to define four possible values. Therefore, one QPSK symbol carries the equivalent of two bits of information. Once the modulation is done, these symbols will link to a single subcarrier system.
Then, they are transferred to serial to parallel converter. Inverse Fast Fourier Transform IFFT is carried out because QPSK symbols are viewed as if they are in the frequency domain and hence IFF block convert them to the time domain. Inter-symbol interference (ISI) always occurs in the OFDM system. This can be removed by appending a cyclic prefix in the guard interval of an OFDM symbol where guard period added at the start of each symbol to avoid multipath propagation of the reflected transmitted signal caused by physical objects. In our system design, we tested the bit error rate (BER) for communication reliability. Whereas, BER is the most significant parameter to analyze the performance of the system of any reliable communication. Figure 2 shows the BER performance analysis of different digital modulation schemes. It can be seen from the figure that the performance of BER improved when the value of SNR increased. For instance, if we compare BER amoung BPSK, QPSK and 16 QAM then at SNR 10, BER for BPSK is 0 but for QPSK is and QAM is . In addition, at SNR 15, QPSK is 0 and QAM is . Therefore, QPSK performs better than QAM. This verified the design of the system. then the signal is up-converted through Digital-to-Analog Converter (DAC) which is used in USRP devices, and transmitted wirelessly through the USRP antenna.
The designed system was deemed additive white Gaussian noise channel in a laboratory environment. For simplicity in this paper the most commonly used additive white Gaussian noise channel in determining the most appropriate modulation type, modulation order and comparison between the different encoding schemes [28].
However, this model does not account fading, interference, non-linearity or dispersion [29].
3.2. Reception of Multiple Frequency Carrier
On the receiver side, USRP X310 is fitted with omni-directional antenna to receive the signal and then analyzes Analogue to Digital Conversion (ADC) of the received signal. This is then converted down to the base-band and passed through a low pass filter to remove the effect of high-frequency terms. Additionally, the carrier tone is removed at the mixer of the USRP. This operation applied at the receiver of the USRP. Besides, OFDM bits are normally sorted into frames so that the received signal needs to be synchronized in time and frequency to obtain the start of the OFDM symbol. In addition, the cyclic prefix is eliminated from each symbol and then Fast Fourier Transform (FFT) is performed to recover the signal from the time domain to the frequency domain. After that data are converted to parallel through a serial to parallel converter to obtain the original signal.
3.3. Data Collection and Standardization
In this experiment, USRP was utilized to collect the CSI signal, whereas the CSI represents the properties of the channel in a wireless communication system. It is explaining how the signal transmits in free space comprises the amplitude and phase of each subcarrier in the OFDM channel. Figure 3 present the flowchart of data collection in this experiment. The CSI signal can be represented using the following Equation (1) [30].
where, H( ) refers to the amplitude information of CSI, and ∠H( ) describes the phase of CSI.
The system collects N of CSI packets and the measured OFDM subcarrier can be represented as follows in [30].
In our design, the amplitude and phase of channel frequency response (CFR) are measured by IFFT at the transmitter process and FFT at the receiver operation. Channel response measurements of our system are illustrated in Equation (3) [31].
where H(f) represent the channel response of the system, X(f) is the transmitted signal frequency response Y(f) refers to the received signal frequency response.
4. Experimental Setup and System Parameters
In this section, we evaluate the performance of the proposed system as follows: (I) data collection using two USRP models. (II) Data analysis using Machine Learning model. The transmitter and receiver involved two Universal Software Radio Peripheral equipments (USRPs) X310/X300 from a national instrument (NI), each equipped with extended-bandwidth daughterboard slots covering DC–6 GHz with up to 120 MHz of baseband bandwidth. The USRP X300 worked as a transmitter and USRP X310 performed as a receiver. The system had two PCs to run the initial trial. Both USRPs were connected to the PCs through a 1 G ethernet cable. Furthermore, the experimental hardware comprised of two omni directional antennas, VERT2450 that were driven by the USRPs. The simulated transceiver model was designed using MATLAB/Simulink program linked to the software-defined radio.
The experimental campaign was undertaken in a lab environment in James Watt South Building, University of Glasgow where volunteers with different age range took part. The core idea is to lay foundation and develop a proof-of-concept prototype that can continuously monitor activities of daily living for elderly people. The trials were performed in a control environment where an individual was monitored for various activities. For future work, we will increase complexity of the data collection by monitoring multiple people simultaneously, increase other movements in the surrounding and so on. The distance between the USRPs was kept as 4 m in line of sight (LOS), in order to achieve optimum performance. Ethical approvals have been acquired through university of Glasgow ethic review committee. The volunteer was asked to perform five different human activities in the area of interest. The subject going under various activities were: (a) walking (b) sitting on a chair (c) standing from a chair, (d) doing exercise and (e) bending down to pick up an object from the ground. Each volunteer was asked to repeat the aforementioned activities 10 times. The test was performed in a 7 by 8 m room having furniture such as tables, chairs, etc. Machine Learning algorithms such as K-Nearest Neighbour (KNN), Discriminant Analysis (DA), Naive Bayes (NB) and Decision Tree (DT) were applied to process and classify the collected data. The experimental setup is shown in Figure 4.
We performed the experiment in laboratory settings using healthy volunteers and asked them to perform different activities under test. We repeated the experimental campaign multiple times and each time almost identical results were obtained. Due to ethical approval issues outside university environment i.e., on actual patients and elderly people, we only undertook the experimental campaign in a controlled setting. For future work, our aim is to make this system more generalize, acquiring data in elderly care centres or hospitals in different geometrical settings. The CSI at heterogenous environments varies also, we will develop an algorithm for calibration in future work that in independent of geometrical structure.
We performed our experiments with varying parameters to evaluate the performance of the system. Table 1 lists the parameters which were used in the designed software. The USRPs used in the study had a frequency range from 1 GHz to 10 GHz. Center frequency for both USRPs was set to 5.32 GHz and the operational frequency of omni directional antenna was the same as well, with 3 dBi gain. The gain of USRP was chosen to be 70 for transmitter and 50 for the receiver. The parameters values were used to test the software are summarized in Table 1.
Table 2 displays the hardware configuration parameters for both transmitter and receiver.
5. Results and Discussion
This section addresses the findings of a comprehensive experimental campaign conducted using the proposed SDR-based human activity recognition system.
Five different activities were considered in this experiment, including walking, sitting on the chair, standing up from a chair, bending down and exercising. When the data were recorded, multiple factors were taken into account. Factors of the environment such as physical objects: chairs, tables, computers and people could affect the wireless received signal or led to attenuation of the collected signal. It could also cause false detection while testing the activity of the human. To address this issue, firstly, we tested our hardware devices with a simple MATLAB simulink QPSK example on the MATLAB simulink software such as QPSK transmitter and receiver with USRP to standardize and configure hardware parameters of the system. After ensuring that the system could receive an RF signal successfully, we then applied the actual Simulink design of our system.
The results divided into two cases: with and without human activity. In the first case: Figure 5 shows the result when no activity was performed between the transmitter and receiver, as can be seen from the figure that the amplitude of the received signal remains constant ensuring no changes occurred between the transmitter and receiver antenna. The procedure of this case was repeated several times with no amplitude variations observed. The time duration of this case was 10 s and the number of transmitted packets in this trial was 10,000. We received only 8063 packets out of 10,000. A total of 10 repetitions were performed and the same number of packets were obtained. In addition, the packet index represents the number of subcarriers of the OFDM signal. The amplitude and time duration of this signal can be seen clearly in Figure 5.
In case 2, one volunteer performed the five activities. Figure 6 illustrates the changes in amplitude when a person is walking. The motion of hands and legs affected the amplitude of the received signal. The variation in amplitude of the collected signal was prominent compared to the original signal as depicted in Figure 5. The time duration, in this case, was increased to 20 s. It is a suitable time duration to achieve an adequate performance of the behaviour and to observe amplitude variation because once the time duration increases, it needed more real-time data processing for a large number of packets. In addition, for a 20 s time duration, we received 17,640 packets out of 20,000 transmitted packets for each performed activity. Figure 7 demonstrates the results for the case of sitting on the chair. The chair was located between the USRP transmitter and receiver. In addition, the distance among the USRPs and chair was kept as 2 m. After transmitting the signal, the person commenced sitting on the chair. Therefore, we can observe only small changes in the amplitude of the received signal and drop down according to the sitting actions based on the type of human motion. We noticed the amplitude only changed during the action after that, it remained constant.The time duration in this activity was 20 s and contained the similar number of transmitted and received packets. Figure 8 presents results for the standing up from chair activity. This action was opposite to the previous activity, when the person started to stand up from the chair, the amplitude of the received signal changed based on the movement and started going up according to human action. The time duration of this activity was 20 s as well.
Besides, the transmitted and received packets were equivalent to the number of packets in the previous activities which, was 20,000 transmitted packets and 17,640 received packets. Figure 9 helps in explaining walking and bending down activity. From this figure, we can observe amplitude variation in the beginning and then reduced variation based on walking and bending down movement. The time duration of this activity was the same as previous sitting and standing activities including the similar number of transmitted and received packets. Figure 10 illustrates the variation in amplitude depending on the exercise activity, where different exercises have implemented between USRPs. In addition, the time duration and number of packets sent and received were the same as previously observed.
We can see in the Figure 6, Figure 7, Figure 8, Figure 9 and Figure 10 that the variances of amplitude had distinct variation depending on the performance compared with the original waveform and most changes in the amplitudes occurred in walking activity compared to the other behaviors’ waveforms and the original signal. Figure 6, Figure 7, Figure 8, Figure 9 and Figure 10 shows the performed activity and amplitude changed for each action. All these activities were repeated 10 times and every time we noticed distinguished amplitude variation.
This change of amplitude represents the human information behaviour and confirms that different human actions implemented between the transmitter and receiver system. Furthermore, Machine Learning algorithms were applied to process and classify the five activities and evaluate the overall performance of the system.
Machine Learning Classification
This section provided details on the discussion of machine learning algorithms used to classify various human activities and present the performance of proposed system based on percentage accuracy. The four algorithms used were K-Nearest Neighbor (KNN), Discriminant Analysis (DA), Naive Bayes (NB) and Decision Tree (DT). The machine learning algorithms were run using the following parameters. KNN is configured using 3 K samples using the Euclidean distance. Discriminant Analysis was configured as linear. Naïve Bayes used the normal distribution method. The Decision Tree algorithm was set up to use 50 splits in the decision tree. The data collected using USRP transceiver model showed the variations of amplitude information against 64 subcarriers. The amplitude information against each human activity as shown in Figure 5, Figure 6, Figure 7, Figure 8, Figure 9 and Figure 10 were visually different from each other. We used raw CSI amplitude information as input for all machine learning classifier used and obtained compared results of each classifier, where KNN algorithm provided the best classification accuracy.
We have used MATLAB tool to process the USRP data and apply different machine learning algorithms. The paramaters and configurations for each algorithms are as: The KNN algorithm used k = 2, standardization = 1, and distance function, Euclidean .
The decision tree algorithm performed classification based using two predictors, ×1 and ×2. To classify and do prediction, it started at the top node, represented by a triangle △.
The first decision was whether ×1 less than the value of 0.5. If it was smaller than the specific value, it followed the branch on left side, and identified the particular tree that classified the data as type 0. When the value of ×1 increased from 0.5, it then followed the right branch of the tree to the lower-right triangle node.
The discriminant analysis algorithm used mean for unweighted data as , the value for k was selected as 1 in this case. The Naïve Bayes algorithms estimated each class for all activity by assuming equiprobable classes by computing an approximation for the class probability from the training set. Table 3 details the used parameters for KNN and DT classifiers in this experiment.
The KNN algorithm was used to classify five activities, that provided the optimum results with 10-fold cross-validation leaving one subject out for validation. A total of 755,630 samples were processed for all activities. For the activity exercise, 270,089 samples were classified correctly while a total of 24,423 exercise samples were misclassified as the other activities. The break down of the 24,423 misclassified samples was 13,337 samples classified as picking up an object, 5074 samples classified as sitting down, 2577 samples classified as standing up and 3435 samples classified as walking. These numbers can be seen in the above confusion matrix Figure 11. It also reveals how the other activities were considered for classification, with a blue representing the correct classification and the other boxes were identified as spurious observations and marked as incorrectly classified.
It can be seen from the Figure 11 that most of the samples were correctly classified. The overall percentage accuracy using KNN classifier was obtained as 89.73%. Compared to the KNN classifier, the efficiency of the DT algorithm classifier was found to be unsatisfactory providing a total accuracy of 81.20%. For the first activity, there were 272,088 classified correctly. A large chunk of the obtained data, 160 samples were identified as picking up object activity (false negative) and so on with most false negatives being classified as standing up 13,813 as shown in the above confusion matrix in Figure 12. Similarly, most of the sample was successfully classified in the KNN classifier, providing an accuracy of approximately 81.20%. The other algorithms tested were discriminant analysis and Naïve Bayes which produced poor results compared to KNN and the decision tree algorithms with an accuracy of 49.21% for discriminant analysis and 23.28% for Naïve Bayes. Table 4 shows the accuracy comparison for different classifiers.
6. Conclusions
In this paper, we proposed a flexible and scalable non-invasive wireless sensing system to detect activities of daily living using software defined radios. The core idea involved the analysis of channel state information using two USRPs platforms. The variances of amplitude information induced a unique imprint for each human activity including walking back and forth, sitting on a chair, standing up from a chair and doing exercise. All these activities were performed in a lab environment in the presence of furniture and involved volunteers. Compared with the CSI systems that extracted from off-the-shelf wireless devices, our system based on the USRP platform allows to modify the number of frequency carriers, change the transmitted and received power and the operating frequency swing can be altered as well. Different Machine Learning algorithms were applied on the CSI data collected where percentage accuracy was used as performance metric. The KNN classifier presented the best classification accuracy of more than 89% among all four algorithms used.
Author Contributions
Conceptualization, A.M.A., A.Z., S.A.S., Q.H.A. and M.A.I.; methodology, A.M.A. and S.A.S.; software, A.M.A. and S.A.S.; validation, A.M.A. and S.A.S.; formal analysis, A.M.A.; investigation, A.M.A. and S.A.S.; resources, writing, review and editing, A.M.A., A.Z., S.A.S., Q.H.A. and M.A.I.; funding acquisition, Q.H.A. and M.A.I. All authors have read and agreed to the published version of the manuscript.
Funding
Abo studentship is funded by Libyan Government. This work is supported in parts by EPSRC EP/T021020/1 and EP/T021063/1.
Conflicts of Interest
The authors declare no conflict of interest.
References
- Woznowski, P.; Burrows, A.; Diethe, T.; Fafoutis, X.; Hall, J.; Hannuna, S.; Camplani, M.; Twomey, N.; Kozlowski, M.; Tan, B.; et al. Sphere: A sensor platform for healthcare in a residential environment. In Designing, Developing, and Facilitating Smart Cities: Urban Design to IoT Solutions; Angelakis, V., Tragos, E., Pöhls, H.C., Eds.; Springer International Publishing: Cham, Switzerland, 2017; pp. 315–333. [Google Scholar]
- Pu, Q.; Gupta, S.; Gollakota, S.; Patel, S. Whole home gesture recognition using wireless signals. In Proceedings of the 19th Annual International Conference on Mobile Computing & Networking, Miami, FL, USA, 30 September–4 October 2013; pp. 27–38. [Google Scholar]
- Yatani, K.; Truong, K.N. Bodyscope: A wearable acoustic sensor for activity recognition. In Proceedings of the 2012 ACM Conference on Ubiquitous Computing, Pittsburgh, PA, USA, 5–8 September 2012; pp. 341–350. [Google Scholar]
- Narayanan, R.M.; Shastry, M.C.; Chen, P.H.; Levi, M. Through-the-wall detection of stationary human targets using Doppler radar. Prog. Electromagn. Res. B 2010, 20, 147–166. [Google Scholar] [CrossRef] [Green Version]
- Wang, Y.; Liu, J.; Chen, Y.; Gruteser, M.; Yang, J.; Liu, H. E-eyes: Device-free location-oriented activity identification using fine-grained WiFi signatures. In Proceedings of the 20th Annual International Conference on Mobile Computing and Networking, Maui, HI, USA, 7–11 September 2014; pp. 617–628. [Google Scholar]
- Kim, S.; Kim, T.G.; Kim, S.H. Human Activity Recognition and Prediction Based on Wi-Fi Channel State Information and Machine Learning. In Proceedings of the 2019 International Conference on Artificial Intelligence in Information and Communication (ICAIIC), Okinawa, Japan, 11–13 February 2019. [Google Scholar]
- Fangmin, L.; Al-qaness, M.A.A.; Zhang, Y.; Zhao, B.; Luan, X. A Robust and Device-Free System for the Recognition and Classification of Elderly Activities. Sensors 2016, 16, 2043. [Google Scholar]
- Palipana, S.; Rojas, D.; Agrawal, P.; Pesch, D. Falldefi: Ubiquitous fall detection using commodity wi-fi devices. In Proceedings of the ACM on Interactive, Mobile, Wearable and Ubiquitous Technologies, Cork, Ireland, 1 December 2017; Volume 1, pp. 1–25. [Google Scholar]
- Zhang, J.; Wei, B.; Hu, W.; Kanhere, S.S.; Tan, A. Human identification using WiFi signal. In Proceedings of the 2016 IEEE International Conference on Pervasive Computing and Communication Workshops (PerCom Workshops), Sydney, NSW, Australia, 14–18 March 2016. [Google Scholar]
- Liu, J.; Wang, L.; Guo, L.; Fang, J.; Lu, B.; Zhou, W. A research on CSI-based human motion detection in complex scenarios. In Proceedings of the 2017 IEEE 19th International Conference on e-Health Networking, Applications and Services (Healthcom), Dalian, China, 12–15 October 2017. [Google Scholar]
- SShah, S.A.; Ren, A.; Fan, D.; Zhang, Z.; Zhao, N.; Yang, X.; Luo, M.; Wang, W.; Hu, F.; Rehman, M.U.; et al. Internet of Things for Sensing: A Case Study in the Healthcare System. Appl. Sci. 2018, 8, 508. [Google Scholar] [CrossRef] [Green Version]
- Shah, S.A.; Fioranelli, F. RF Sensing Technologies for Assisted Daily Living in Healthcare: A Comprehensive Review. IEEE Aerosp. Electron. Syst. Mag. 2019, 34, 26–44. [Google Scholar] [CrossRef] [Green Version]
- Sigg, S.; Shi, S.; Buesching, F.; Ji, Y.; Wolf, L. Leveraging RF-channel fluctuation for activity recognition: Active and passive systems, continuous and RSSI-based signal features. In Proceedings of the International Conference on Advances in Mobile Computing & Multimedia, Vienna, Austria, 2–4 December 2013; pp. 1–43. [Google Scholar]
- Sigg, S.; Scholz, M.; Shi, S.; Ji, Y.; Beigl, M. Rf Sensing of Activities from Non-Cooperative Subjects in Device-Free Recognition Systems Using Ambient and Local Signals. IEEE Trans. Mob. Comput. 2014, 13, 907–920. [Google Scholar] [CrossRef]
- He, W.; Wu, K.; Zou, Y.; Ming, Z. WiG: WiFibased Gesture Recognition System. In Proceedings of the International Conference on Computer Communications and Networks, ICCCN, Las Vegas, NV, USA, 3–6 August 2005. [Google Scholar] [CrossRef]
- Tan, B.; Chen, Q.; Chetty, K.; Woodbridge, K.; Li, W.; Piechocki, R. Exploiting WiFi Channel State Information for Residential Healthcare Informatics. IEEE Commun. Mag. 2018, 56, 130–137. [Google Scholar] [CrossRef] [Green Version]
- Lee, H.; Ahn, C.R.; Choi, N.; Kim, T.; Lee, H. The Effects of Housing Environments on the Performance of Activity-Recognition Systems Using Wi-Fi Channel State Information: An Exploratory Study. Sensors 2019, 19, 983. [Google Scholar] [CrossRef] [PubMed] [Green Version]
- Dan, W.; Zhang, D.; Xu, C.; Wang, Y.; Wang, H. WiDir: Walking direction estimation using wireless signals. In Proceedings of the 2016 ACM International Joint Conference on Pervasive and Ubiquitous Computing, Heidelberg, Germany, 12–16 September 2016. [Google Scholar]
- Palipana, S.; Agrawal, P.; Pesch, D. Channel State Information Based Human Presence Detection using Non-linear Techniques. In Proceedings of the 3rd ACM International Conference on Systems for Energy-Efficient Built Environments, Palo Alto, CA, USA, 16–17 November 2016. [Google Scholar]
- Wang, F.; Gong, W.; Liu, J. On Spatial Diversity in WiFi-based Human Activity Recognition: A Deep Learning based Approach. IEEE Internet Things J. 2018, 6, 2035–2047. [Google Scholar] [CrossRef]
- Tahmid Chowdhury, Z. Using Wi-Fi Channel State Information (CSI) for Human Activity Recognition and Fall Detection. Ph.D. Thesis, University of British Columbia, Vancouver, BC, Canada, 2018. [Google Scholar]
- Yang, X.; Xiong, F.; Shao, Y.; Niu, Q. WmFall: WiFi-based multistage fall detection with channel state information. Int. J. Distrib. Sens. Netw. 2018. [Google Scholar] [CrossRef]
- Alzogaiby, A. Using Micro-Doppler Radar Signals for Human Gait Detection (Master of Science). Ph.D. Thesis, University of Stellenbosch, Stellenbosch, South Africa, 2013. [Google Scholar]
- Kim, Y.; Ha, S.; Kwon, J. Human Detection Using Doppler Radar Based on Physical Characteristics of Targets. IEEE Geosci. Remote Sens. Lett. 2014, 12, 289–293. [Google Scholar] [CrossRef]
- Lien, J.; Gillian, N.; Karagozler, M.E.; Amihood, P.; Schwesig, C.; Olson, E.; Raja, H.; Poupyrev, I. Soli: Ubiquitous gesture sensing with millimeter wave radar. ACM Trans. Graph. 2016, 35, 142. [Google Scholar] [CrossRef] [Green Version]
- Adib, F.; Kabelac, Z.; Katabi, D. Multi-person motion tracking via RF body reflections. In Proceedings of the USENIX NSDI, Oakland, CA, USA, 4–6 May 2015; pp. 1–16. [Google Scholar]
- Adib, F.; Kabelac, Z.; Katabi, D.; Miller, R.C. 3D tracking via body radio reflections. In Proceedings of the USENIX NSDI, Lombard, IL, USA, 2–5 April 2013; pp. 317–329. [Google Scholar]
- Karimian, N. Design and Analysis of OFDM System for Powerline Based Communication. Ph.D. Thesis, University of Central Lancashire, Preston, UK, 2011. [Google Scholar]
- Devi, R.; Nishat, H. Performance Evaluation of Digital Modulation Schemes BPSK, QPSK QAM. Int. J. Eng. Tech. 2017, 3, 71–74. [Google Scholar]
- Yang, X.; Shah, S.A.; Ren, A.; Zhao, N.; Zhang, Z.; Fan, D.; Zhao, J.; Wang, W.; Ur-Rehman, M. Freezing of gait detection considering leaky wave cable. IEEE Trans. Antennas Propag. 2019, 67, 554–561. [Google Scholar] [CrossRef]
- Khan, M.B.; Yang, X.; Ren, A.; Al-Hababi, M.A.M.; Zhao, N.; Guan, L.; Fan, D.; Shah, S.A. Design of software defined radios based platform for activity recognition. IEEE Access 2019, 7, 31083–31088. [Google Scholar] [CrossRef]
Figure 1.
Simplified orthogonal frequency division multiplexing (OFDM) Simulink model using quadrature phase shift keying (QPSK).
Figure 1.
Simplified orthogonal frequency division multiplexing (OFDM) Simulink model using quadrature phase shift keying (QPSK).
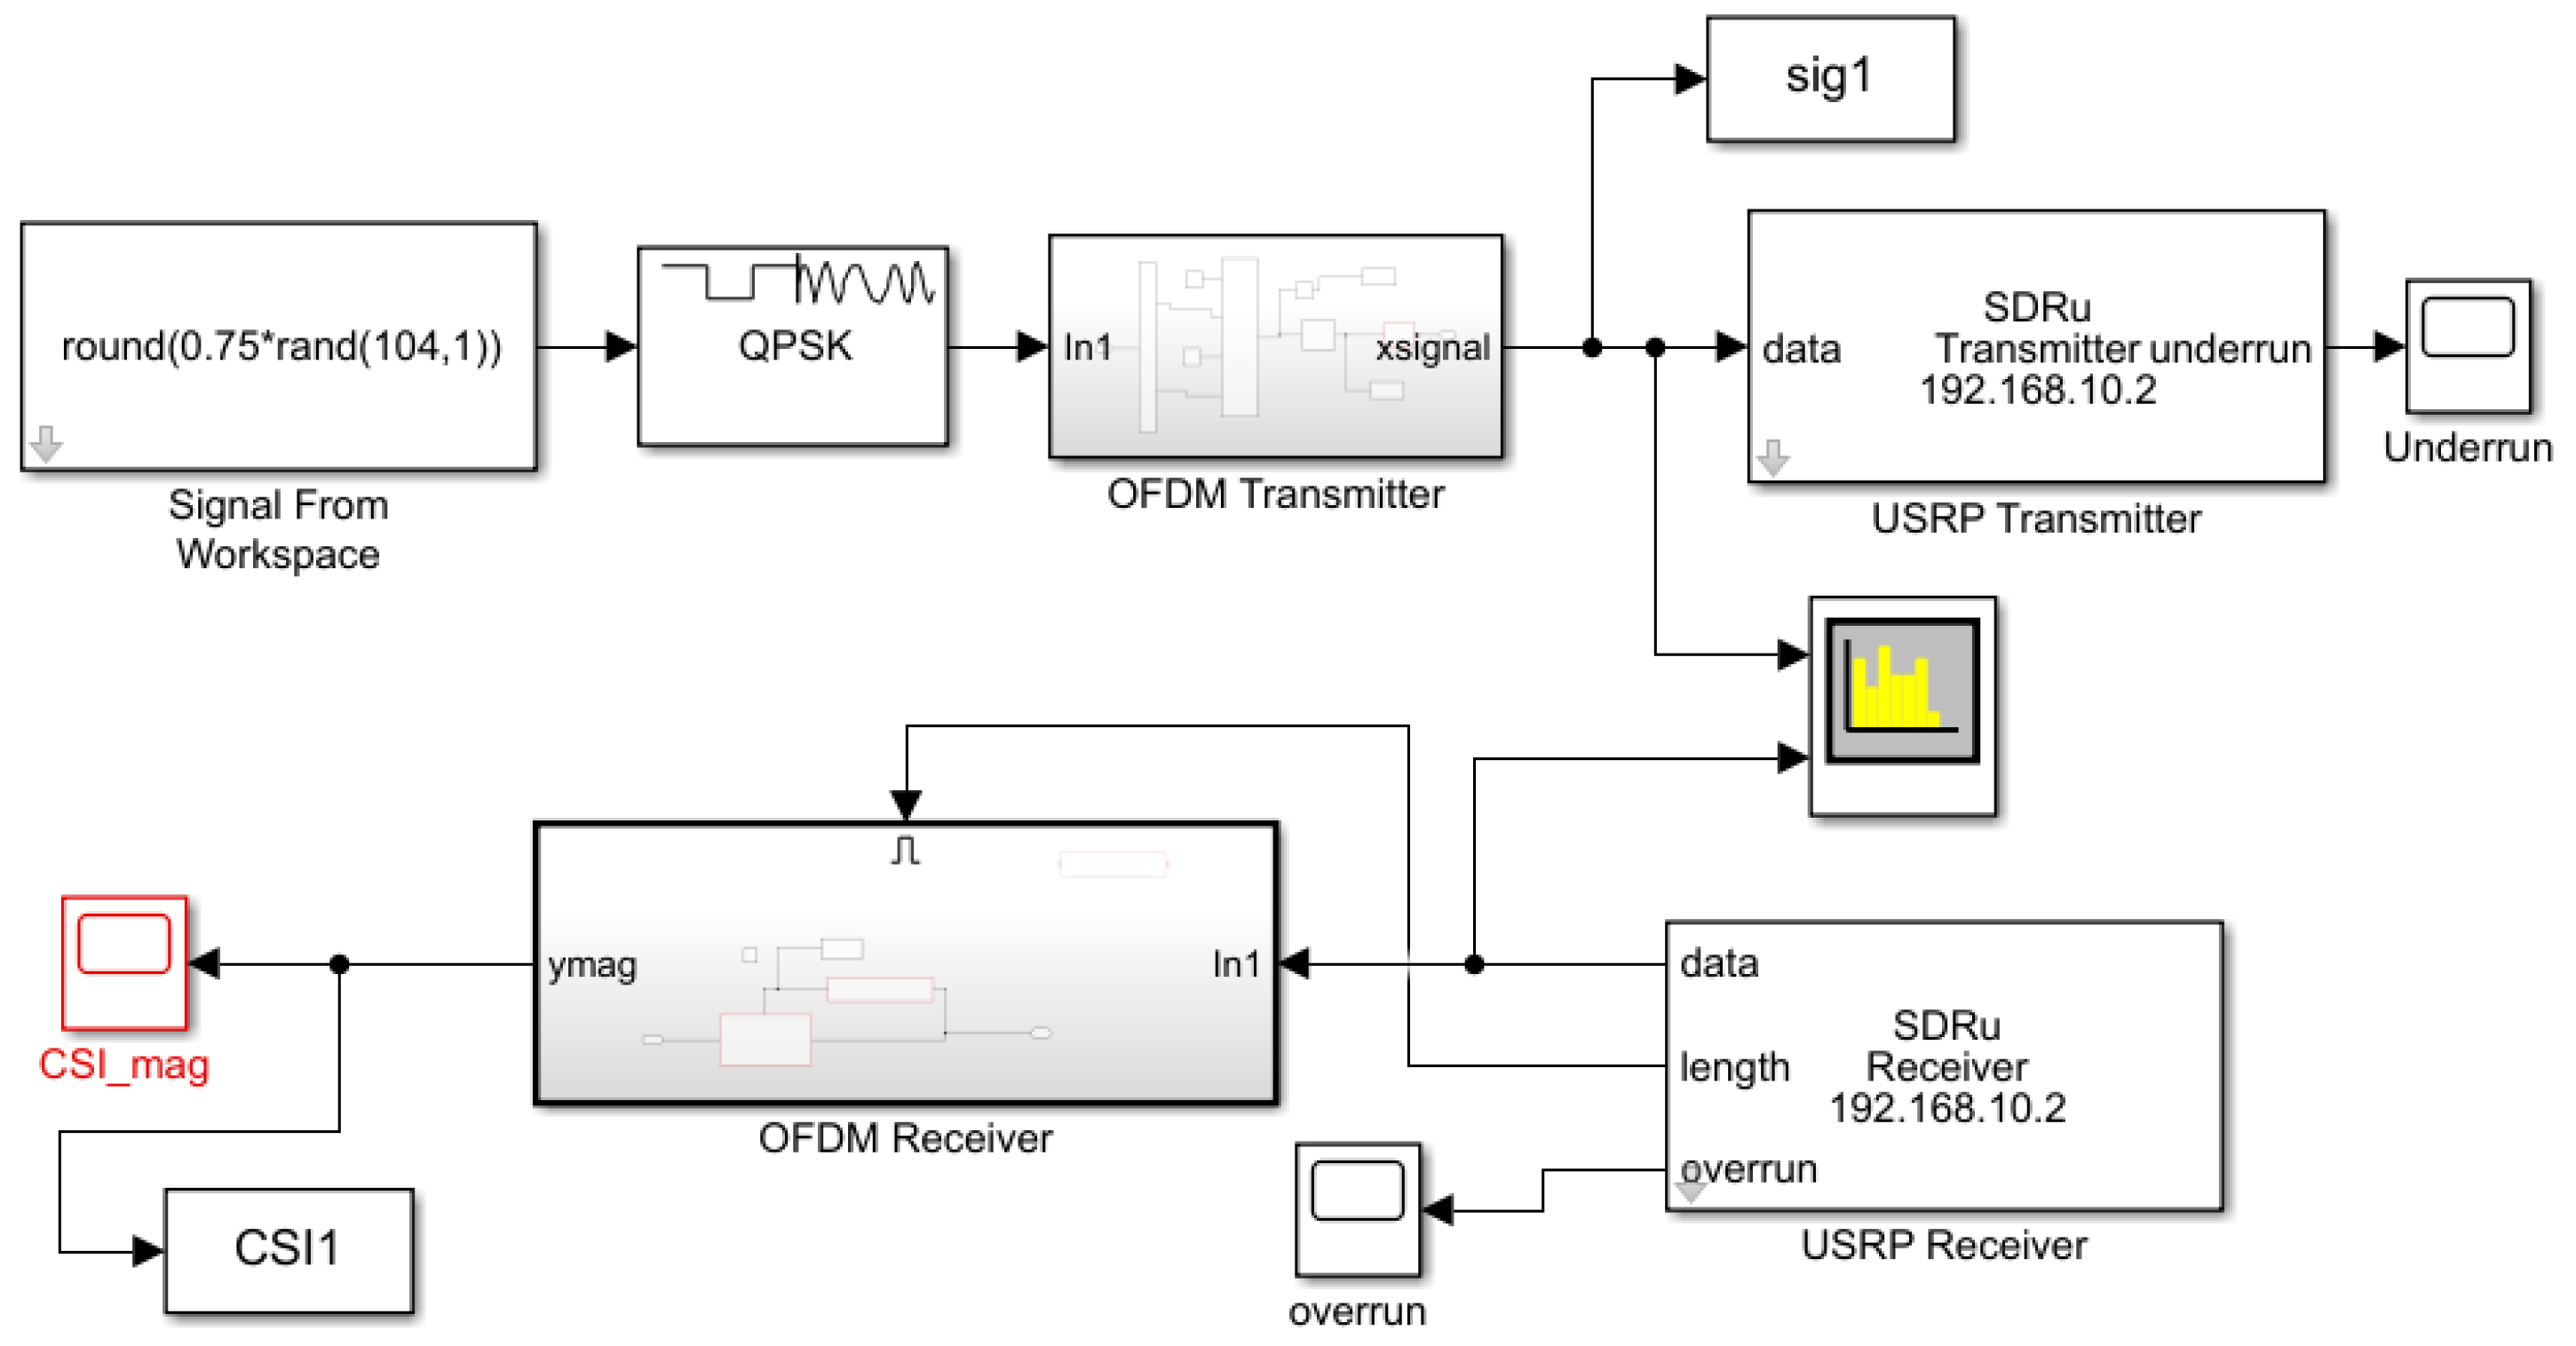
Figure 2.
Simulated BER analysis of OFDM system.

Figure 3.
Flowchart of the system.

Figure 4.
Schematic depiction of experimental setup along with pictorial representation of five different activities classified and actual snapshot of lab environment.
Figure 4.
Schematic depiction of experimental setup along with pictorial representation of five different activities classified and actual snapshot of lab environment.

Figure 5.
Wireless channel state information without any activity.

Figure 6.
Wireless channel state information during walking.
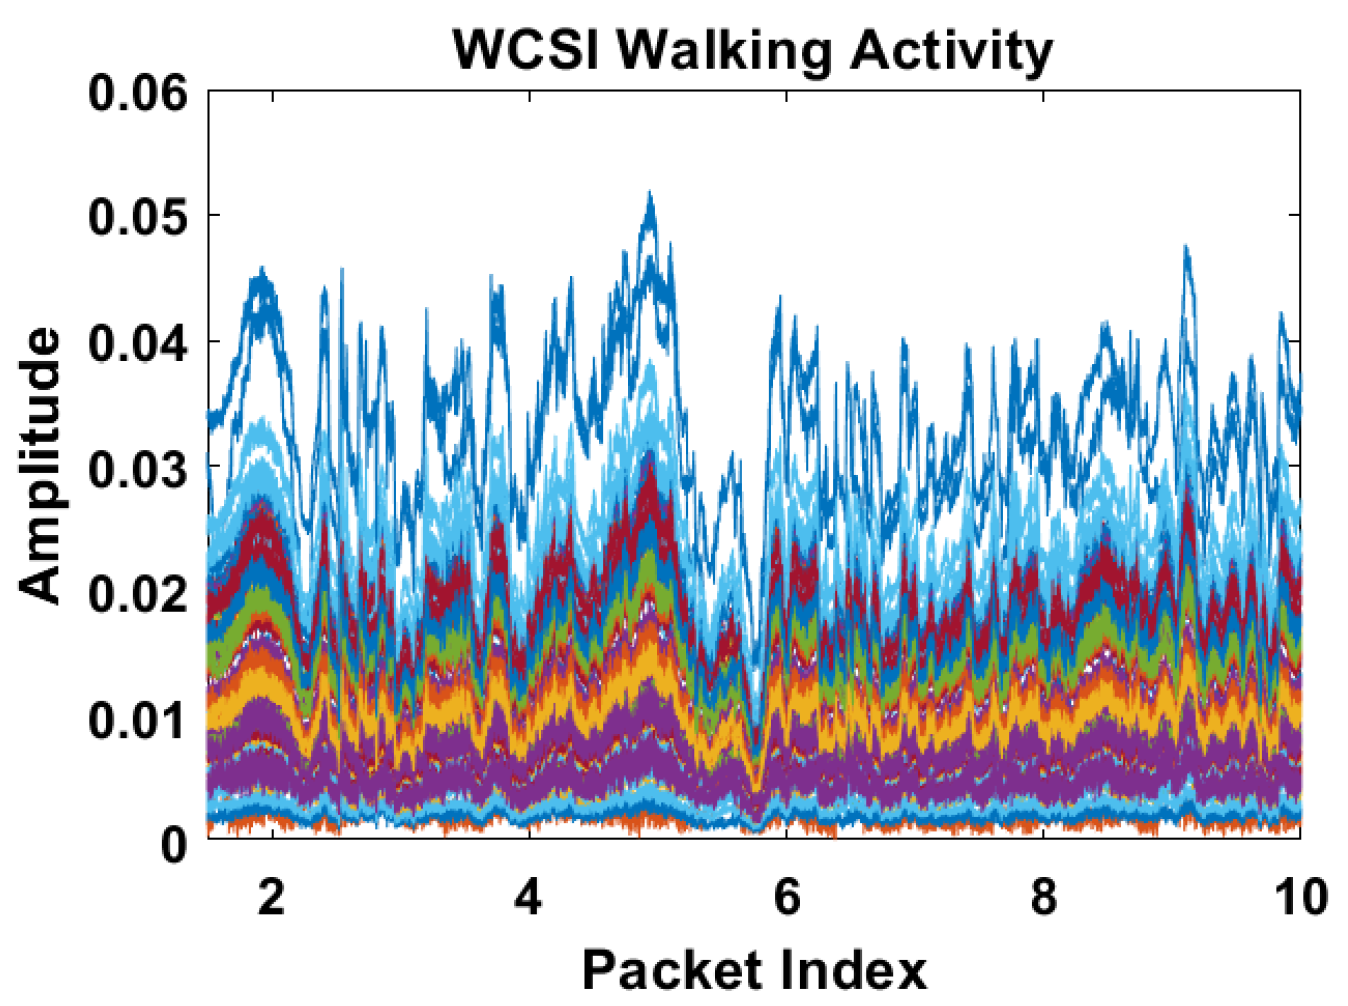
Figure 7.
Wireless channel state information while sitting on a chair.

Figure 8.
Wireless channel state information during standing up from a chair.

Figure 9.
Wireless channel state information during bending down.

Figure 10.
Wireless channel state information during exercise activity.

Figure 11.
Confusion matrix for KNN classifier.

Figure 12.
Confusion matrix for DT classifier.


Table 1.
Software configuration parameters selection.
| Parameters | Values |
|---|---|
| Input random bits | round (0.75 ∗ rand(104,1)) |
| Bit per symbol M | 2, 4, 8, 16, 32 and 64 |
| OFDM Subcarrier | 64, 128, 256, 512, 1024 and 2048 |
| Used subcarriers | 52 |
| Pilot subcarriers | 4, 8, 12, 42 |
| Null subcarriers | 12, 20, 56, 86 |
| Data subcarriers | 48, 96, 182, 384 |
| Sample time | 132/104 ∗ (1/132 ∗ ) |
| Modulation type | BPSK, QPSK, 8PSK, 4QAM, 16QAM, 64QAM |
| Bit per symbol M | 2, 4, 8, 16, 32 and 64 |
| Samples per frame | Used subcarrier log2 (M) |
| Cycle prefix | NFFT-data subcarrier |
Table 2.
Hardware configuration parameters selection.
| USRPs | X300/X310 |
|---|---|
| Transmitter serial number | 192.168.11.1 |
| Receiver serial number | 192.168.10.1 |
| Centre frequency | 5.32 Ghz |
| Clock source | Internal |
| Master clock rate | 120 Mhz |
| Channel mapping | 1, 2 |
| Transport data type | Int16 |
| PPS source | Internal |
| Enable burse mode | false |
| Local oscillator offset | Dialog |
| Decimation factor | 500 |
| Output data type | info16 |
| Interpolation factor | 500 |
Table 3.
The following parameters were used for K-Nearest Neighbour (KNN) and Decision Tree (DT) classifier.
Table 3.
The following parameters were used for K-Nearest Neighbour (KNN) and Decision Tree (DT) classifier.
| Classification Algorithm | Parameters | Setup |
|---|---|---|
| Decision Tree | Maximum number of dataset splits. Split Criterion | 4 Gini’s diversity index |
| K–Nearest Neighbour | Number of Neighbours. Distance Metric | 2 Euclidean |
Table 4.
Percentage accuracy’s of each classifier.
| Classifier Models | Classification Accuracy % |
|---|---|
| Nearest Neighbor (KNN) | 89.73 |
| Decision Tree (DT) | 81.20 |
| Discriminant Analysis (DA) | 49.21 |
| Naive Bayes (NB) | 23.28 |
© 2020 by the authors. Licensee MDPI, Basel, Switzerland. This article is an open access article distributed under the terms and conditions of the Creative Commons Attribution (CC BY) license (http://creativecommons.org/licenses/by/4.0/).
Share and Cite
MDPI and ACS Style
Ashleibta, A.M.; Zahid, A.; Shah, S.A.; Abbasi, Q.H.; Imran, M.A. Flexible and Scalable Software Defined Radio Based Testbed for Large Scale Body Movement. Electronics 2020, 9, 1354. https://doi.org/10.3390/electronics9091354
AMA Style
Ashleibta AM, Zahid A, Shah SA, Abbasi QH, Imran MA. Flexible and Scalable Software Defined Radio Based Testbed for Large Scale Body Movement. Electronics. 2020; 9(9):1354. https://doi.org/10.3390/electronics9091354
Chicago/Turabian StyleAshleibta, Aboajeila Milad, Adnan Zahid, Syed Aziz Shah, Qammer H. Abbasi, and Muhammad Ali Imran. 2020. "Flexible and Scalable Software Defined Radio Based Testbed for Large Scale Body Movement" Electronics 9, no. 9: 1354. https://doi.org/10.3390/electronics9091354
Note that from the first issue of 2016, this journal uses article numbers instead of page numbers. See further details here.