Abstract
Dehydration and overhydration can help to improve medical implications on health. Therefore, it is vital to track the hydration level (HL) specifically in children, the elderly and patients with underlying medical conditions such as diabetes. Most of the current approaches to estimate the hydration level are not sufficient and require more in-depth research. Therefore, in this paper, we used the non-invasive wearable sensor for collecting the skin conductance data and employed different machine learning algorithms based on feature engineering to predict the hydration level of the human body in different body postures. The comparative experimental results demonstrated that the random forest with an accuracy of 91.3% achieved better performance as compared to other machine learning algorithms to predict the hydration state of human body. This study paves a way for further investigation in non-invasive proactive skin hydration detection which can help in the diagnosis of serious health conditions.
1. Introduction
Machine learning and sensing technologies emerged as key players for advanced healthcare systems [1]. They are expected as intelligent, autonomous and ubiquitous decision making systems for the diagnosis and treatment of diseases. The intelligence required for such decision making can be gathered by the application of machine learning on the healthcare data comprising patients’ medical history, medical test reports, logs of monitoring devices, etc. There already exists an overwhelming amount of digital healthcare data stored in medical databases which can be exploited with the help of machine learning for developing intelligent healthcare solutions. Moreover, the use of smart sensor-based healthcare devices have increased the data generation manifolds. Such devices, including wearable fitness bands, implanted chips, auto-injectors, defibrillators, etc. used for monitoring and diagnosis can generate data continuously. Machine learning can leverage from this data for the provision of seamless healthcare services in an autonomous manner [2].
It basically refers to maintaining the internal environment of the healthy human body from cellular to organ level. Some key components of the human internal environment are maintaining appropriate temperature, pressure, and chemical composition. The human body is not only required to maintaining homeostasis but it is also required to perform some vital functions such as metabolism, respiration, digestion, reproduction, growth, exertion, etc. [3]. A key ingredient required for maintaining internal environment and performing the vital functions in humans is water. It is the major component of human body contributing about 63% to the total body weight and 90% to blood plasma. It is also a well-established fact that both dehydration and over-hydration both can disturb the equilibrium of the human body which can result in mild to severe medical implications [4,5,6].
The World Health Organisation estimated that nearly 4 billion cases of diarrhea exist around the world. Dehydration can cause death in kids and the elderly. Therefore, it is vital to maintain appropriate hydration level is important for those people who suffer from diseases, children and elderly people as dehydration can cause an additional problems for them [4,5,7]. It is, therefore, crucial to maintaining an appropriate hydration level in the human body. Dehydration may cause urological, a metabolic, neurological disorder, gastrointestinal or weakness, and overhydration may cause edema, hyponatremia, etc. [1].
Recent studies show much interest in hydration monitoring tools, but most of them rely on manual entry by the user, for the water intake, in a mobile app. Some other recent studies are introducing bottle mount recorders to log the water intake [8,9]. An oral rehydration treatment (water with salt and sugar especially sodium and potassium) is given to treat dehydration [2]. Hydration Level is a significant factor in our daily life to avoid the attack of diseases and to perform daily doings, so its regulation is very important. To handle early diagnosis and frequent identification of hydration level is significant. In a recent study, it is found that even mild dehydration can result in a deficiency in visual and working memory and it can also affect the executive functions in healthy young women [2].
Some commonly discussed signs or parameters in the literature for the hydration level detection include Dry Mucous Membrane, dry axilla, tachycardia, poor skin turgor, urine color, urine specific gravity, low systolic blood pressure, blood urea nitrogen to creatinine ratio, total body water, saliva flow rate, saliva osmolality, plasma or serum osmolality, and bio-electrical impedance [10,11,12,13]. There are some bottlenecks associated with the use of each of these parameters or biomarkers. For example, most of them involve invasive methods and require a clinical arrangement for data collection, while some involve biochemical analysis of some serum or fluid. Because of such limitation, it is not feasible to use them in some wearable non-invasive monitoring and diagnosis solution for the hydration detection. From the parameters mentioned above, bio-electrical impedance analysis (BIA) is a non-invasive method in which a light current is passed through the body and resistance faced by the current is measured. This resistance to current is used as a measure of fat mass and fat-free mass, and total body water [14,15]. Conventional methods of the BIA measurement are complex and require special equipment not suitable for the continuous monitoring. However, BIA methodology provides a proof of concept that there exists a basic correlation between the electric resistance of the body and the water content in it. Depending on the water contents in the body human body resistance can vary between a few ohms and thousands of ohms. A separate study [16] shows that more than 99% of the resistance is faced at the skin level. Taking inspiration from BIA, we have gathered data of galvanic skin response (GSR) and developed a solution for the detection of hydration level based on the GSR. GSR is basically the measure of skin conductance which is just the reciprocal of the skin resistance, measured using Electrodermal Activity (EDA). EDA sensor basically used to study the sympathetic behaviour in humans. However, it works on the same principle of passing light current form the human body at skin level. Hence the GSR data collected from EDA sensor is then exploited with machine learning to detect the hydration level. However, the BIA is a complex method which cannot be used for monitoring and it is only limited for an indirect measure of hydration level (HL). In the field of computer vision and many other applications deep neural network provides impressive result [17,18,19]. Convolutional features give excellence in accuracy and real-time speed [20,21,22,23,24]. Globally wearable and user-centric devices have been increased in number significantly. For analysis of collected data, accurate prediction, and detection of health problems, efficiency and benefits of wirelessly connected devices can be used. As overhydration and dehydration both can lead to death and illness, therefore, this research aims hydration level monitoring. The main contribution of this study is the development of machine learning algorithms model to predict the HL in human posture using GSR data. Therefore, there is a set of features selected and extracted and machine learning algorithms applied to give better performance for HL estimation. There are an extensive set of experiments have been carried out in order to find a best set a machine learning algorithm. It is worth mentioning that eight machine learning algorithms have been developed to find the best performance of the selected features. The rest of the paper is organized as follows: Section 2 describes the methodology, while Section 3 explains the experimental results and finally, Section 4 concludes the paper.
2. Methodology
2.1. Data Pre-Processing
Data is collected from five subjects in this research. Data of subjects are collected in two scenarios classified as hydrated and dehydrated. Moreover, data is also categorized based on physical postures sitting, standing and lay down. Data is recorded at a resolution of 16 bits in samples of 5 min to 15 min and the sampling rate is 1 MHz (maximum precision position on the BITalino Kit).
The electrodermal activity GSR data used in this study is collected from five individuals after obtaining ethical approval using the EDA sensor available on the BITalino Kit [25,26]. In particular, when the data is collected from the participants after the fasting of at least ten hours, it is labeled as dehydrated. Whereas data collected when the participant has been drinking water frequently and has had drank water within one hour before the data collection is labeled as hydrated. Therefore, the data used is for these two states (hydrated and dehydrated). Another aspect considered here is the impact of body posture on the electrodermal activity because it varies with body movements and change in body postures. Hence, it is also important to identify the body posture, for which the EDA data collected, can help to achieve better accuracy for hydration level detection. In this study, therefore, hydrated and dehydrated state data is collected in two common body postures of sitting and standing. For a posture independent study, on the other hand, hydrated and dehydrated state data collected in both postures is combined and fed to a model that is unaware of the body posture. Table 1 shows the example of GSR data and shows posture, state and several samples collected per window.

Table 1.
Data samples of GSR.
BITalino kit used here basically measures skin’s conductance level in S and it is denoted as G. R represents skin resistance measured in M . It is just the reciprocal of skin resistance calculated as follows:
where A is analogue to digitally converted value of the electric signal of the data collection channel BITalino at resolution n, while n represents the number of bits used to store digital output after conversion from analogue signal. Here data is collected using a resolution of 16 bits on BITalino kit channel. Key steps of the methodology used for the development of hydration level detection model is shown in Figure 1.
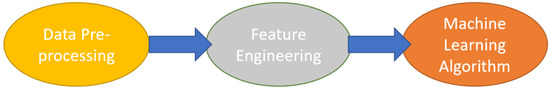
Figure 1.
Proposed framework overview: non-invasive skin hydration level detection using machine learning.
2.2. Feature Selection
The feature space F used in this study comprises the following features:
After selection of features the identification of the right combination of features that can generate the best accuracy for the detection of hydration level is an important task. For a single posture-based data set (e.g., for the sitting and standing posture), the total number of combinations of features are tried and evaluated are
where f is the number of features in the feature space.
2.3. Machine Learning
Machine learning has many classifiers which are divided into two categories (1) Supervised learning: used the label for data and identify important features in data (2) Unsupervised learning: is a clustering algorithm, unlabelled data. Specifically, supervised machine learning consists of two main categories (1) Regression algorithm which is used for continuous values in data (2) Classification an algorithm that is used for categorical values in data [27,28,29].
In this study, supervised machine learning is used because the hydration level of individual is under the label of states. The model is trained with GSR data for hydration and dehydration state. In this paper, eight supervised classifiers have been used on collected data in different postures. Those classifiers are logistic regression (LR), random forest (RF), K-Nearest Neighbour (KNN), Naïve bayes (NB), decision tree (DT), linear discriminant analysis (LDA), Ada boost classifier (ABC) and quadratic discriminant analysis (QDA). All the machine learning algorithms are tested on data and trained with all aforementioned extracted features. In this experiment, 70% of data is a training set and 30% is testing data of the model. Later, three-fold cross-validation is applied to training data, in which model is tuned for one data set and the remaining two data set is used for model training. This process repeated three times. The main purpose of using cross-validation is to identify the model which is not only accurate but also persistent in its performance. This shows that the model is not inclined towards some parameter values, it performs well for all new coming data sets. The selection of data depends on problem nature and selection of algorithms. Performance evaluation of classifier is calculated as follows:
where TP represents, TN, FP, and FN represent true positive, true negative, false positive, and false negative respectively. where TP is a true positive rate, is known as sensitivity, and represent the detection rate of the correct number of dehydrated cases, labeled as true positive cases TP, with respect to the sum of true positive, and false negative cases FN. False negative cases are actually dehydrated cases but they are detected as hydrated cases. Similarly true negative cases TN are the hydrated cases detected correctly and false positive cases FP are the hydrated cases but they are detected as dehydrated ones, whereas TN is a true negative rate, also called specificity, and it is the measure of the detection of the correct number of hydrated cases TN, with respect to the sum of the true negative TN, and false positive cases FP. Here, the overall accuracy (%), also called the correct classification rate (CR).
3. Experimental Results
Table 1 shows the results for different machine learning algorithms for skin hydration. The results are generated by using python 3.8 version, using different features such as mean, standard deviation, square root, percentile, minimum, kurtosis and skewness. These results are calculated from the data of skin hydration which is collected via a non-invasive method.
Table 2 shows the experimental results of machine learning for individual features. The experimental results show that the Random forest achieve better performance as compared to other algorithms. In addition, the Naïve Bayes achieved the lowest performance. It should be noted that the means presented as M, standard deviation as SD, square root as SR, percentile as P, kurtosis as K, skew as S.
Table 2.
Selected Features.
Table 3 demonstrates that the experimental results of machine learning for feature combination. The experimental results show that the Random forest achieve better performance as compared to other algorithms. In addition, the Naïve Bayes achieved lowest performance. It should be noted that the means presented as M, standard deviation as SD, square root as SR, percentile as P, kurtosis as K, skew as S. The machine learning performance based on the selection of right features to perform the task. The simple feature selection proves can improve the computational cost and performance of machine learning, which is also important for real-time health-care models. In this study, the performance of every single feature is evaluated. It was observed that, the combination of features such as mean, standard deviation, square root, percentile, minimum, kurtosis and skewness achieved better performance as compared to single feature selection. The maximum accuracy obtained by a simple algorithm such as decision tree 91.47%.
Table 3.
Summary of ML results for individual features.
Figure 2 indicates that all classifiers show the same value for all features except the Decision Tree. DT has achieved a maximum value of accuracy when percentile feature is taken, also it has variable accuracy for all features.
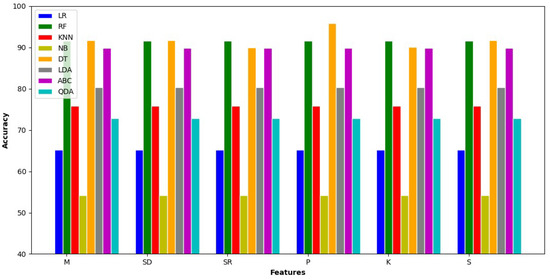
Figure 2.
Experimental results for features.
Figure 3 represents each classifier tuned with combined features. Every bar of each classifier shows the variation in an accuracy. The DT shows better performance among all other classifiers. The DT classifier considers all possible results of the decision and traces each trail to a conclusion.
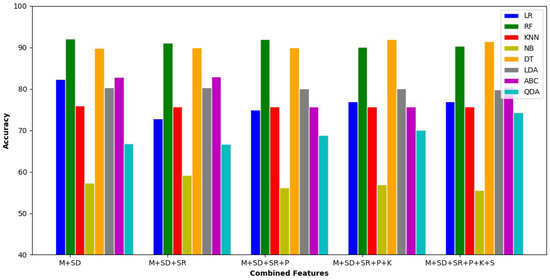
Figure 3.
Experimental results for feature combination.
Table 4 shows the confusion matrix for the best single feature and multiple feature combinations. The experimental results display that the decision tree with SD features and combination of all features achieved better performance. In addition, the sensitivity (TPR) and specificity (TNR) added to Table 5 for the best features. TPR, Sensitivity, is the percentage of persons with the disease who are correctly identified by the test. TNR, Specificity, is the percentage of persons without the disease who are correctly excluded by the test. Clinically, both TPR and TNR are important for confirming or excluding disease during screening. Best TNR (specificity) has 1 value and worst has 0 value. In medical diagnosis, TPR (sensitivity) is the ability to identify the patient with the disease and TNR (specificity) is the ability to identify those patients who do not have a disease. High sensitivity means that more patents with the disease were detected and fewer numbers with the disease go undetected. A high-specificity means that everyone who does not have the disease and will not generate false-positive results.
Table 4.
Summary of ML results for combination features.
Table 5.
Best confusion matrix for feature.
4. Conclusions
Machine learning is now being used in the healthcare units for diagnosis and treatment. In this paper it is emphasized how different classifiers of machine learning are being used in the detection of the hydration level of the individual. It includes the collection of data through EDA for the modelling of classifiers. The data is collected for hydrated and dehydrated state of the body and different features are extracted and all classifiers are tuned and train on them for the detection of hydration level. On the basis of accuracy 91.3% it is found that random forest classifier is best of all other classifiers on a defined extracted features. As part of the future research direction, we plan to use deep learning classifiers such as convolutional neural network and long short-term memory to improve the performance of the approach.
Author Contributions
Conceptualization, S.L. and N.R.; Methodology, S.L. and K.D.; Software, S.L. and K.D.; Validation, S.L. and K.D.; Formal Analysis, S.L. and K.D.; Investigation, S.L., K.D. and N.R.; Resources, S.L., K.D., N.R. and K.A.; Writing-Original Draft Preparation, S.L., K.D., N.R. and K.A.; Writing-Review and Editing, K.D., K.A., N.R. and K.A.; Visualization, S.L. and K.D.; Supervision, N.R.; Project Administration, S.L.; Funding Acquisition, K.A. and N.R. All authors have read and agreed to the published version of the manuscript.
Funding
This work is supported in part by the Ajman University Internal Research Grant.
Acknowledgments
The author would like to thank the University of West Scotland for funding of Sidrah Liaqat. The work is supported in part by the Ajman University Internal Research Grant.
Conflicts of Interest
The authors declare no conflict of interest.
References
- Sagner, M.; McNeil, A.; Puska, P.; Auffray, C.; Price, N.D.; Hood, L.; Lavie, C.J.; Han, Z.G.; Chen, Z.; Brahmachari, S.K.; et al. The P4 health spectrum—A predictive, preventive, personalized and participatory continuum for promoting healthspan. Prog. Cardiovasc. Dis. 2017, 59, 506–521. [Google Scholar] [CrossRef]
- Rizwan, A.; Zoha, A.; Zhang, R.; Ahmad, W.; Arshad, K.; Ali, N.A.; Alomainy, A.; Imran, M.A.; Abbasi, Q.H. A review on the role of nano-communication in future healthcare systems: A big data analytics perspective. IEEE Access 2018, 6, 41903–41920. [Google Scholar] [CrossRef]
- Coniglio, M.A.; Fioriglio, C.; Laganà, P. Non-Intentionally Added Substances in PET-Bottled Mineral Water. Eur. Food Res. Technol. 2018, 244, 433–439. [Google Scholar]
- Aristotelous, P.; Aphamis, G.; Sakkas, G.K.; Andreou, E.; Pantzaris, M.; Kyprianou, T.; Hadjigeorgiou, G.M.; Manconi, M.; Giannaki, C.D. Effects of controlled dehydration on sleep quality and quantity: A polysomnographic study in healthy young adults. J. Sleep Res. 2019, 28, e12662. [Google Scholar] [CrossRef] [PubMed]
- Merhej, R. Dehydration and cognition: An understated relation. Int. J. Health Gov. 2019. [Google Scholar] [CrossRef]
- Kakade, S.S.; Jagadale, A.B. Development of system for estimation of Total Body Water (TBW), Fat Mass (FM), Fat Free Mass (FFM) using Bioimpedance analysis technique. In Proceedings of the 2016 International Conference on Communication and Signal Processing (ICCSP), Tamilnadu, India, 6–8 April 2016; pp. 0224–0226. [Google Scholar]
- Pross, N. Effects of dehydration on brain functioning: A life-span perspective. Ann. Nutr. Metab. 2017, 70, 30–36. [Google Scholar] [CrossRef]
- Howell, T.A.; Hadiwidjaja, A.; Tong, P.P.; Thomas, C.D.; Schrall, C. Method and Apparatus for Hydration Level of a Person. U.S. Patent 16/270,773, 8 February 2019. [Google Scholar]
- Lee, N.E.; Lee, T.H.; Seo, D.H.; Kim, S.Y. A smart water bottle for new seniors: Internet of Things (IoT) and health care services. Int. J. Bio-Sci. Bio-Technol. 2015, 7, 305–314. [Google Scholar] [CrossRef]
- Fortes, M.B.; Owen, J.A.; Raymond-Barker, P.; Bishop, C.; Elghenzai, S.; Oliver, S.J.; Walsh, N.P. Is this elderly patient dehydrated? Diagnostic accuracy of hydration assessment using physical signs, urine, and saliva markers. J. Am. Med. Dir. Assoc. 2015, 16, 221–228. [Google Scholar] [CrossRef]
- Armstrong, L.E. Hydration assessment techniques. Nutr. Rev. 2005, 63, S40–S54. [Google Scholar] [CrossRef]
- Garrett, D.C.; Rae, N.; Fletcher, J.R.; Zarnke, S.; Thorson, S.; Hogan, D.B.; Fear, E.C. Engineering approaches to assessing hydration status. IEEE Rev. Biomed. Eng. 2017, 11, 233–248. [Google Scholar] [CrossRef]
- Armstrong, L.E. Assessing hydration status: The elusive gold standard. J. Am. Coll. Nutr. 2007, 26, 575S–584S. [Google Scholar] [CrossRef] [PubMed]
- Khatun, M.F.; Rana, M.S.; Fahim, T.A.; Zuhori, S.T. Mathematical Models for Extracellular Fluid Measurement to Detect Hydration Level Based on Bioelectrical Impedance Analysis. In Proceedings of the 2019 IEEE Canadian Conference of Electrical and Computer Engineering (CCECE), Edmonton, AB, Canada, 5–8 May 2019; pp. 1–5. [Google Scholar]
- Marra, M.; Sammarco, R.; De Lorenzo, A.; Iellamo, F.; Siervo, M.; Pietrobelli, A.; Donini, L.M.; Santarpia, L.; Cataldi, M.; Pasanisi, F.; et al. Assessment of body composition in health and disease using bioelectrical impedance analysis (BIA) and dual energy X-ray absorptiometry (DXA): A critical overview. Contrast Media Mol. Imaging 2019, 2019, 3548284. [Google Scholar] [CrossRef] [PubMed]
- Fish, R.M.; Geddes, L.A. Conduction of electrical current to and through the human body: A review. Eplasty 2009, 9, e44. [Google Scholar] [PubMed]
- Zhang, J.; Jin, X.; Sun, J.; Wang, J.; Sangaiah, A.K. Spatial and semantic convolutional features for robust visual object tracking. Multimed. Tools Appl. 2018. [Google Scholar] [CrossRef]
- Zhang, J.; Xie, Z.; Sun, J.; Zou, X.; Wang, J. A cascaded R-CNN with multiscale attention and imbalanced samples for traffic sign detection. IEEE Access 2020, 8, 29742–29754. [Google Scholar] [CrossRef]
- Zhang, J.; Lu, C.; Wang, J.; Yue, X.G.; Lim, S.J.; Al-Makhadmeh, Z.; Tolba, A. Training Convolutional Neural Networks with Multi-Size Images and Triplet Loss for Remote Sensing Scene Classification. Sensors 2020, 20, 1188. [Google Scholar] [CrossRef] [PubMed]
- Zhang, J.; Wu, Y.; Feng, W.; Wang, J. Spatially attentive visual tracking using multi-model adaptive response fusion. IEEE Access 2019, 7, 83873–83887. [Google Scholar] [CrossRef]
- Zhang, J.; Wang, W.; Lu, C.; Wang, J.; Sangaiah, A.K. Lightweight deep network for traffic sign classification. Ann. Telecommun. 2019. [Google Scholar] [CrossRef]
- Zhang, J.; Jin, X.; Sun, J.; Wang, J.; Li, K. Dual model learning combined with multiple feature selection for accurate visual tracking. IEEE Access 2019, 7, 43956–43969. [Google Scholar] [CrossRef]
- Chen, Y.; Xu, W.; Zuo, J.; Yang, K. The fire recognition algorithm using dynamic feature fusion and IV-SVM classifier. Clust. Comput. 2019, 22, 7665–7675. [Google Scholar] [CrossRef]
- Zhang, D.; Yang, G.; Li, F.; Wang, J.; Sangaiah, A.K. Detecting seam carved images using uniform local binary patterns. Multimed. Tools Appl. 2018. [Google Scholar] [CrossRef]
- Rizwan, A.; Zoha, A.; Alomainy, A.; Ali, N.; Imran, M.; Abbasi, Q. Skin Conductance as Proxy for the Identification of Hydration Level in Human Body. In Proceedings of the 2019 IEEE MTT-S International Microwave Biomedical Conference (IMBioC), Nanjing, China, 6–8 May 2019; Volume 1, pp. 1–3. [Google Scholar]
- Rizwan, A.; Zoha, A.; Ozturk, M.; Alomainy, A.; Imran, M.A.; Abbasi, Q.H. Non-invasive hydration level estimation in human body using Galvanic Skin Response. IEEE Sens. J. 2020, 20, 4891–4900. [Google Scholar] [CrossRef]
- Kotsiantis, S.B.; Zaharakis, I.; Pintelas, P. Supervised machine learning: A review of classification techniques. Emerg. Artif. Intell. Appl. Comput. Eng. 2007, 160, 3–24. [Google Scholar]
- Kassambara, A. Practical Guide to Cluster Analysis in R: Unsupervised Machine Learning; STHDA: London, UK, 2017; Volume 1. [Google Scholar]
- Pedregosa, F.; Varoquaux, G.; Gramfort, A.; Michel, V.; Thirion, B.; Grisel, O.; Blondel, M.; Prettenhofer, P.; Weiss, R.; Dubourg, V.; et al. Scikit-learn: Machine learning in Python. J. Mach. Learn. Res. 2011, 12, 2825–2830. [Google Scholar]
© 2020 by the authors. Licensee MDPI, Basel, Switzerland. This article is an open access article distributed under the terms and conditions of the Creative Commons Attribution (CC BY) license (http://creativecommons.org/licenses/by/4.0/).