Validation of Forward Voltage Method to Estimate Cracks of the Solder Joints in High Power LED


1
Department of Information Engineering (DII), Università Politecnica delle Marche, 60131 Ancona, Italy
2
iGuzzini Illuminazione S.p.A, Via Mariano Guzzini 37, 62019 Recanati, Italy
*
Author to whom correspondence should be addressed.
Electronics 2020, 9(6), 920; https://doi.org/10.3390/electronics9060920
Submission received: 29 April 2020
/
Revised: 26 May 2020
/
Accepted: 27 May 2020
/
Published: 1 June 2020
(This article belongs to the Special Issue Challenges and New Trends in Power Electronic Devices Reliability)
Abstract
:The Light Emitting Diode (LED) has many advantages compared to traditional lamps, such as a long lifetime, color rendering and energy saving. It requires good thermal management, since as the temperature increases, the lifetime decreases. Furthermore, the presence of cracks in the Solder Joint of an LED (SJL) compromises the correct dispersion of heat and causes the joint fatigue. This can lead to a decrease in the lifetime of the assembled LED. In this study, we validated that an SJL can be considered faulty if the Forward Voltage (Vf) acquired before and after thermal cycles increases by more than 2%. The voltage measurement method was validated by comparing the results with the techniques commonly used to evaluate the defects of a solder joint as the X-ray analysis and the metallographic section. The failure analysis results present the probability of failure and the lifetime of the SJL achieved by analyzing the data using the Norris–Landberg Model. The lifetime calculated over 1800 SJLs considered in the validation process is greater than 20 years for 95.9% of the tested LEDs.
1. Introduction
In the last few decades, the Light Emitting Diode (LED) has become an important competitor for traditional light sources such as incandescent or fluorescent lamps. LED lighting is currently the best light source with respect to its impact on the environment and less consumption of energy with respect to traditional light sources [1,2]. LED technology leads to innovative solutions that traditional lamps can not achieve. It allows the ability to create complex lighting systems for various scenarios, such as smart city [3,4] or smart lighting in the cultural heritage field [5]. Long-term analysis of lighting performance can be conducted by studying lighting parameters, such as luminous flux and the correlated color temperature, which can be controlled and monitored in real time [6]. Despite the investment costs, LEDs offer a longer life and the luminous flux is more constant over time compared to other technologies. In fact, LEDs represent the best solution in interior lighting applications such as homes and offices, and in the automotive sector for high brightness signals such as lights and traffic lights.
In general, different approaches can be used to predict the lifetime of electronic components [7,8]. In lighting, thermal management is the fundamental aspect to guarantee constant yields over time and a high performance of the LED. When temperature increases, several aspects are affected: the light color emitted changes, intensity decreases, and lifetime reduces [9]. Durability and reliability tests, such as thermal and power tests, are generally very expensive, therefore accelerated tests are widely used [10]. Accelerated tests reduce test and response times by accelerating the identification of design and fatigue defects. Among standard tests proposed to characterize the solder joint fatigue, the Thermal Cycling Test (TCT) is the most widely used by the scientific community [11].
One of the most relevant problems of LED behavior in lighting systems is the solder joint fatigue between Printed Circuit Board (PCB) and the LED [12]. In literature, many works deal with the Solder Joint of LED (SJL) reliability. The main methods of analyzing the solder joint lifetime are based on strain density [13], on junction temperature measurement [14], or on the effect of voids [15].
One of the main challenges in studying the solder joints fatigue is to detect cracks and monitor their propagation [16]. The SJL strongly depends on the different components of the device such as the LED type, the soldering paste, the substrate, and the finish. In particular, cracks develop due to the large variation of the Coefficient of Thermal Expansion (CTE) between LED and PCB. The presence of cracks is quite complicated to characterize as they are difficult to identify through a non-destructive method [17,18]. Scanning Electron Microscopy (SEM), cross scanning, and dye-and-pry cannot be used for in situ monitoring of the cracks because they all are destructive methods [17].
In the study of Zhao et al. [19] a model enables the analysis of the thermal–mechanical performance of solder interconnects. The experiment was conducted under cyclic temperature, taking into account that time and temperature depend on the creep behavior of the interconnected material. They assessed that the fatigue resistance is sensitive for changes in the thickness and meniscus of solder interconnects.
Elger et al. use the transient thermal analysis for the detection of cracks. They developed a method based on thermal analysis. The increase of the thermal resistance between the initial signal and the signal after cycles is correlated with the presence of cracks in the solder joint by cross sections [20]. Other researchers have so far relied on the detection of resistance variation to estimate the presence of cracks. In literature there are different criteria to define the resistance variation, for example the resistance change of 5 ohm [21], an increase of the resistance of 10 ohm [22], and a resistance threshold of 450 ohm [23]. The resistance variation defined in the JESD22-B111 standard is a 1000 ohm resistance threshold lasting 1 s, or a 100 ohm resistance threshold, if the initial resistance value is less than 85. The solder joint failure described in the IPC/JEDEC-9702 standard is given by a 20% increase in resistance. In the study of Henshall et al. [24] three different electrical fault criteria are compared: 500 ohm threshold, 20% increase in resistance, and infinite resistance. In this study, we conclude that the use of the IPC-9701A standard failure criterion for 20% increase in resistance provides the most sensitive failure measure. Other studies assert that solder joint cracking can be defined by evaluating the increase in the differential voltage [10,25]. Osram Spa defines the 2% increase in the Forward Voltage (Vf), the failure criterion, which corresponds to the 20% increase in resistance [26].
In this paper, we aimed to validate the failure criterion of a 2% increase in the forward voltage as a method to detect cracks in the SJL. It is easy to implement, repeatable, non-destructive, and requires common measuring instruments present in many laboratories. The study presents the experimental protocol, the accelerated test carried out, the failure analysis, and the obtained SJL lifetime.
2. Materials and Methods
The experimental protocol section consists on the description of the circuits, which are subjected to the TCT and the voltage measurements method. TCT and the oscilloscope test, which is carried out to validate the voltage measurement method, are described. Finally, we present the traditional methods used to evaluate solder defects, the X-ray analysis for voids and cracks, and the metallographic section for a complete analysis of the physical structure of the components.
2.1. Experimental Protocol
Following the IPC-9701A standard and Osram’s directives, an experimental protocol to detect cracks in SJL subjected to the thermal cycling test is proposed. A total of 42 circuits, of which 40 are subjected to thermal test, and 2 are used as a reference, were developed. Each circuit consisted of 45 LEDs arranged in 3 rows by 15 columns as can be seen in Figure 1. In total, 1800 LEDs were used in this study.
The composition of each circuit is defined below:
- LED Samsung LH181B.
- Senju solder paste.
- Substrate in thermal CEM3.
- Passivated copper finish.
The instrumentation used consisted of a Source Meter Unit (SMU), a thermometer, and a PC. A software capable of sending commands to the instrument to generate a current pulse and save the voltage measurement was implemented. The Keithley 2400 SMU [27,28] is the unit that sends the current impulse and measures the voltage across the Device Under Test (DUT). The advantage of this instrument is that it allows a simple and compact configuration compared to the use of a separate Digital Multimeter (DMM) and source, and allows for the 4-terminal measurement configuration. The fundamental principle of the 4-wire connection is to supply power to the device and perform the measurement of the Vf through two separate connection lines. Using this configuration, it is possible to connect the measurement cables directly to the ends of the device to measure voltage, thus avoiding the influence of resistive drops on the power supply wires. The connection between the SMU and the DUT consisted of a bed of nails. This is a traditional electronic test fixture made up of 4 spring contacts (spring-loaded pins), which create the electrical connection between the measuring instrumentation and the unit. Figure 1 shows the experimental setup used in this study.
Before subjecting the circuits to TCT, the voltage of each LED was measured at a controlled temperature (25 °C), inside a fixed temperature chamber. In order to monitor the temperature, a Fluke 51 thermometer with a type k thermocouple was used. This first measure was fundamental in the failure analysis because it represents the reference value.
The Vf was measured by sending a 20 ms current pulse at 10 mA to each LED. The instrument allowed us to set the integration time of the A/D converter that represents the period of time in which the input signal was measured. The integration time affects the usable digits, the amount of reading noise, and the ultimate reading rate of the instrument. The integration time was divided into three different speeds: the fastest integration time (fast), which results in increased reading noise and fewer usable digits, the slowest integration time (high accuracy), which provides the best noise immunity, and the default setting (normal), which is a compromise between speed and noise. In order to have both good speed and low noise, normal was used, which resulted in a 20 ms pulse. The current value was fixed at 10 mA in order to avoid heating the LED, and the consequently variation of Vf.
In total, 1900 thermal cycles were performed and the test, at every 100 cycles, was suspended to carry out the measurement of Vf [20]. Before measuring, we waited until the circuit temperature reached 25 °C inside the fixed temperature chamber.
The failure criterion was an increase of 2% in the forward voltage. For each 100 cycles, the forward voltage measured were compared with the reference value measured before the start of the TCT. A failure was recorded once the following condition was met:
where Vf (x) is the forward voltage measured at each cycle, and the Vf (0) is the reference value. The threshold value of 0.05 V is determined by calculating the 2% of the reference value, considering LEDs have an average Vf of 2.57 V.
The MATLAB programming environment was used to control the instrument, and in data analyzing.
2.2. Thermal Cycling Test
TCT is important because thermo-mechanical stress is one of the main reason for structural failures, causing the cracking of solder joints between the package and board. LED modules were exposed to temperature tests between −40 to 120 °C [29]. Due to differences in thermo-mechanical stress under hot and cold conditions, important information can be obtained. TCT is the process of testing the SJL by subjecting it to temperature conditions in excess of its normal service parameters to uncover faults in a short amount of time. The TCT was performed in a climatic chamber CST 27/2T of Angelantoni test technologies s.r.l. visible in Figure 2. It consisted of two chambers and a transfer carriage, which permits movement of circuits from one chamber to another. Proprietary software allowed us to start the test, set the specifications, and save the acquisition. Once the software started, the oven required 10 min to reach the set temperature. After that the test started. As shown in Figure 3, DUT were kept for 15 min in a cold chamber and 15 min in a hot chamber, the movement occurred through the transfer carriage with a 5 s transfer time. The test continued by alternating between the hot and cold chambers for up to 100 cycles.
In each chamber, an offset of 5 °C (recommended value of the oven manufacturer) was set, which guarantees keeping the oven temperature at −40 and 120 °C respectively. This was an important setting because the movement from one chamber to another involves the variation of the temperature. It was possible to view the acquisition of the data through the proprietary software during the test.
2.3. Oscilloscope Test
In order to validate the experimental protocol, current and voltage were measured at the end of each acquisition to check that they were steady. The instrument used for the measurements is the Oscilloscope LeCroy waverunner LT322 Series (LeCroy, New York, NY, USA). The test was carried out by powering each LED at 10 mA in direct current. Typically, the oscilloscope has 2 type of probes: the voltage probes and the current probes. We connected the voltage probes to the LED and the current probes to the power cable. The oscilloscope displays electrical signal trends over the time. In order to obtain a stable signal, the function trigger set to single modality was used, in order to view only one scan of the signal at a time. The display of the oscilloscope shows in red the trend of the current and in blue the trend of the voltage. When the LED was powered, both signals increased: the current rises from 0 mA to 10 mA and the voltage rises from 0 V to 2.57 V. The transient time was 0.08 ms (80 s). The delay of SMU between sending the impulse and the voltage measurement response was 1 ms. This value was bigger than the transitional time, therefore, the signals of current and voltage were in a steady state when the measurement was acquired.
2.4. X-ray Analysis
X-ray analysis is widely used in the electronic field to evaluate solder defects. SJL inspection allows for detecting structural defects of the electronic boards such as missing solder, the presence of voids, and short circuits. In this study, X-ray analysis was performed to obtain a complete analysis of the solder joint and to evaluate the presence of cracks. In order to validate the analysis method, the X-rays of LEDs that have not undergone the TCT were compared with the X-rays of SJL that reached failure.
2.5. Metallographic Section
The metallography consists in the study of the physical structures of crystals and metal alloys using a microscope. In this way, it is possible to determine the dimensions and the shape of crystals, the distribution of the phases, the direction of the slipping lines, the level of purity, and the presence of contaminations. The metallographic section was divided into six phases:
- Sample sectioning: the sample was sectioned in order to allow the resin to be incorporated. Given the LED fragility, this operation was made manually.
- Sample incorporation: the sample was incorporated into an acrylic resin to allow the smoothing and grinding phases and to simplify the microscopic observation.
- Smoothing: this phase consisted of smoothing the sample using diamond grit abrasive paper.
- Grinding: this phase was performed with diamond abrasive papers.
- Polish: the samples ground were immersed into a corrosive chemical solution, which highlights the structures.
- Microscopic observation: the observation of the sample was carried out with Axioplan Zeiss microscope.
Metallographic section was used to verify the presence of cracks in the SJL, and to evaluate length and thickness of the cracks. In order to validate the 2% increase of Vf as a method of estimating cracks in the SJL, the metallographic section of the unbroken SJL was compared with the metallographic section of failed SJL.
3. Physics Failure Analysis
3.1. Weibull Analysis
The Weibull distribution is a continuous probability distribution, described by two parameters: the scale parameter and the shape parameter . Weibull analysis is a methodology used for performing lifetime data analysis. Weibull distribution defines a failure curve, which is normally used in the industrial environment for all electronic applications.
The Weibull distribution is determined by the following equation:
where F(t) is the probability of failure at t number of cycles or hours, is the shape parameter or Weibull slope, and the scale parameter or characteristic Weibull lifetime.
3.2. Norris–Landberg Model
The solder joint fatigue is a low-cycle failure and it originates from the Coffin–Manson model [30]. In fact, almost all lifetime prediction models are derived from Coffin–Manson. The Coffin–Manson model was used to evaluate the growth of cracks in the solder joint, the mechanical failures, the fatigue of the material, and the deformation of the material.
The model is described by the following equation:
where N is the number of cycles to failure, is the plastic strain range per cycle, n is an empirical material constant, and C is a proportionality factor. The number of cycles obtained with the Coffin–Manson model depends on the plastic deformation, which increases as the cycles increase. The measurement of this deformation is often difficult to obtain, therefore, other models that consider temperature variation as a fundamental parameter were developed. The Norris–Landberg model assumes that the plastic deformation range is proportional to the temperature excursion range, and introduces two other factors taking into account the cycling frequency and the maximum temperature of the solder paste. In this way, the Acceleration Factor (AF) can be defined as:
where field and test indicate the real condition and the test condition, respectively. f is the cycling frequency expressed by the cycles per day at the field and test condition, m is a cycling frequency exponent and a typical value is about 0.33. is the temperature range during cycles at field and test, is the maximum temperature of the joint in field and test condition expressed in Kelvin, n is the exponent of the temperature range, a typical value is about 1.9. Ea is the activation energy and K is the Boltzmann constant, is 1414 [30]. SJL lifetime represents the period of time during which the joint guarantees the correct operation. The lifetime can be expressed in different measurement units depending on the system application. In lighting applications, it is common to express the lifetime in hours [31]. To simplify the understanding of the data it is advisable to express lifetime in years, especially in the industrial and commercial environment. The equation below computes the lifetime starting from :
4. Results
The presence of cracks and the failure of SJL were evaluated considering the 2% increase in Vf with respect to the reference value. In total, at the end of the 1900 cycles, there are 74 faulty SJLs.
Figure 4 shows the number of SJLs that failed as the thermal cycles increase. The first failure was at 1400 cycles with one broken SJL. At 1500 cycles one more SJL failed, and at 1600 cycles, another 10 SJLs failed. At 1900 cycles, the amount of broken SJLs increased to 37. In the last cycle, the number of failure assumed an exponential trend.
Figure 4 was obtained by fitting the data of failed SJLs. The analytical formula, which described the curve, is presented below:
Coefficients are calculated with 95% confidence bound and the value obtained is 0.94.
In order to evaluate the SJL performance it is necessary to determine the probability of reliability and the probability of failure. The reliability R(x) indicates the probability that solder joint has a correct functioning during TCT. The probability of failure determines the probability that solder joint presents cracks. The reliability and probability of failure are described by Equations (7) and (8):
As thermal cycles increase, the percentage of reliability decreases, from 1% to 0.96%. Instead, the probability of failure F(x) increases when thermal cycles increase. At the end of thermal cycles, the unreliability increases up to 0.035%. Figure 5 shows the unreliability assessed through the SJLs that reach the failure during test. This curve is obtained fitting the data of unreliability and the analytical formula of the curve is represented by:
Coefficients are calculated with 95% confidence bound and the value obtained is 0.99.
As we said in the previous chapter, the Weibull distribution is the most used function in the electronic environment to represent faults analysis. Figure 6 represents the acquired data using the Weibull distribution, including Weibull parameters.
Results refer to the relationship between real condition and test condition. We have chosen a frequency cycling of 6 on–off per day on the basis of the data provided by the company according to the type of LED and the final application of the product. TCT frequency cycling depends on the type of the accelerated test used. In this case, the frequency cycling is of 48 on–off per day. TCT requires that devices remain 15 min inside hot chamber and 15 min inside cold chamber. Each cycle ended in approximately 30 min, therefore, 48 cycles were performed in 24 h corresponding to the number of daily on–offs. Table 1 shows the results obtained from the TCT.
SJL lifetime represents the estimated number of years in a real installation during which the joint guarantees the correct operation.
At the ends of TCT, the 4.1% of the SJLs have reached failure still providing a SJL lifetime between 17 and 24 years, the remaining 95.9% of the SJLs present a joint lifetime longer than 24 years.
In order to validate the methodology used to identify cracks, X-ray analysis and metallographic section were performed. The X-ray analysis permits us to evaluate the presence and the size of voids inside the solder joint. This type of analysis allows us to visualize the air trapped in the soldering paste. Voids are observable as they have a different color than the surrounding environment, as we can see in Figure 7a. This type of visualization also allows us to distinguish the cracks formed inside the joint [32]. The crack represents a fracture inside the solder paste, which is equivalent to an air passage, and it is easily distinguishable by X-rays. Cracks cause a malfunction of the SJL as electrical continuity is compromised. X-ray analysis is a non-destructive method that allows us to detect cracks which compromise the correct dispersion of heat and cause an increase of Vf. Figure 7a shows the X-ray analysis of a LED not used in TCT. In this figure, it is possible to notice the presence of voids in the SJL. It does not lead to malfunction because the percentage of voids is lower than the percentage defined in the IPC-A-610D standard. Figure 7b, presents the X-ray analysis of a SJL submitted to the TCT, and that reached the failure. Through analysis of the image, it is possible to identify cracks in the solder joint.
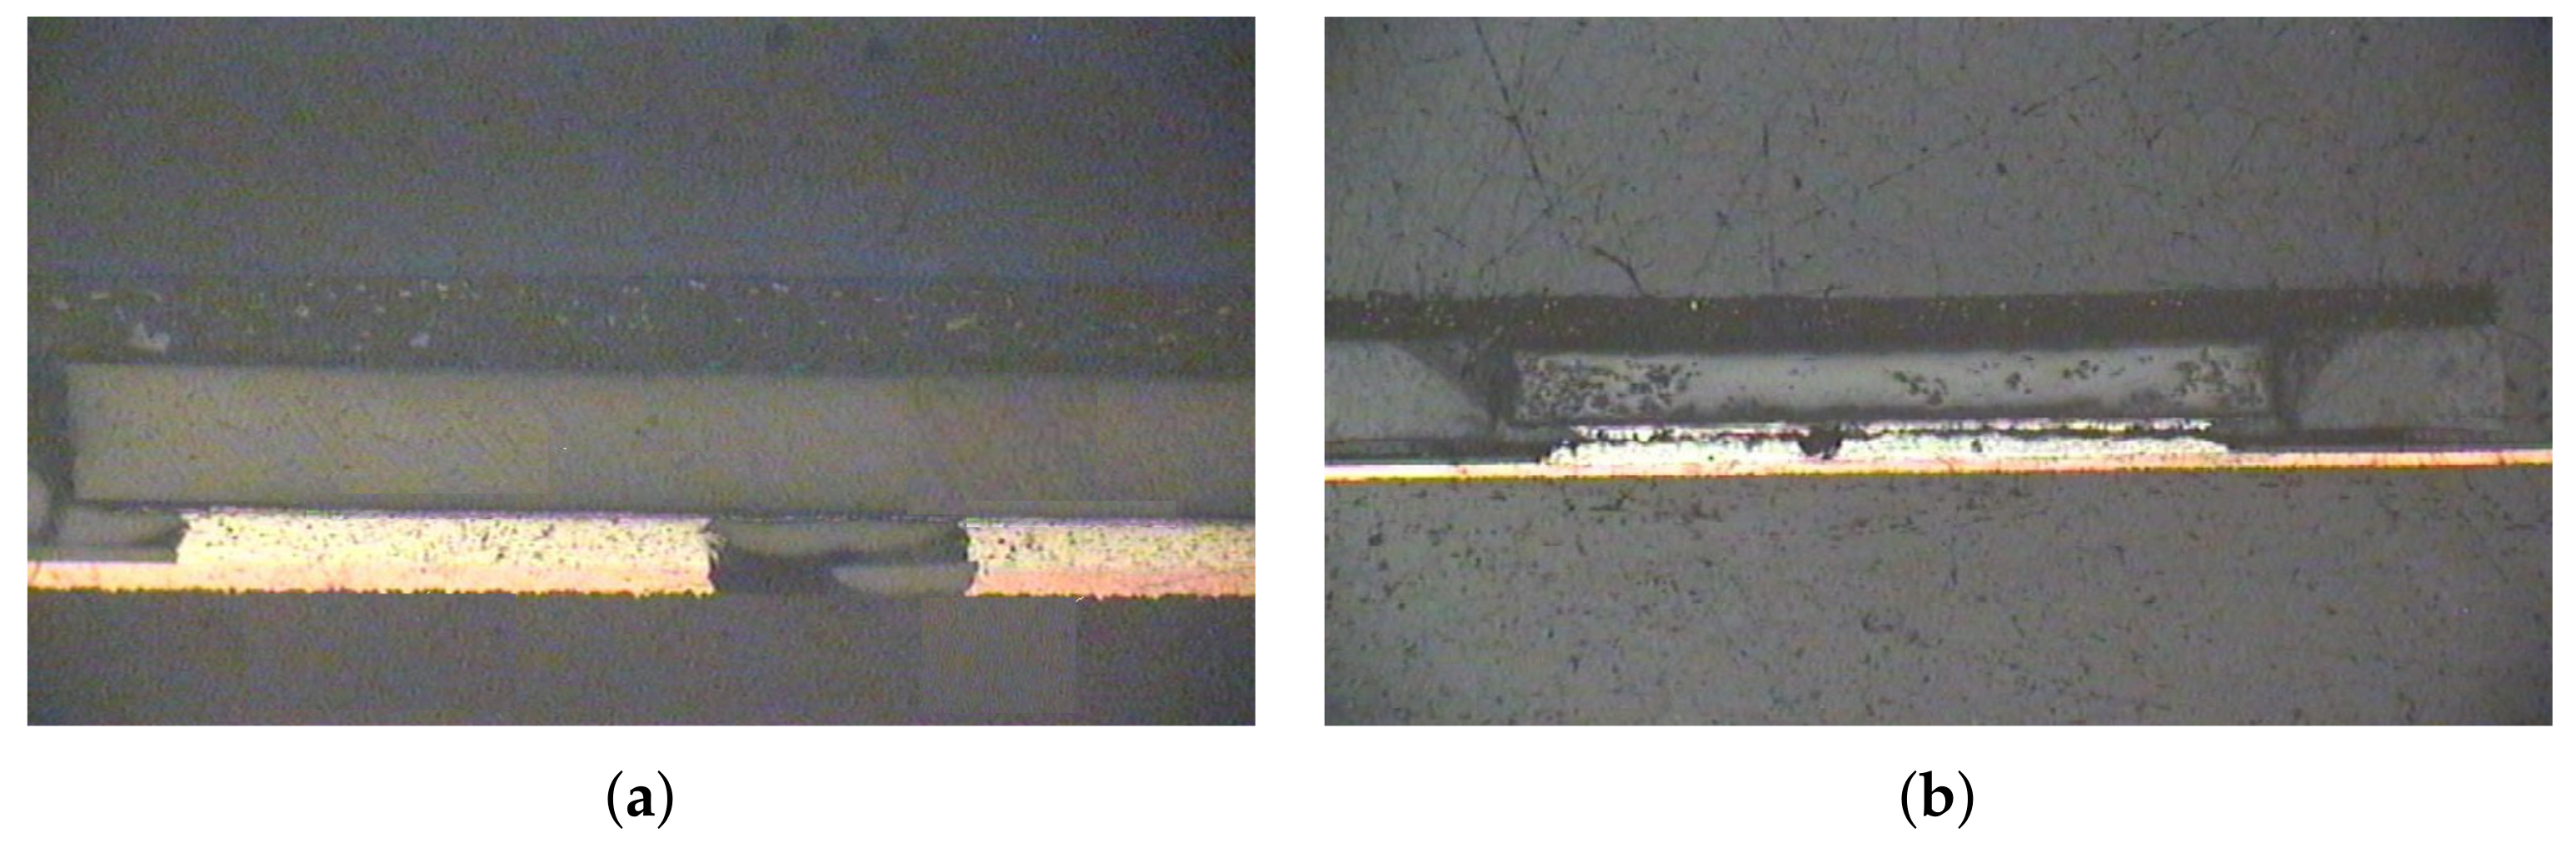
The metallographic section is a complete analysis of the physical structure of all components in a circuit. This technique is widely used to evaluate the reliability of the solder joint but has the disadvantage of being a destructive method. In our workn this analysis was used to validate the results obtained by the voltage measurement method. The analysis was made and analyzed using the Axioplan Zeiss microscope. The metallographic section shows the solder joint between LED and PCB. In Figure 8a, a metallographic section of a non-failed SJL is presented. The SJL has no cracks. It guarantees the correct electrical operation without any increase in forward voltage.
5. Discussion
The aim of this work was not to characterize the lifetime of the LED but to provide a testing method usable to furnish significant evaluation in lighting applications. In this paper, a validation of 2% failure criterion proposed by Osram was carried out. Results of our paper check the validity of this criterion to detect the presence of cracks in the SJL. At 1900 cycles 4.1% of the considered SJL have an increase of 2% of Vf.
In the analysis of failure, the reliability and the probability of failure were calculated. The analysis demonstrates that the probability of failure grows exponentially related to the thermal cycles variation. As can be seen from Table 1, the Vf increase grows at each cycle with the number of thermal cycles. Results show the correlation between the solder joint fatigue and the number of thermal cycles. The AF was determined using the Norris–Landberg model by which the SJL lifetime is calculated.
The lifetime variation according to the number of cycles and the number of failed SJLs was analyzed. The SJL lifetime increases linearly with the number of thermal cycles, as can be deduced from Equation (5). On the contrary, the trend of the lifetime related to the number of failed SJLs was approximated with the normal distribution.
6. Conclusions
This paper proposes to validate the criterion of 2% increase in Vf to detect cracks in the SJL. In order to reduce test and response time, an accelerated test was carried out. TCT was chosen because it is the most used test in the scientific community. In total, 1900 thermal cycles were performed and the comparison between Vf and the reference value was calculated. A difference greater than 2% represents the failure criterion for SJL.
In the experimental protocol, 40 circuits with 1800 LEDs were subjected to the TCT and 4.1% of the SJLs failed. The probability of failure obtained has an exponential trend. The SJL lifetime was determined using the Norris–Landberg Model. From obtained results, 95.9% of the considered SJL had a lifetime greater than 20 years. This method was validated by comparing the results of Vf increase with the X-ray analysis and the metallographic section. The comparison allows us to conclude that all the SJLs that showed an increase in Vf actually present cracks.
Obviously, this is not the only parameter to consider in calculating the lifetime of a product, where the overall duration is given by the component with the shortest lifetime; however, the proposed parameter represents a validated method that allows companies to estimate the SJL duration in a short time and to calibrate the guarantees also based on these results.
Author Contributions
Formal analysis, F.P.; funding acquisition, M.G. and P.P.; investigation, A.B. and L.P.; methodology, F.P. and A.B.; project administration, M.G. and P.P.; resources, F.P. and L.P.; supervision, P.P.; writing—original draft, F.P.; writing—review and editing, L.P. All authors have read and agreed to the published version of the manuscript.
Funding
This research received no external funding.
Acknowledgments
The authors are grateful to the iGuzzini Illuminazione S.p.A. (www.iguzzini.com), Silga S.p.a. (www.silga.com), Gitronica S.p.a. (www.gitronica.com) for the opportunity to carry out this research work, they also acknowledge for the technical support of the materials used for experiments.
Conflicts of Interest
The authors declare no conflicts of interest.
References
- Corral-García, J.; Lemus-Prieto, F.; González-Sánchez, J.L.; Pérez-Toledano, M.Á. Analysis of Energy Consumption and Optimization Techniques for Writing Energy-Efficient Code. Electronics 2019, 8, 1192. [Google Scholar] [CrossRef] [Green Version]
- Mataloto, B.; Ferreira, J.C.; Cruz, N. LoBEMS—IoT for Building and Energy Management Systems. Electronics 2019, 8, 763. [Google Scholar] [CrossRef] [Green Version]
- Leccese, F.; Cagnetti, M.; Trinca, D. A smart city application: A fully controlled street lighting isle based on Raspberry-Pi card, a ZigBee sensor network and WiMAX. Sensors 2014, 14, 24408–24424. [Google Scholar] [CrossRef] [PubMed] [Green Version]
- Costa, D.G.; Duran-Faundez, C. Open-source electronics platforms as enabling technologies for smart cities: Recent developments and perspectives. Electronics 2018, 7, 404. [Google Scholar] [CrossRef] [Green Version]
- Pierleoni, P.; Belli, A.; Palma, L.; Valenti, S.; Raggiunto, S.; Incipini, L.; Ceregioli, P. The Scrovegni Chapel Moves Into the Future: An Innovative Internet of Things Solution Brings New Light to Giotto’s Masterpiece. IEEE Sens. J. 2018, 18, 7681–7696. [Google Scholar] [CrossRef]
- Raggiunto, S.; Belli, A.; Palma, L.; Ceregioli, P.; Gattari, M.; Pierleoni, P. An Efficient Method for LED Light Sources Characterization. Electronics 2019, 8, 1089. [Google Scholar] [CrossRef] [Green Version]
- Chiodo, E.; Mazzanti, G. A new reliability model for power system components characterized by dynamic stress and strength. In Proceedings of the 2006 IEEE International Symposium on Power Electronics, Electrical Drives, Automation and Motion (SPEEDAM 2006), Taormina, Italy, 23–26 May 2006; pp. 840–845. [Google Scholar]
- Chiodo, E.; Di Noia, L.; Mottola, F. Electrical insulation components reliability assessment and practical Bayesian estimation under a Log-Logistic model. Int. J. Eng Technol. 2018, 7, 1072–1082. [Google Scholar] [CrossRef] [Green Version]
- Abbing, F.D.R.; Pertijs, M.A. Light-emitting diode junction-temperature sensing using differential voltage/current measurements. In Proceedings of the 10th IEEE SENSORS Conference, Limerick, Ireland, 28–31 October 2011; pp. 861–864. [Google Scholar]
- Chang, M.H.; Das, D.; Varde, P.; Pecht, M. Light emitting diodes reliability review. Microelectron Reliab. 2012, 52, 762–782. [Google Scholar] [CrossRef]
- Magnien, J.; Rose, J.; Pfeiler-Deutschmann, M.; Hammer, R.; Mitterhuber, L.; Defregger, S.; Schrank, F.; Kraker, E. Accelerated thermo-mechanical test method for LED modules. In Proceedings of the 2016 17th IEEE International Conference on Thermal, Mechanical and Multi-Physics Simulation and Experiments in Microelectronics and Microsystems (EuroSimE), Montpellier, France, 18–20 April 2016; pp. 1–6. [Google Scholar]
- Engelmaier, W. Fatigue life of leadless chip carrier solder joints during power cycling. IEEE Trans. Compon. Hybrids Manuf. Technol. 1983, 6, 232–237. [Google Scholar] [CrossRef]
- Fulmek, P.; Langer, G.; Wenzl, F.P.; Nemitz, W.; Schweitzer, S.; Hoschopf, H.; Nicolics, J. Direct junction temperature measurement in high-power leds. In Proceedings of the 2014 37th IEEE International Spring Seminar on Electronics Technology, Dresden, Germany, 7–11 May 2014; pp. 58–63. [Google Scholar]
- Ekpu, M.; Bhatti, R.; Okereke, M.I.; Mallik, S.; Otiaba, K. Fatigue life of lead-free solder thermal interface materials at varying bond line thickness in microelectronics. Microelectron. Reliab. 2014, 54, 239–244. [Google Scholar] [CrossRef]
- Yunus, M.; Srihari, K.; Pitarresi, J.M.; Primavera, A. Effect of voids on the reliability of BGA/CSP solder joints. Microelectron. Reliab. 2003, 43, 2077–2086. [Google Scholar] [CrossRef]
- Zhao, X.; Caers, J.; Noijen, S.; Zhong, Y.; De Jong, M.; Gijsbers, H.; Elger, G.; Willwohl, H. Potential interconnect technologies for high power LEDs assemblies. In Proceedings of the 2012 4th IEEE Electronic System-Integration Technology Conference, Amsterdam, The Netherlands, 17–20 September 2012; pp. 1–8. [Google Scholar]
- Pan, J.; Silk, J. A study of solder joint failure criteria. In Proceedings of the International Symposium on Microelectronics. International Microelectronics Assembly and Packaging Society, Long Beach, CA, USA, 9–13 October 2011; pp. 000694–000702. [Google Scholar]
- Lee, W.; Nguyen, L.; Selvaduray, G.S. Solder joint fatigue models: review and applicability to chip scale packages. Microelectron. Reliab. 2000, 40, 231–244. [Google Scholar] [CrossRef]
- Zhao, X.; Watte, P.; de Vries, H.; van Hees, G. Challenges in Predicting the Solder Interconnect Lifetime of High Power Electronics. In Proceedings of the 2018 19th IEEE International Conference on Electronic Packaging Technology (ICEPT), Shanghai, China, 8–11 August 2018; pp. 1511–1517. [Google Scholar]
- Elger, G.; Kandaswamy, S.V.; Derix, R.; Conti, F. Detection of solder joint cracking of high power leds on AI-IMS during temperature shock test by transient thermal analysis. In Proceedings of the 20th IEEE International Workshop on Thermal Investigations of ICs and Systems, London, UK, 24–26 September 2014; pp. 1–6. [Google Scholar]
- Suhling, J.C.; Gale, H.; Wayne Johnson, R.; Nokibul Islam, M.; Shete, T.; Lall, P.; Bozack, M.J.; Evans, J.L.; Seto, P.; Gupta, T.; et al. Thermal cycling reliability of lead-free chip resistor solder joints. Solder. Surf. Mount Technol. 2004, 16, 77–87. [Google Scholar] [CrossRef]
- Farooq, M.; Goldmann, L.; Martin, G.; Goldsmith, C.; Bergeron, C. Thermo-mechanical fatigue reliability of Pb-free ceramic ball grid arrays: Experimental data and lifetime prediction modeling. In Proceedings of the 53rd IEEE Electronic Components and Technology Conference, New Orleans, LA, USA, 27–30 May 2003; pp. 827–833. [Google Scholar]
- Lau, J.; Hoo, N.; Horsley, R.; Smetana, J.; Shangguan, D.; Dauksher, W.; Love, D.; Menis, I.; Sullivan, B. Reliability testing and data analysis of lead-free solder joints for high-density packages. Solder. Surf. Mount Technol. 2004, 16, 46–68. [Google Scholar] [CrossRef]
- Henshall, G.; Bath, J.; Sethuraman, S.; Geiger, D.; Syed, A.; Lee, M.; Newman, K.; Hu, L.; Kim, D.; Xie, W.; et al. Comparison of thermal fatigue performance of SAC105 (Sn-1.0 Ag-0.5 Cu), Sn-3.5 Ag, and SAC305 (Sn-3.0 Ag-0.5 Cu) BGA components with SAC305 solder paste. In Proceedings of the IPC APEX EXPO, Bannockburn, IL, USA, 31 March–2 April 2009. [Google Scholar]
- Soltani, M.; Freyburger, M.; Kulkarni, R.; Mohr, R.; Groezinger, T.; Zimmermann, A. Reliability study and thermal performance of LEDs on molded interconnect devices (MID) and PCB. IEEE Access 2018, 6, 51669–51679. [Google Scholar] [CrossRef]
- GmbH, O. New Package Technology for SSL High Power. Available online: https://fhi.nl/app/uploads/sites/32/2017/09/RUTRONIK-BELGIE.pdf (accessed on 13 May 2020).
- Tek. Keithley 2400 SourceMeter User’s Manual. Available online: https://www.tek.com/datasheet/series-2400-sourcemeter-instruments (accessed on 13 May 2020).
- Tek. Keithley 2400 Specifications. Available online: https://download.tek.com/manual/2400S-900-01_K-Sep2011_User.pdf (accessed on 13 May 2020).
- Chen, Q.; Chen, Q.; Luo, X. Fast estimation of LED’s accelerated lifetime by online test method. In Proceedings of the 2014 64th Electronic Components and Technology Conference (ECTC), Orlando, FL, USA, 27–30 May 2014; pp. 1992–1995. [Google Scholar]
- Vasudevan, V.; Fan, X. An acceleration model for lead-free (SAC) solder joint reliability under thermal cycling. In Proceedings of the 2008 58th IEEE Electronic Components and Technology Conference, Lake Buena Vista, FL, USA, 27–30 May 2008; pp. 139–145. [Google Scholar]
- Alfarog, A.O.; Qu, X.; Wang, H.; Blaabjerg, F.; Li, Z. Lifetime prediction of led lighting systems considering thermal coupling between led sources and drivers. In Proceedings of the 2017 43rd IEEE Annual Conference of the Industrial Electronics Society, Beijing, China, 29 October–1 November 2017; pp. 1273–1278. [Google Scholar]
- Jiang, C.; Fan, J.; Qian, C.; Zhang, H.; Fan, X.; Guo, W.; Zhang, G. Effects of voids on mechanical and thermal properties of the die attach solder layer used in high-power LED chip-scale packages. IEEE Trans. Compon. Packag. Manuf. Technol. 2018, 8, 1254–1262. [Google Scholar] [CrossRef]
Figure 1.
Instrumentation used in the experimental protocol. The PC was connected to the Source Meter Unit (SMU) with General Purpose Interface Bus—Universal Serial Bus (GPIB-USB), the SMU and bed of nails were linked with a 4-wire connection, and the bed of nails created the electrical connection with the DUT via 4 spring contacts.
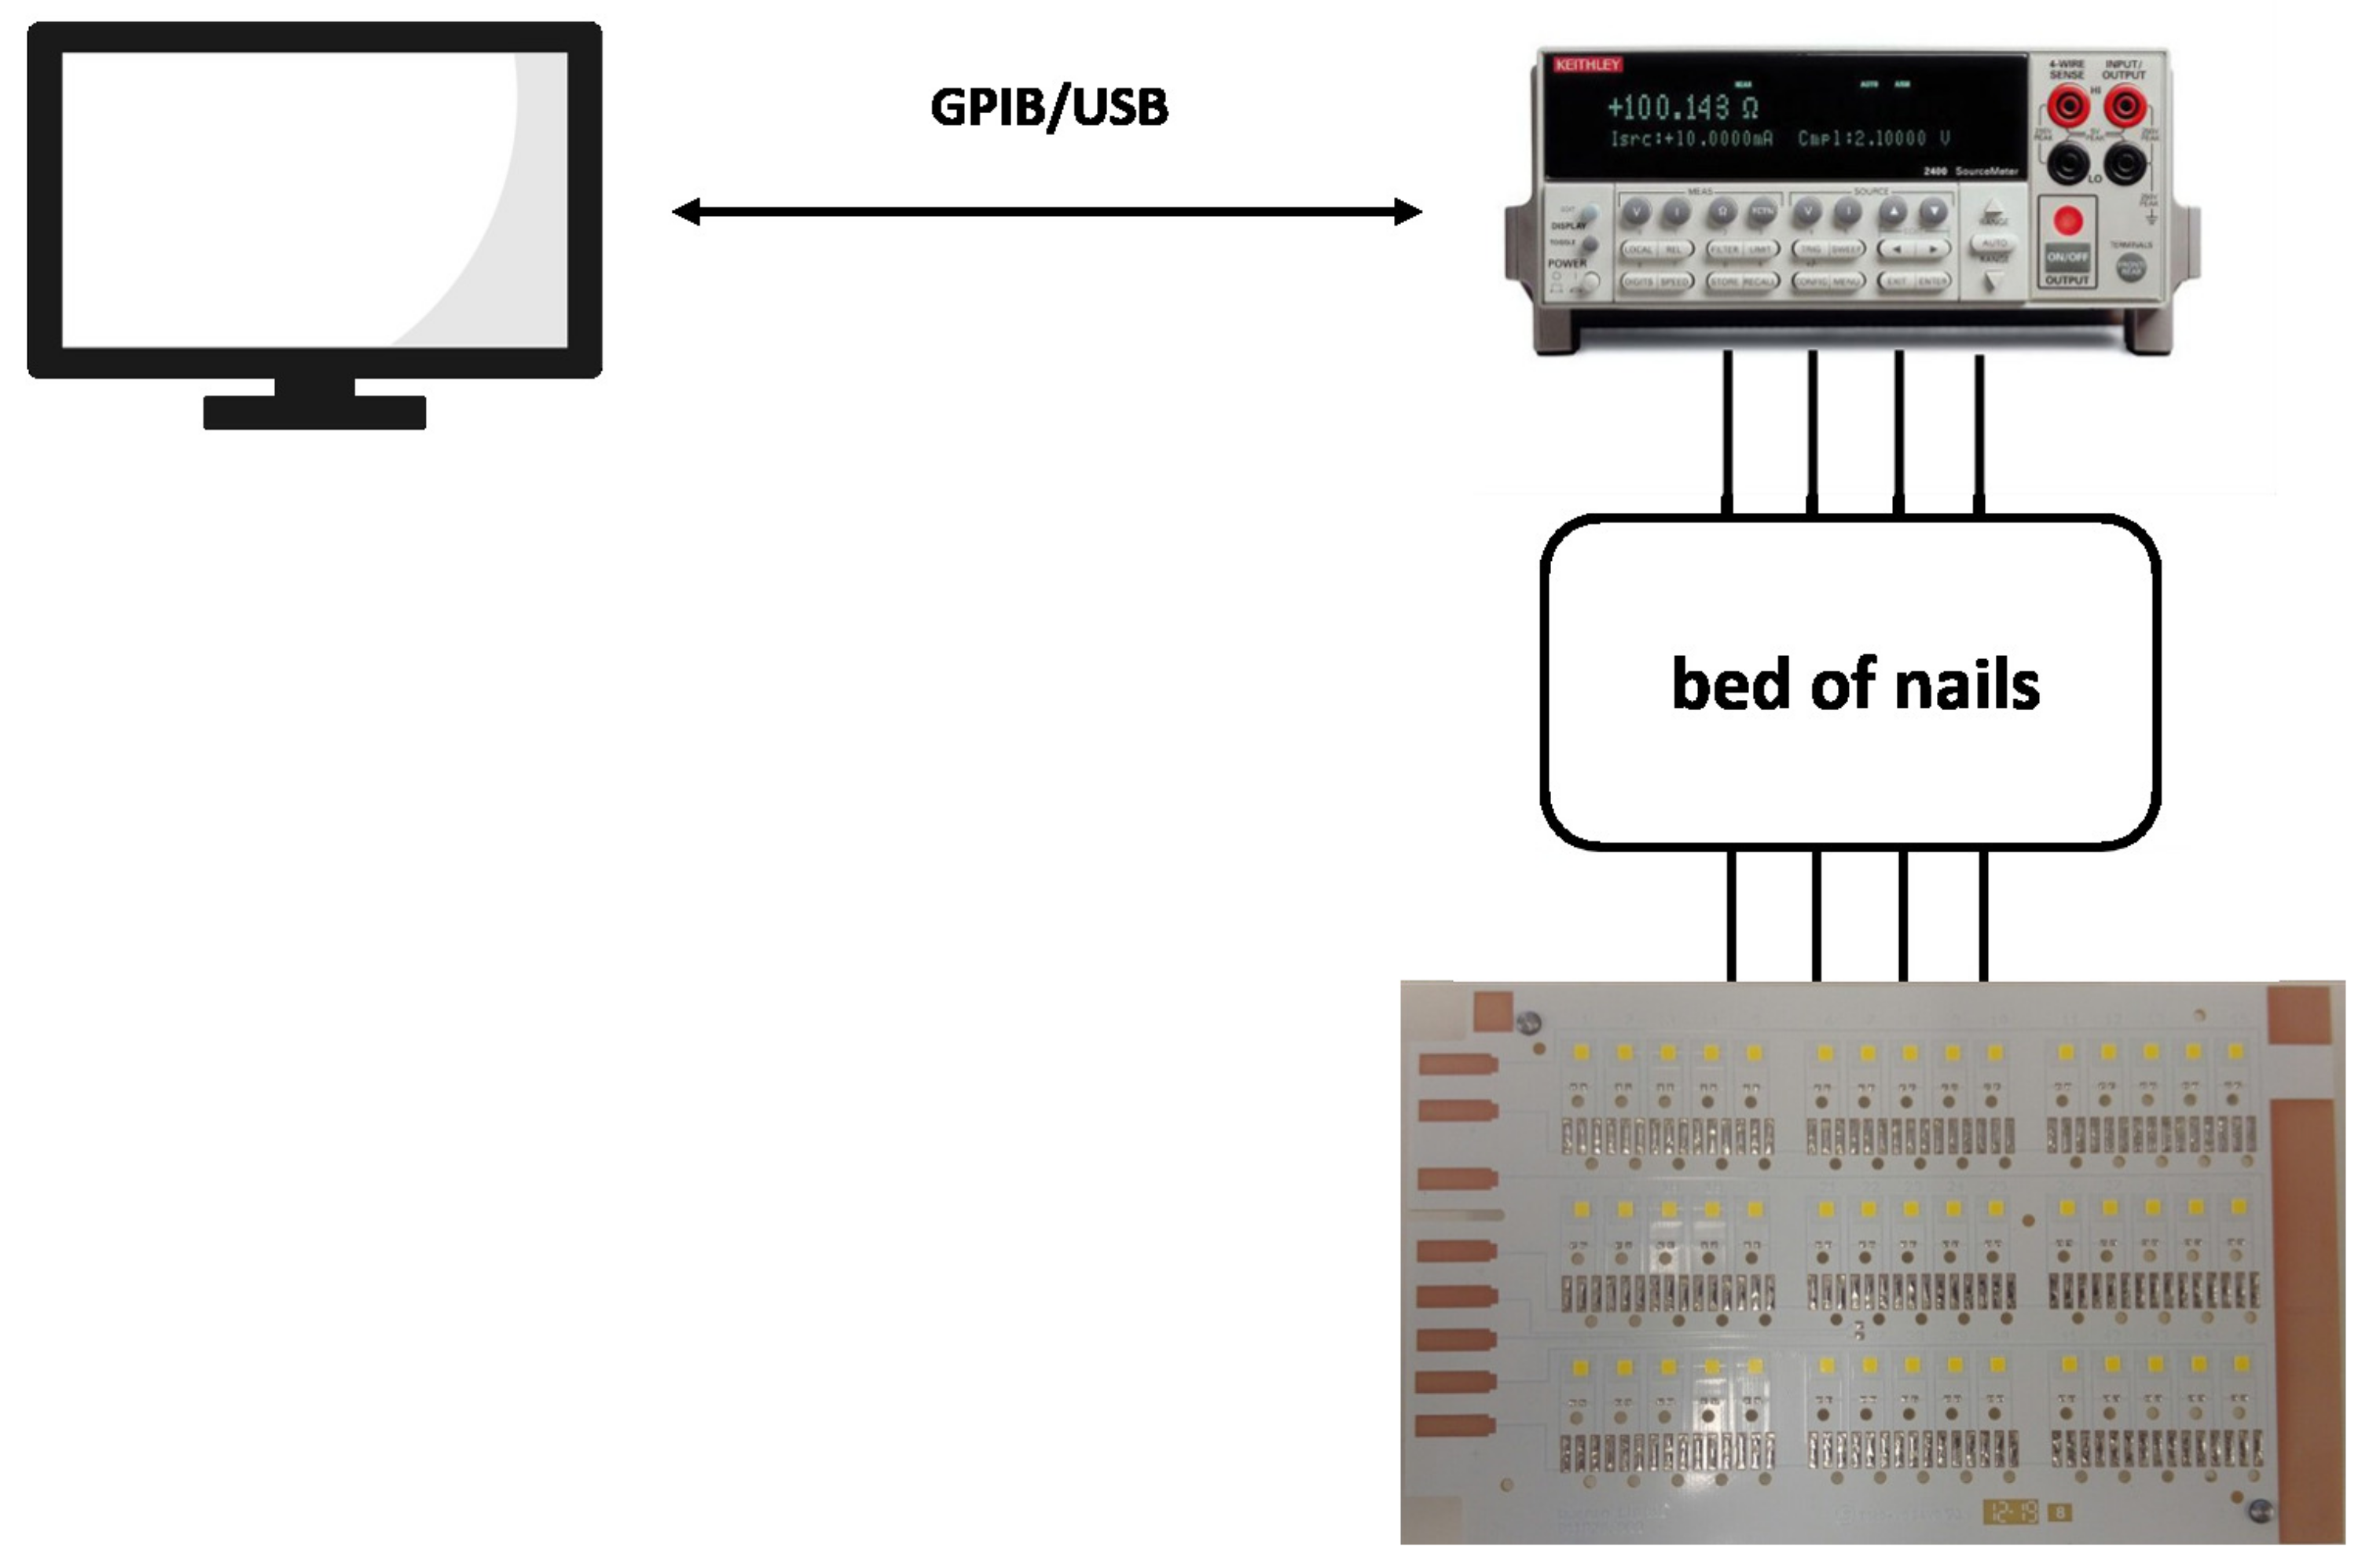
Figure 2.
(a) Circuits positioned in the climatic chamber CST 27/2T of Angelantoni test technologies. (b) A mechanical transfer carriage moves circuits from one chamber to another.
Figure 2.
(a) Circuits positioned in the climatic chamber CST 27/2T of Angelantoni test technologies. (b) A mechanical transfer carriage moves circuits from one chamber to another.
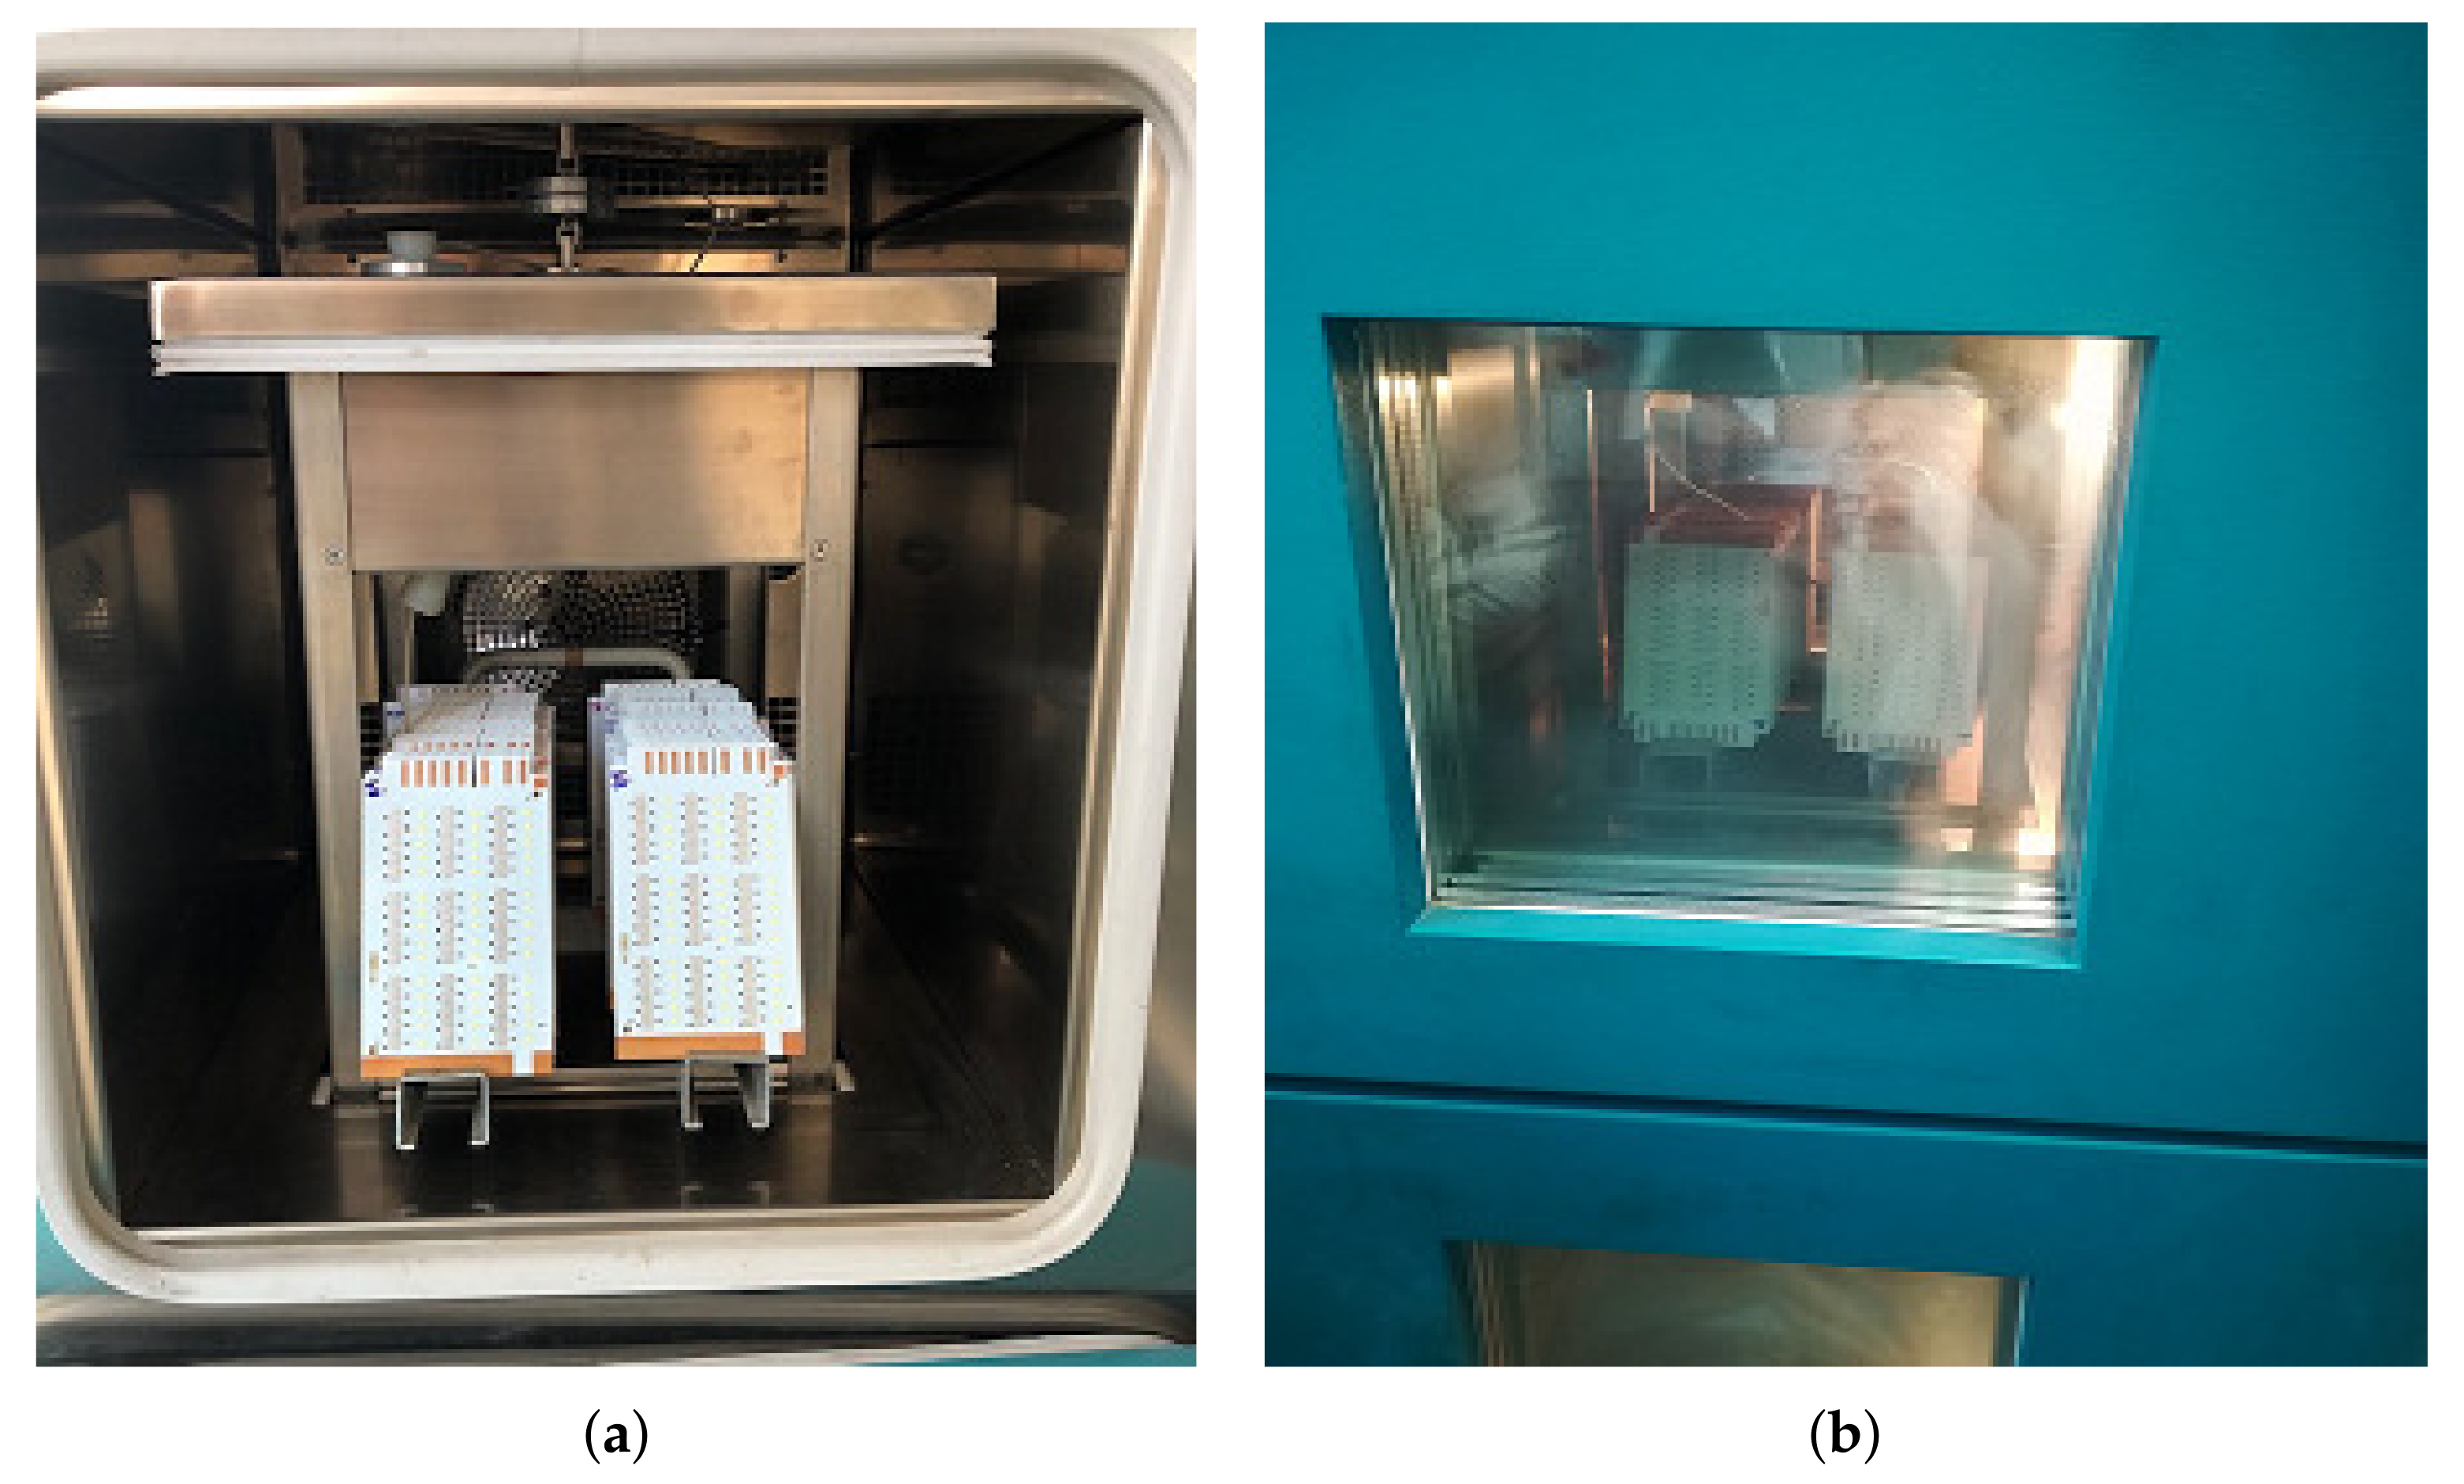
Figure 3.
Thermal profile of the Thermal Cycling Test (TCT), which the circuits were subjected to.
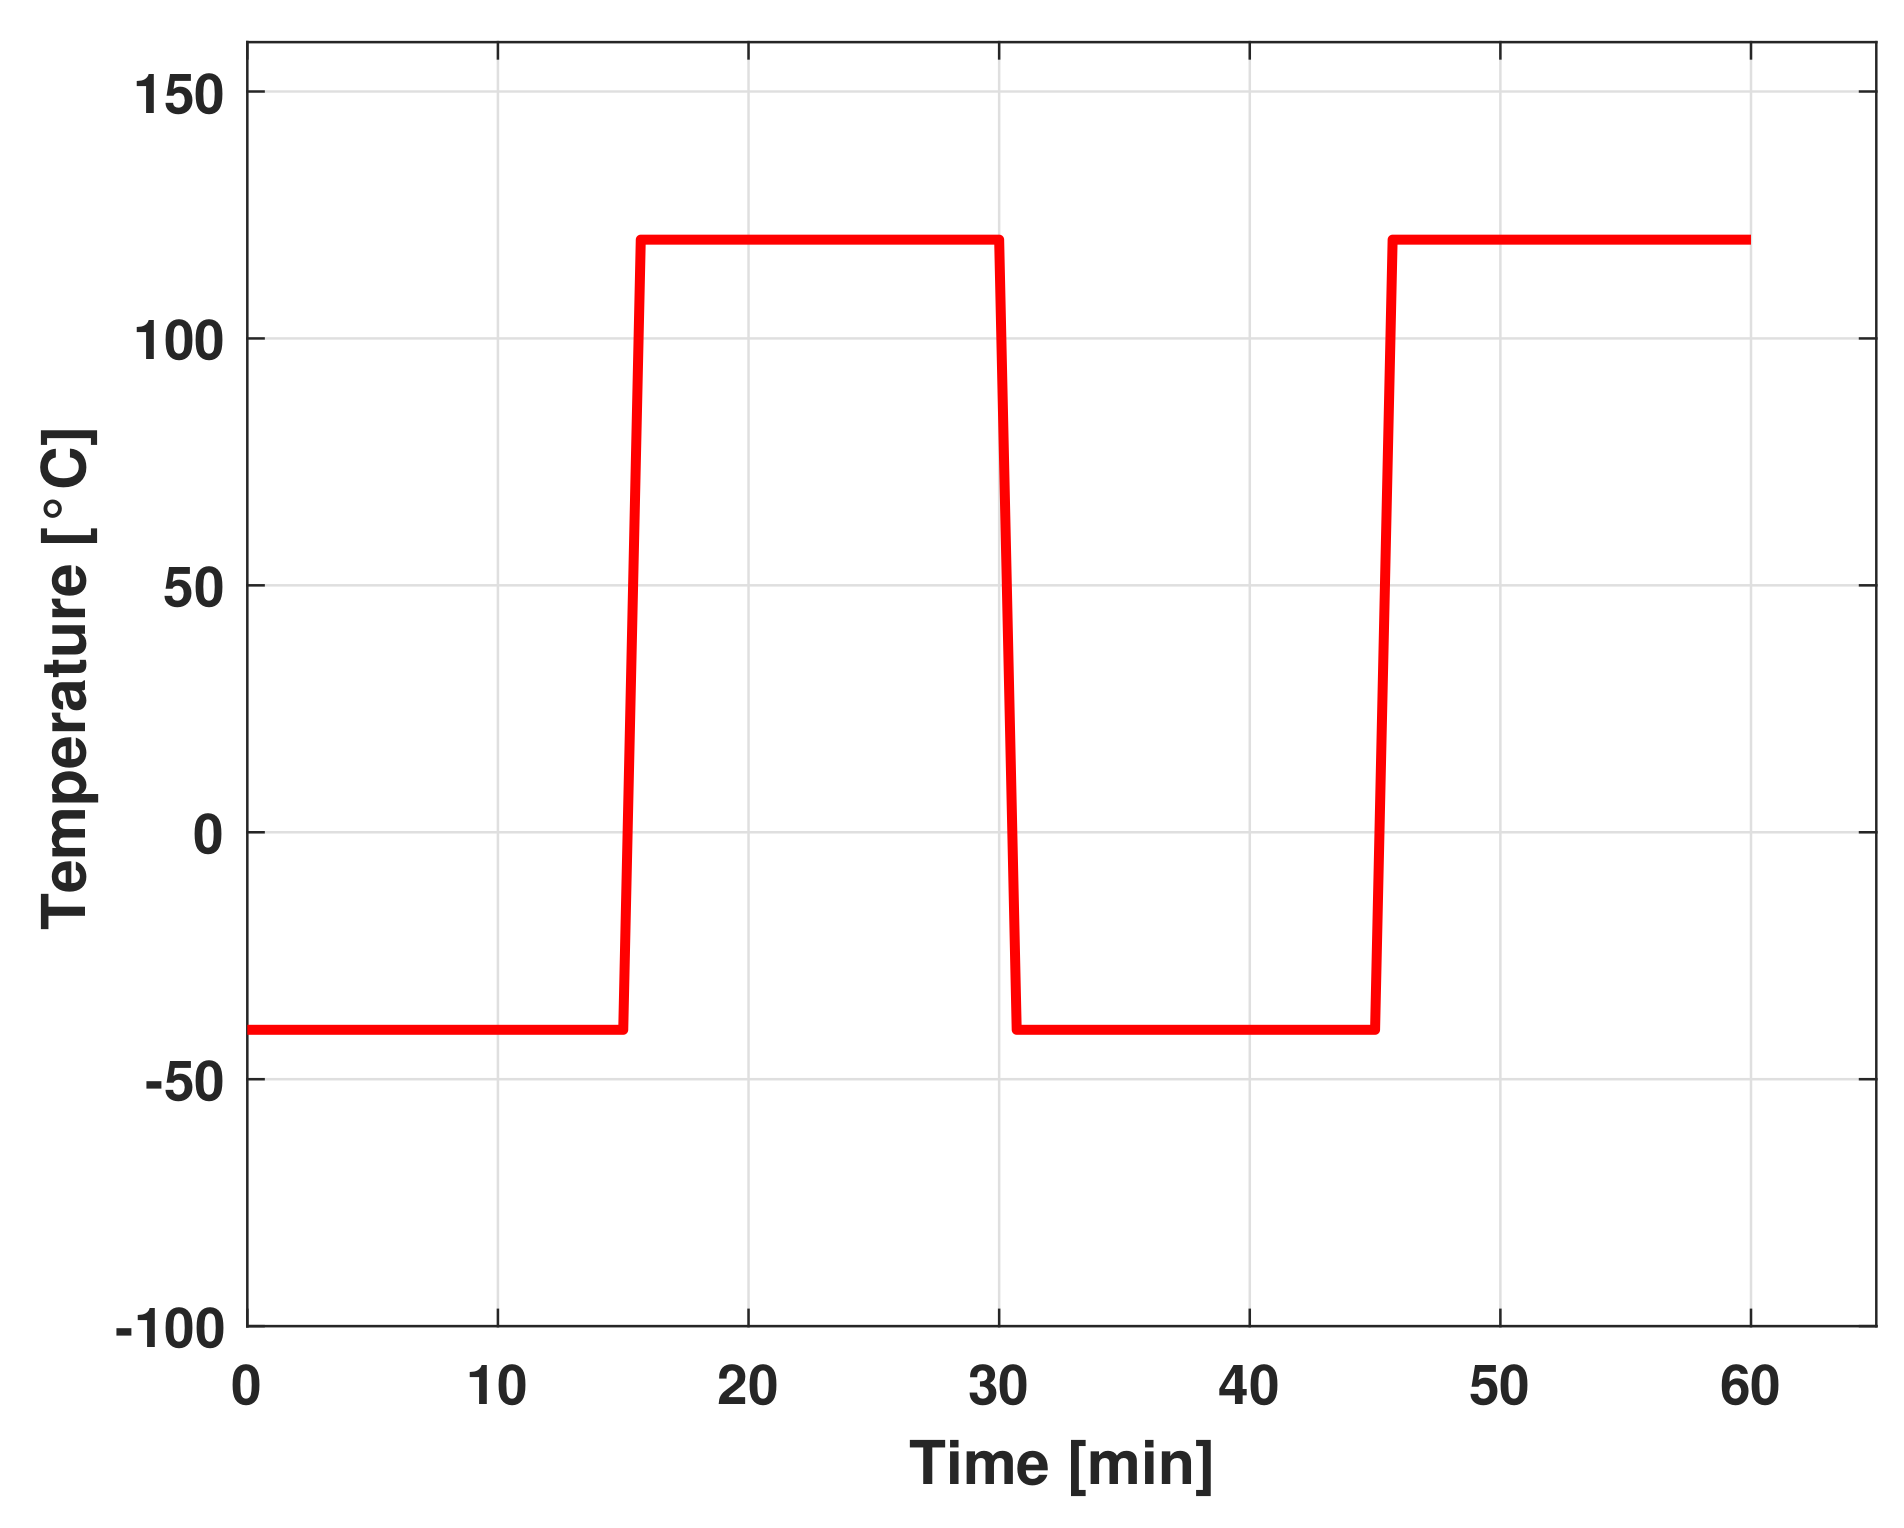
Figure 4.
Trend of the failures at each cycle. Markers represent the number of failed determined at each cycle.
Figure 4.
Trend of the failures at each cycle. Markers represent the number of failed determined at each cycle.

Figure 5.
Variation of the probability of failure related to the thermal cycles variation.
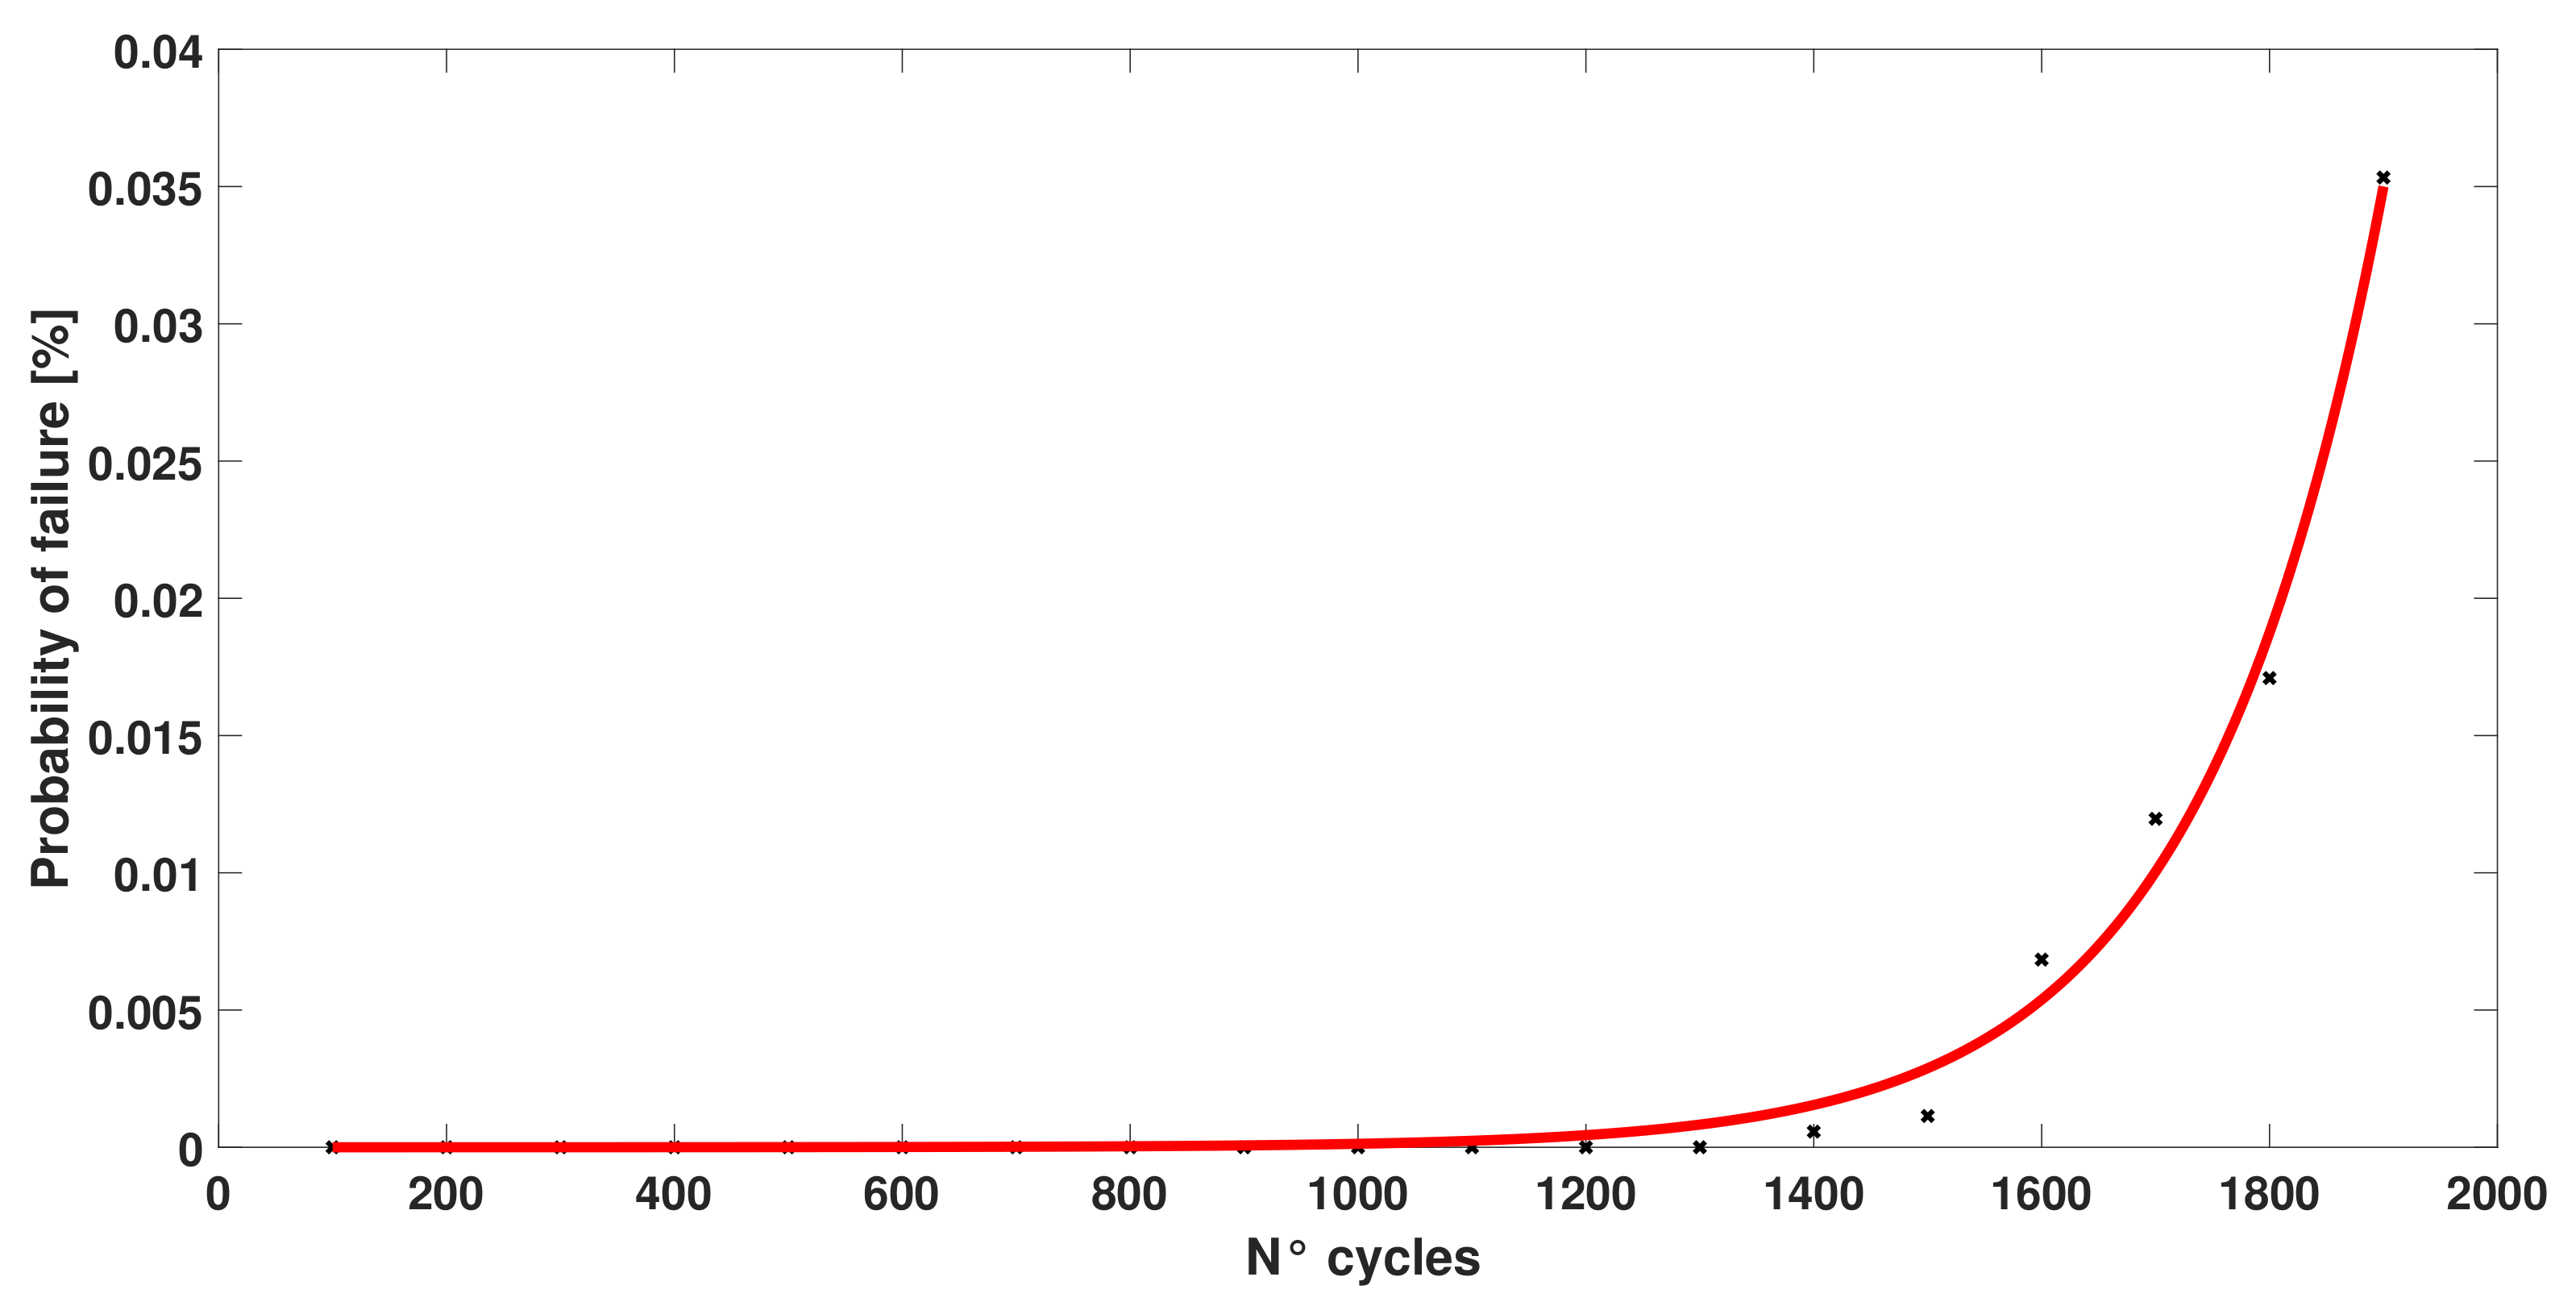
Figure 6.
Graphical representation of data using the Weibull distribution. Purple dots represent the Solder Joints of an LED (SJLs) that reached the failure at every thermal cycle; the red line describes the distribution curve of the faults.
Figure 6.
Graphical representation of data using the Weibull distribution. Purple dots represent the Solder Joints of an LED (SJLs) that reached the failure at every thermal cycle; the red line describes the distribution curve of the faults.
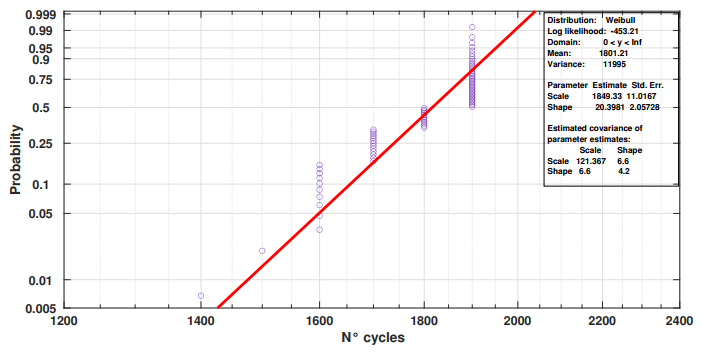
Figure 7.
(a) X-ray analysis of an LED that has not undergone TCT, red circles underline the voids present in the joint. (b) X-ray analysis of a failed SJL with voids and cracks pointed out by red circles.
Figure 7.
(a) X-ray analysis of an LED that has not undergone TCT, red circles underline the voids present in the joint. (b) X-ray analysis of a failed SJL with voids and cracks pointed out by red circles.
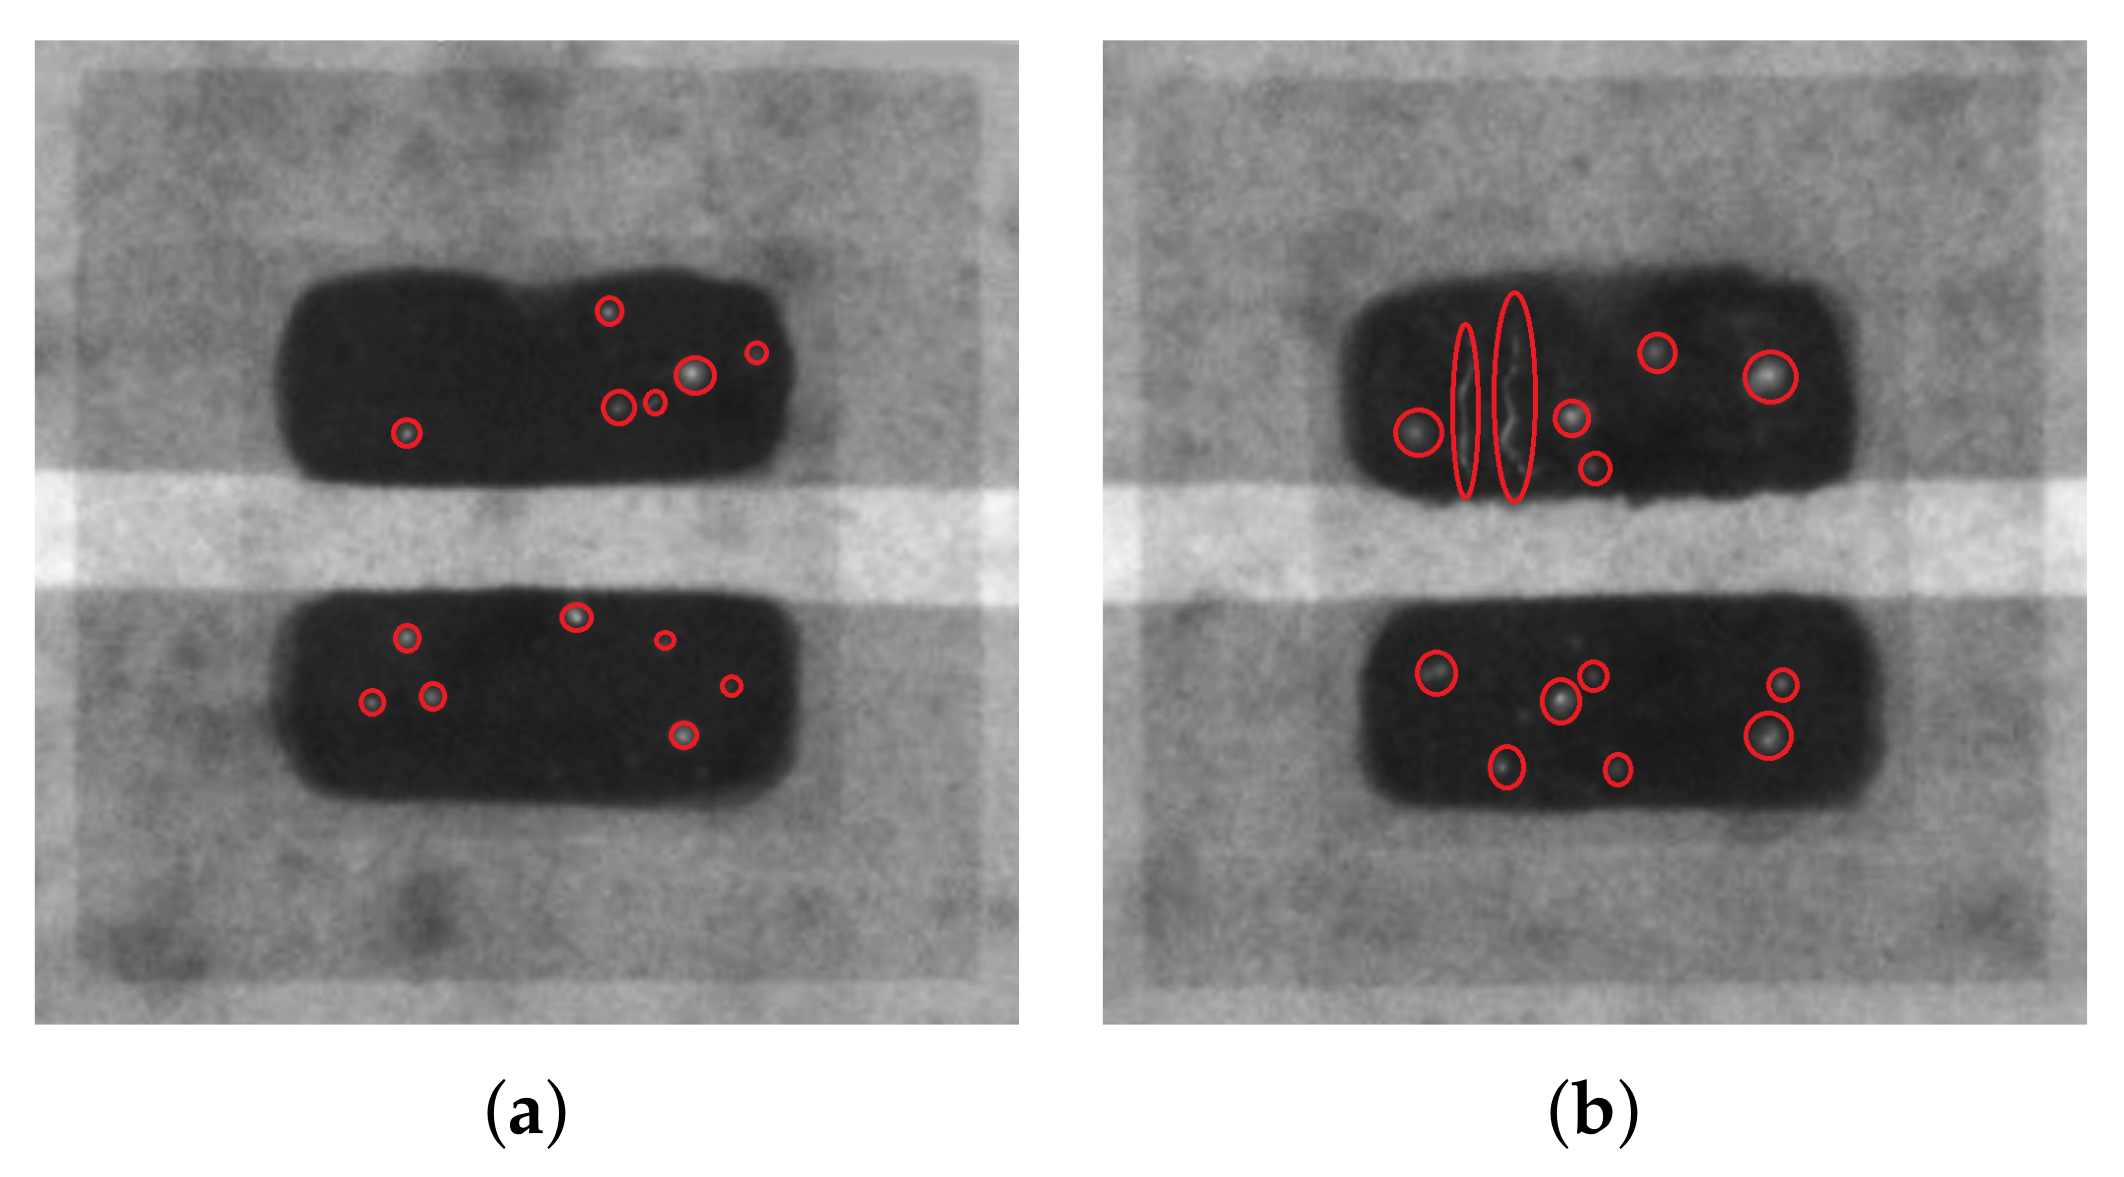
Figure 8.
(a) A metallographic section of an unbroken SJL with no cracks. (b) A metallographic section of a broken SJL with evident transverse cracks.
Figure 8.
(a) A metallographic section of an unbroken SJL with no cracks. (b) A metallographic section of a broken SJL with evident transverse cracks.

Table 1.
The first column presents the thermal cycles, the second the number of failed SJLs at each cycle, and the third the total number of failed at each cycle. The fourth column presents the average increase in Forward Voltage (Vf) and the related standard deviation. Last column reports the SJL lifetime.
| N° Cycles | SJLs Failed | Total SJLs Failed | Vf Increase | SJL Lifetime (AF = 28.8) |
|---|---|---|---|---|
| (Samples) | (Samples) | (Mean ± std) (%) | (Years) | |
| 100 | 0 | 0 | 0 | N/A |
| 200 | 0 | 0 | 0 | N/A |
| 300 | 0 | 0 | 0 | N/A |
| 400 | 0 | 0 | 0 | N/A |
| 500 | 0 | 0 | 0 | N/A |
| 600 | 0 | 0 | 0 | N/A |
| 700 | 0 | 0 | 0 | N/A |
| 800 | 0 | 0 | 0 | N/A |
| 900 | 0 | 0 | 0 | N/A |
| 1000 | 0 | 0 | 0 | N/A |
| 1100 | 0 | 0 | 0 | N/A |
| 1200 | 0 | 0 | 0 | N/A |
| 1300 | 0 | 0 | 0 | N/A |
| 1400 | 1 | 1 | 3.6 ± 0.0 | 17.1 |
| 1500 | 1 | 2 | 3.3 ± 0.6 | 18.4 |
| 1600 | 10 | 12 | 3.6 ± 1.4 | 19.7 |
| 1700 | 13 | 25 | 4.1 ± 1.8 | 21.1 |
| 1800 | 12 | 37 | 4.3 ± 2.1 | 22.4 |
| 1900 | 37 | 74 | 4.5 ± 2.8 | 23.7 |
© 2020 by the authors. Licensee MDPI, Basel, Switzerland. This article is an open access article distributed under the terms and conditions of the Creative Commons Attribution (CC BY) license (http://creativecommons.org/licenses/by/4.0/).
Share and Cite
MDPI and ACS Style
Pinti, F.; Belli, A.; Palma, L.; Gattari, M.; Pierleoni, P. Validation of Forward Voltage Method to Estimate Cracks of the Solder Joints in High Power LED. Electronics 2020, 9, 920. https://doi.org/10.3390/electronics9060920
AMA Style
Pinti F, Belli A, Palma L, Gattari M, Pierleoni P. Validation of Forward Voltage Method to Estimate Cracks of the Solder Joints in High Power LED. Electronics. 2020; 9(6):920. https://doi.org/10.3390/electronics9060920
Chicago/Turabian StylePinti, Federica, Alberto Belli, Lorenzo Palma, Massimo Gattari, and Paola Pierleoni. 2020. "Validation of Forward Voltage Method to Estimate Cracks of the Solder Joints in High Power LED" Electronics 9, no. 6: 920. https://doi.org/10.3390/electronics9060920
Note that from the first issue of 2016, this journal uses article numbers instead of page numbers. See further details here.