Machine Learning to Ensure Data Integrity in Power System Topological Network Database


1
School of IT, Deakin University, Geelong, VIC 3216, Australia
2
Department of Computer Science and Information Technology, La Trobe University, Bundoora, VIC 3086, Australia
3
Centre for Intelligent Systems (CIS), Central Queensland University, Rockhampton, QLD 4701, Australia
4
School of Engineering, Deakin University, Geelong, VIC 3216, Australia
5
Department of Computer Science and Software Engineering, RMIT University, Melbourne, VIC 3000, Australia
*
Author to whom correspondence should be addressed.
†
Current address: 75 Pigdons Rd, Waurn Ponds VIC 3216, Australia.
Electronics 2020, 9(4), 693; https://doi.org/10.3390/electronics9040693
Submission received: 29 March 2020
/
Revised: 17 April 2020
/
Accepted: 20 April 2020
/
Published: 24 April 2020
(This article belongs to the Special Issue Applications of IoT for Microgrids)
Abstract
:Operational and planning modules of energy systems heavily depend on the information of the underlying topological and electric parameters, which are often kept in database within the operation centre. Therefore, these operational and planning modules are vulnerable to cyber anomalies due to accidental or deliberate changes in the power system database model. To validate, we have demonstrated the impact of cyber-anomalies on the database model used for operation of energy systems. To counter these cyber-anomalies, we have proposed a defence mechanism based on widely accepted classification techniques to identify the abnormal class of anomalies. In this study, we find that our proposed method based on multilayer perceptron (MLP), which is a special class of feedforward artificial neural network (ANN), outperforms other exiting techniques. The proposed method is validated using IEEE 33-bus and 24-bus reliability test system and analysed using ten different datasets to show the effectiveness of the proposed method in securing the Optimal Power Flow (OPF) module against data integrity anomalies. This paper highlights that the proposed machine learning-based anomaly detection technique successfully identifies the energy database manipulation at a high detection rate allowing only few false alarms.
1. Introduction
In recent years, reassurance of information integrity in the energy sector has become crucial as several cyber security vulnerabilities on the complex energy system infrastructure have proven to be related to data anomalies. In 2010, the invention of “the Stuxnet worm” [1] has made the industrial and research communities more concerned about the data integrity, privacy and confidentiality of the real-time operation of control centres. In a recent report of the “Industrial Control Systems Cyber Emergency Response Team (ICS-CERT)”, it has been mentioned that among the 200 cyber security incidents that happened across all the critical infrastructure in 2013, the maximum number of attacks (111 in incidents) are observed in the energy sector (53%) [2].
Due to smartisation of the grid, physical energy systems are highly coupled with the Information and Communication Technology (ICT)-based cyber systems. These introduced new security vulnerabilities and threats that need to be addressed using appropriate advanced techniques. As the current security approaches are developed focusing on the physical grid only, they are either not applicable or incompatible or simply inadequate to protect today’s power grids [3].
While physical energy system research has a long history, research focusing on cyber-security of a smart energy system is passing its early age. The new class of cyberattacks named “False Data Injection (FDI) Attack” targeting smart energy systems presented in [4] shows that the malicious modification of the measurement data may make DC state estimation vulnerable to malicious modification. Generally, the utility control centres are used to calculate the energy system’s states by minimising the errors between the calculated and measurement data. The authors in [4] have proposed heuristic approaches to counter both random attacks and targeted attacks in the DC state estimation. Further enhancement of this work can be found in [5]. While the research works in [4,5] focus on the unidentified attack construction, other research works are focused on developing the attack defence model [6,7] to counter those attacks. Another subclass of the FDI attack is named “Load Redistribution (LR)” attack, which can artificially increase or decrease in demand at load buses by keeping total change of load as zero [8,9]. It is important to note that the aforementioned FDI and LR attacks assume that the compromised measurement data are used to introduce an attack into the grid, although attacks can be generated by other means.
A survey on different types of cyberattacks designed for the smart grid is presented in [10,11]. Although some research works have been conducted on cyberattacks in Energy Systems [4,5,6,7,10], only a few considered Database Manipulation (DM) attacks. In [12], authors have proposed an anomaly based Intrusion Detection System (IDS) using Principle Component Analysis (PCA) to protect the database that stores the power system model. The IDS is then employed to detect anomalies in the network power flows due to database manipulation. However, the performance of the PCA based technique in [12] is highly dependent on the empirical tuning of the threshold value, which is used for anomaly detection. Another anomaly detection method is proposed in [13] to solve a similar type of problem as in [12]. The output power from a pre-trained Artificial Neural Network (ANN) and OPF module are compared to detect an intrusion in [13].
In this work, we implement an efficient multilayer perceptron (MLP) based classification approach to detect DB intrusions of a power system. With extensive experimental evaluation, we have observed that MLP is very good fit to detect the intrusions that exist in a power system database. As there is no actual data of power system database attacks [12], this paper creates its possible scenarios to simulate both the normal profile and attack profile (labelled data). In order to consider a wide range of possible scenarios, we consider the attack cases discussed in [12] and in [13] as well as additional potential attack cases. These attack cases include database parameters alteration, insertion or deletion by various means. Once we obtain the labelled dataset, we train it using MLP type feed-forward ANN. Next, we test the performance of the detection model against both normal data (no attack present) and attack data (different types of modification in the database). Our test result shows that the classification based IDS technique can identify the normal instances and attack instances very accurately. We also compared the proposed method with the results reported in [12,13]. The comparison shows the proposed method has better accuracy compared with the existing state of the art ML based models.
In this work, practical load data is obtained from the repository of the Electric Power Research Institute’s (EPRI) the Smart Grid tool OpenDSS [14]. We simulate the attack scenario using IEEE benchmark power systems using MatPower [15]. The proposed method has superior accuracy and efficiency over the existing methods for a similar test setup. The detail results, presented in this manuscript, show promising prospect towards a practical implementation to secure the power system database.
2. Background and Related Work
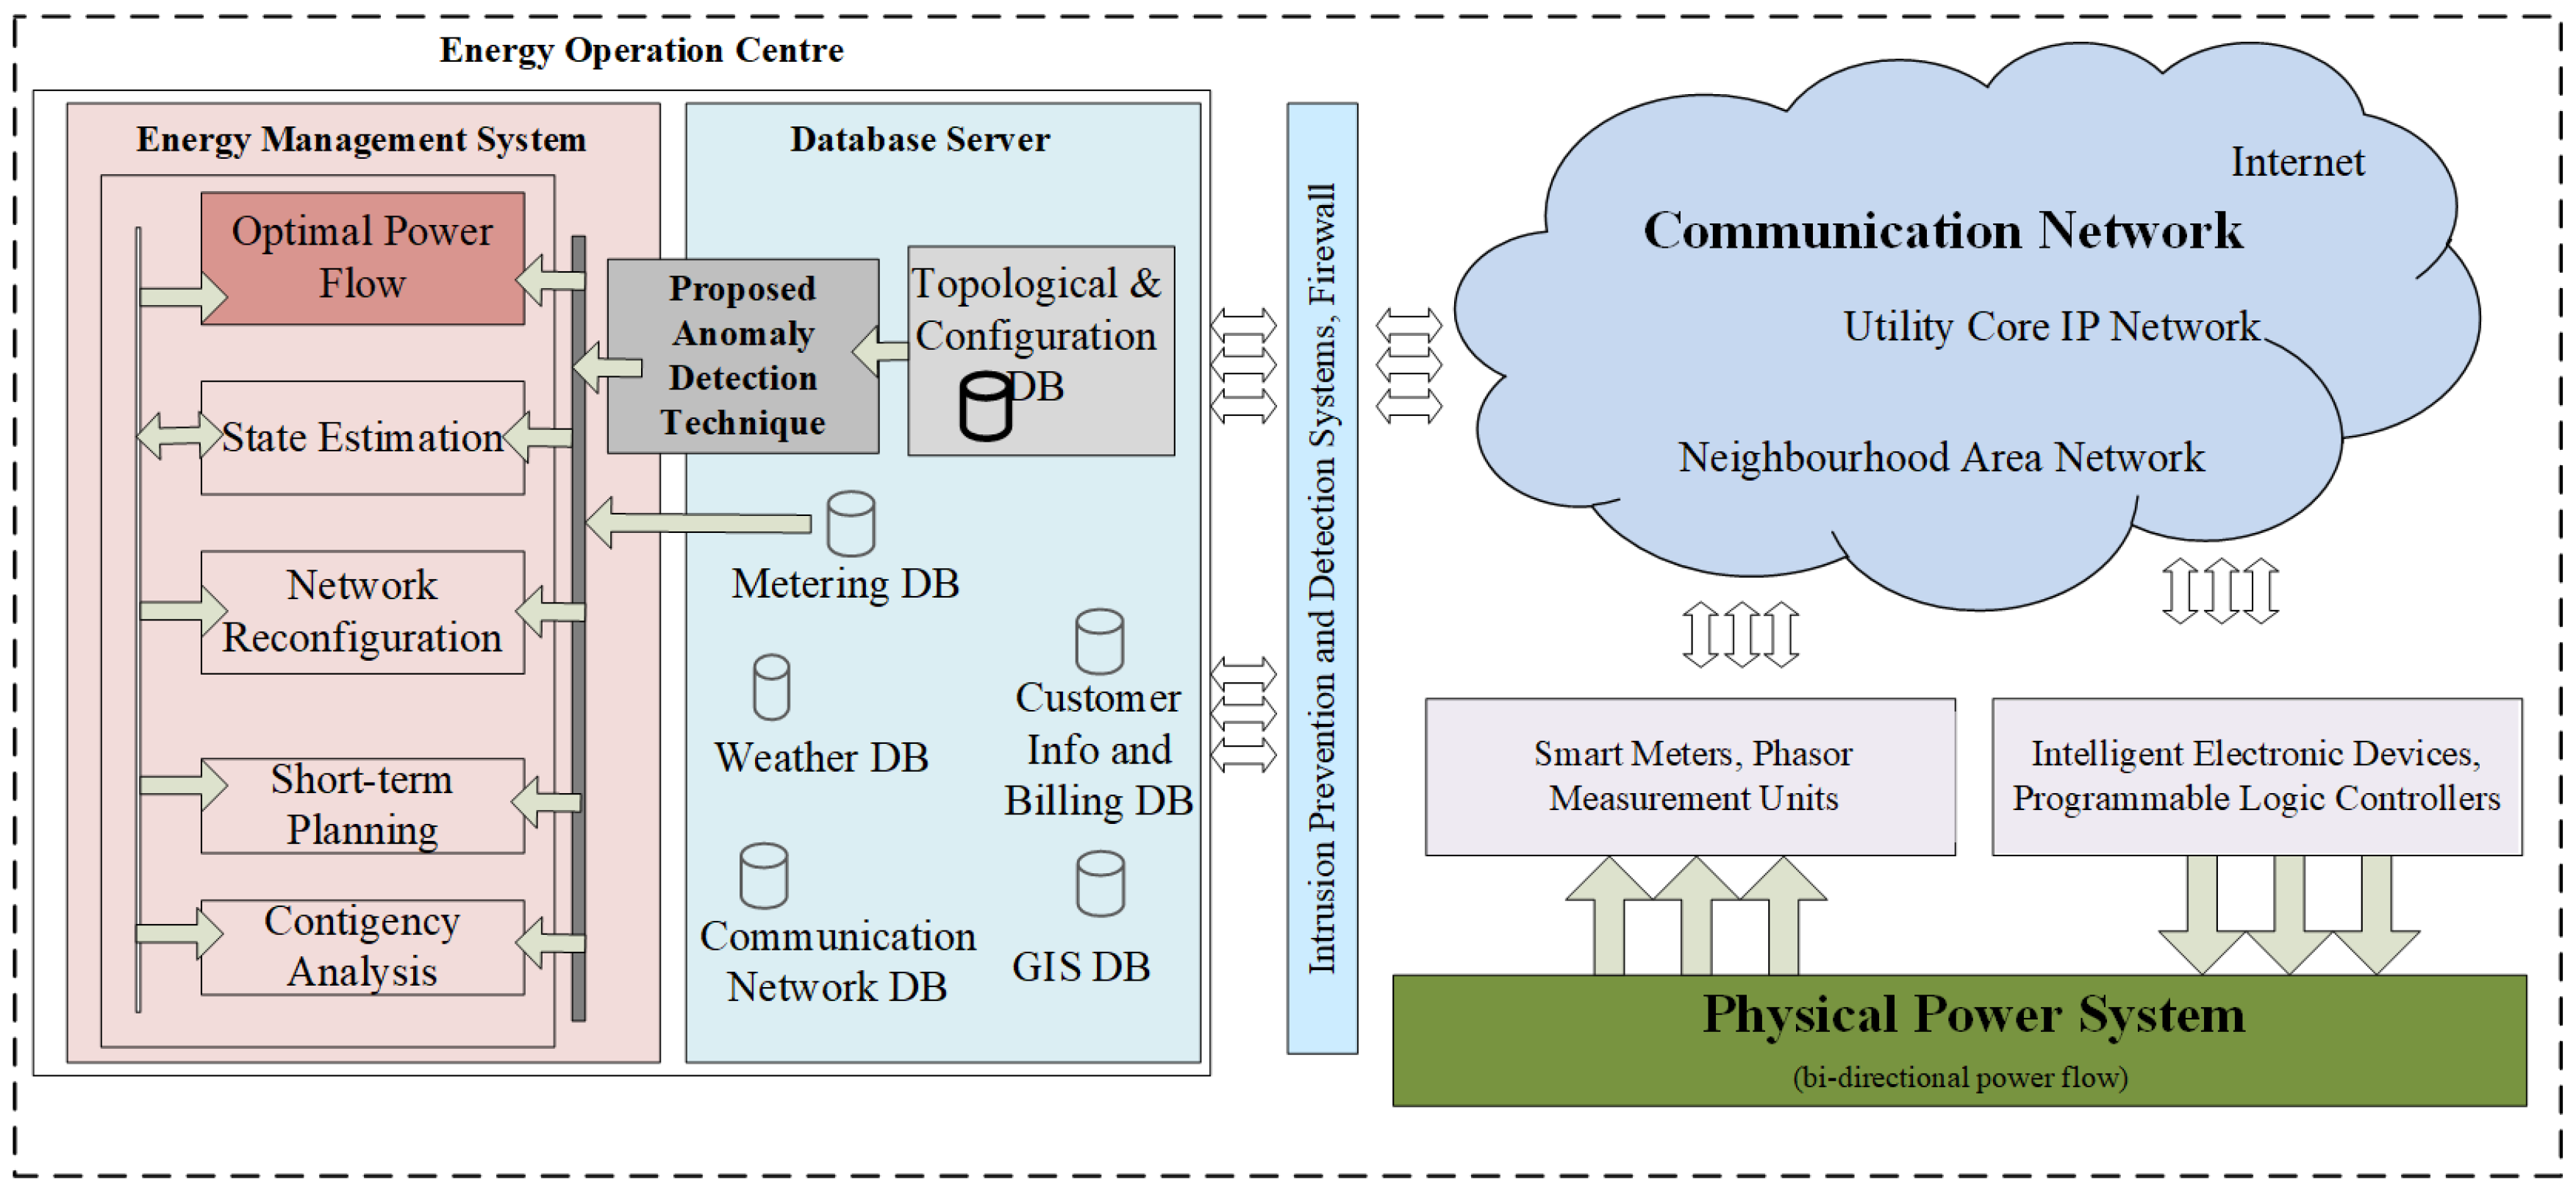
Figure 1 illustrates the architecture of an energy operation centre and its connectivity with the physical grid through the communication network. The role of the energy system database is also depicted in this figure. The operation of the modern power system heavily relies on field measurements for improved monitoring and control. However, field measurements are prone to measurement errors due to device accuracy, communication noises and device malfunctions [16]. Therefore, to check the measurement data integrity, modules like state estimators and bad data detectors are used. These modules not only suppress the measurement noises and identify the corrupted measurements but also determine the system states. Importantly, modules like state estimator and bad data detector work are based on the principle that the underlying energy system topological and parameter information stored in the energy system database is correct. However, if the ground truth is wrong, it would affect the whole procedure [12,13]. More importantly, a good number of planning decisions is made based on the power system electric database information. As a result, falsified database information would lead to misleading planning decisions. DB manipulation can be performed internally or externally. According to Jin et al. "Insider attacks are launched by malicious users who are entrusted with authorised (i.e., insider) access of a system" [17]. Authors in [17] also highlight that the insider attack comprises around 29% of all cyber crimes and may lead to severe loss or damage. On 23 December 2015, a Ukrainian power grid attack happened where the adversary hacked the energy SCADA system and remotely controlled the operation centre to deliberately shut down the energy supply [18]. Similarly, the database can be manipulated by gaining access to the system, and consequently, this would affect the physical operation of the grid. Realising the importance, several research works highlighted detection techniques for energy database anomalies [12,13,19,20].
Authors in [12] developed an anomaly detection technique for energy system databases to monitor power flow results detecting the anomalies in the database with changes in the power flow results. Authors in [12] used PCA-based method and tested the performance of their work by considering attacks like line removal, single line parameter and rating alterations. Some additional types of attacks are demonstrated in [13] where the line connectivity information, e.g., origin node of any line, is modified, to demonstrate as an attack case. To detect the changes, authors in [13] applied ANN-based models. Authors in [19] proposed a forecasting and threshold-based approach to detect the intrusions within the database. Authors in [19] used a vector autoregressive (VAR) model to develop a multivariate forecasting model and three-sigma rule is applied to detect anomalies. In [20], authors used a graph matching approach where the problem is modelled as a Quadratic Assignment Problem (QAP) and utilised the Graduated Assignment algorithm to solve the matching problem. All of the above methods demonstrate capabilities by considering a subset of attack types. Moreover, it is important to verify the success rate of these methods against a wide range of possible attack scenarios. Besides, the behaviour of the combined attack scenarios also needs to be addressed.
3. Problem Statement
During a topological database attack, the attacker may or may not have prior knowledge of the topological connectivity or associated configuration information. For example, an insider with the knowledge of the power system DB connectivity, structure of the database and electric parameter information [21] may launch an attack. In the case when the attacker is not an insider, the adversary may gain the access externally and launch structured (has domain knowledge) or unstructured attacks (lack of domain knowledge). One relevant example is the 2015 Ukraine power grid cyber-attack [18] where attackers took the control of the SCADA network and intentionally shut down the switches of some distribution areas. Whether the attack is structured or unstructured, a significant or notable amount of database manipulation would be clearly identified as it would not provide converged system operation or would exhibit significant deviations in operating conditions. As a result, the responsible operators or automated processes would be alerted easily and rectify the issue. However, an intelligent attacker may strategically corrupt the information of the database in such a way that the operational modules of energy management system (e.g., OPF and State Estimator modules) converge, but their outputs violate the normal operating limits, which may cause unintended harmful actions to be initiated by the operator [12,13]; Due to such attacks, the automated process or the human operator takes operational decisions relying on the misleading outputs from corrupted databases. Even any planning decision based on the corrupted information of DB would lead to a misleading planning solution [20].
To explain, we consider the example of the three-bus power system [20], shown in Figure 2. The figure represents the topology of a three-bus power system with two generators and one load centre. The electric parameter information are represented in the figure. Typically, all topological connectivity information (e.g., which bus is connected with whom, which switch is on and which switch is off, etc) and electric parameter information (e.g., line resistance and reactance, generator and load capacities and ratings, line ratings, etc.) are stored in an energy system database. The second column (from left) of the Table 1 titled “ (before)” shows the voltage profile of each individual node of the three-bus test system after a converged power-flow solution. Now, assume an insider or an external adversary manipulates the line parameter information between the bus 1 to 2 of the DB. The corrupted line parameter reactance increases from 0.4 pu to 0.8 pu, also highlighted red in the Figure 2. The voltage profile from the converged power-flow output considering the manipulated DB information is presented in the third column (from left) of Table 1. A slight mismatch is observed in the results due to DB information manipulation. As IEEE/ANSI recommended practice for voltage stability limit is 1.05 pu, the system operator may take some remedial actions (say, change in generation/load or reactive power support) to mitigate the problem. However, it was not necessary as the actual physical system is running at 1.05 pu whereas the realisation of from the OPF is 1.052 due to wrong topological information. Any further actions based on the manipulated DB would misguide the operation and may affect on the system stability and reliability.
Therefore, it is important to monitor the energy system DB for any change. The aim of the proposed work is to detect the anomalies in a power system’s topological and configuration DB by leveraging powerful machine learning tools.
4. Attack Generation
Typically, operational decisions of power systems are conducted based on the measurement data and the stored data of network assets (for example, conductors, transformers, loads, generators, etc., and their conductivities). This stored database is the blueprint of the physical power grid. In this work, we consider eight types of DB attacks as listed in Table 2. These attack classes include the cases discussed in [12,13] as well as some extra possible cases of database manipulation.
4.1. Attack Scenario 1
The first attack scenario (case 1) deals with the modification of the connectivity of a single power system line. That means the source node and the destination node of a power line are changed in the database. For example, in IEEE 24-bus reliability test system [22], there are 24 nodes and 38 lines. For this type of attacks, source and destination node information related to one single line will be changed. Say, the original source and destination of line 1 are nodes 1 and 3, respectively. As a result of such consideration, the source of line 1 can be any node other than 1 and the destination can be any node other than 3. All information related to IEEE benchmark 24 bus reliability test system can be obtained from [15]. In this attack case, we generate attack by manipulating the source and destination nodes of any individual line once at a time to consider an attack scenario.
4.2. Attack Scenario 2
This scenario is extended from attack scenario 1. In this attack scenario, we consider the alteration of connectivity nodes among multiple lines. As IEEE 24 bus reliability test system, shown in Figure 3, has 38 lines, we randomly select the number of targeted lines to be attacked and randomly select line IDs against those numbers. Next, the source and destination nodes of those lines are modified. If more lines are modified, it may be trivial to detect the presence of the attack as power flow solution may not converge. Therefore, we have limited the number of manipulated lines to maximum five.
4.3. Attack Scenario 3
This attack scenario replicates a power system topology attack. In Test Case 3,a single line from the set of all lines in the test system is removed from the database. For some cases, the system power flow will not converge for this action but most of the time it converges. As a result of line removal, the power system topology represents a different one than the original. To explain this attack scenario, let consider the IEEE 24-bus reliability test system, which has 38 lines. After generating an attack scenario of this kind, the total line will be basically 37. For each attack case, we randomly select one line out of all, which is then removed. This attack scenario is based on the attack cases considered both in [12,13].
4.4. Attack Scenario 4
This attack scenario targets the electric properties of the test system represented in the power system database. Therefore, important line parameters like resistance and reactance values are changed from the database in this test case. Here, we change the line parameters randomly between −90% to +90% of their original values. Decisions based on manipulated line parameter information would be misleading. In this attack scenario, the electric parameter manipulation is performed only on one line.
4.5. Attack Scenario 5
This attack scenario is similar to Attack Scenario 4, except here we consider manipulation of multiple line parameters instead of a single line. Here, multiple lines are selected randomly where line parameters are modified randomly from −90% to +90% of their original values.
4.6. Attack Scenario 6
Beside line reactance, the maximum and minimum power ratings of different lines are altered in Case 6. Note, the maximum and minimum power ratings of different lines are used as constraints in the optimum power flow solution. Hence, modifying those ratings in the database would lead to an optimal solution, which is not the true optimal and would produce misleading operational decisions. This attack scenario is also reported in [12].
4.7. Attack Scenario 7
In this attack case, the point of common coupling (PCC) of the generator nodes is altered. That means, power generation source nodes are manipulated in the database. For example, as per IEEE 24 bus reliability test system, generator 3 is connected at node 7. In this attack scenario, the PCC node (which is actually node 7) will be replaced by another node. Similar attack scenarios are generated for all generator PCC nodes.
4.8. Attack Scenario 8
This attack case is very similar to Attack Scenario 2 but considers the manipulation of source nodes only. This means, sources nodes of multiple lines are manipulated to construct this attack case.
4.9. Attack Scenario 9
This attack case demonstrates a combined attack behaviour. In this experiment, we have combined the above discussed attack cases 2, 3 and 4. Therefore, the execution of the attacks would modify multiple line parameter values and remove a line connectivity information from the database.
In Table 3, a comparison of attack cases is presented. Out of nine different attack scenarios, Valenzuela et al. consider three attack scenarios in [12], which are attack scenarios 3, 4 and 6. On the other hand, Mousavian et al. in [13] consider three attack scenarios, which are 1, 3 and 8 in the above mentioned test cases. From Table 3, it is evident that our proposed model considers all sets of attacks presented in [12,13] as well as a new set of potential attack cases.
5. Attack Detection
Attack detection in power system database requires close to real-time operation. Hence, we provide an efficient detection architecture where intrusions are not detected directly from the database; rather, it uses a detection mechanism that involves database and determines the existence of intrusions, as discussed elaborately in the following section.
The optimal power flow (OPF) module is a vital module that is used in the energy management system of a power system operation centre for decision making purposes. This operational module needs the information of power system conductivity and component parameter information to make its decisions. Therefore, any change or modification in the database will impact on the output of the OPF module. Here, we consider the output of OPF module (power flow data of different lines of a test system) for data preparation. We consider both normal and attack instances to train the model. The normal profile is created based on the load data obtained from the repository of Electric Power Research Institute’s (EPRI) Smart Grid tool OpenDSS [14] and from the Global Energy Forecasting Competition 2012 [23]. We simulate the attack scenarios on IEEE benchmark power transmission systems using MatPower [15] by considering the attack cases discussed in Section 4. We consider hourly load data to generate 33,720 normal instances (for around 4 years of data) and same load profile with different attack strategies to generate another 33,720 attack instances. All normal and attack instances are used to train a model using multilayer perceptron (MLP).
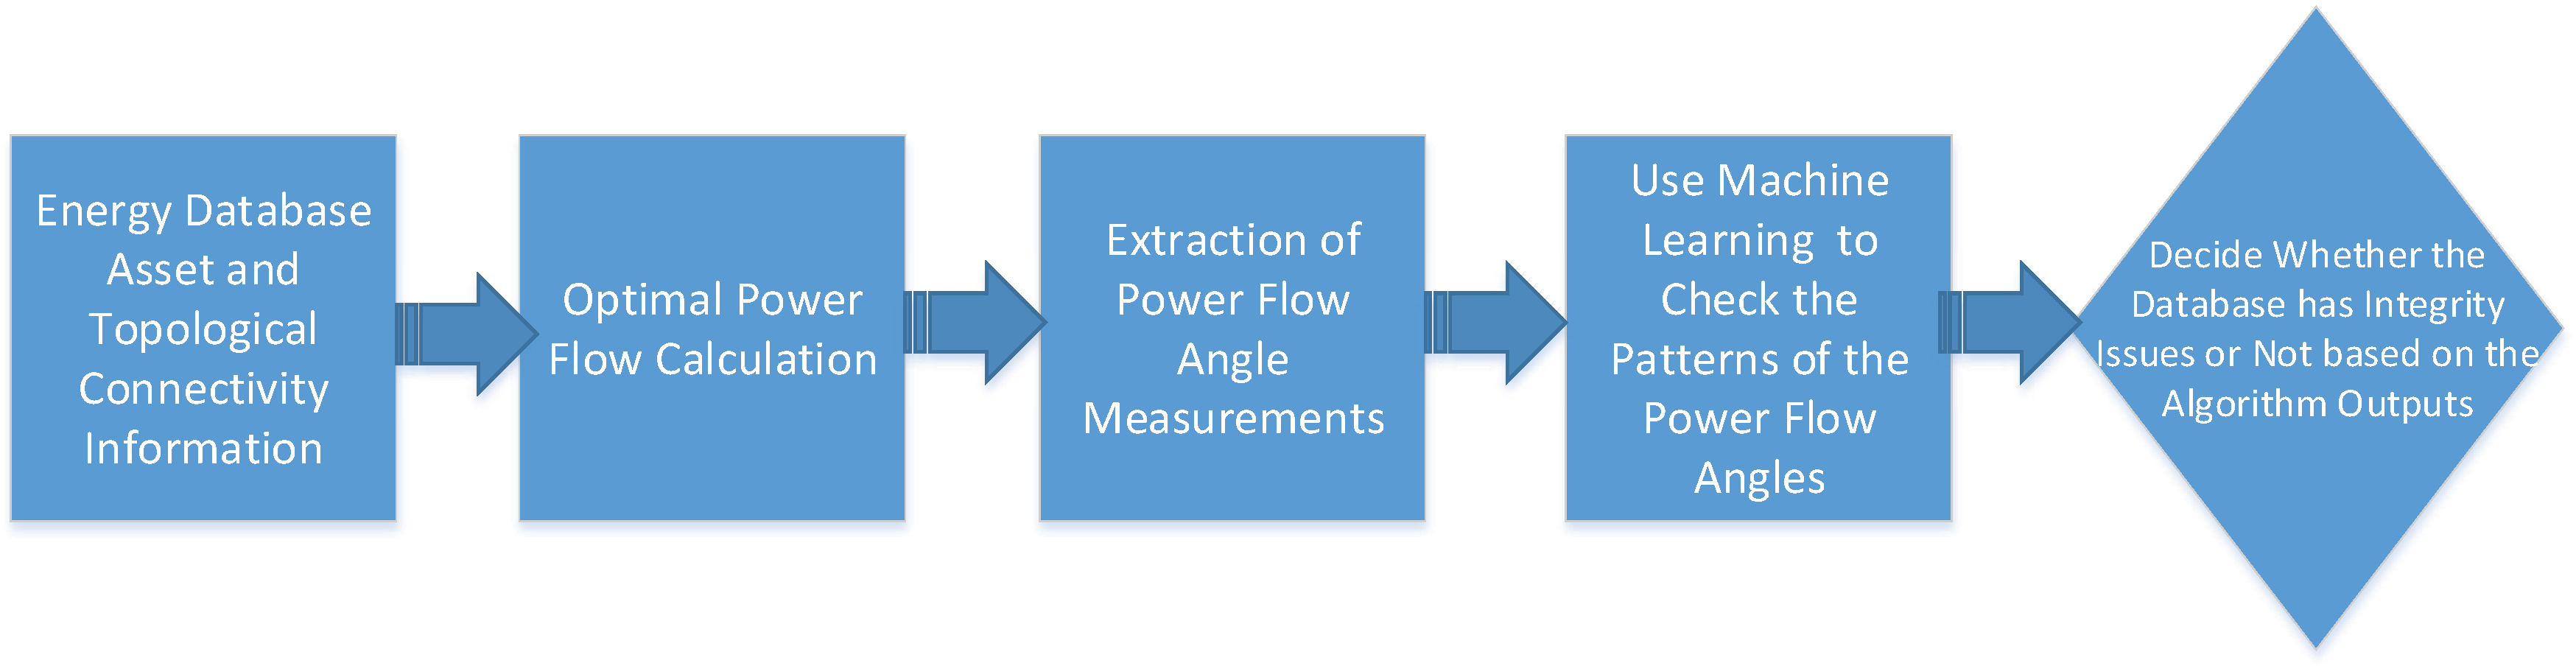
In this paper, we propose a framework in a way where the information integrity of the database is checked by monitoring the patterns of power flows that are derived from the database. That means, instead of checking database anomalies, the database information is used to calculate the optimal power flows, and then, that measurement information is used to check the integrity issues. The whole process is summarised in the Figure 4. In the proposed framework, first energy system DB information is used to calculate the optimal power flows. Next, power angle measurements are extracted and fed into the machine learning models. After the training and evaluation, the models predict whether there is any anomaly in the phase measurements. As phase measurements are the reflection of the energy database information, this intelligent way of detection helps to identify database anomalies.
Similar approaches have been proposed in [12,13]. The authors of this paper also worked using a similar set up in [19] where forecast and threshold-based detection techniques were utilised to detect power distribution system anomalies. In this work, the authors have used benchmark classification techniques and validated using two IEEE test systems. Most importantly, the results are compared with benchmark algorithms while introducing a wide variety of attack scenarios (10 attack cases) that include the attack cases discussed in [12,13] as well as new types of attacks.
Multilayer perceptron (MLP) is a special class of feedforward artificial neural network (FF-ANN). MLP is simply networks of perceptrons that combine input layers, some hidden layers and an output layer. The input layers are connected with the input attributes. Here, in our test setup for the 24-bus reliability test case, we have phase angles from 24 nodes of the network. Therefore, the input layer is connected with these 24 attributes. The output layer is connected with the target classes. In this experiment, our target is to detect normal and anomalous instances due to database intrusions. Hence, the output layer will be connected with two nodes: (i) Normal and (ii) Attack instances. Within the input and output layers, there are hidden layers. We have performed experiments for a wide range of hidden layers with different number of neurons/nodes in each of these hidden layers. We have observed that 3 hidden layers provided an optimal solution in terms of time and accuracy for our considered datasets. For the hidden layers, we have considered 13, 24, 26 neutrons. The number of nodes or neutrons for the first layer is selected based on the formula: (number of attributes + classes)/2. The numbers in the second and third layers represent the number of attributes and summation of attributes and classes, respectively. We have also conducted experiments for different settings of momentum and learning rate. The optimal setting is 0.1 for learning rate and 0.05 for momentum. The maximum number of epochs is considered to be 1500. With this setup, we have tested the algorithm for all nine attack scenarios. A conceptual diagram of training and testing procedure is shown in Figure 5, and the performance of the proposed model is evaluated in Section 6.
6. Results and Discussion
In this section, first, we demonstrate the impact of database manipulation attack and then implement a wide range of standard machine learning techniques to classify the normal and attack instances considering all of the above mentioned eight attack scenarios.
The database manipulation attack can be performed as a form of insider attack [21]. Alternatively, similar to the 2015 Ukraine power grid cyber-attack [18], an attacker can seize SCADA under control and manipulate the energy system database to falsify the operational decisions. According to the attack scenarios 4 and 5, the impact of line parameter alteration attack on the voltage profile after the converged OPF is demonstrated in Figure 6 and Figure 7. In these figures, the actual OPF voltage output is represented using the green line and the OPF output after database manipulation is represented using the red line. From the Figure 6 and Figure 7, it is very difficult to justify the impact of the database attack as per unit voltage outcomes are within of the rated voltage. Therefore, advanced machine-learning methods are required to understand the correlation of the OPF outputs during the normal operating condition and utilise that training model to identify the possible DB anomalies. For the performance evaluation, we use a wide variety of classifiers which include probabilistic, non-probabilistic, binary classifier, and rule based classifiers. The classifier includes Naive Bayes, BayesNet, Logistic Regression, Decision Table, Long Short-Term Memory (LSTM) deep neural network (DNN), Support Vector Machine (SVM) with PUK kernel, MLP and AdaBoost algorithms. Further description of these techniques are detailed in [24].
The dataset is generated based on the 24-bus IEEE reliability test system. For each dataset, instances (samples) contain phase angle measurements from each of the 24 nodes (buses) of the system. Therefore, the dataset has 24 attributes. Around 4 years of load data have been considered from the Global Energy Forecasting Competition 2012 [23]. After removing some missing values, the total hourly samples became 33,720 for those approximately four years of data. Therefore, the developed dataset for each experimental scenario has 33,720 samples for both normal and attack classes. Hence, the total samples for each experimental scenario is 67,440, which make the dimension of the dataset 67,440 by 24. Here, the dataset has equal samples for each class in order to avoid the class imbalance problem.
In this research, the authors have considered 66% of the generated data as train and the remaining 34% of the dataset for testing purposes. To do that, at first, the complete data is randomly shuffled using the Fisher–Yates shuffle based on WEKA. After shuffling, approximately 66% (around two-thirds) of the data for each class (both attack and normal) is taken, and the union of these per-class subsets is used as the training set. The remaining 34% data is used for testing. The dataset has been visualised in Figure 8. Here, t-SNE method is used for visualisation purposes. t-SNE is a nonlinear dimensionality reduction technique that can transform a high-dimensional dataset into a low-dimensional space. Here, we have converted a 24-dimension dataset into two dimensions. From the figure, it is evident that both attack class (cyan) and normal data (red) are not easily separable.
We have used machine learning tool-Weka [24] to evaluate the performance of these methods using nine test cases. Some test cases discussed in this work are similar to those of [12,13] as indicated in Table 3.
For the developed nine test scenarios, we perform the experiments using the classifiers Naive Bayes, BayesNet, Logistic Regression, Decision Table, Long Short-Term Memory (LSTM) deep neural network (DNN), Support Vector Machine (SVM) with PUK kernel, MLP and AdaBoost. To perform the experiments, we followed the procedure shown in Figure 5.
At first, we perform the experiments on the dataset 1 that represent the attack case 1 where the connectivity node information in the database has been modified. The results are presented in the Table 4. For this experiment, we have reported Accuracy, Precision, Recall and F-Measures. Based on the performance matrices, Naive Bayes, AdaBoost and Logistic regression perform poorly whereas SVM, MLP and LSTM show superior outcomes. The best accuracy is obtained using the MLP algorithm which is 97.87%. For this case, the FP rate is 2.1% with a precision of 98%. The total testing phase requires only 0.11 s. The performance matrices for other algorithms are also reported in Table 4.
Next, we perform the experiment for the dataset 2 that considers the attack scenario 2. Results for this test case are presented in Table 5. For this experimental setup, the overall performance is better than the first dataset. Based on the accuracy, precision, recall, FP rate and F-score, the top performing algorithm is LSTM. The second best one is MLP. LSTM has TP rate of 99.58% whereas MLP has 99.4%. The FP rate for MLP is only 0.6% and for LSTM is only 0.4%. These two algorithms perform better than others in terms of any performance measures. In terms of time requirements, both of the algorithms complete all the test instances within a second. In Dataset 3, the MLP performs better than the LSTM, as shown in Table 6. The accuracies of MLP and LSTM are 94.8% and 92.24%, respectively. For both of these algorithms, the FP rate is less than 8%.
Among all nine datasets, we observe that the scenario 4 is the toughest as most of the algorithms perform extremely poor for this case. In this case, the line resistance and reactance are changed randomly from % to +90%. If the modification is not that much significant (e.g., close to the original value), the classifier finds it very difficult to determine its class. Therefore, most of the algorithm has accuracy under 81%, see the results in Table 7. For this attack scenario, the best performing is again MLP, which produces an accuracy of 80.7%, with a TP and FP rate of 86.1% and 18.9%, respectively.
Compared with attack scenario 4, multiple lines are modified in attack scenario 5. Hence, the power flow results create much more deviations from the base case normal instances compared with scenario 4. Therefore, it is expected that the algorithms will find better results. It is also evident from the results presented in Table 8. Where the maximum accuracy was 80.7% for scenario 4, it has increased to 91.88% for scenario 5. In both cases, MLP is the winner among the considered algorithms in terms of accuracy, precision, TP rate, and F-score. FP rate is also the lowest compared with other algorithms.
Similar performance behaviour is also observed for other test scenarios, e.g., scenario 6, 7 and 8 (results are presented in Table 9, Table 10 and Table 11, respectively). For all of these cases, MLP achieves the highest accuracy and the lowest FP rate. We also introduced a combined attack case in scenario 9. The purpose of this test scenario is to examine how the detection algorithm performs in the presence of combined attacks where multiple attacks happened together. The proposed scheme under a combined attack scenario (Attack Scenario 9) includes the attacks from Scenarios 2, 3 and 4. We have performed a rigorous analysis using different algorithms presented in Table 12. The accuracy, precision, TR, FP rate, and F-score are presented in a similar way to the above cases. Our experimental analysis shows that attacks and normal instances are classified with high accuracy, e.g., around 99.3% using MLP. The FP rate is also extremely low (only 0.7%). The reason is that multiple modifications in the energy database manipulate the optimal power flow measurements, which cause more deviations as compared to a single attack scenario. Therefore, the probability of attack detections is higher during a combined attack scenario compared with a single attack scenario. There will be more damages if the combined attack is not detected, but our algorithms show that it is possible to detect the attack with high accuracy, with very few false alarms.
Similar to the high voltage transmission networks, low-voltage distribution networks or microgrids can also be vulnerable under smart grid cyber intrusions. Authors’ previous work in [19] shows how to defend against database manipulation for low-voltage networks. The proposed scheme in this paper can also be extended for low-voltage networks. We have applied the proposed scheme on an IEEE 33-node low-voltage network. The data and description of the IEEE 33-node low-voltage network can be obtained from [25]. Experiments have been performed for combined attack scenario (scenarios 4 and 1 together) using the dataset generated from 33-bus test system. Results are summarised in Table 13. From the results, MLP achieved the highest accuracy 94.03% with a FP rate of only 6.1%. The next performing algorithms are SVM and DecisionTable. Therefore, for such low-voltage test system, MLP can achieve around 94% accuracy within 0.01 s. This is acceptable for a near-real-time detection of data integrity issues in an energy control system.
The experiments presented in this paper were conducted using a computer with Intel Core i7, 16GB RAM. For all test cases, the testing run time is less than a second for the MLP algorithm, which is sufficient for running as an IDS to ensure the data integrity of OPF module. The time required for each testing phase is included in the output tables. Please note, the assumption is that the testing phase will check whether the obtained measurement instances (samples) due to attack or under normal condition require a near-real-time operation. This time requirement is typically 5 minutes (time difference between two consecutive OPF runs in the utility operation centre). Therefore, the integrity of the database needs to be checked within this 5-minute interval. The analysis in this work reports that testing any data samples (including measurement data generation and testing phase) always requires much less time than that. It is also worth noting that the training phase does not need to be updated always as it is based on the historical data. The realistic assumption is that the training model is only updated (or built) when the topology of the energy system network is modified. However, to improve the performance, it is also possible to update the training model with the incremental data once a day, but it will not affect the near real-time operation of the testing phase.
7. Conclusions
Security issues of smart grid database need more attention to ensure a reliable power system operation. In this work, first, we consider different types of database intrusions and prepare nine different datasets that contain both attack and normal instances. Next, we propose a solution architecture where database intrusions are not captured directly from the database; rather, intrusions are detected from the power flows that are obtained using the information of the database. This classification based solution architecture utilises different state-of-the-art supervised ML algorithms. In terms of the solution accuracy, recall, precision, and F-measures, the MLP is the best performing algorithm for this test setup among the considered algorithms. Two IEEE benchmark test systems have been used to generate and validate the experiments.
In this ongoing work, different attack scenarios for power system databases are explored and the performance of different state-of-the-art supervised ML algorithms are investigated. Microgrids and low-voltage customer-centric distribution networks are vulnerable to potential cyberattacks. In future extension of this work, more difficult and realistic attack scenarios will be included. Impacts of cyberattacks on the microgrid and customer-centric low-voltage networks will be explored thoroughly in future works.
Author Contributions
Conceptualization, A.A.; Formal analysis, A.A.; Methodology, A.A.; Project administration, A.A.; Software, A.A.; Supervision, A.M.; Validation, B.R.; Writing—original draft, A.A.; Writing—review & editing, M.A.M. and Z.T. All authors have read and agreed to the published version of the manuscript.
Funding
This research received no external funding.
Conflicts of Interest
The authors declare no conflict of interest.
Abbreviations
The following abbreviations are used in this manuscript:
| OPF | Optimal Power Flow |
| DB | Database |
| EMS | Energy Management System |
| SVM | Support Vector Machine |
| ANN | Artificial Neural Network |
| MLP | Multilayer Perceptron |
References
- McMillan, R. Siemens: Stuxnet worm hit industrial systems. Computerworld 2010, 14. [Google Scholar]
- The Industrial Control Systems Cyber Emergency Response Team (ICS-CERT). Incident Response Activity (April–June 2013). Available online: https://www.us-cert.gov/sites/default/files/Monitors/ICS-CERT_Monitor_Apr-Jun2013.pdf (accessed on 15 April 2020).
- Mo, Y.; Kim, T.H.; Brancik, K.; Dickinson, D.; Lee, H.; Perrig, A.; Sinopoli, B. Cyber-Physical Security of a Smart Grid Infrastructure. Proc. IEEE 2012, 100, 195–209. [Google Scholar]
- Liu, Y.; Ning, P.; Reiter, M.K. False Data Injection Attacks Against State Estimation in Electric Power Grids. In Proceedings of the 16th ACM Conference on Computer and Communications Security, Chicago, IL, USA, 9–13 November 2009; ACM: New York, NY, USA, 2009; pp. 21–32. [Google Scholar]
- Ozay, M.; Esnaola, I.; Vural, F.; Kulkarni, S.; Poor, H. Sparse Attack Construction and State Estimation in the Smart Grid: Centralized and Distributed Models. IEEE J. Sel. Areas Commun. 2013, 31, 1306–1318. [Google Scholar] [CrossRef] [Green Version]
- Hug, G.; Giampapa, J. Vulnerability Assessment of AC State Estimation With Respect to False Data Injection Cyber-Attacks. IEEE Trans. Smart Grid 2012, 3, 1362–1370. [Google Scholar] [CrossRef] [Green Version]
- Qin, Z.; Li, Q.; Chuah, M.C. Defending against Unidentifiable Attacks in Electric Power Grids. IEEE Trans. Parallel Distrib. Syst. 2013, 24, 1961–1971. [Google Scholar] [CrossRef] [Green Version]
- Yuan, Y.; Li, Z.; Ren, K. Quantitative Analysis of Load Redistribution Attacks in Power Systems. IEEE Trans. Parallel Distrib. Syst. 2012, 23, 1731–1738. [Google Scholar] [CrossRef]
- Mohsenian-Rad, A.; Leon-Garcia, A. Distributed Internet-Based Load Altering Attacks Against Smart Power Grids. IEEE Trans. Smart Grid 2011, 2, 667–674. [Google Scholar] [CrossRef]
- Anwar, A.; Mahmood, A. Cyber Security of Smart Grid Infrastructure. In The State of the Art in Intrusion Prevention and Detection; CRC Press, Taylor & Francis Group: Boca Raton, FL, USA, 2014; pp. 139–154. [Google Scholar]
- Anwar, A.; Mahmood, A. Vulnerabilities of Smart Grid State Estimation Against False Data Injection Attack. In Renewable Energy Integration; Green Energy and Technology; Springer: Singapore, 2014; pp. 411–428. [Google Scholar]
- Valenzuela, J.; Wang, J.; Bissinger, N. Real-Time Intrusion Detection in Power System Operations. IEEE Trans. Power Syst. 2013, 28, 1052–1062. [Google Scholar] [CrossRef]
- Mousavian, S.; Valenzuela, J.; Wang, J. Real-time data reassurance in electrical power systems based on artificial neural networks. Electr. Power Syst. Res. 2013, 96, 285–295. [Google Scholar] [CrossRef]
- OpenDSS Simulation Tool, Electric Power System Research Institute. Available online: https://smartgrid.epri.com/SimulationTool.aspx (accessed on 15 April 2020).
- Zimmerman, R.; Murillo-Sanchez, C.; Thomas, R. MATPOWER: Steady-State Operations, Planning, and Analysis Tools for Power Systems Research and Education. IEEE Trans. Power Syst. 2011, 26, 12–19. [Google Scholar] [CrossRef] [Green Version]
- Anwar, A.; Mahmood, A.N.; Pickering, M. Modeling and performance evaluation of stealthy false data injection attacks on smart grid in the presence of corrupted measurements. J. Comput. Syst. Sci. 2017, 83, 58–72. [Google Scholar] [CrossRef] [Green Version]
- Jin, X.; Dan, M.; Zhang, N.; Yu, W.; Fu, X.; Das, S.K. Chapter 2—Game Theory for Infrastructure Security: The Power of Intent-Based Adversary Models. In Handbook on Securing Cyber-Physical Critical Infrastructure; Morgan Kaufmann: Boston, MA, USA, 2012; pp. 31–53. [Google Scholar] [CrossRef]
- Lee, R.M.; Assante, M.J.; Conway, T. Analysis of the Cyber Attack on the Ukrainian Power Grid; Technical Report; The Electricity Information Sharing and Analysis Center: Washington, DC, USA, 2016. [Google Scholar]
- Anwar, A.; Mahmood, A.N.; Tari, Z. Ensuring Data Integrity of OPF Module and Energy Database by Detecting Changes in Power Flow Patterns in Smart Grids. IEEE Trans. Ind. Inform. 2017, 13, 3299–3311. [Google Scholar] [CrossRef]
- Anwar, A.; Mahmood, A.N. Anomaly detection in electric network database of smart grid: Graph matching approach. Electr. Power Syst. Res. 2016, 133, 51–62. [Google Scholar] [CrossRef]
- Suh, T.; Cho, Y. An Enhanced Trust Mechanism with Consensus-Based False Information Filtering Algorithm against Bad-Mouthing Attacks and False-Praise Attacks in WSNs. Electronics 2019, 8, 1359. [Google Scholar] [CrossRef] [Green Version]
- Wong, P.; Albrecht, P.; Allan, R.; Billinton, R.; Chen, Q.; Fong, C.; Haddad, S.; Li, W.; Mukerji, R.; Patton, D.; et al. The IEEE Reliability Test System-1996. A report prepared by the Reliability Test System Task Force of the Application of Probability Methods Subcommittee. IEEE Trans. Power Syst. 1999, 14, 1010–1020. [Google Scholar]
- Kaggle. Global Energy Competition; Kaggle: San Francisco, CA, USA, 2012. [Google Scholar]
- Hall, M.; Frank, E.; Holmes, G.; Pfahringer, B.; Reutemann, P.; Witten, I.H. The WEKA Data Mining Software: An Update. SIGKDD Explor. Newsl. 2009, 11, 10–18. [Google Scholar] [CrossRef]
- Baran, M.E.; Wu, F.F. Network reconfiguration in distribution systems for loss reduction and load balancing. IEEE Trans. Power Deliv. 1989, 4, 1401–1407. [Google Scholar] [CrossRef]
Figure 1.
Functionality of energy database within energy management system database architecture.

Figure 2.
Three bus test system [20].
Figure 2.
Three bus test system [20].

Figure 3.
IEEE 24 bus reliability test system [22].
Figure 3.
IEEE 24 bus reliability test system [22].

Figure 4.
Proposed database anomaly detection framework.

Figure 5.
Solution architecture.

Figure 6.
DB attack with line parameter alteration of a single line.

Figure 7.
DB attack with line parameter alteration of multiple lines.

Figure 8.
t-SNE of the dataset for experimental scenario 5.


Table 1.
Node voltages before and after DB manipulation.
| Node Name | (Before) | (After) | Comments |
|---|---|---|---|
| Node 1 | 1.0500 pu | 1.052 pu | limit exceeded |
| Node 2 | 1.0400 pu | 1.039 pu | within limit |
| Node 3 | 1.0450 pu | 1.045 pu | within limit |
Table 2.
Attack scenarios.
| Attack Case | Description of Attacks |
|---|---|
| Case 1 | Modify connectivity of a single line |
| Case 2 | Modify connectivity of multiple lines |
| Case 3 | Remove a line |
| Case 4 | Line parameter alteration of a single line |
| Case 5 | Line parameter alteration of multiple lines |
| Case 6 | Modify line reactance and ratings |
| Case 7 | Alter the PCC of generator node |
| Case 8 | Modify origins of multiple lines |
| Case 9 | Combination of Cases 2, 3 and 4. |
| This case includes modification of multiple line parameters and removal of a line |
Table 3.
Comparison of test scenarios in existing and proposed work.
| Attack Scenarios | PCA Based Method in [12] | ANN-Based Method in [13] | Proposed Method |
|---|---|---|---|
| Attack Scenario 1 | - | ✓ | ✓ |
| Attack Scenario 2 | - | - | ✓ |
| Attack Scenario 3 | ✓ | ✓ | ✓ |
| Attack Scenario 4 | ✓ | - | ✓ |
| Attack Scenario 5 | - | - | ✓ |
| Attack Scenario 6 | ✓ | - | ✓ |
| Attack Scenario 7 | - | - | ✓ |
| Attack Scenario 8 | - | ✓ | ✓ |
| Attack Scenario 9 | - | - | ✓ |
Table 4.
Performance evaluation for attack scenario 1.
| Algorithms | Accuracy | TP Rate | FP Rate | Precision | Recall | F-Measure | Time (Test) |
|---|---|---|---|---|---|---|---|
| Naïve Bayes | 71.36% | 71.4% | 28.2% | 75.2% | 71.4% | 70.3% | 0.18 s |
| BayesNet | 86.62% | 86.6% | 13.2% | 88.1% | 86.6% | 86.5% | 0.04 s |
| Logistic Regression | 72.09% | 72.1% | 27.6% | 73.8% | 72.1% | 71.6% | 0.01 s |
| DecisionTable | 90.27% | 90.3% | 9.5% | 91.6% | 90.3% | 90.2% | 0.01 s |
| LSTM Deep NN | 95.45% | 94.7% | 4.55% | 99.94% | 91.04% | 95.28% | 0.8 s |
| SVM (PUK) | 90.2% | 90.2% | 9.6% | 91.8% | 90.2% | 90.1% | 7.71 s |
| MLP | 97.87% | 97.9% | 2.1% | 98.0% | 97.9% | 97.9% | 0.11 s |
| AdaBoost | 78.45% | 78.5% | 21.1% | 85% | 78.5% | 77.5% | 0.01 s |
Table 5.
Performance evaluation for attack scenario 2.
| Algorithms | Accuracy | TP Rate | FP Rate | Precision | Recall | F-Measure | Time (Test) |
|---|---|---|---|---|---|---|---|
| Naïve Bayes | 82.72% | 82.7% | 17.1% | 83.8% | 82.7% | 82.6% | 0.08 s |
| BayesNet | 97.12% | 97.1% | 2.8% | 97.2% | 97.1% | 97.1% | 0.02 s |
| Logistic Regression | 86.95% | 86.9% | 12.8% | 88.9% | 86.8% | 86.8% | 0.01 s |
| DecisionTable | 97.93% | 97.9% | 2.0% | 98.0% | 97.9% | 97.9% | 0.01 s |
| LSTM Deep NN | 99.58% | 99.58% | 0.42% | 100% | 99% | 99.57% | 0.82 s |
| SVM (PUK) | 94.8% | 94.8% | 5.2% | 95.3% | 94.8% | 94.8% | 7.9 s |
| MLP | 99.4% | 99.4% | 0.6% | 99.4% | 99.4% | 99.4% | 0.03 s |
| AdaBoost | 95.07% | 95.1% | 4.9% | 95.3% | 95.1% | 90.4% | 0.01 s |
Table 6.
Performance evaluation for attack scenario 3.
| Algorithms | Accuracy | TP Rate | FP Rate | Precision | Recall | F-Measure | Time (Test) |
|---|---|---|---|---|---|---|---|
| Naïve Bayes | 64.56% | 64.6% | 34.9% | 69.2% | 64.6% | 62.5% | 0.08 s |
| BayesNet | 72.7% | 72.7% | 27% | 74.4% | 72.7% | 72.3% | 0.02 s |
| Logistic Regression | 62.5% | 62.5% | 37.2% | 63.5% | 62.5% | 61.9% | 0.01 s |
| DecisionTable | 86% | 86% | 13.7% | 88.9% | 86% | 85.8% | 0.01 s |
| LSTM Deep NN | 92.24% | 92.24% | 7.76% | 95.06% | 88.70% | 91.77% | 0.49 s |
| SVM (PUK) | 80.75% | 80.8% | 18.9% | 86.1% | 80.8% | 80.1% | 12.2 s |
| MLP | 94.8% | 94.8% | 5.1% | 95.3% | 94.8% | 94.8% | 0.11 s |
| AdaBoost | 67.11% | 67.1% | 32.2% | 79% | 67.1% | 63.5% | 0.01 s |
Table 7.
Performance evaluation for attack scenario 4.
| Algorithms | Accuracy | TP Rate | FP Rate | Precision | Recall | F-Measure | Time (Test) |
|---|---|---|---|---|---|---|---|
| Naïve Bayes | 55.05% | 55.1% | 44.4% | 57.7% | 55.1% | 51.4% | 0.06 s |
| BayesNet | 61.57% | 61.6% | 37.7% | 76% | 61.6% | 55.7% | 0.02 s |
| Logistic Regression | 54.48% | 54.5% | 45.3% | 54.7% | 54.5% | 54.1% | 0.01 s |
| DecisionTable | 62.5% | 62.5% | 36.8% | 76.8% | 62.5% | 56.9% | 0.01 s |
| LSTM Deep NN | 58.75% | 58.74% | 41.25% | 85.88% | 21.27% | 34.10% | 0.69 s |
| SVM (PUK) | 59.18% | 59.2% | 40% | 77% | 59.2% | 51.4% | 18.49 s |
| MLP | 80.7% | 86.1% | 18.9% | 86.1% | 80.7% | 80% | 0.02 s |
| AdaBoost | 56.08% | 56.1% | 43% | 76.7% | 56.1% | 45.9% | 0.01 s |
Table 8.
Performance evaluation for attack scenario 5.
| Algorithms | Accuracy | TP Rate | FP Rate | Precision | Recall | F-Measure | Time (Test) |
|---|---|---|---|---|---|---|---|
| Naïve Bayes | 58.39% | 58.4% | 41% | 62.4% | 58.4% | 55.1% | 0.06 s |
| BayesNet | 68.16% | 68.2% | 31.3% | 77.2% | 68.2% | 65.4% | 0.02 s |
| Logistic Regression | 57.15% | 57.1% | 42.7% | 57.5% | 57.1% | 56.8% | 0.01 s |
| DecisionTable | 71.1% | 71.1% | 28.4% | 78.4% | 71.1% | 69.2% | 0.01 s |
| LSTM Deep NN | 74.01% | 74.01% | 25.98% | 99.97% | 47.66% | 64.51% | 1 s |
| SVM (PUK) | 67.75% | 67.8% | 31.6% | 80.2% | 67.8% | 64.2% | 15.84 s |
| MLP | 91.88% | 91.9% | 8% | 92.9% | 91.9% | 91.8% | 0.02 s |
| AdaBoost | 60.8% | 60.8% | 38.4% | 78.1% | 60.8% | 53.9% | 0.01 s |
Table 9.
Performance evaluation for attack scenario 6.
| Algorithms | Accuracy | TP Rate | FP Rate | Precision | Recall | F-Measure | Time (Test) |
|---|---|---|---|---|---|---|---|
| Naïve Bayes | 55.6% | 55.6% | 43.8% | 58.7% | 55.6% | 51.8% | 0.06 s |
| BayesNet | 60.89% | 60.9% | 38.3% | 77.2% | 60.9% | 54.3% | 0.02 s |
| Logistic Regression | 56.12% | 56.1% | 43.8% | 56.7% | 56.1% | 55.4% | 0.01 s |
| DecisionTable | 64.74% | 64.7% | 34.5% | 78.2% | 64.7% | 60.2% | 0.01 s |
| LSTM Deep NN | 56.60% | 56.60% | 43.40% | 98.94% | 13.77% | 24.17% | 0.78 s |
| SVM (PUK) | 59.73% | 59.7% | 39.5% | 77.1% | 59.7% | 52.3% | 16.58 s |
| MLP | 83.7% | 83.7% | 16% | 87.7% | 83.7% | 83.3% | 0.02 s |
| AdaBoost | 56.27% | 56.3% | 42.8% | 76.8% | 56.3% | 46.3% | 0.01 s |
Table 10.
Performance evaluation for attack scenario 7.
| Algorithms | Accuracy | TP Rate | FP Rate | Precision | Recall | F-Measure | Time (Test) |
|---|---|---|---|---|---|---|---|
| Naïve Bayes | 60.12% | 60.1% | 39.3% | 65.7% | 60.1% | 56.5% | 0.07 s |
| BayesNet | 69.2% | 69.2% | 30.2% | 79.7% | 69.2% | 66.4% | 0.02 s |
| Logistic Regression | 74.29% | 74.3% | 25.2% | 83.1% | 74.3% | 72.6% | 0.01 s |
| DecisionTable | 73.15% | 73.2% | 26.4% | 80.4% | 73.2% | 71.6% | 0.01 s |
| LSTM Deep NN | 62.08% | 62.08% | 37.92% | 57.81% | 88.86% | 70.05% | 0.52 s |
| SVM (PUK) | 76.9% | 76.9% | 22.6% | 84.1% | 76.9% | 75.7% | 11.6 s |
| MLP | 89.57% | 89.6% | 10.2% | 90.9% | 89.6% | 89.5% | 0.02 s |
| AdaBoost | 62.33% | 62.3% | 36.9% | 78.6% | 62.3% | 56.3% | 0.01 s |
Table 11.
Performance evaluation for attack scenario 8.
| Algorithms | Accuracy | TP Rate | FP Rate | Precision | Recall | F-Measure | Time (Test) |
|---|---|---|---|---|---|---|---|
| Naïve Bayes | 93.14% | 93.1% | 6.8% | 93.8% | 93.1% | 93.1% | 0.07 s |
| BayesNet | 97.48% | 97.5% | 2.5% | 97.6% | 97.5% | 97.5% | 0.02 s |
| Logistic Regression | 91.99% | 92% | 7.8% | 93.1% | 92% | 91.9% | 0.01 s |
| DecisionTable | 97.38% | 97.4% | 2.6% | 97.5% | 97.4% | 97.4% | 0.01 s |
| LSTM Deep NN | 99.04% | 99.03% | 96% | 100% | 98.09% | 99.03% | 0.6 s |
| SVM (PUK) | 97.67% | 97.7% | 2.3% | 97.8% | 97.7% | 97.7% | 2.8 s |
| MLP | 99.35% | 99.3% | 0.6% | 99.4% | 99.3% | 99.3% | 0.02 s |
| AdaBoost | 92.44% | 92.4% | 7.4% | 93.4% | 92.4% | 92.4% | 0.01 s |
Table 12.
Performance evaluation for attack scenario 9.
| Algorithms | Accuracy | TP Rate | FP Rate | Precision | Recall | F-Measure | Time (Test) |
|---|---|---|---|---|---|---|---|
| Naïve Bayes | 93.71% | 93.7% | 6.2% | 94.1% | 93.7% | 93.7% | 0.06 s |
| BayesNet | 96.99% | 97% | 3% | 97.1% | 97% | 97% | 0.02 s |
| Logistic Regression | 92% | 92% | 7.8% | 93.1% | 92% | 92% | 0.01 s |
| DecisionTable | 97.83% | 97.8% | 2.1% | 97.9% | 97.8% | 97.8% | 0.01 s |
| LSTM Deep NN | 99.05% | 99.03% | 0.96% | 100% | 98.12% | 99.05% | 0.62 s |
| SVM (PUK) | 98.22% | 98.2% | 1.7% | 98.3% | 98.2% | 98.2% | 2.71 s |
| MLP | 99.33% | 99.3% | 0.7% | 99.3% | 99.3% | 99.3% | 0.02 s |
| AdaBoost | 92% | 92.1% | 7.8% | 93.2% | 92.1% | 92% | 0.01 s |
Table 13.
Performance evaluation for 33-bus network.
| Algorithms | Accuracy | TP Rate | FP Rate | Precision | Recall | F-Measure | Time (Test) |
|---|---|---|---|---|---|---|---|
| Naïve Bayes | 84.92% | 84.9% | 15.3% | 86.1% | 84.9% | 84.8% | 0.1 s |
| BayesNet | 86.25% | 86.2% | 14.1% | 88.8% | 86.2% | 86% | 0.02 s |
| Logistic Regression | 87.72% | 87.7% | 12.5% | 88.3% | 87.7% | 87.7% | 0.01 s |
| DecisionTable | 90.75% | 90.8% | 9.5% | 92.2% | 90.8% | 90.7% | 0.01 s |
| SVM (PUK) | 90.88% | 90.9% | 9.4% | 92.3% | 90.9% | 90.8% | 8.34 s |
| MLP | 94.03% | 94% | 6.1% | 94.7% | 94% | 94% | 0.03 s |
| AdaBoost | 85.59% | 85.6% | 14.8% | 88.7% | 85.6% | 85.3% | 0.01 s |
© 2020 by the authors. Licensee MDPI, Basel, Switzerland. This article is an open access article distributed under the terms and conditions of the Creative Commons Attribution (CC BY) license (http://creativecommons.org/licenses/by/4.0/).
Share and Cite
MDPI and ACS Style
Anwar, A.; Mahmood, A.; Ray, B.; Mahmud, M.A.; Tari, Z. Machine Learning to Ensure Data Integrity in Power System Topological Network Database. Electronics 2020, 9, 693. https://doi.org/10.3390/electronics9040693
AMA Style
Anwar A, Mahmood A, Ray B, Mahmud MA, Tari Z. Machine Learning to Ensure Data Integrity in Power System Topological Network Database. Electronics. 2020; 9(4):693. https://doi.org/10.3390/electronics9040693
Chicago/Turabian StyleAnwar, Adnan, Abdun Mahmood, Biplob Ray, Md Apel Mahmud, and Zahir Tari. 2020. "Machine Learning to Ensure Data Integrity in Power System Topological Network Database" Electronics 9, no. 4: 693. https://doi.org/10.3390/electronics9040693
Note that from the first issue of 2016, this journal uses article numbers instead of page numbers. See further details here.