Article

Biosensor Using a One-Port Interdigital Capacitor: A Resonance-Based Investigation of the Permittivity Sensitivity for Microfluidic Broadband Bioelectronics Applications

by
Giovanni Crupi
1,*,
Xiue Bao
2,
Oluwatosin John Babarinde
2,
Dominique M. M.-P. Schreurs
2 and
Bart Nauwelaers
2
1
Department of Biomedical and Dental Sciences and Morphofunctional Imaging, University of Messina, 98125 Messina, Italy
2
Electronic Engineering Department, KU Leuven, B-3001 Leuven, Belgium
*
Author to whom correspondence should be addressed.
Electronics 2020, 9(2), 340; https://doi.org/10.3390/electronics9020340
Submission received: 4 December 2019 / Revised: 3 February 2020 / Accepted: 13 February 2020 / Published: 16 February 2020
(This article belongs to the Section Bioelectronics)

Abstract

:
Electronics is a field of study ubiquitous in our daily lives, since this discipline is undoubtedly the driving force behind developments in many other disciplines, such as telecommunications, automation, and computer science. Nowadays, electronics is becoming more and more widely applied in life science, thus leading to an increasing interest in bioelectronics that is a major segment of bioengineering. A bioelectronics application that has gained much attention in recent years is the use of sensors for biological samples, with emphasis given to biosensors performing broadband sensing of small-volume liquid samples. Within this context, this work aims at investigating a microfluidic sensor based on a broadband one-port coplanar interdigital capacitor (IDC). The microwave performance of the sensor loaded with lossless materials under test (MUTs) is achieved by using finite-element method (FEM) simulations carried out with Ansoft’s high frequency structure simulator (HFSS). The microfluidic channel for the MUT has a volume capacity of 0.054 μL. The FEM simulations show a resonance in the admittance that is reproduced with a five-lumped-element equivalent-circuit model. By changing the real part of the relative permittivity of the MUT up to 70, the corresponding variations in both the resonant frequency of the FEM simulations and the capacitance of the equivalent-circuit model are analyzed, thereby enabling assessment of the permittivity sensitivity of the studied IDC. Furthermore, it is shown that, although the proposed local equivalent-circuit model is able to mimic faithfully the FEM simulations locally around the resonance in the admittance, a higher number of circuit elements can achieve a better agreement between FEM and equivalent-circuit simulation over the entire broad frequency going range from 0.3 MHz to 35 GHz.

Graphical Abstract

1. Introduction

Bioelectronics is an interdisciplinary research field that bridges electronics and life sciences. The first steps of bioelectronics date back to Galvani’s electrical experiments on frogs in the second half of the 18th century [1]. Over the years, this research field has continually evolved and nowadays is witnessing extraordinary progress, thus paving the way to the remarkable development in many bioelectronics applications, among which one of the most representative is the cardiac pacemaker. To underpin this rapid expansion, growing attention is being paid to the study and design of microwave electronics devices, circuits, and systems, thereby enabling the development of microwave electronics techniques oriented to applications in life sciences. In this context, a pivotal role is played by high-frequency sensors, going from radar systems (e.g., [2,3,4,5,6]) to biological sensors (e.g., [7,8,9,10,11,12,13,14]). Among the various applications in which high-frequency sensors can be useful, there is a significant use of microwave biological sensors in dielectric spectroscopy. By studying the interaction between electromagnetic fields and materials, dielectric spectroscopy can provide valuable insights into the frequency-dependent dielectric properties of a large variety of samples [15], like tissue [16], blood [17], proteins [18], and cultured cells [19]. The knowledge achieved in this way finds many applications, such as microwave imaging for cancer detection [20] and microwave hyperthermia for cancer therapy [21]. Compared to the traditional biosensing techniques based on optical and mechanical detection, high-frequency dielectric spectroscopy is very effective and attractive, due to notable benefits such as being label-free, non-invasive, contactless, rapid, and low cost [22]. The recent advances in microwave dielectric spectroscopy along with the progress in micro- and nanotechnologies have stimulated the development of miniature microwave biosensors for liquid characterization, enabling development in the lab-on-a-chip devices [23,24]. Microwave biological sensors for microliter and even nanoliter liquid samples find applications in many research fields, such as chemical synthesis, biological analysis, and medical diagnosis [25,26,27,28,29,30,31,32]. There has therefore been great interest in recent years in the development of miniature biosensors based on microwave dielectric spectroscopy analysis for liquid characterization. With this purpose, many efforts have been made in exploring the equivalent-circuit (EC) modeling of microwave microfluidic biosensors [33,34,35,36,37,38,39,40]. To deliver the microwave power to the microfluidic channel, the coplanar waveguide (CPW) technology is widely used, such as the CPW transmission line (CPW-TL) [25,41] and the CPW-fed interdigital capacitor (IDC) [12,30] with the channel integrated on the top surface. This is because the planar structures have the advantage of being easy to fabricate and integrate with microfluidic channels, especially when compared to bulky and expensive non-planar resonator structures.
To contribute to the advancement of this relevant and timely field of research, the present article is devoted to the extraction of an equivalent-circuit model and to the resonance-based investigation of the permittivity sensitivity, considering as case study a one-port coplanar interdigital capacitor (IDC) aimed at microfluidic broadband bioelectronics applications. Over the past few decades, interest in capacitors based on interdigital electrodes (IDE) has expanded from the traditional applications in communication systems [42] to the more recent ones in the biosensing field [12,30,37,43,44,45,46]. Although a few studies have been reported on exploiting this resonance of the IDC structure for biosensing purpose [45], the biomaterial characterization is advantageous at relatively low frequencies to avoid the onset of IDC self-resonance effects [37]. Nevertheless, different biological materials can show different dispersion properties at different frequency ranges, so it is necessary to analyze the spectroscopy of biological materials in a broad band. Broadband spectroscopy can be obtained by combing an IDC with a CPW line to avoid the onset of IDC self-resonance [28,47]. This method is time-consuming. Therefore, herein try to extend the IDC model to high frequencies to replace the use of CPW line for broadband measurements. It should be underlined that our results are purely based on simulations that are performed with finite-element and equivalent-circuit methods. The simulated biosensor consists of an SU-8 microfluidic structure aimed at the confinement of small volumes of samples in the CPW-IDC sensing region, gold sensing electrodes, and a quartz substrate. The SU-8 is used for the microfluidic channel as this is an inexpensive and biocompatible material. The gold is chosen as electrode material, as this noble metal is not harmful and does not adversely affect the physiology of biomaterials. The quartz is selected as substrate material owing to its great features, such as high optical transparence to a wide range of wavelengths, allowing visual inspection of the MUT with a microscope and even UV absorbance-based detection [48], high compatibility with various polymer materials, allowing more flexibility in the choice of microfluidic materials, low loss tangent, allowing achievement of low dielectric loss at microwave frequencies, and good thermal conductivity, allowing high operating temperatures. The practical sensing applications of the studied biosensor can go from permittivity to temperature characterization by using microwave dielectric spectroscopy analysis for monitoring the permittivity of a liquid and its temperature dependence. By placing many fingers in parallel, the interdigital (or interdigitated) layout allows one to increase the sensing area of the capacitive sensor and to minimize the parasitic resistive contributions [42,49]. The achieved increase in the capacitance results in turn in a lower resonant frequency, which is here exploited for sensing purpose. The main advantages of choosing a one-port device consist of allowing further sensor miniaturization and making experimental characterization simpler and faster, as it requires a one-port calibration that can be even done by connecting the sensor directly to a one-port vector network analyzer. The present investigation extends our previous work, by which the analysis has been limited to the pure IDC sensor (i.e., with air on top of the sensing area) that was designed using a finite-element method (FEM) simulator and, subsequently, modeled with a lumped-element equivalent-circuit [39]. Here, the capacitor sensing area (i.e., 450 × 300 μm2) is loaded with lossless materials under test (MUTs) having different values of the real part of the relative permittivity (εr), spanning from 15 to 70. The FEM simulations show that the presence of the MUT, in place of the air inside the channel, modifies the electrical characteristics and leads to the appearance of a resonance in the admittance that can exploited for detecting variations in εr. The determination of a five-lumped-element equivalent-circuit model enables a faithful reproduction of the FEM simulations, especially close to the resonant frequency. The impact of εr on both resonant frequency and capacitance is investigated and then used to estimate quantitatively the sensor sensitivity. As will be shown later, the permittivity sensitivity of the tested IDC decreases with increasing εr when using the resonant frequency as sensing parameter, while it is almost constant as a function of εr when using the capacitance as sensing parameter. For the sake of completeness, a seven-lumped-element equivalent-circuit model is extracted to achieve a better agreement with the FEM simulations over the full frequency range, going from 0.3 MHz to 35 GHz. However, although adding circuit elements leads a more powerful model, the five-element model offers a good compromise between model complexity and prediction accuracy, making it possible to use the extracted capacitance as a sensing parameter.
The remainder of this article is structured as follows. Section 2 is dedicated to the description of the studied biosensor. Section 3 is focused on the equivalent-circuit-based modeling of the permittivity-dependent resonance for sensitivity-based analysis. Section 4 discusses a modified version of the equivalent-circuit model for improving the model accuracy outside the frequency range of the resonance. Finally, Section 5 is devoted to the conclusions.

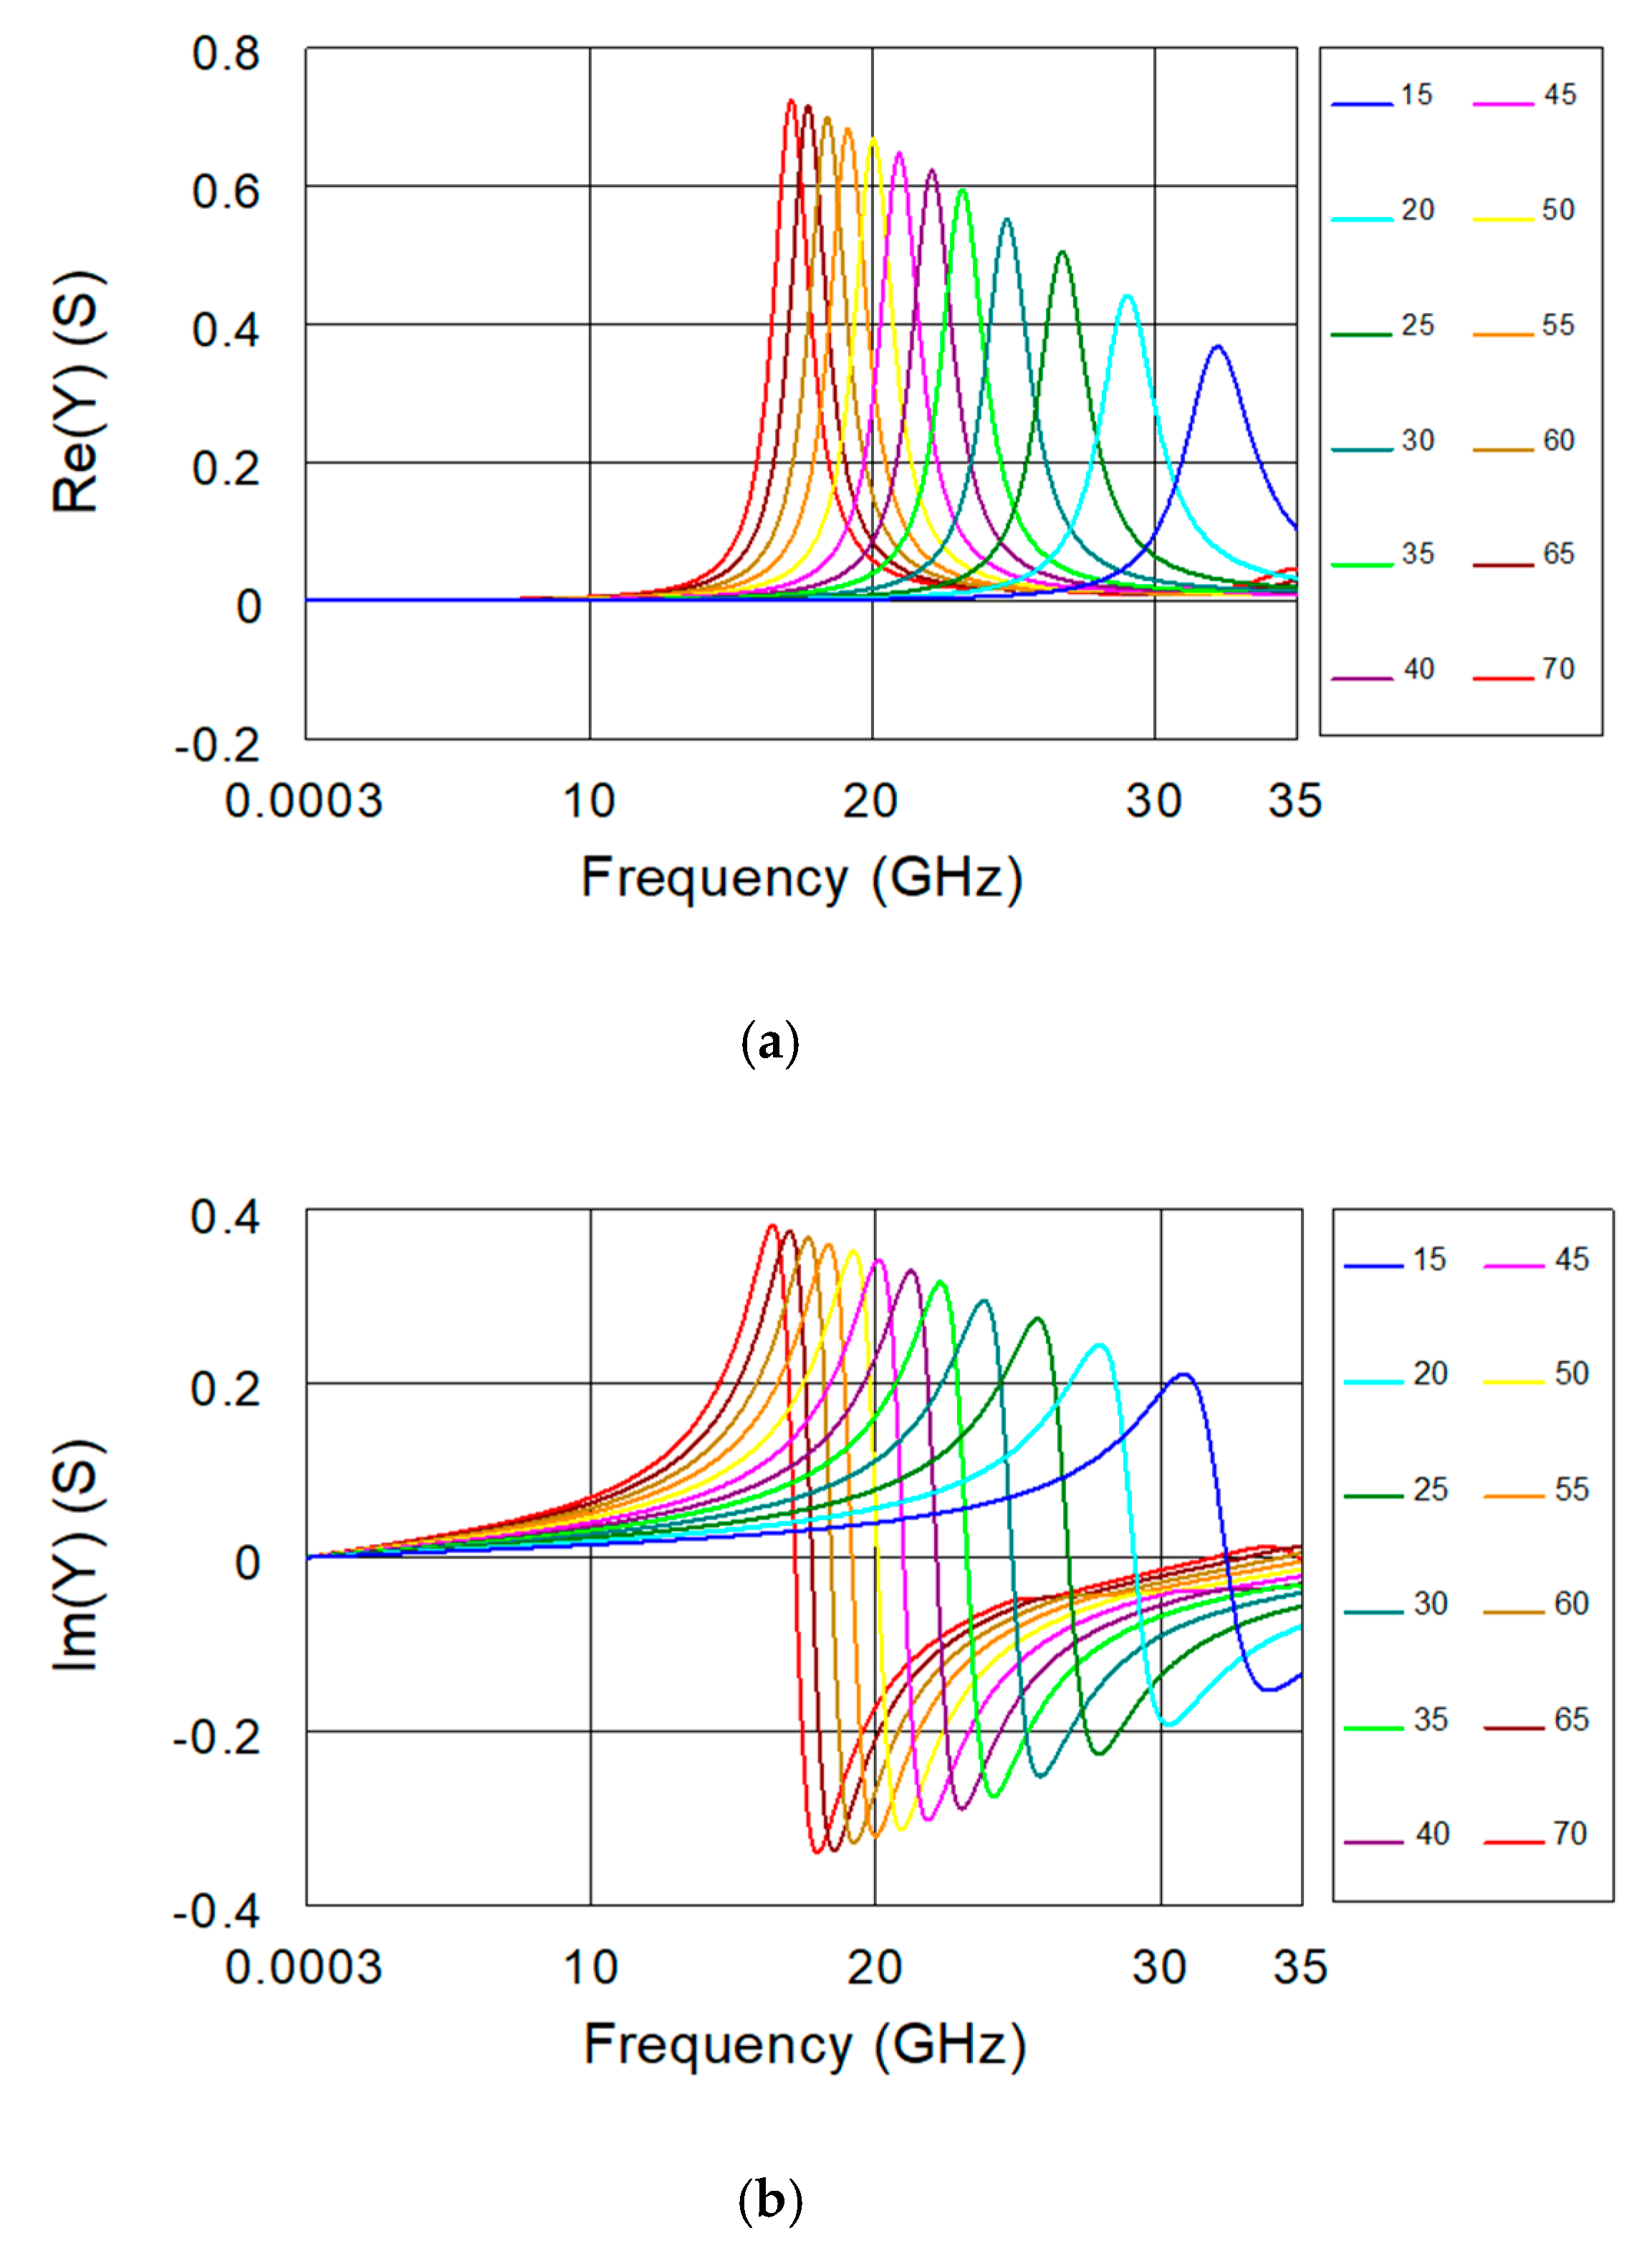
2. Biosensor Description and FEM Simulations

Figure 1 shows a top-view of the analyzed microfluidic sensor based on a one-port coplanar interdigital capacitor. The IDC sensor is studied using the 3D FEM analysis performed via Ansoft’s high frequency structure simulator (HFSS). FEM simulations are performed in the frequency range from 0.3 MHz to 35 GHz with a step of 21.875 MHz.
Au electrodes are located on top of the quartz substrate having a dielectric constant and a loss tangent of 3.78 and 0, respectively. The thickness of the Au electrodes and quartz substrate are 600 nm and 1 mm, respectively. An SU-8 layer is integrated on top of the IDC structure to form a microfluidic channel for the MUT. The thickness of the SU-8 microfluidic channel is 400 μm, thereby implying a MUT sensing height of 400 μm. The slot width, signal width, and finite ground width of the coplanar waveguide feeding line are 20 μm, 110 μm, and 150 μm, respectively. This leads to a MUT sensing width of 450 μm (i.e., 2 × 20 + 110 + 2 × 150 μm). There are, in total, 15 interdigitated fingers in the sensing area. The length of the fingers is 290 μm, whereas the finger width, the gap between fingers, and the gap at the end of each finger are all 10 μm. Therefore, the MUT sensing length is 300 μm as it is defined as the sum between the finger length and the gap at the end of each finger. Consequently, the liquid volume within the microfluidic channel is 0.054 μL (i.e., 450 × 300 × 400 μm3). It should be underlined that the actual MUT sensing volume is even smaller. This is because the electric field does not extend 400 μm above the IDC sensor and the most sensitive height above the sensing surface is about 20 μm [37].
The FEM simulations are performed for the sensor loaded with lossless MUTs having a real part of the relative permittivity varied from 15 to 70 with a step of 5. The achieved FEM results are then used for lumped EC model extraction, as will be discussed in the following two sections. To put this study into perspective with respect to the literature, Table 1 summarizes a comparison among different studies dealing with microfluidic IDC biosensors.

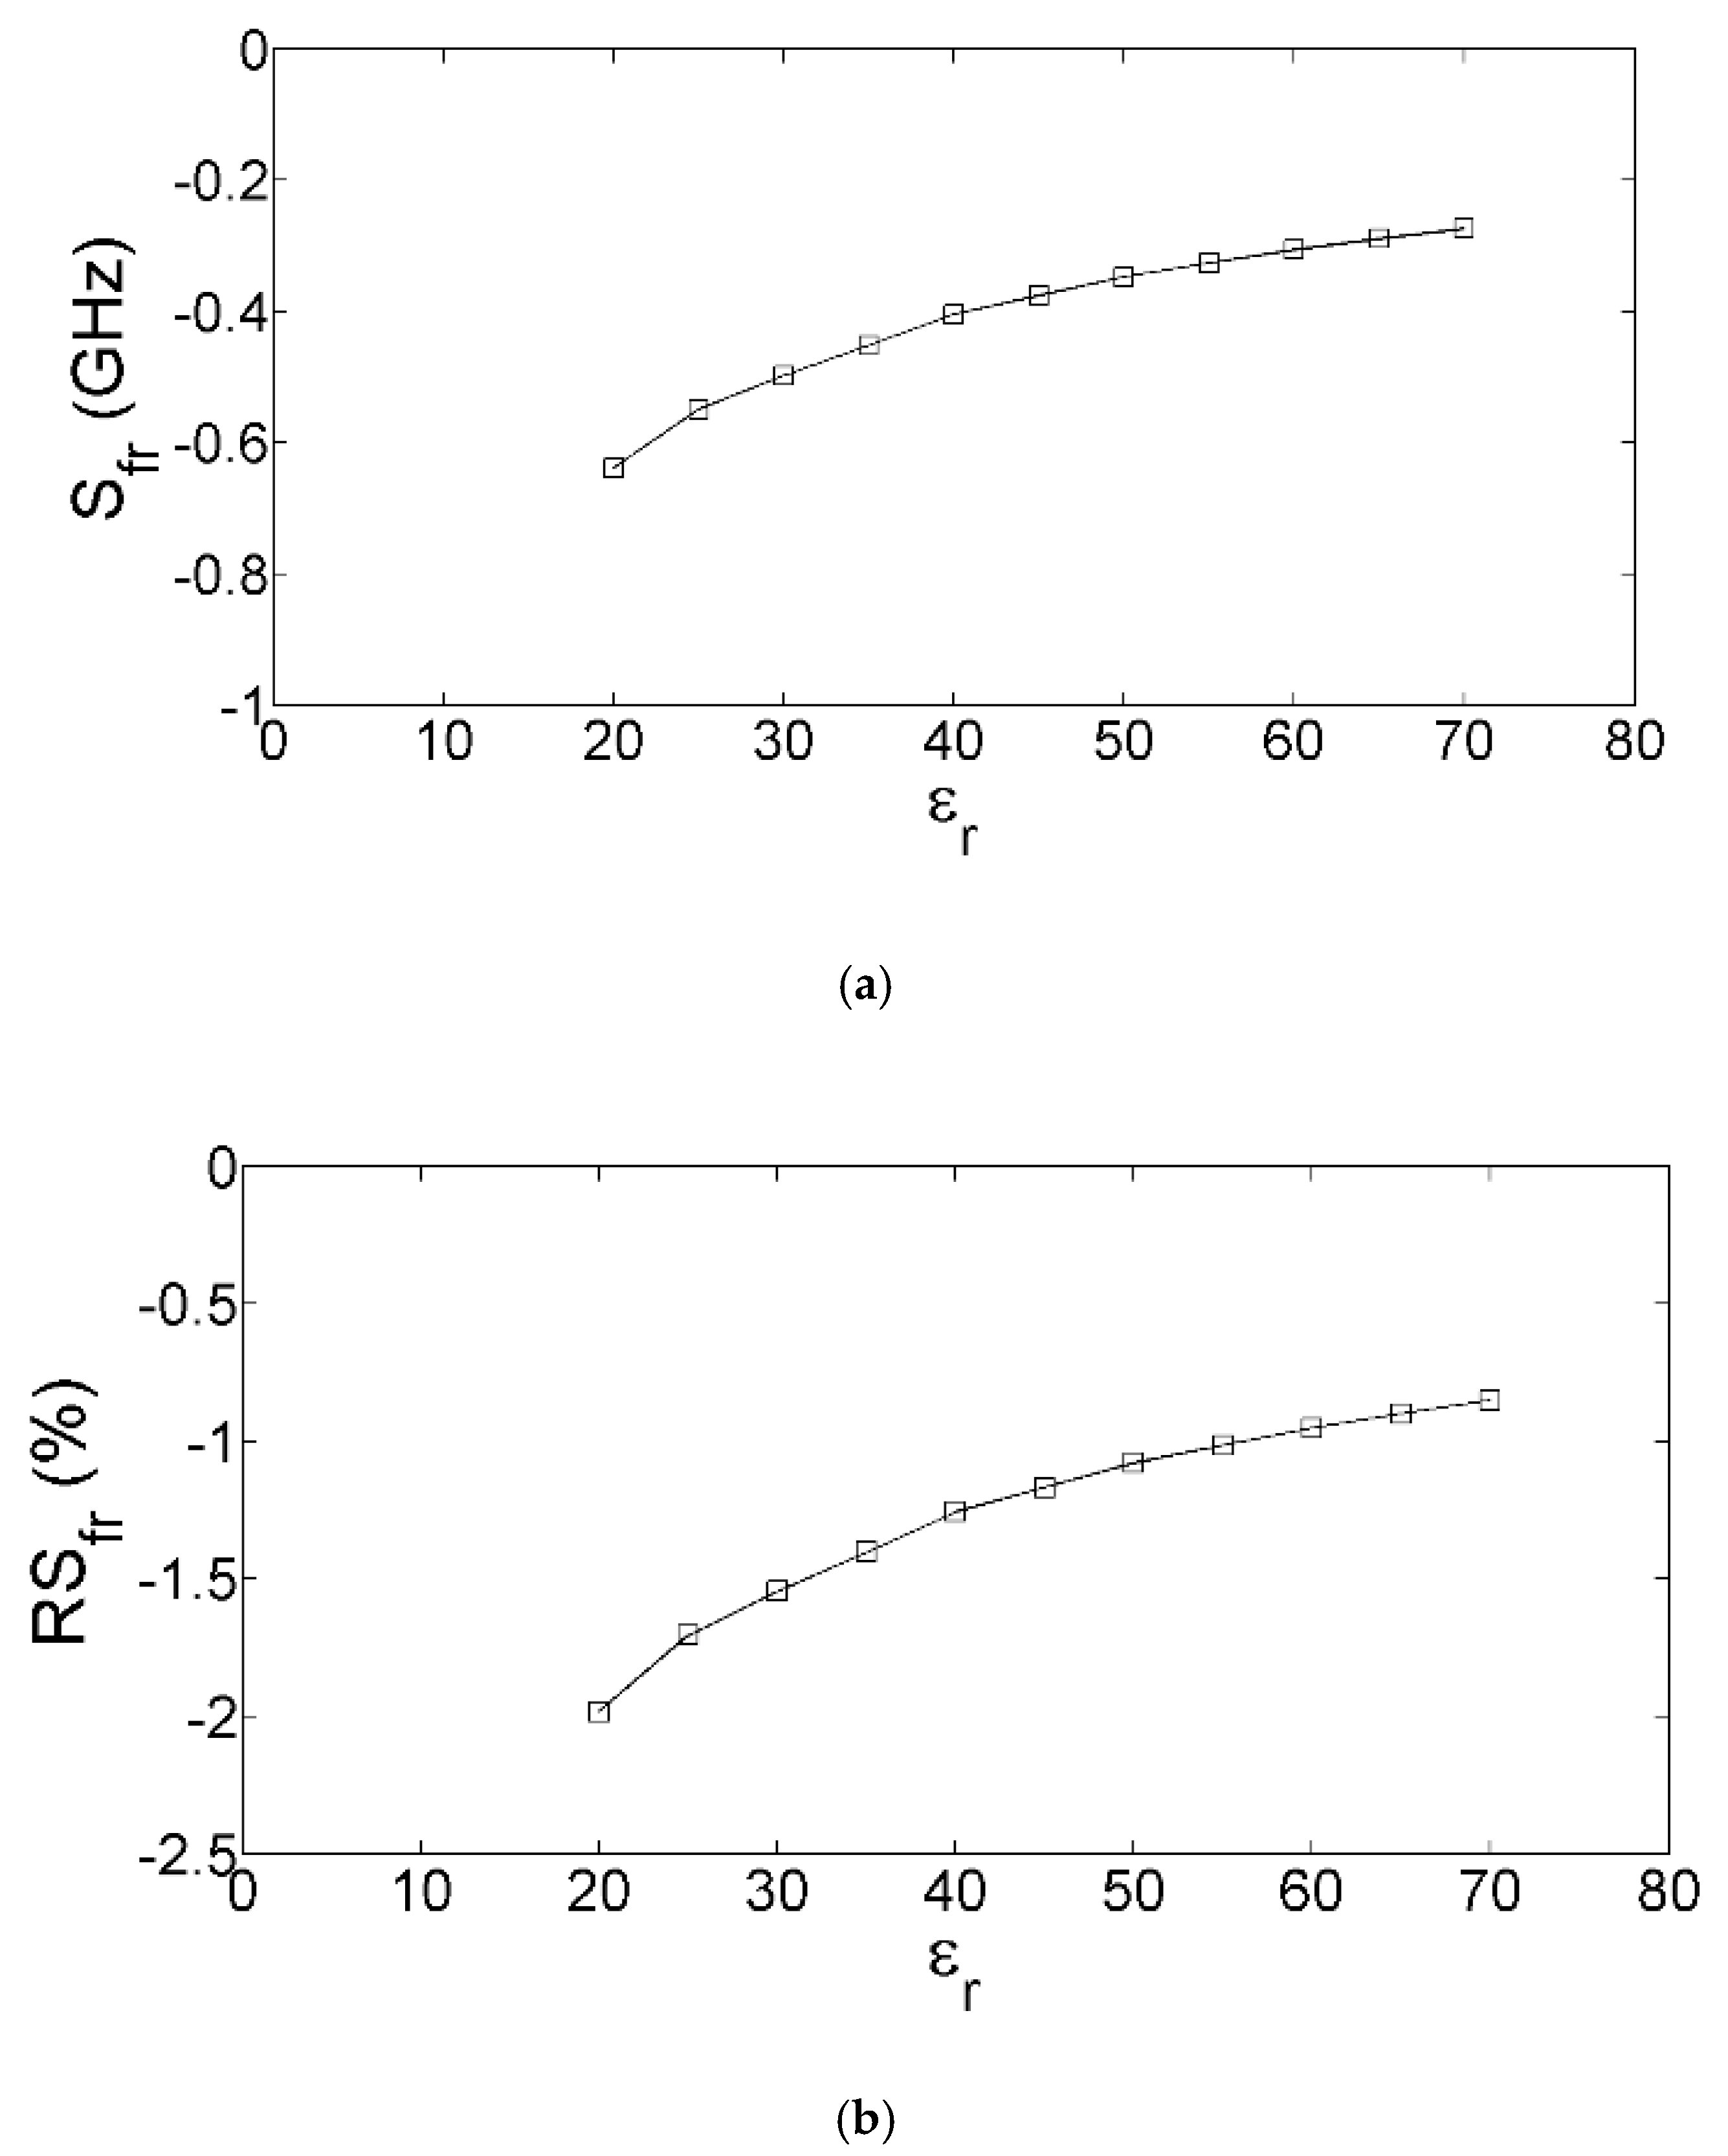
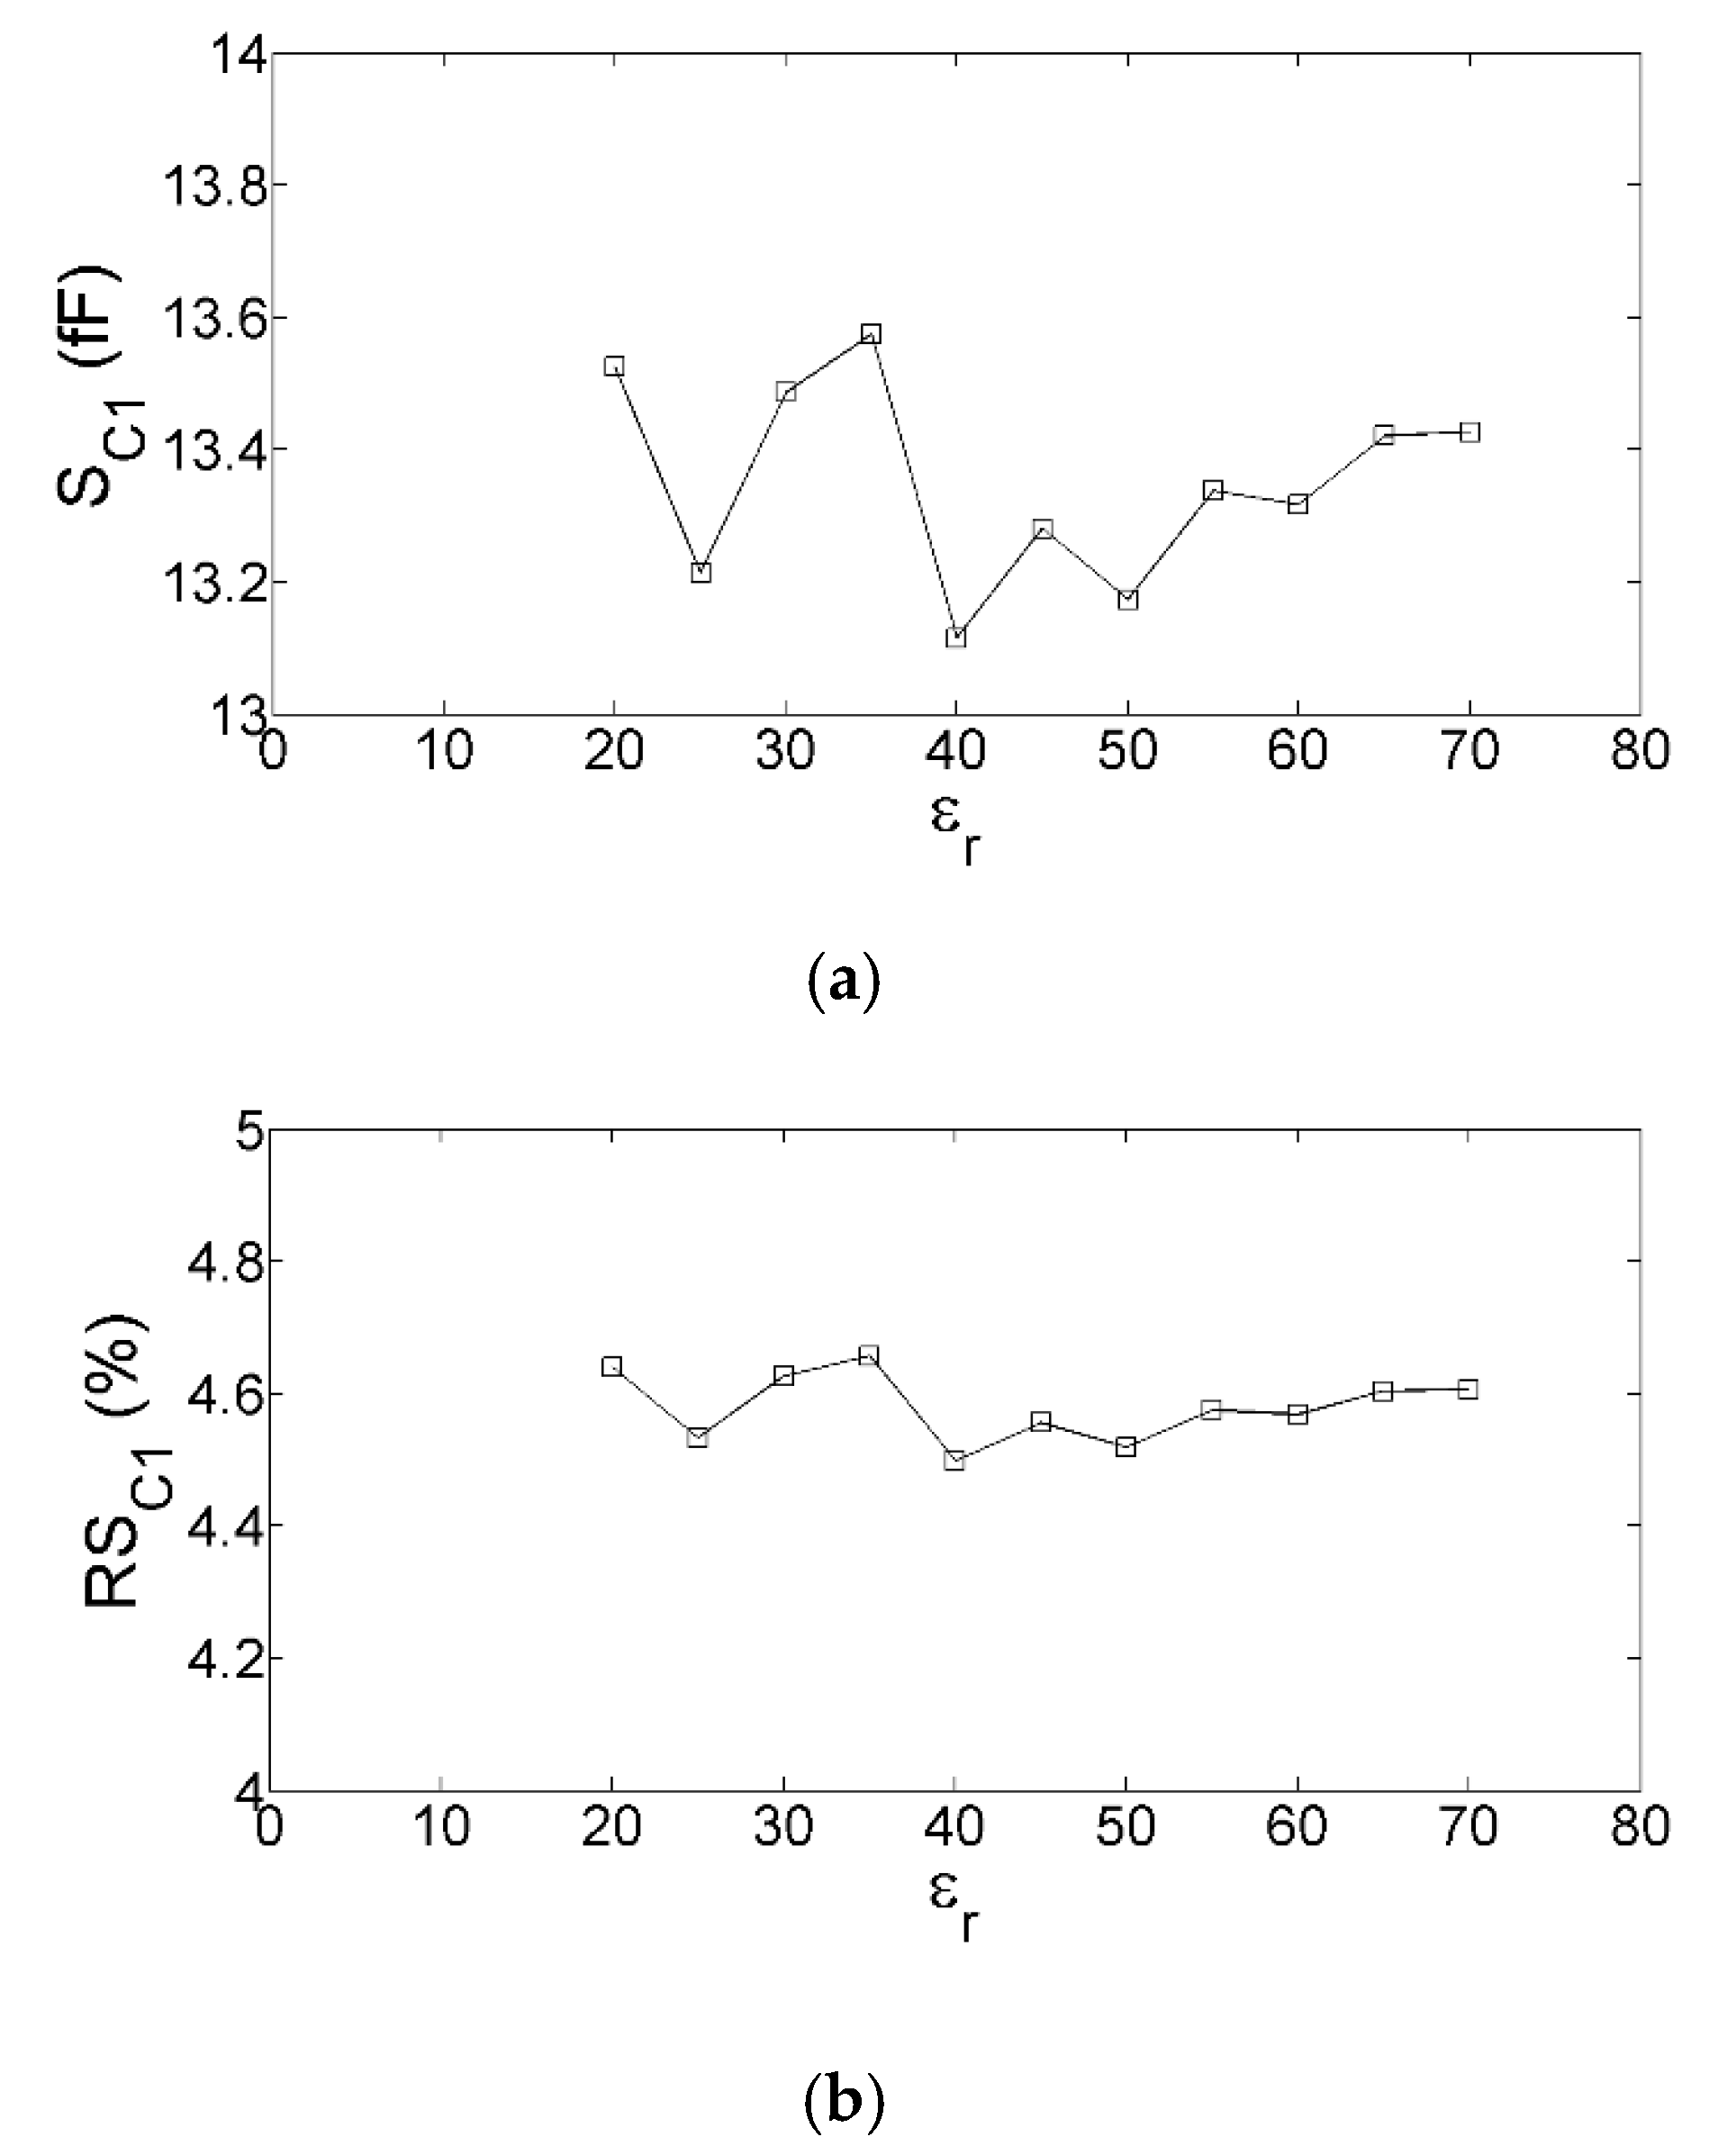
3. Equivalent-Circuit-Based Modeling and Sensitivity-Based Analysis

As reported in [39], the lumped-element equivalent-circuit model of the studied pure IDC sensor consists of the parallel connection of the R1L1C1 series and the R2C2 series (see Figure 2). The extracted element values with air as MUT are: R1 = 1.57 Ω, L1 = 83.81 pH, C1 = 60.47 fF, R2 = 21.12 kΩ, and C2 = 3.46 fF. The three elements R1, L1, and C1 represent the resistive, inductive, and capacitive contributions of the multi-finger structure, respectively. The R2C2 network was added in parallel with the R1L1C1 network to reproduce the FEM simulations showing a remarkable increase of Re(Z) with decreasing frequency, since the R1L1C1 series is able to reproduce only a frequency-independent Re(Z)
Z = R 1 + j ( ω L 1 1 ω C 1 ) .
The physical origin of C2 was ascribed to the capacitive coupling between fingers and ground (i.e., the lateral grounds of the coplanar ground-signal-ground structure as underneath the substrate there is no bottom ground) through the quartz substrate and/or air and R2 was used to introduce a time constant associated with the dispersion of this coupling. It is worth noticing that C1, representing the capacitive coupling between the fingers, was found to be much larger than C2, representing the capacitive coupling between fingers and ground. This is consistent with the fact that the distance between the fingers is much smaller than the distance between fingers and ground. The modeling procedure was successfully validated for the case of air as MUT, through the comparison between FEM and equivalent-circuit simulations over the full studied frequency range [39].
From Equation (1), it follows that the admittance of the R1L1C1 series is given by
Y = R 1 R 1 2 + ( ω L 1 1 ω C 1 ) 2 j ( ω L 1 1 ω C 1 ) R 1 2 + ( ω L 1 1 ω C 1 ) 2 .
This equation highlights that a resonance should occur when the inductive and the capacitive reactances of the R1L1C1 series cancel each other, leading to a resonant frequency (fr) given by
f r = 1 2 π L 1 C 1 .
When the frequency reaches fr, Re(Y) should exhibit a peak equal to the inverse of R1 and Im(Y) should become equal to zero. The admittance of the sensor can be modeled by using only the R1L1C1 network at the resonant frequency, since this network reduces to only R1 that is then connected in parallel to the rest of the circuit having a larger impedance. Nevertheless, this resonance of the R1L1C1 series was not observed in the FEM simulations of the pure IDC sensor [39], since both Equation (3) based on only the R1L1C1 network and the five-element equivalent-circuit simulations show that the resonance occurs at 70.7 GHz which is far beyond the upper frequency limit of the FEM simulations. In the present study, the real part of the relative permittivity of the MUT is increased enough to make the resonance observable, by exploiting the fact that a higher εr leads to a larger C1 and, consequently, smaller fr (see Equation (3)). A higher εr implies a larger C1, since this element represents the capacitive coupling of the multi-finger structure through the quartz substrate and air for the pure IDC sensor but, when a MUT is placed on top of the sensing area, the capacitive coupling through the MUT should be taken into account in the estimation of C1. As illustrated in Figure 3, the sensor resonant frequency can be defined as the frequency at which the admittance has a peak in the real part and zero imaginary part. The FEM simulations show that, by increasing the real part of the relative permittivity of the MUT, the resonant frequency shifts towards lower values and, in addition, the peak in Re(Y) becomes progressively higher. The achieved results are illustrated in Figure 4. The observed reduction of the resonant peak in Re(Y) at lower εr might be correlated to the skin effect of the metallization of the multi-finger structure [50], implying an increase of the resistive contributions at higher frequencies.
To assess the sensing performance of the tested IDC as an εr sensor, the absolute (Sfr) and relative (RSfr) sensitivity of fr to changes in εr are calculated by using a reference εr (εro) of 15
S f r = Δ f r Δ ε r = f r f r o ε r ε r o ,
R S f r = 100 Δ f r f r o Δ ε r .
As should be expected from the fact that fr decreases with increasing εr, both Sfr and RSfr are negative and their magnitudes are reduced with increasing εr (see Figure 5). Sfr reaches its maximum magnitude of 0.638 GHz/Δ1 when εr is 20, implying that a variation in εr value of 5 can be detected as a variation in fr value of 3.19 GHz.
The values of C1 can be straightforwardly determined from fr, since the inductance can be assumed to be independent of εr
C 1 = 1 ( 2 π f r ) 2 L 1 .
In line with the expectations [37], Figure 6 shows that the extracted C1 exhibits a linear increase with increasing εr. Likewise to Sfr and RSfr, the absolute (SC1) and relative (RSC1) sensitivity of C1 to changes in εr can be calculated as
S C 1 = Δ C 1 Δ ε r ,
R S C 1 = 100 Δ C 1 C 1 o Δ ε r .
As should be expected from the fact that C1 increases linearly with increasing εr, both SC1 and RSC1 are positive and practically insensitive to εr (see Figure 7). The average values of SC1 and RSC1 are 13.35 fF/Δ1 and 4.58%, respectively. The good linear relationship between C1 and εr implies that the average value of SC1 is almost equal to the slope of the approximating straight line (i.e., 13.37 fF).
To enable the lumped-element equivalent circuit to reproduce faithfully the resonance in the admittance of the sensor loaded with MUTs, C1 is extracted from fr (see Equation (6)) and R1 is set equal to the inverse of the resonant peak in Re(Y). As a few illustrative examples, Figure 8 reports the good agreement between the FEM and equivalent-circuit simulations of the resonance affecting the admittance of the sensor at the lowest, highest, and at a middle value of εr. Although some discrepancies might be observed as the frequency departs from the resonant frequency, the extracted model can accurately mimic the FEM simulations locally around the resonance in the admittance, thus enabling the use of this biosensor for εr sensing.
For the sake of completeness, Table 2 lists the values of fr and Re(Y) @ fr, which were obtained from the FEM simulations performed by considering the microfluidic biosensor loaded with a MUT having different εr (see Figure 1), and the corresponding extracted values of C1 and R1, which were used for performing the εr-dependent simulations of the achieved equivalent-circuit model.

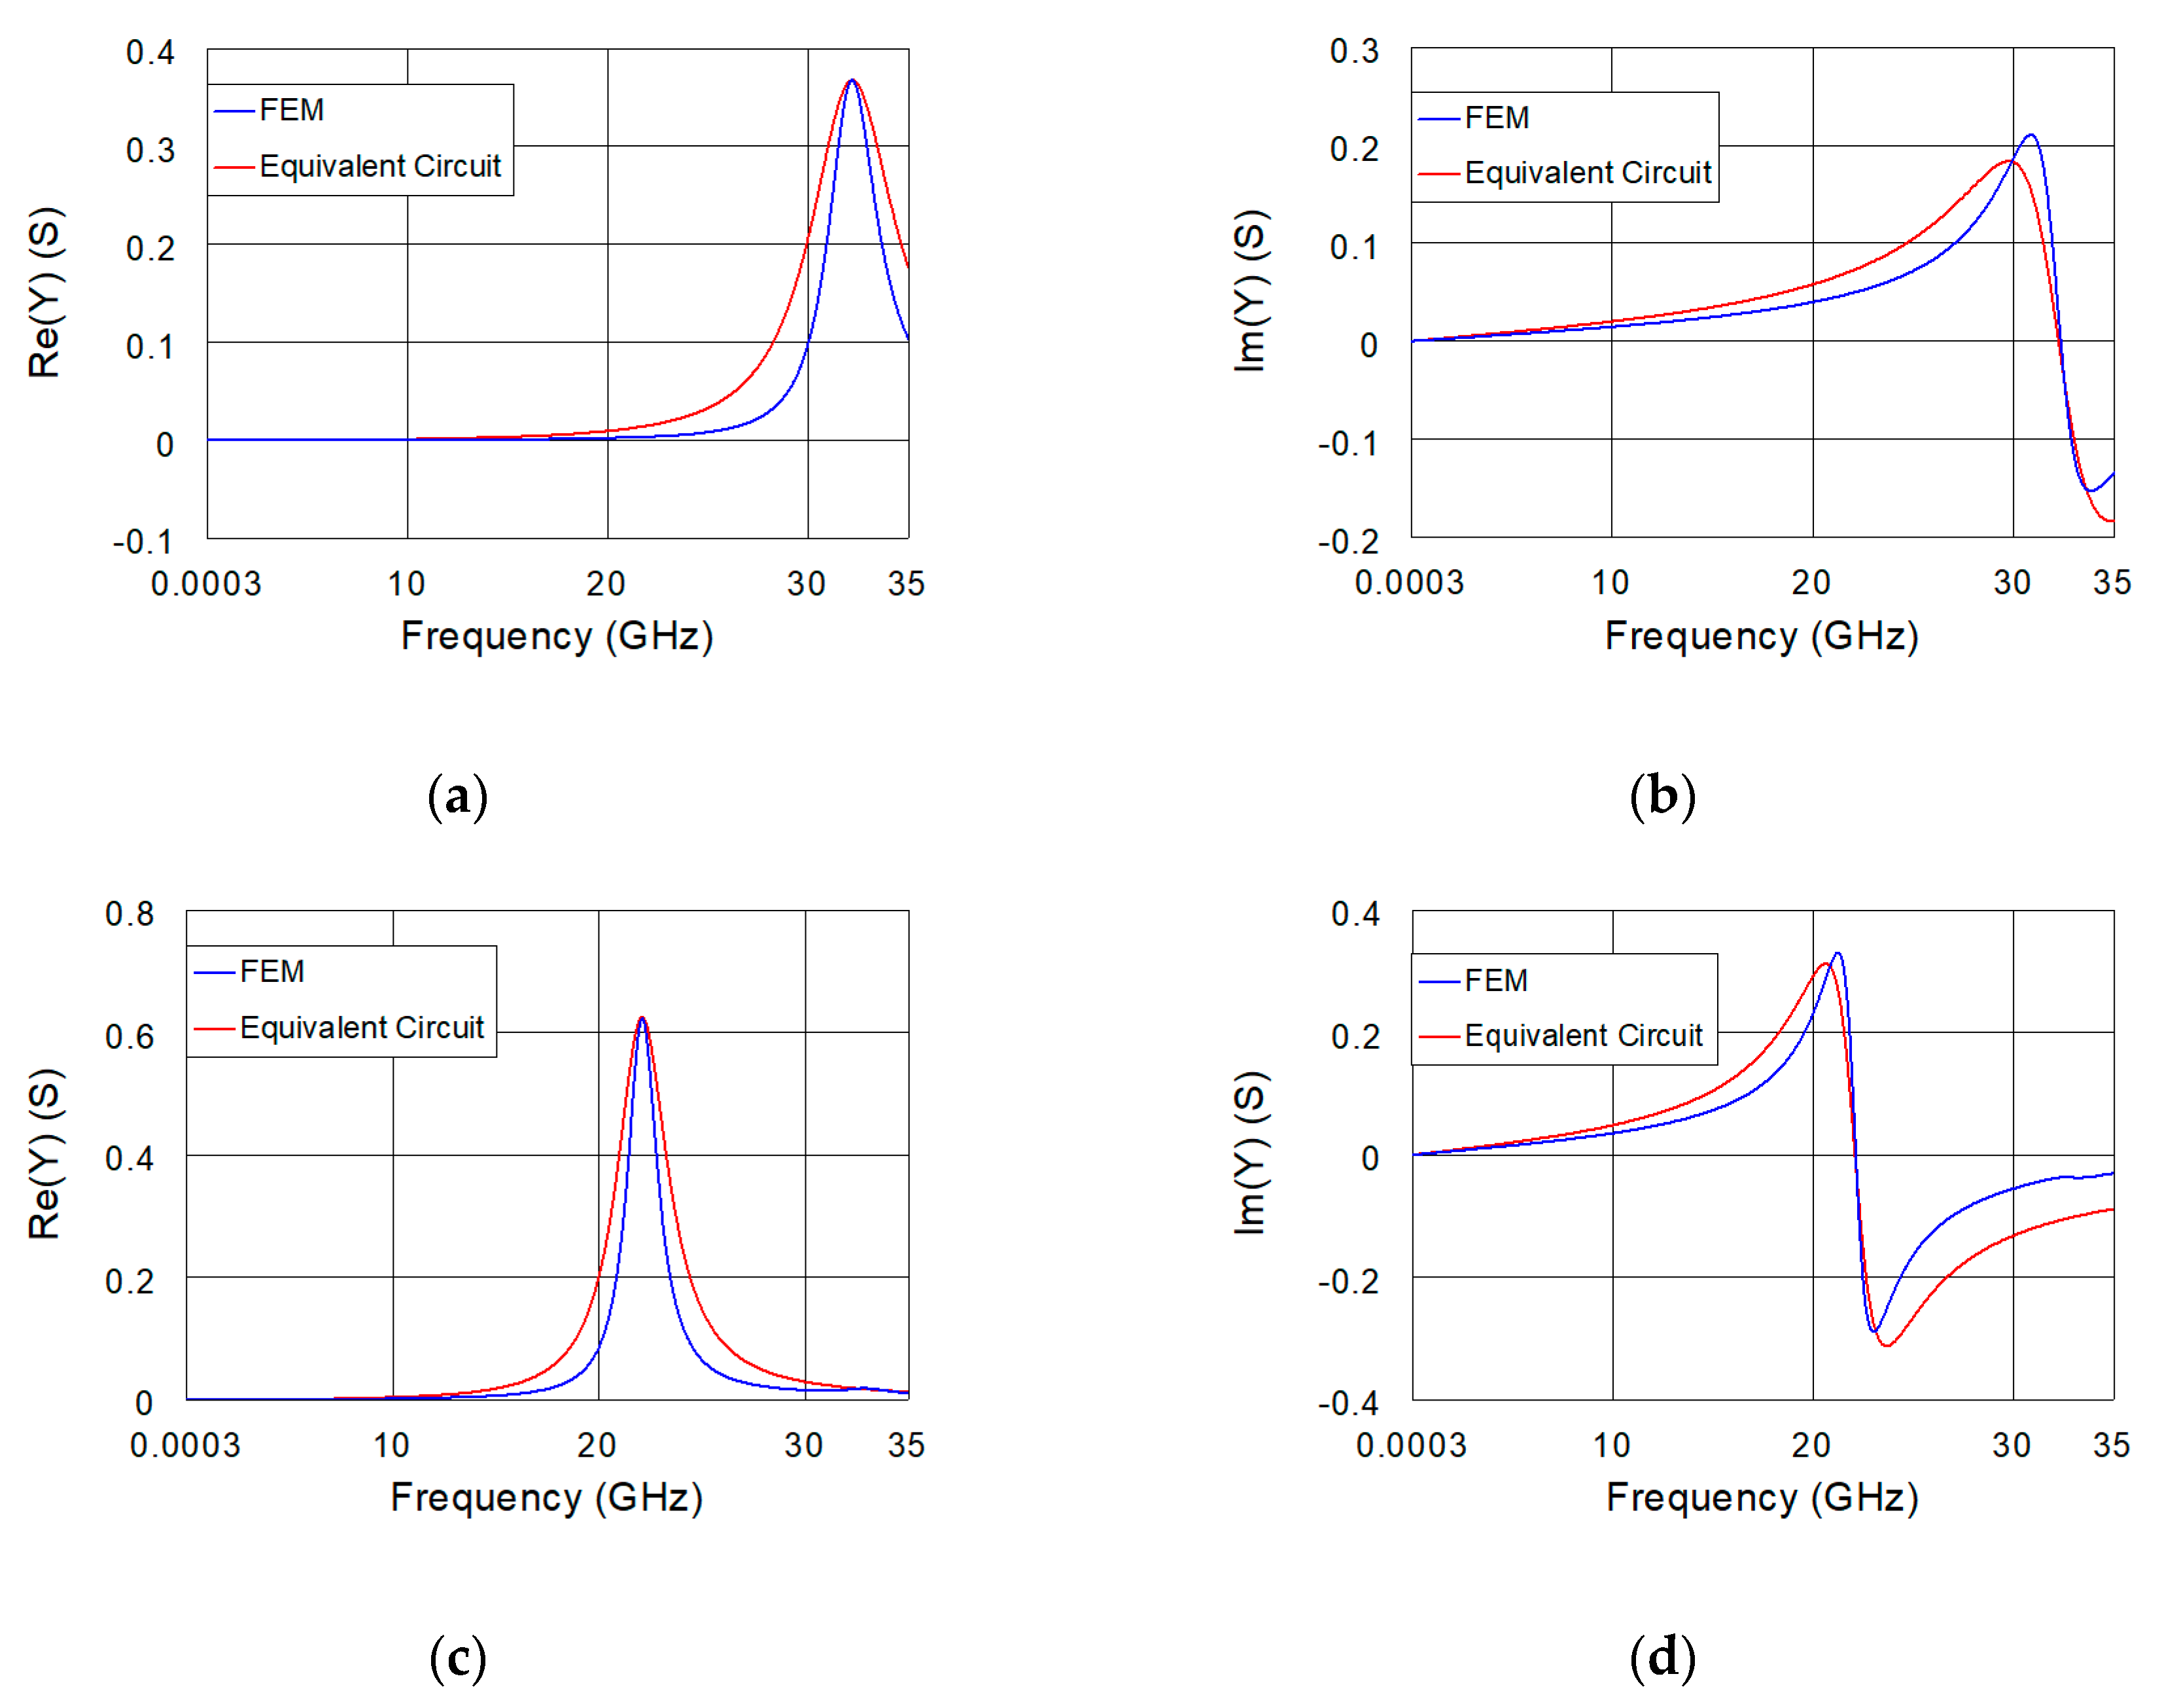
4. Modified Version of the Equivalent Circuit

For the sake of completeness, it is worthy noticing that the model needs to be modified to mimic the admittance and its corresponding impedance over the full frequency range of the FEM simulations. As an illustrative example, Figure 9a shows that Re(Z) first decreases, then stays constant, next increases, and finally decreases again for MUTs with higher εr. The low-frequency reduction of Re(Z) can be reproduced by selecting appropriate values of R2 and C2, whereas the high-frequency behavior in Re(Z) implies that the model complexity should be increased. As a matter of fact, an R3C3 series should be added in parallel to the circuit to allow mimicking the high-frequency behavior of Re(Z) (see Figure 10). To give an illustrative example, Figure 11 shows that, by manually tuning the values of R2, C2, R3, and C3, the model is able to reproduce the behavior of the impedance over the full studied frequency range, including the low-frequency decrease, the high-frequency increase, and the final decrease of Re(Z). The values of the extracted elements are: R1 = 1.38 Ω, L1 = 83.81 pH, C1 = 1030 fF, R2 = 7 kΩ, C2 = 200 fF, R3 = 0.5 Ω, and C3 = 430 fF. The physical origin of the R3C3 network might be ascribed to the high-frequency skin-effect losses, deviations further away from TEM-like propagation (e.g., surface-wave modes leading to high-frequency losses and dispersion as a result of the dielectric mismatch), and limitations of the lumped-element approximation at higher frequencies. It should be highlighted that, analogously to the fact that the studied IDC sensor loaded with a MUT having high εr exhibits a peak in Re(Z) at frequencies beyond the resonant frequency of the admittance, large (field-effect transistors) FETs based on multi-finger lay-out exhibit a peak in the real part of each impedance parameter at frequencies beyond the cutoff frequency (fT), turning into a current-gain peak and originating from a resonance of the extrinsic reactive elements [51,52].
To estimate the discrepancies between FEM and equivalent-circuit simulations, Figure 12 shows the frequency dependence of the difference between FEM and equivalent-circuit simulations of the real and imaginary parts of the admittance for the case with a real part of the relative permittivity of 70. As can be observed, although the use of the modified broadband model enables reduction of the discrepancies over the extremely wide frequency range, the local model can keep discrepancies very small locally around the resonance in the admittance.
As a final remark, it can be highlighted that, although a higher number of circuit elements can help to achieve a more powerful model, the local model proposed in the previous section represents a good trade-off between complexity and accuracy, enabling an accurate and straightforward reproduction of the sensor resonance and then determination of the permittivity sensitivity by using the extracted capacitance C1 as sensing parameter.

5. Conclusions

A microfluidic biosensor based on a microwave one-port coplanar interdigital capacitor has been investigated for permittivity sensing. A FEM simulator has been used to simulate the sensor performance over the broad frequency range from 0.3 MHz to 35 GHz by considering lossless MUTs having different real part of the relative permittivity. The observed resonance in the sensor admittance has been reproduced by using the lumped-element equivalent-circuit approach. Furthermore, assessment of the sensor sensitivity to changes in the real part of the relative permittivity of the MUT has been accomplished by investigating the resonant frequency in the FEM simulations and the capacitance of the equivalent-circuit model. It has been shown that, by using the extracted capacitance instead of the resonant frequency as sensing parameter, the relative sensitivity of the sensor to changes in the real part of the relative permittivity results to be significantly enhanced. The significance of this study aimed at investigating and modeling an IDC sensor up to high frequencies stems from the following considerations: examination of broadband information is of crucial importance for the analysis of biological materials like cells, using only one sensor to obtain broadband information can make the platform very user-friendly and time-consuming, and the traditional IDC characterization model limits the application to low frequency range where the resonance is not necessary to consider. For future work, this full-blown simulation-based study will be extended through experimental characterization of real liquids, thus making the analysis more challenging but also much closer to practical applications, owing to inherent contributions of both losses and frequency dependence of the permittivity.

Author Contributions

Investigation, G.C. and X.B.; Methodology, G.C., X.B., and O.J.B.; Supervision, D.M.M.-P.S., and B.N.; Writing—original draft, G.C.; Writing—review and editing, X.B., O.J.B., D.M.M.-P.S., and B.N. All authors have read and agreed to the published version of the manuscript.

Funding

This research was supported in part by the KU Leuven research project C24/15/015 Microwave Microbiology (μ2BIO) and in part by the Hercules project funding.

Conflicts of Interest

The authors declare no conflict of interest.

References

  1. Piccolino, M. Luigi Galvani and animal electricity: Two centuries after the foundation of electrophysiology. Trends Neurosci. 1997, 20, 443–448. [Google Scholar] [CrossRef]
  2. Li, C.; Peng, Z.; Huang, T.-Y.; Fan, T.; Wang, F.-K.; Horng, T.-S.; Muñoz-Ferreras, J.-M.; Gómez-García, R.; Ran, L.; Lin, J. A review on recent progress of portable short-range noncontact microwave radar systems. IEEE Trans. Microw. Theory Tech. 2017, 65, 1692–1706. [Google Scholar] [CrossRef]
  3. Mercuri, M.; Soh, P.J.; Pandey, G.; Karsmakers, P.; Vandenbosch, G.A.E.; Leroux, P.; Schreurs, D.M.M.-P. Analysis of an indoor biomedical radar-based system for health monitoring. IEEE Trans. Microw. Theory Tech. 2013, 61, 2061–2068. [Google Scholar] [CrossRef] [Green Version]
  4. Garripoli, C.; Mercuri, M.; Karsmakers, P.; Soh, P.J.; Crupi, G.; Vandenbosch, G.A.E.; Pace, C.; Leroux, P.; Schreurs, D.M.M.-P. Embedded DSP-based telehealth radar system for remote in-door fall detection. IEEE J. Biomed. Health Inf. 2015, 19, 92–101. [Google Scholar] [CrossRef] [PubMed] [Green Version]
  5. Álvarez López, Y.; García Fernández, M.; Grau, R.; Las-Heras, F. A synthetic aperture radar (SAR)-based technique for microwave imaging and material characterization. Electronics 2018, 7, 373. [Google Scholar] [CrossRef] [Green Version]
  6. Mercuri, M.; Lorato, I.R.; Liu, Y.H.; Wieringa, F.; Van Hoof, C.; Torfs, T. Vital-sign monitoring and spatial tracking of multiple people using a contactless radar-based sensor. Nat. Electron. 2019, 2, 252–262. [Google Scholar] [CrossRef]
  7. Whitesides, G.M. The origins and the future of microfluidics. Nature 2006, 442, 368–373. [Google Scholar] [CrossRef]
  8. Chretiennot, T.; Dubuc, D.; Grenier, K. A microwave and microfluidic planar resonator for efficient and accurate complex permittivity characterization of aqueous solutions. IEEE Trans. Microw. Theory Tech. 2013, 61, 972–978. [Google Scholar] [CrossRef] [Green Version]
  9. Abduljabar, A.A.; Clark, N.; Lees, J.; Porch, A. Dual mode microwave microfluidic sensor for temperature variant liquid characterization. IEEE Trans. Microw. Theory Tech. 2017, 65, 2572–2582. [Google Scholar] [CrossRef] [Green Version]
  10. Bao, X.; Liu, S.; Ocket, I.; Bao, J.; Schreurs, D.M.M.-P.; Zhang, S.; Cheng, C.; Feng, K.; Nauwelaers, B. A general line-line method for dielectric material characterization using conductors with the same cross-sectional geometry. IEEE Microw. Wirel. Compon. Lett. 2018, 28, 356–358. [Google Scholar] [CrossRef]
  11. Mohd Bahar, A.A.; Zakaria, Z.; Md Arshad, M.K.; Alahnomi, R.A.; Abu-Khadrah, A.I.; Sam, W.Y. Microfluidic biochemical sensor based on circular SIW-DMS approach for dielectric characterization application. Int. J. RF Microw. Comput.-Aided Eng. 2019, 29, e21801. [Google Scholar] [CrossRef]
  12. Markovic, T.; Bao, J.; Maenhout, G.; Ocket, I.; Nauwelaers, B. An interdigital capacitor for microwave heating at 25 GHz and wideband dielectric sensing of nL volumes in continuous microfluidics. Sensors 2019, 19, 715. [Google Scholar] [CrossRef] [PubMed] [Green Version]
  13. Liu, L.W.; Kandwal, A.; Cheng, Q.; Shi, H.; Tobore, I.; Nie, Z. Non-invasive blood glucose monitoring using a curved Goubau line. Electronics 2019, 8, 662. [Google Scholar] [CrossRef] [Green Version]
  14. Yeo, J.; Lee, J.-I. High-sensitivity microwave sensor based on an interdigital-capacitor-shaped defected ground structure for permittivity characterization. Sensors 2019, 19, 498. [Google Scholar] [CrossRef] [PubMed] [Green Version]
  15. Kremer, F. Dielectric spectroscopy–Yesterday, today and tomorrow. J. Non-Cryst. Solids 2002, 305, 1–9. [Google Scholar] [CrossRef]
  16. Gabriel, C.; Gabriel, S.; Corthout, E. The dielectric properties of biological tissues: I. Literature survey. Phys. Med. Biol. 1996, 41, 22–31. [Google Scholar] [CrossRef] [Green Version]
  17. Facer, G.R.; Notterman, D.A.; Sohn, L.L. Dielectric spectroscopy for bioanalysis: From 40 Hz to 26.5 GHz in a microfabricated wave guide. Appl. Phys. Lett. 2001, 78, 996–998. [Google Scholar] [CrossRef]
  18. Yokoyama, K.; Kamei, T.; Minami, H.; Suzuki, M. Hydration study of globular proteins by microwave dielectric spectroscopy. J. Phys. Chem. B 2001, 105, 12622–12627. [Google Scholar] [CrossRef]
  19. Asami, K. Characterization of biological cells by dielectric spectroscopy. J. Non-Cryst. Solids 2002, 305, 268–277. [Google Scholar] [CrossRef]
  20. Nikolova, N.K. Microwave imaging for breast cancer. IEEE Microw. Mag. 2011, 12, 78–94. [Google Scholar] [CrossRef]
  21. Bellizzi, G.G.; Crocco, L.; Battaglia, G.M.; Isernia, T. Multi-frequency constrained SAR focusing for patient specific hyperthermia treatment. IEEE J. Electromagn. RfMicrow. Med. Biol. 2017, 1, 74–80. [Google Scholar] [CrossRef]
  22. Artis, F.; Chen, T.; Chretiennot, T.; Fournie, J.-J.; Poupot, M.; Dubuc, D.; Grenier, K. Microwaving biological cells: Intracellular analysis with microwave dielectric spectroscopy. Ieee Microw. Mag. 2015, 16, 87–96. [Google Scholar] [CrossRef]
  23. Daw, R.; Finkelstein, J. Lab on a chip. Nature 2006, 442, 367. [Google Scholar] [CrossRef] [Green Version]
  24. Abgrall, P.; Gue, A. Lab-on-chip technologies: Making a microfluidic network and coupling it into a complete microsystem-A review. J. Micromech. Microeng. 2007, 17, R15–R49. [Google Scholar] [CrossRef]
  25. Grenier, K.; Dubuc, D.; Poleni, P.-E.; Kumemura, M.; Toshiyoshi, H.; Fujii, T.; Fujita, H. Integrated broadband microwave and microfluidic sensor dedicated to bioengineering. IEEE Trans. Microw. Theory Tech. 2009, 57, 3246–3253. [Google Scholar] [CrossRef]
  26. Grenier, K.; Dubuc, D.; Chen, T.; Artis, F.; Chretiennot, T.; Poupot, M.; Fournie, J.J. Recent advances in microwave-based dielectric spectroscopy at the cellular level for cancer investigations. IEEE Trans. Microw. Theory Tech. 2013, 61, 2023–2030. [Google Scholar] [CrossRef] [Green Version]
  27. Meyne née Haase, N.; Fuge, G.; Trieu, H.K.; Zeng, A.-P.; Jacob, A.F. Miniaturized transmission-line sensor for broadband dielectric characterization of biological liquids and cell suspensions. IEEE Trans. Microw. Theory Tech. 2015, 63, 3026–3033. [Google Scholar] [CrossRef]
  28. Bao, X.; Ocket, I.; Bao, J.; Doijen, J.; Zheng, J.; Kil, D.; Liu, Z.; Puers, B.; Schreurs, D.M.M.-P.; Nauwelaers, B. Broadband dielectric spectroscopy of cell cultures. IEEE Trans. Microw. Theory Tech. 2018, 66, 5750–5759. [Google Scholar] [CrossRef]
  29. Bao, X.; Liu, S.; Ocket, I.; Liu, Z.; Schreurs, D.M.M.-P.; Nauwelaers, B. A modeling procedure of the broadband dielectric spectroscopy for ionic liquids. IEEE Trans. Nanobiosci. 2018, 17, 387–393. [Google Scholar] [CrossRef]
  30. Bao, X.; Ocket, I.; Bao, J.; Liu, Z.; Puers, B.; Schreurs, D.M.M.-P.; Nauwelaers, B. Modeling of coplanar interdigital capacitor for microwave microfluidic application. IEEE Trans. Microw. Theory Tech. 2019, 67, 2674–2683. [Google Scholar] [CrossRef]
  31. Kilpijärvi, J.; Halonen, N.; Juuti, J.; Hannu, J. Microfluidic microwave sensor for detecting saline in biological range. Sensors 2019, 19, 819. [Google Scholar] [CrossRef] [PubMed] [Green Version]
  32. Mehrotra, P.; Chatterjee, B.; Sen, S. EM-Wave Biosensors: A review of RF, microwave, mm-wave and optical sensing. Sensors 2019, 19, 1013. [Google Scholar] [CrossRef] [PubMed] [Green Version]
  33. Starzyk, F. Parametrisation of interdigit comb capacitor for dielectric impedance spectroscopy. Arch. Mater. Sci. Eng. 2008, 34, 31–34. [Google Scholar]
  34. Chen, T.; Dubuc, D.; Poupot, P.; Fournié, J.-J.; Grenier, K. Accurate nanoliter liquid characterization up to 40 GHz for biomedical applications: Toward non-invasive living cells monitoring. IEEE Trans. Microw. Theory Tech. 2012, 60, 4171–4177. [Google Scholar] [CrossRef]
  35. Su, W.; Cook, B.S.; Tentzeris, M.M. Additively manufactured microfluidics-based ‘peel-and-replace’ RF sensors for wearable applications. IEEE Trans. Microw. Theory Tech. 2016, 64, 1928–1936. [Google Scholar] [CrossRef]
  36. Ruvio, G.; Vaselli, M.; Lopresto, V.; Pinto, R.; Farina, L.; Cavagnaro, M. Comparison of different methods for dielectric properties measurements in liquid sample media. Int. J. RF Microw. Comput.-Aided Eng. 2018, 28, e21215. [Google Scholar] [CrossRef]
  37. Bao, X.; Ocket, I.; Crupi, G.; Schreurs, D.M.M.-P.; Bao, J.; Kil, D.; Puers, B.; Nauwelaers, B. A planar one-port microwave microfluidic sensor for microliter liquids characterization. IEEE J. Electromagn. RF Microw. Med. Biol. 2018, 2, 10–17. [Google Scholar] [CrossRef]
  38. Vélez, P.; Muñoz-Enano, J.; Gil, M.; Mata-Contreras, J.; Martín, F. Differential microfluidic sensors based on dumbbell-shaped defect ground structures in microstrip technology: Analysis, optimization, and applications. Sensors 2019, 19, 3189. [Google Scholar] [CrossRef] [Green Version]
  39. Crupi, G.; Bao, X.; Barmuta, P.; Ocket, I.; Schreurs, D.M.M.-P.; Nauwelaers, B. Microfluidic biosensor for bioengineering: High-frequency equivalent-circuit modeling of interdigital capacitor. In Proceedings of the IEEE International Conference on Telecommunications in Modern Satellite, Cable and Broadcasting Service (TELSIKS), Nis, Serbia, 23–35 October 2019; pp. 315–318. [Google Scholar]
  40. Stojanović, G.; Paroški, M.; Samardžić, N.; Radovanović, M.; Krstić, D. Microfluidics-based four fundamental electronic circuit elements resistor, inductor, capacitor and memristor. Electronics 2019, 8, 960. [Google Scholar] [CrossRef] [Green Version]
  41. Booth, J.C.; Orloff, N.D.; Mateu, J.; Janezic, M.; Rinehart, M.; Beall, J.A. Quantitative permittivity measurements of nanoliter liquid volumes in microfluidic channels to 40 GHz. IEEE Trans. Instrum. Meas. 2010, 59, 3279–3288. [Google Scholar] [CrossRef]
  42. Alley, G. Interdigital capacitors and their application to lumped-element microwave-integrated circuits. IEEE Trans. Microw. Theory Tech. 1970, 18, 1028–1033. [Google Scholar] [CrossRef]
  43. Van Gerwen, P.; Laureyn, W.; Laureys, W.; Huyberechts, G.; De Beeck, M.O.; Baert, K.; Suls, J.; Sansen, W.; Jacobs, P.; Hermans, L.; et al. Nanoscaled interdigitated electrode arrays for biochemical sensors. Sens. Actuators B Chem. 1998, 49, 73–80. [Google Scholar] [CrossRef]
  44. Laureyn, W.; Van Gerwen, P.; Suls, J.; Jacobs, P.; Maes, G. Characterization of nanoscaled interdigitated palladium electrodes of various dimensions in KCl solutions. Electroanalysis 2001, 13, 204–211. [Google Scholar] [CrossRef]
  45. Zhang, L.Y.; Landoulsi, A.; Bounaix, C.; du Punch, M.; Lacroix, A.; Dalmay, C.; Bessaudou, A.; Lautret, C.; Battu, S.; Lalloue, F.; et al. Label-free colorectal cancer cell line bio-sensing using RF resonator. In Proceedings of the IEEE International Conference on Solid-State Sensors, Actuators and Microsystems, Barcelona, Spain, 16–20 June 2013; pp. 1194–1197. [Google Scholar]
  46. Bao, X.; Ocket, I.; Bao, J.; Kil, D.; Brancato, L.; Nauwelaers, B. Broadband dielectric spectroscopy measurements of liquids combining interdigital capacitor and coplanar waveguide. In Proceedings of the European Microwave Conference (EuMC), Nuremberg, Germany, 10–12 October 2017; pp. 946–949. [Google Scholar]
  47. Booth, J.C.; Mateu, J.; Janezic, M.; Baker-Jarvis, J.; Beall, J.A. Broadband permittivity measurements of liquid and biological samples using microfluidic channels. In Proceedings of the IEEE MTT-S International Microwave Symposium Digest, San Francisco, CA, USA, 11–16 June 2006; pp. 1750–1753. [Google Scholar]
  48. Ou, J.; Glawdel, T.; Ren, C.L.; Pawliszyn, J. Fabrication of a hybrid PDMS/SU-8/quartz microfluidic chip for enhancing UV absorption whole-channel imaging detection sensitivity and application for isoelectric focusing of proteins. Lab Chip 2009, 9, 1926–1932. [Google Scholar] [CrossRef]
  49. Nihad, D.; Jehad, A.; Amjad, O. CAD modeling of coplanar waveguide interdigital capacitor. Int. J. RF Microw. Comput.-Aided Eng. 2005, 15, 551–558. [Google Scholar]
  50. Rohdin, H.; Lee, G.S. Interfacial gate resistance in schottky-barrier-gate field-effect transistors. IEEE Trans. Electron Dev. 1998, 45, 2407–2416. [Google Scholar] [CrossRef] [Green Version]
  51. Crupi, G.; Raffo, A.; Vadalà, V.; Avolio, G.; Schreurs, D.M.M.-P.; Vannini, G.; Caddemi, A. Technology-independent analysis of the double current-gain peak in millimeter-wave FETs. IEEE Microw. Wirel. Comp. Lett. 2018, 28, 326–328. [Google Scholar] [CrossRef]
  52. Crupi, G.; Raffo, A.; Vadalà, V.; Vannini, G.; Caddemi, A. A new study on the temperature and bias dependence of the kink effects in S22 and h21 for the GaN HEMT technology. Electronics 2018, 7, 353. [Google Scholar] [CrossRef] [Green Version]
Figure 1. Top-view of the studied microfluidic biosensor based on one-port interdigital capacitor with 15 fingers in the sensing area.
Electronics 09 00340 g001
Figure 2. Equivalent circuit for the studied microfluidic IDC sensor.
Electronics 09 00340 g002
Figure 3. FEM simulations of the (a) real and (b) imaginary parts of the admittance from 0.3 MHz to 35 GHz for the IDC sensor loaded with lossless MUTs having a real part of the relative permittivity varied from 15 to 70 with a step of 5.
Electronics 09 00340 g003
Figure 4. Behavior of the (a) resonant frequency and corresponding (b) peak in Re(Y) versus εr for the lossless MUTs placed on top of the sensing area of the IDC sensor.
Electronics 09 00340 g004aElectronics 09 00340 g004b
Figure 5. Behavior of the (a) absolute and (b) relative sensitivity of fr to variations in εr for the lossless MUTs placed on top of the sensing area of the IDC sensor. When εr is 20, Sfr and RSfr reach their maximum magnitude of 0.638 GHz/Δ1 and 1.98%, respectively.
Electronics 09 00340 g005
Figure 6. Behavior of C1 versus εr with the approximating straight line for the lossless MUTs placed on top of the sensing area of the IDC sensor.
Electronics 09 00340 g006
Figure 7. Behavior of the (a) absolute and (b) relative sensitivity of C1 to variations in εr for the lossless MUTs placed on top of the sensing area of the IDC sensor. The average values of SC1 and RSC1 are 13.35 fF/Δ1 and 4.58%, respectively.
Electronics 09 00340 g007
Figure 8. FEM (blue lines) and equivalent-circuit (red lines) simulations of the (a,c,e) real and (b,d,f) imaginary parts of the admittance from 0.3 MHz to 35 GHz for the IDC sensor loaded with lossless MUTs having a real part of the relative permittivity of (a,b) 15; (c,d) 40; and (e,f) 70.
Electronics 09 00340 g008aElectronics 09 00340 g008b
Figure 9. FEM simulations of the (a) real and (b) imaginary parts of the impedance from 0.3 MHz to 35 GHz for the IDC sensor loaded with lossless MUTs having a real part of the relative permittivity varied from 15 to 70 with a step of 5.
Electronics 09 00340 g009
Figure 10. A modified version of the equivalent circuit for the studied microfluidic IDC sensor.
Electronics 09 00340 g010
Figure 11. FEM (blue lines) and equivalent-circuit (red lines) simulations of the real and imaginary parts of the (a,b) impedance and (c,d) admittance from 0.3 MHz to 35 GHz for the IDC sensor loaded with lossless MUT having a real part of the relative permittivity of 70.
Electronics 09 00340 g011
Figure 12. Difference between FEM and equivalent-circuit simulations of the real (blue lines) and imaginary parts (red lines) of the admittance from 0.3 MHz to 35 GHz for the IDC sensor loaded with a lossless MUT having a real part of the relative permittivity of 70: (a) equivalent-circuit simulations based on the local model and (b) equivalent-circuit simulations based on the modified broadband model.
Electronics 09 00340 g012
Table 1. Comparison of various studies reporting on the investigation of fluidic IDC biosensors.
ReferenceChannel-Electrode-Substrate MaterialsNumber of PortsVolumeAnalysis MethodFrequency RangeMUT
[34]PDMS-
Ti/Au-
Quartz
20.9 nLFEM, EC parameters, and measurements40 MHz–40 GHzAlcohol-based aqueous solutions and fetal bovine serum in water
[47]PDMS-
Au-
Quartz
2<1 μLFEM, EC parameters, and measurements100 Hz–40 GHzDe-ionized water and methanol
[12]PDMS-
Au-
Quartz
11.2 nLFEM and measurements7.8 GHz–8.4 GHz
& @25 GHz
Water-isopropanol mixture
[46]SU-8-
Au-
Quartz
20.1 μLFEM, EC parameters, and measurements10 MHz–50 GHzDe-ionized water and saline solutions
[28]SU-8-
Au-
Quartz
10.09 μLFEM, EC parameters, and measurements300 kHz–50GHzYeast cell culture and mammalian cell culture
[Here]SU-8-
Au-
Quartz
10.054 μLFEM and EC parameters0.3 MHz–35 GHzLossless MUTs with different εr
Table 2. Values of fr, Re(Y) @ fr, C1, and R1 as a function of εr.
εrfr (GHz)Re(Y) @ fr (S)C1 (fF)R1 (Ω)
1532.200.368291.52.72
2029.010.442359.12.26
2526.710.505423.61.98
3024.740.551493.81.81
3523.170.595563.01.68
4022.090.623619.41.61
4520.930.648689.91.54
5020.040.668752.61.50
5519.140.684825.01.46
6018.420.700890.81.43
6517.720.717962.51.39
7017.130.7251030.01.38

