CRM PFC Converter with New Valley Detection Method for Improving Power System Quality


1
Department of Electrical and Computer Engineering, Sungkyunkwan University, Suwon 16419, Korea
2
Department of Electrical Engineering, Daejin University, Pocheon 11159, Korea
*
Author to whom correspondence should be addressed.
Electronics 2020, 9(1), 38; https://doi.org/10.3390/electronics9010038
Submission received: 11 November 2019
/
Revised: 23 December 2019
/
Accepted: 24 December 2019
/
Published: 27 December 2019
(This article belongs to the Special Issue Emerging Technologies in Power Systems)
Abstract
:High efficiency and the power factor of power converters, are very important factors which can improve power system quality. In particular, research on improving low efficiency and the power factor at light-load conditions is essential. A boost power factor correction (PFC) is most commonly used in home appliances, with several operations being at light-loads; the critical conduction mode (CRM) control, fixed ON-time control, and valley detection technique are mainly applied to PFC control. However, these control schemes have the following problems: (1) low efficiency, due to sudden increase in switching frequency at light-loads; and (2) low power factor, due to switching ON-time limitation. This paper presents a new valley detection method that can actively extend the fixed ON-time to overcome these problems. Furthermore, a new valley point detection circuit and an ON-time extension signal generation circuit are proposed and described in detail. The superiority of the proposed method is demonstrated via comparison with two existing CRM PFC control methods, namely fixed ON-time (conventional#1) and existing valley detection (conventional#2) methods. Experimental results at 20% load demonstrate that the proposed method shows an efficiency improvement of 2.1%, compared with the fixed ON-time strategy; and a power factor improvement of 34.9%, compared with the existing valley detection strategy.
1. Introduction
Nowadays, conventional TVs are being replaced with smart TVs, and the usage of TVs has expanded from merely viewing purposes, to becoming media equipment. Smart TVs have built-in smart home hubs, that can monitor and control other Internet-of-things devices with existing TV functions. In other words, smart TVs have become a multiscreen to be connected to and operated with various devices, e.g., PCs, mobile phones, USBs, HDDs, Internet, etc., and watching is not necessitated. This means that a smart TV consumes more power than standby power, even if it is not operated as a conventional TV. In addition, owing to the rapid expansion of smart TVs, the efficiency and power factor at light-load can deteriorate the power system quality. Therefore, it is important to enhance the efficiency and power factor not only in heavy-load conditions, but also in light-load conditions for improving the power system quality.
In general, a 55-inch smart TV adopts a switch-mode power supply (SMPS) of approximately 200 W in consideration of power consumption, and the critical mode (CRM) boost power factor correction (PFC) topology is primarily adopted [1,2,3]. The CRM boost PFC can be implemented simply. However, the power conversion efficiency in relatively light-load conditions degrade, because the switching frequency increases in inverse proportion to the peak current level, which is decided by input voltage and load current [4,5,6].
To reduce switching loss in light-load and low-input-voltage conditions, the switching frequency is typically limited. The fixed ON-time method and switching frequency limit (SFL) method were suggested [7,8,9] to reduce switching loss under light-loads and low-input-voltages. The light-load efficiency can be improved to a certain level by limiting switching frequency. However, the power factor decreases due to the large current distortion that occurs when switching frequency is limited in light-load and low-input-voltage conditions. Additionally, a valley switching strategy has been proposed to improve the efficiency and power factor [10,11,12,13,14,15,16]. The existing valley switching strategy can reduce the switching loss by switching at the valley point generated during inductance and capacitance (LC) resonance, in contrast to the CRM method of switching when the diode current becomes zero. This is mainly implemented by setting the zero current detection time (Tzcd) for the SFL. However, though maximizing the efficiency, this method inevitably causes an error in the accurate calculation of the switching point, i.e., the valley point, owing to the change in the LC resonance frequency. In addition, it is difficult to obtain a high power factor using this method because the switching frequency is limited in light-load and low-input-voltage conditions, such as SFL. Previous works [17,18,19] have analyzed interleaving CRM boost PFC and CRM Totem-Pole PFC. The interleaving method has an advantage, as it allows the efficiency to be improved to some degree in the full-load range. However, switching losses increase because the switching frequency increases rapidly in the light-load condition. Therefore, problems such as metal oxide semiconductor field effect transistors (MOSFETs) being damaged relatively frequently, have been reported. Furthermore, the cost increases, because more switches, gate drivers, and controllers are required due to the parallel structure. For this reason, the industry considers interleaving CRM PFC above 300 W, but it is common to use a single CRM PFC that can be implemented with low cost under 300 W.
Therefore, a new valley detection method including ON-time extension is presented herein to overcome the problems of the existing valley switching technique. The proposed new valley detection method detects the polarity crossing moment of the inductor current without an additional circuit. In addition, it senses the moment that the differentiation of the divided voltage “VVAL” changes from negative to positive, to enable an error-free valley point detection. Furthermore, based on the collected information, the reference signal for the ON-time extension is then generated in the current signal generator. Consequently, the proposed method can reduce the switching loss by suppressing the increase in the switching frequency, and can improve the reduced power factor due to the fixed ON-time, using the extended ON-time strategy at light-load conditions. In addition, the problem of MOSFETs getting damaged in light-load conditions can be addressed by turning the gate on at zero current voltage using a timer, in this method. The actual circuit with the proposed strategy was implemented and tested on a 240 W SMPS for a 55-inch smart TV. In order to prove the superiority of the new valley detection method using the proposed ON-time extension technique, the two existing methods, i.e., fixed ON-time method, denoted “conventional#1” [20]; and existing valley detection method, denoted “conventional#2” [21], were selected as the comparison group. The experimental results were then derived, based on the comparison. Experimental results demonstrated an efficiency improvement of 2.1%, compared with the conventional CRM PFC; and a power factor improvement of 34.9%, compared with the switching frequency limiting strategy under a 20% load condition.
The remainder of the paper is organized as follows: Section 2 describes the existing CRM boost PFC and conventional valley detection methods in detail; Section 3 describes the new valley detection strategy proposed in detail; Section 4 introduces the implementation and design considerations of the proposed circuit; and Section 5 demonstrates the feasibility of the proposed strategy through simulation and experimental results.
2. Description for Conventional CRM boost PFC
The conventional PFC converter, as shown in Figure 1, is widely employed in the power supplies of TV systems, which converts an AC voltage to a DC voltage. The CRM is a method to control a PFC converter without sensing the input voltage (Vin), where the switch ON-time (Ton) is a constant value to retain the output voltage (Vout) at a target value, and the average value of the inductor current (IL) in a switching cycle, i.e., the input current of the PFC converter is proportional to Vin, as shown in Figure 2 [20,21,22,23,24]. It was observed that the CRM boost PFC shows a reduced power conversion efficiency, because the switching frequency was increased significantly at the low-input-voltage or light-load condition.
2.1. Switching Frequency Limit Method
To reduce switching loss in light-load and low-input-voltage conditions, i.e., short Ton, it is typical to limit the switching frequency, as shown in Figure 3. The timing to turn the switch ON is delayed until a predetermined time passes from the previous point when the switch is turned ON, even though IL returns to zero [5,25]. In this method, switching is reduced, but the average IL in a period also changes with the switching frequency. Therefore, it is difficult to reduce the limit of the switching frequency without degrading the power factor. Furthermore, switching with a low peak of IL is reduced, but still occurs when Vin is low. Such switching only consumes energy without contributing any energy transfer from the input to the output, as the energy stored in the inductor is insufficient to change the parasitic capacitance of the drain of the switch or to conduct the diode.
2.2. Existing Valley Switching Method
Additionally, the existing valley switching scheme, as shown in Figure 4, is widely known for reducing switching loss. After IL returns to zero, the drain–source voltage of the switch (Vds) starts to decrease due to the resonance between the inductance of the inductor (L) and the drain–source parasitic capacitance of the switch (Coss). Therefore, turning the switch ON at a valley of Vds is better than when IL returns to zero after a current through the diode stops, for efficiency.
To achieve this, a timer to measure a time equal to half the resonant frequency from when point IL reaches zero is widely used. The timer must be set depending on the resonant frequency from one converter to another; therefore, a pin for the setting is often assigned when such controllers are fabricated in ICs. However, the resonant frequency changes even in a converter, depending on the input voltage of the converter, because Coss contains the parasitic capacitance of a P–N junction in the MOSFET switch, which depends on the voltage applied to it. Furthermore, if we realize valley switching using the timer, even when a frequency limit function delays the timing for the switch to turn ON again, as shown in Figure 3, the timing of the valley must be estimated from the moment IL returns to zero after the current through the diode stops. The error of the timer against the resonant frequency accumulates. Therefore, this method is not practical when the number of valleys to be skipped before the switch turns ON is large.
3. Proposed Valley Detection Strategies with ON-Time Extension
In detail, this section describes the proposed valley detection strategies that can overcome the problems that arose with the CRM boost PFC converter that applied the existing valley detection method, as mentioned in Section 2. Figure 5 shows the inductor current applied to the proposed valley detection method. The detailed inductor current waveform at a light-load is compared with the conventional method, and is shown in Figure 6.
3.1. Realization of Proposed Method
To prevent switching without transferring energy from the input to the output, the ON-time of the switch is extended if the inductor current does not exceed a predetermined level. Simultaneously, the OFF-time should be extended when the average current in the cycle is the same as that when the ON-time is not extended; that is, when the switching period (Tsw) satisfies Equation (1).
where IL is the inductor current, Tsw is the switching period, Tono is the ON-time before it is extended, Vin is the input voltage, and L is the inductance.
A circuit to realize this control is shown in Figure 7. A ramp generator generates a ramp signal voltage (Vramp), which begins to increase at the moment the switch turns ON. An error amplifier amplifies the difference between the voltage feedback signal from the PFC converter (VFB) and a predetermined reference voltage (Vref), and generates an output voltage (Vea). Vramp is compared with Vea, and the current sense signal from the PFC converter (VCS) is compared with a voltage corresponding to the predetermined minimum level of the inductor current (Vcsmin). An OFF trigger signal to turn the switch OFF is generated if VCS is larger than Vcsmin when Vramp reaches Vea, similar to conventional CRM boost PFC converters.
In another case, the OFF trigger signal is generated when VCS reaches Vcsmin, that is, when the ON-time is extended. After the switch turns OFF, the point where the inductor current returns to zero (Tzcd) is detected, by comparing VCS with a voltage corresponding to the state (Tzcd), which is typically slightly lower than zero. An ON trigger signal to turn the switch ON is generated by a current signal generator, capacitor, reset switch, and comparator. To realize extended ON-time, the reference current signal (Iint), which is the output of the current signal generator as shown in Figure 7, should be defined first; this signal should be defined by each section, according to the levels of Vramp and Vea, as shown in Figure 8. Iint for each mode in Figure 8 is described as follows:
where Iint is the output current generated by the current signal generator, K is constant value which can be selected for easy circuit implementation, Vramp is ramp signal voltage, Vea is the generated output voltage, Tzcd is the time when the inductor current returns to zero, and Tsw is switching period. Here, for brevity, it is assumed that the ramp signal starts at 0 V.
3.2. Description of ON-Time Extension
At the moment when the switch turns ON, the reset switch discharges the capacitor. Subsequently, the capacitor generates a voltage corresponding to the integration of Iint. When the ON-time is extended, the voltage stored in the capacitor is larger than zero at the moment when the switch turns OFF, and is reduced by Iint () subsequently. Finally, it reaches zero, and the comparator generates the ON trigger signal.
Figure 8 illustrates the waveforms when the ON-time is extended. During the ON-time, IL and Vramp continue increasing. Simultaneously, the capacitor integrates Iint, which is proportional to twice that of the difference between Vramp and Vea. The switch is turned off when IL reaches a predetermined level (ILmin). Subsequently, IL decreases and returns to zero. During that time, the value of Vramp remains the previous value at the moment the switch turns OFF, and Iint is proportional to the difference between Vramp and Vea. After IL reaches zero (in fact, IL remains in resonance with a small amplitude, owing to the parasitic capacitance in this region; however, it is omitted for a simple illustration), the capacitor is discharged by Iint, which is a constant value depending on Vea. When the voltage stored in the capacitor reaches zero, the switch is turned ON again, and the same operation in the previous period repeats. Here, it can be confirmed that the length of a period (Tsw) decided by integrating Iint satisfies Equation (1), which describes a desirable operation. Additionally, the voltage between the switches remain in resonance in the time period when IL remains in resonance; and Tsw can be adjusted within a range of cycles of resonant frequency, by combining techniques typically employed in conventional PFC converters. For minimizing loss, it is better to delay the timing to turn ON the switch from Tsw, as calculated by Equation (1), to the next valley of Vd, where the loss from turning the switch ON is the smallest.
4. Circuit Implementations and Design Considerations
In this section, two methods of detecting the valley of Vd in detail are examined, and the actual implementation circuitry for each method is described.
4.1. Proposed Valley Detect Method with Current Sense Voltage
One of the methods, involves the detection of the moment VCS crosses zero, from positive to negative. In this case, no additional external component is necessary, but the VCS in the resonant region of Vd is typically small, and noise should be considered. Figure 9a shows a circuit to detect the zero-cross of VCS, where an offset cancel topology is employed to avoid the effect transistor mismatch in detecting small voltages. When valley detection is not required, the switches controlled by DETb turn ON, and the voltage corresponding to the condition VCS = 0 is stored to the capacitor Chold. In detecting the valley, the switch controlled by DET turns ON, and the voltage depending on VCS is compared with the voltage stored in Chold. We can adjust the gain from VCS to the voltage for the comparison, with resistors Rcsin and Rcsa. By verifying the moment that the comparator output changes from high to low during the detection, we can detect the moment that VCS crosses zero, from positive to negative.
4.2. Proposed Valley Detect Method with Divided Drain Voltage
The other method is to divide Vd using two capacitors, i.e., C1 and C2, as shown in Figure 10, and to sense the moment that the differentiation of the divided voltage VVAL changes from negative to positive. One of the two capacitors (C2) is often used in practical applications to reduce EMI noise, and only one low-voltage capacitor (C1) is necessary in this case. The value of the capacitors for the divided voltage should not exceed the input range of the circuit receiving it. Figure 9b shows a valley detection circuit with the divided voltage of Vd. Part of the circuit is the same as that shown in Figure 9a, and a differentiator is additionally included. Owing to the capacitor Cdiv connected between the input and the node with near constant voltage maintained by the source-follower transistors, the current proportional to dVVAL/dt is generated, and converted to the voltage fed to the comparator. When valley detection is not required, the switches controlled by DETb turn ON; the voltage corresponding to when the current proportional to dVVAL/dt is equal to zero is stored in capacitor Chold. In detecting the valley, the switch controlled by DET turns ON, and the current–voltage proportional to dVVAL/dt is compared with the voltage stored in Chold. By verifying the moment when the comparator output changes from low to high during the detection, we can detect the moment when the differentiation of VAL changes from negative to positive.
5. Simulation and Experimental Results
5.1. Simualtion Results
The two valley detection methods described in Section 3 and Section 4 were verified by computer simulations with the circuit shown in Figure 11. Moreover, the parameters used in the simulations are detailed in the schematic. Acquiring accurate data is very important for accurate valley detection and ON-time calculation [26]. Therefore, properly designed low-pass filters were used in the sensing stage, such as ‘VCS’ and ‘VVAL’.
Figure 12 and Figure 13 show the operating waveforms in different Vin conditions, i.e., 300 and 100 V, in a light-load condition. To verify the effect of delay for the current detection, the low-pass filters for Vcs is changed in the ranges of 50 Ω—47 pF and 39 Ω—5 nF. The simulation results in Figure 12 and Figure 13 correspond to the valley detection circuits with Vcs and VVAL, respectively.
When the low-pass filter is 50 Ω—47 pF, the delay caused by it is negligible, the peak value of IL is almost the same even if Vin decreases from 300 V to 100 V, and only switching frequency decreases; from which we can confirm that the proposed control method in light-load conditions operates properly. Moreover, we can confirm that the switch always turns ON near the valley of Vd in both valley detection circuits.
When the low-pass filter is 39 Ω—5 nF, the dependency of the peak value of IL on Vin increases, because slope of IL depends on Vin, and a larger slope results in a larger extension owing to the delay of the low-pass filter. When the peak value of IL increases, owing to delay of the low-pass filter, the switching frequency decreases to cancel its effect.
The timing for when the switch turns ON deviates significantly from the valley of Vd, when a valley detection circuit with Vcs is employed; however, it does not change, owing to the delay of the low-pass filter, when a valley detection circuit with VVAL is employed.
5.2. Experimental Results
Figure 14a shows an actual IC picture of the proposed valley detection circuit using the TowerJazz 0.18 µm 5 V/42 V CMOS process (TS035), and Figure 14b shows the experimental setup using the fabricated IC. This IC is designed as an output power in a full-load condition of approximately 240 W; however, the experimental results are focused on light-load conditions within a 40 W load, which is approximately 20% of the rated output power, to verify the improvement in power factor and efficiency under light-load conditions.
Figure 15 shows a key waveform under an input voltage of 220 Vac and an output power of 40 W (400 V/0.1 A). Figure 15a shows the time-extended inductor current waveform shown in Figure 8, with the current sense voltage valley detection circuit shown in Figure 9a. As shown, the delay in switching ON is calculated by calculating tsw, satisfying Equation (1). Figure 15b shows the inductor current of the existing CRM boost PFC. The switching frequency in the zero-crossing region at a 40 W load is 130 kHz and shows a typical CRM boost PFC inductor current waveform, similar to that shown in Figure 2. Figure 15c shows the inductor current when the proposed valley switching technique is applied. The switching frequency is reduced to 76 kHz through the new valley detector method and the ON-time is extended, as shown in Figure 6 and Figure 8, even under the same load condition.
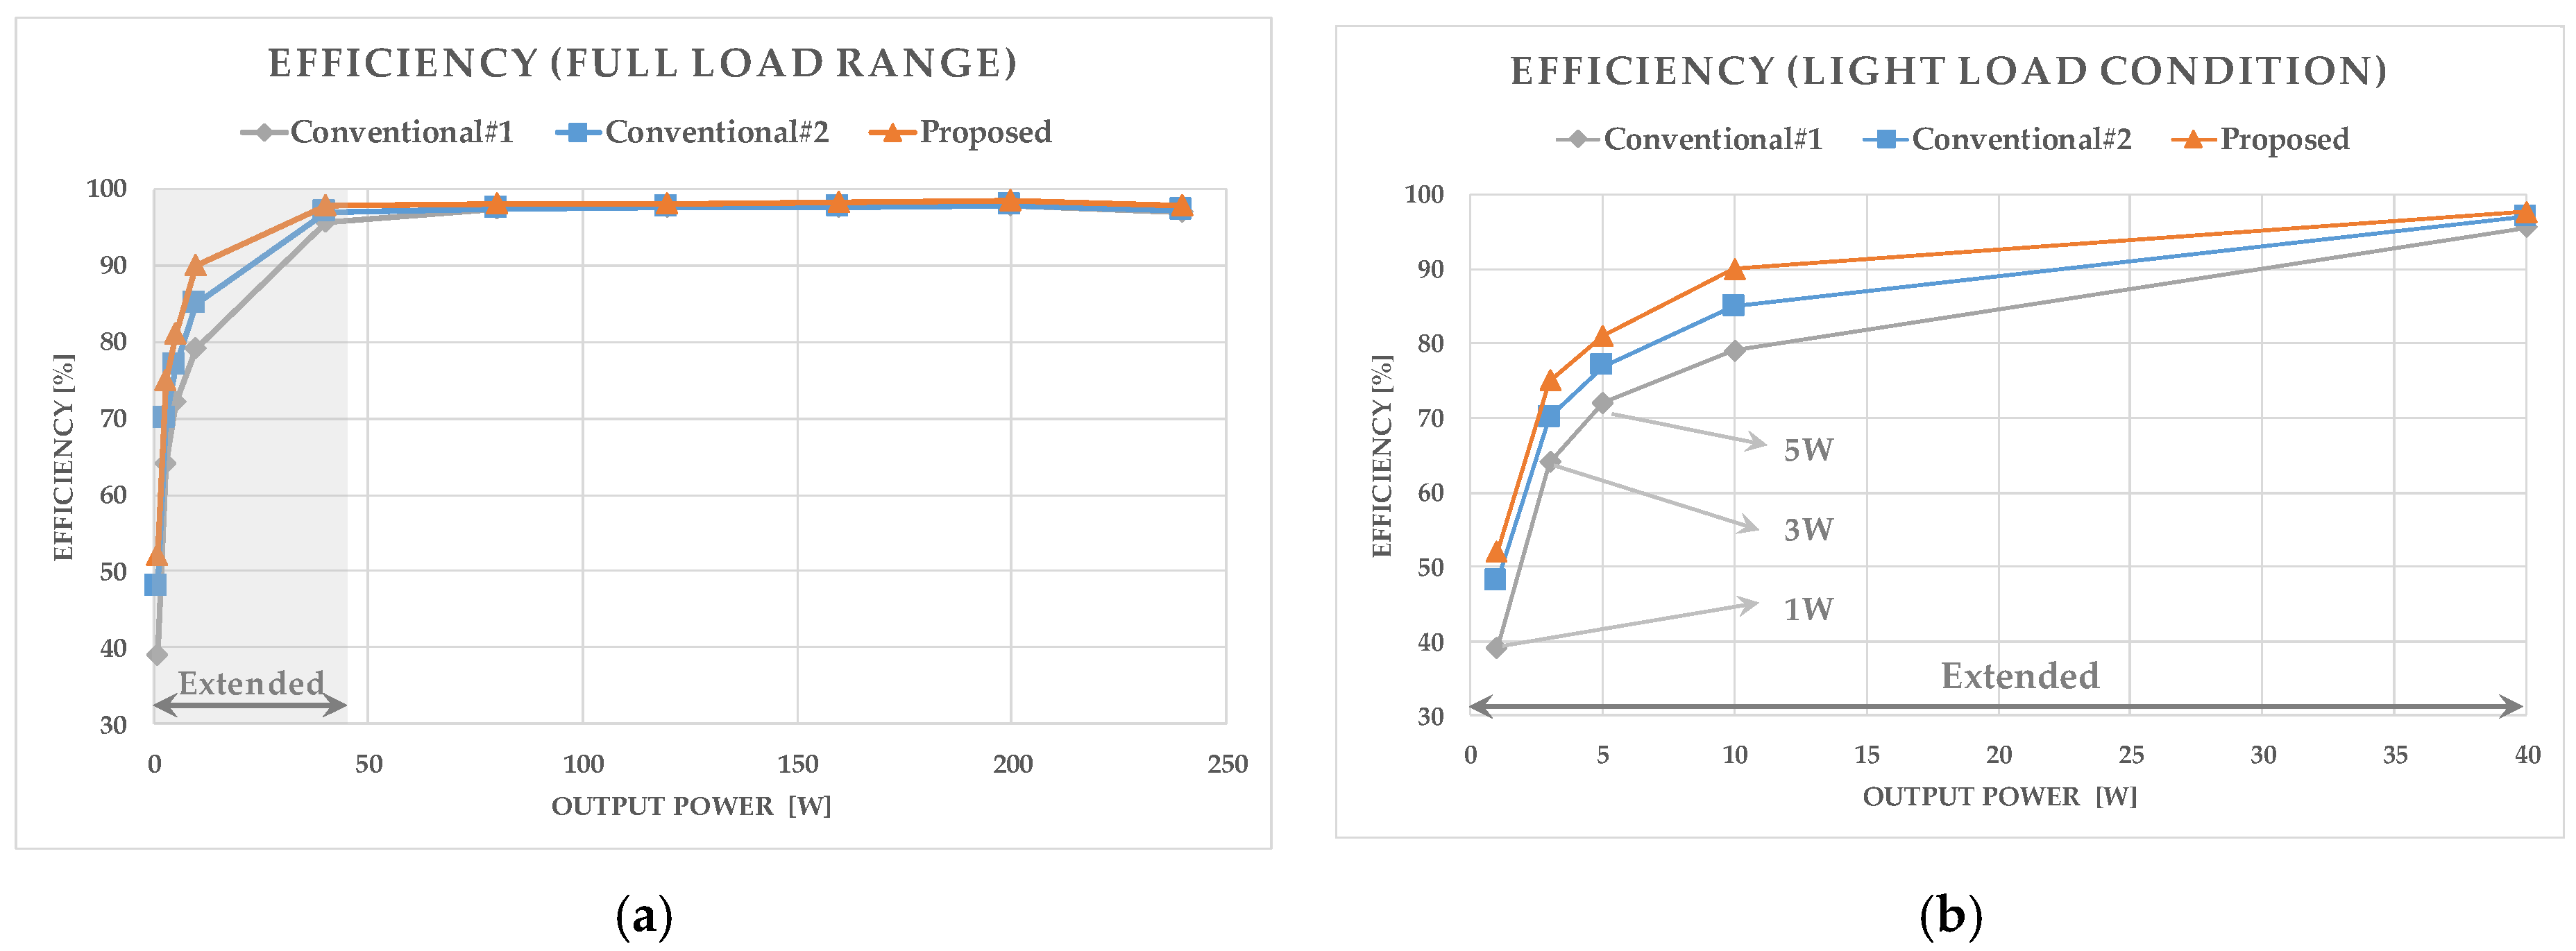
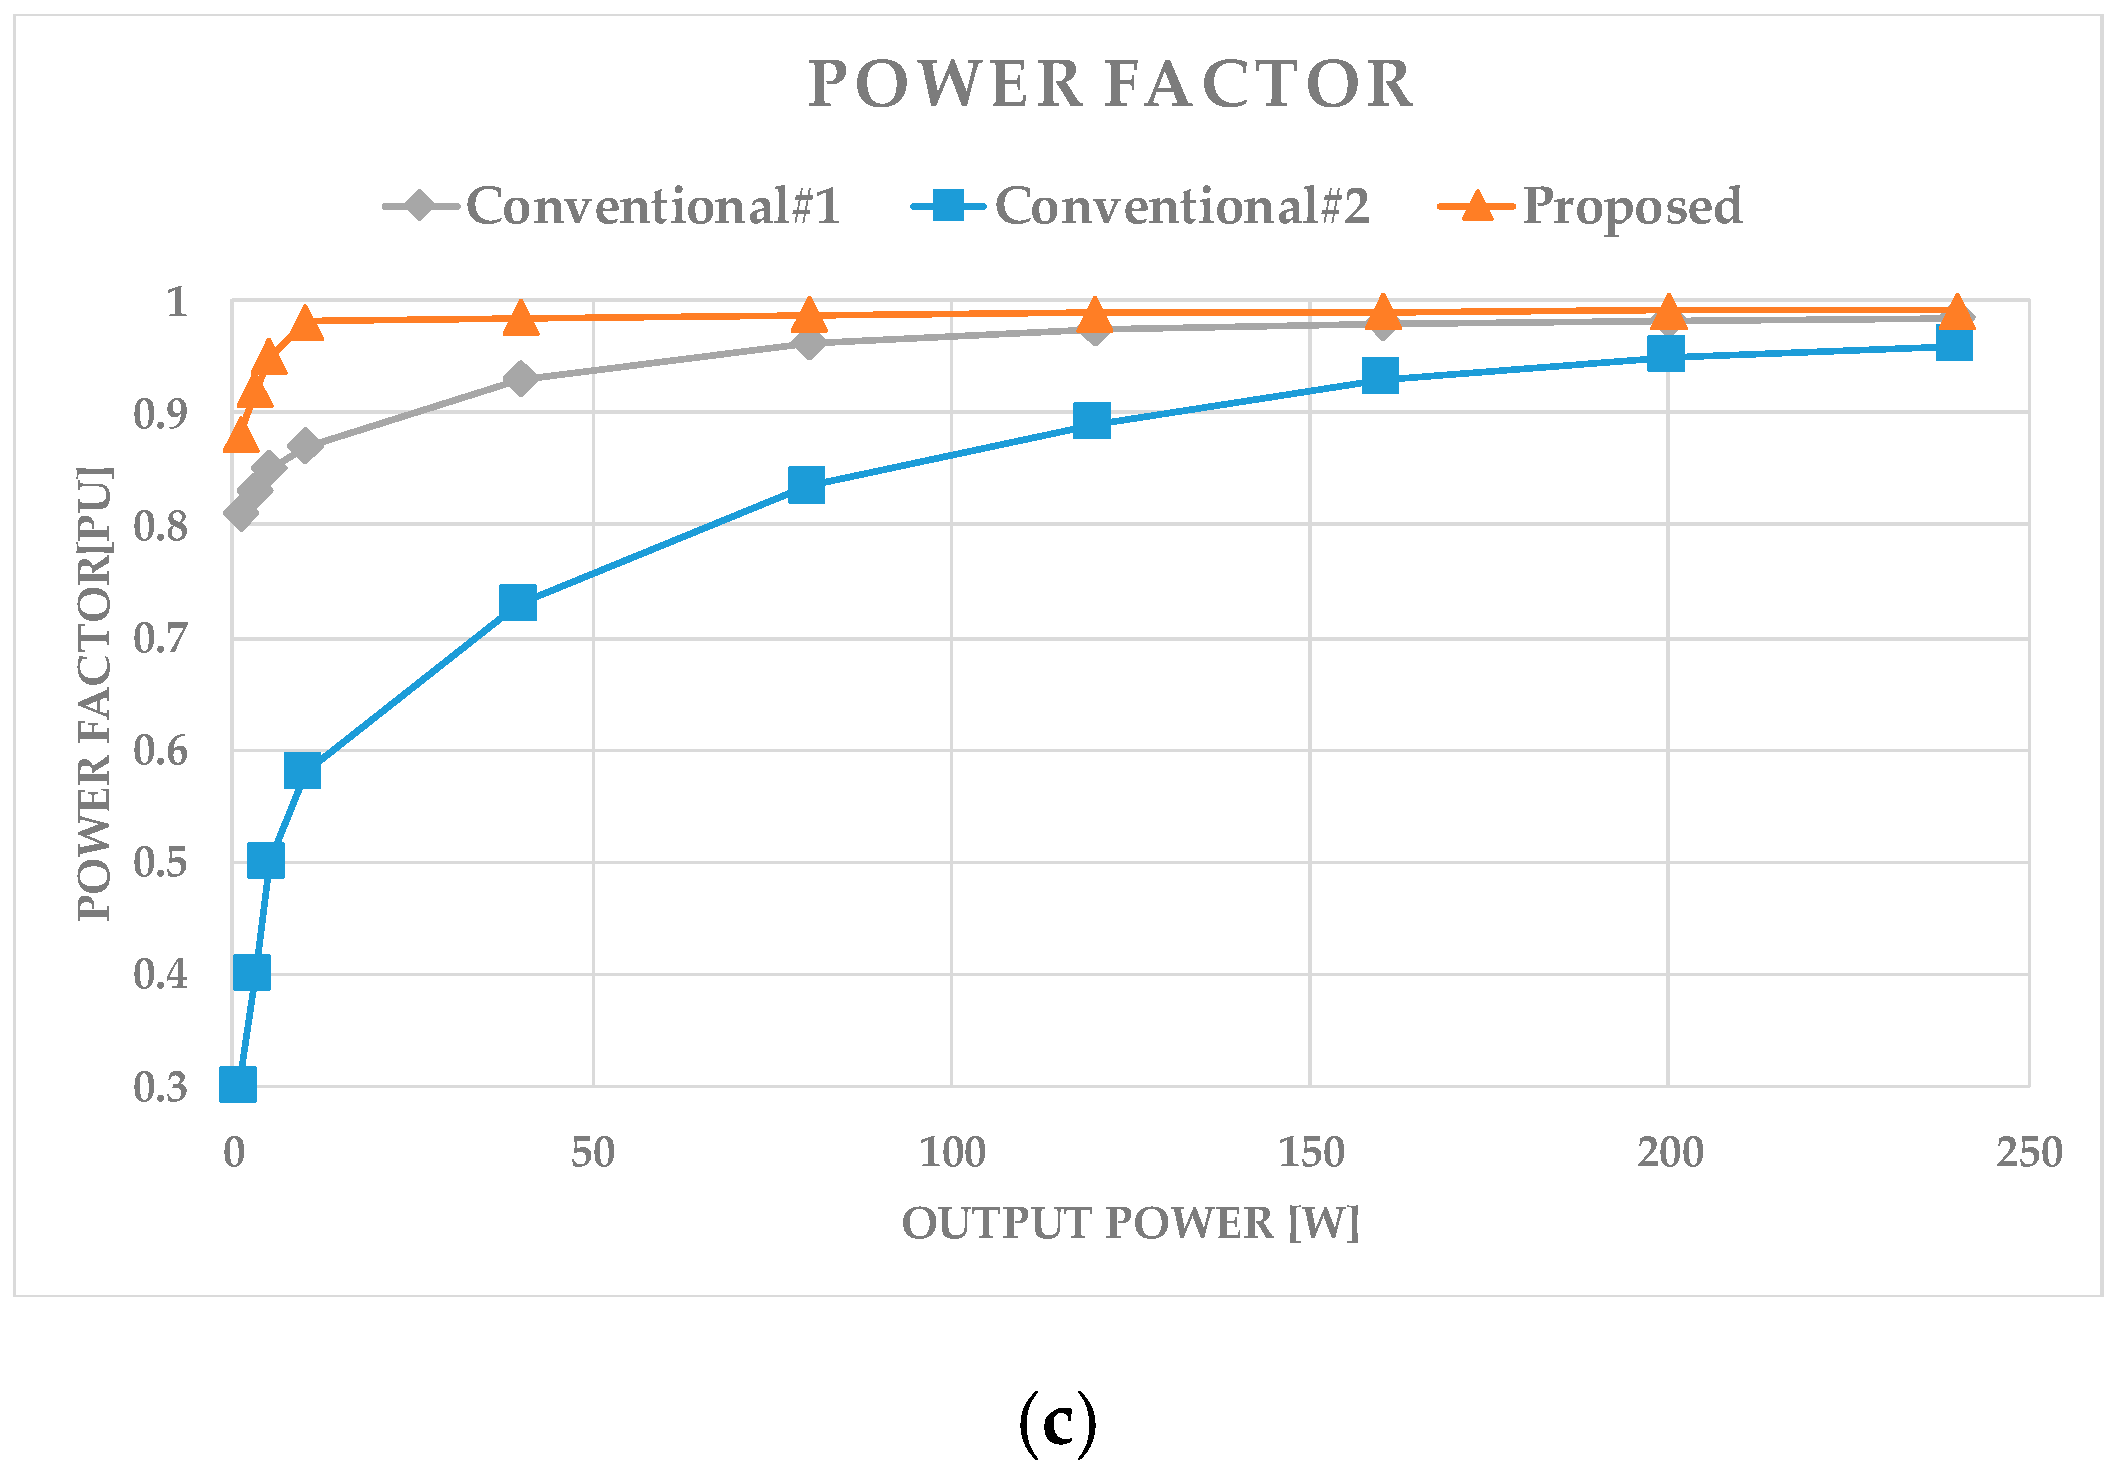
Figure 16a–c show the comparison results of the light-load efficiency and power factor, between the existing CRM boost PFC method and the new valley detection method. Two commercial ICs were selected as the comparison group, and their performance was compared with that of the proposed method, to confirm the superiority of the proposed method more accurately. For the first comparison group (conventional#1), the SPC7011F manufactured by Fuji, with a fixed ON-time, and SFL of 500 kHz was used [20]. The second comparison group (conventional#2) had an existing valley detection method that was limited to 150 kHz at light-loads, and the On Semi’s NPC1602 was used for this [21]. The comparison result between the proposed method and conventional#1 shows an efficiency difference of 2.1% in the 40 W load condition; moreover, it shows an efficiency difference of up to 13% in the 1 W condition. This is due to the switching loss, caused by the increase of switching frequency to 500 kHz in the light-load or low-input-voltage condition. Furthermore, the MOSFET is turned on at a high Vds voltage while resonating, which may reduce the efficiency. In terms of power factor, due to its fast switching in light-load and low-input-voltage conditions, the conventional#1 method achieves a higher power factor than the conventional#2 method. As a result, the power factor of the conventional#1 method was measured at 0.85 and 0.93 at 5 W and 40 W, respectively, while that of the proposed method was 0.95 and 0.985 under the same conditions, respectively. All the test conditions were controlled identically, and the comparison experiment was conducted after changing only the conventional#1 method to conventional#2 method. The efficiency of the conventional#2 method was 97% at 40 W and 48% at 1 W, which was 0.7% and 4% lower than that of the proposed method, respectively. However, this indicates that the conventional#2 method is relatively better than the conventional#1 method, in terms of efficiency. This result is because of the reduction in switching losses due to the limited switching frequency of 150 kHz, especially in light-load and low-input-voltage conditions. Compared with the proposed method, the efficiency drop in the conventional#2 method increases as the load decreases. The analysis indicates that the reason for this result is the switching ON time limit of the conventional#2 method at light-loads and low-input-voltages. Compared with the proposed method, the power factor of the conventional#2 method shows a significantly larger difference under an 80 W load; moreover, a power factor difference of 0.581 is observed at 1 W. These results can be attributed to the large current distortion caused by the switching limitation of the conventional#2 controller in light-load and low-input-voltage conditions.
6. Conclusions
Herein, a new valley detection method, that includes the ON-time extension strategy, to improve both efficiency and power factor in light-load conditions in CRM controlled boost PFC converters, was proposed. In this method, the ON-time of the switch was extended unless the current of the inductor reached a predetermined level, and the OFF time was extended such that the average current of the inductor in a cycle remained the same as that without extending the ON-time. The theory of the ON-time extension method, the circuit implementation, and the circuit of the actual implemented IC were presented and explained in detail. A circuit for achieving the control method was designed in a 0.35 um CMOS IC process, where a circuit detecting the lowest point of drain voltage of the switch, which turned the switch ON at that moment, was included. Experimental results demonstrated that the proposed method obtains a significant 13% improvement in efficiency, compared with that of a fixed ON-time method; and an excellent power factor improvement of 0.581, compared with an existing valley detection method under a 1 W load condition. As a result, this study can be applied to power converters using CRM boost PFC as well as home appliances such as smart TVs, which operate under several light-load conditions. This study is expected to contribute to the improvement of power quality by improving efficiency and power factor.
Author Contributions
Conceptualization, K.-S.C. and B.-K.L.; Methodology, K.-S.C. and J.-S.K.; Software, K.-S.C.; Validation, K.-S.C. and J.-S.K.; Formal Analysis, K.-S.C.; Investigation, K.-S.C.; Resources, B.-K.L.; Data Curation, K.-S.C.; Writing—Original Draft Preparation, K.-S.C. and J.-S.K.; Writing—Review & Editing, K.-S.C., B.-K.L. and J.-S.K.; Visualization, J.-S.K.; Supervision, B.-K.L.; Project Administration, B.-K.L. All authors have read and agreed to the published version of the manuscript.
Funding
This research received no external funding.
Conflicts of Interest
The authors declare no conflict of interest.
Abbreviations
| Coss | Drain–source parasitic capacitance of the switch |
| CRM | Critical mode |
| IL | Inductor current |
| Iint | Signal generator generates an output current |
| K | Constant value |
| LC | Inductance and capacitance |
| MOSFET | Metal oxide semiconductor field effect transistor |
| PFC | Power factor correction |
| SMPS | Switch mode power supply |
| Ton | Switch ON-time |
| Tono | ON-time before it is extended |
| Tsw | Switching period |
| Tzcd | Inductor current returns to zero |
| Vcs | Current sense voltage |
| Vcsmin | Minimum level of the inductor current |
| Vds | Drain–source voltage of the switch |
| Vea | Generates an output voltage |
| VFB | Voltage feedback signal |
| Vin | Input voltage |
| Vout | Output voltage |
| Vramp | Ramp signal voltage |
| Vref | Reference voltage |
| VVAL | Differentiation of the divided voltage |
References
- Erickson, R.W.; Maksimovic, D. Line-Commutated Rectifier. In Fundamental of Power Electronics, 2nd ed.; Springer: New York, NY, USA, 2001; pp. 609–630. ISBN 978-0-7923-7270-7. [Google Scholar]
- Lai, J.; Chen, D. Design consideration for power factor correction boost converter operating at the boundary of continuous conduction mode. In Proceedings of the 1993 Eighth Annual IEEE Applied Power Electronics Conference and Exposition, San Diego, CA, USA, 7–11 March 1993; pp. 267–273. [Google Scholar]
- Buso, S.; Mattavelli, P.; Rossetto, L.; Spiazzi, G. Simple digital control improving dynamic performance of power factor pre regulators. IEEE Trans. Power Electron. 1998, 13, 814–823. [Google Scholar] [CrossRef]
- Jang, Y.; Jovanovic, M.M. Light-load efficiency optimization method. IEEE Trans. Power Electron. 2010, 25, 67–74. [Google Scholar] [CrossRef]
- Li, Q.; Lee, F.C.; Xu, M.; Wang, C. Light-load efficiency improvement for PFC. In Proceedings of the 2009 Annual IEEE Energy Conversion Congress and Exposition, San Jose, CA, USA, 20–24 September 2009; pp. 3755–3760. [Google Scholar]
- Lee, F.C.; Xu, M.; Wang, S.; Lu, B. Topologies and design considerations for distributed power system applications. Proc. IEEE 2001, 89, 939–950. [Google Scholar] [CrossRef]
- Zhang, Z.; Yao, K.; Ma, C.; Chen, J.; Li, L.; Guan, C.; Wu, C. All-Fixed Switching Frequency Control of CRM Boost PFC Converter based on Variable Inductor in a Wide Input Voltage Range. In Proceedings of the 2019 Annual IEEE Energy Conversion Congress and Exposition, Baltimore, MD, USA, 29 September–3 October 2019; pp. 1434–1441. [Google Scholar]
- Yoa, K.; Wang, Y.; Guo, J.; Chen, K. Critical Conduction Mode Boost PFC Converter With Fixed Switching Frequency Control. IEEE Trans. Power Electron. 2018, 33, 6845–6857. [Google Scholar]
- Ma, C.; Yao, K.; Wu, C.; Chen, J.; Li, L.; Guan, C.; Zhang, Z. Optimal Dual Constant Switching Frequency Control for CRM Buck-Buck/Boost PFC Converter. In Proceedings of the 2019 Annual IEEE Energy Conversion Congress and Exposition, Baltimore, MD, USA, 29 September–3 October 2019; pp. 1459–1465. [Google Scholar]
- Ye, Z.; Sun, B. PFC efficiency improvement and THD reduction at light loads with ZVS and valley switching. In Proceedings of the 2012 Annual IEEE Applied Power Electronics Conference and Exposition, Orlando, FL, USA, 2–5 February 2012; pp. 802–806. [Google Scholar]
- Jiang, C.; Nene, H.; Choudhury, S. Efficiency and THD Optimization Based on an Interleaved PFC Converter Using Digital Controller with Integrated Valley Switching Control Feature. In Proceedings of the 2019 IEEE Texas Power and Energy Conference, College Station, TX, USA, 7–8 February 2019; pp. 1–5. [Google Scholar]
- Nene, H.; Jiang, C.; Choudhury, S. Digital controller with integrated valley switching control for light load efficiency and THD improvements in PFC converter. In Proceedings of the 2017 Annual IEEE Applied Power Electronics Conference and Exposition, Tampa, FL, USA, 26–30 March 2017; pp. 1785–1788. [Google Scholar]
- Cheng, W.; Chen, C. A zero-current detection circuit with optimal ZVS/VS for boundary mode boost PFC converter. In Proceedings of the 2012 IEEE International Symposium on Industrial Electronics, Hangzhou, China, 28–31 May 2012; pp. 137–142. [Google Scholar]
- Cong, L.; Lee, H. A 2MHz 150-to-400V input isolated DC-DC bus converter with monolithic slope-sensing ZVS detection achieving 13ns turn-on delay and 1.6W power saving. In Proceedings of the 2018 IEEE International Solid—State Circuits Conference, San Francisco, CA, USA, 11–15 February 2018; pp. 382–384. [Google Scholar]
- Ren, X.; Wu, Y.; Guo, Z.; Zhang, Z.; Chen, Q. An online monitoring method of circuit parameters for variable on-time control in CRM boost PFC converters. IEEE Trans. Power Electron. 2019, 34, 1786–1797. [Google Scholar] [CrossRef]
- Ryan, R.T.; Hayes, J.G.; Morrison, R.; Hogan, D. A digital closed-loop control strategy for maintaining the 180° phase shift of an interleaved BCM boost converter for PFC applications. In Proceedings of the 2017 Annual IEEE Energy Conversion Congress and Exposition, Cincinnati, OH, USA, 1–5 October 2017; pp. 4927–4934. [Google Scholar]
- Liu, Z.; Ruan, X.; Yang, Y.; Ye, Z. Interleaved Critical Current Mode Boost PFC Converter with Coupled Inductor. IEEE Trans. Power Electron. 2011, 26, 2404–2413. [Google Scholar]
- Liu, Z.; Huang, Z.; Lee, F.C.; Li, Q. Digital-Based Interleaving Control for GaN-Based MHz CRM Totem-Pole PFC. IEEE J. Emerg. Sel. Top. Power Electron. 2016, 4, 808–814. [Google Scholar] [CrossRef]
- Roh, Y.; Moon, Y.; Park, J.; Yoo, C. A Two-Phase Interleaved Power Factor Correction Boost Converter with a Variation-Tolerant Phase Shifting Technique. IEEE Trans. Power Electron. 2014, 29, 1032–1040. [Google Scholar]
- Hosen, T.; Yanagisawa, K. “FA5590 Series” of 2nd Generation Critical Mode PFC Control ICs. Fuji Electr. 2010, 83, 68–71. Available online: https://www.fujielectric.co.jp/approximately/company/jihou_2010/pdf/83-06/FEJ-83-06-405-2010.pdf (accessed on 7 August 2019).
- Enhanced, High-Efficiency Power Factor Controller, Datasheet NCP1602. Available online: https://www.onsemi.com/pub/Collateral/NCP1602-D.pdf (accessed on 11 December 2019).
- Huber, L.; Irving, B.T.; Jovanovic, M.M. Effect of valley switching and switching-frequency limitation on line-current distortions of DCM/CCM boundary boost PFC converters. IEEE Trans. Power Electron. 2009, 24, 339–347. [Google Scholar] [CrossRef]
- Le, H.P.; Chae, C.S.; Lee, M.C.; Wang, S.W.; Kim, S.I.; Cho, G.-H. Integrated zero-inductor-current detection circuit for step-up DC-DC converters. IET Electron. Lett. 2006, 42, 943–944. [Google Scholar]
- Sivakumar, S.; Natarajan, K.; Gudelewicz, R. Control of power factor correcting boost converter without instantaneous measurement of input current. IEEE Trans. Power Electron. 1995, 10, 435–445. [Google Scholar] [CrossRef]
- Sun, J.; Xu, M.; Ren, Y.; Lee, F.C. Light-load efficiency improvement for buck voltage regulators. IEEE Trans. Power Electron. 2009, 24, 742–751. [Google Scholar]
- Mohammadi, F.; Zheng, C. A Precise SVM Classification Model for Predictions with Missing Data. In Proceedings of the 4th National Conference on Applied Research in Electrical, Mechanical Computer and IT Engineering, Tehran, Iran, 4 October 2018; pp. 3594–3606. [Google Scholar]
Figure 1.
Basic topological structure of boost power factor correction (PFC) converter.
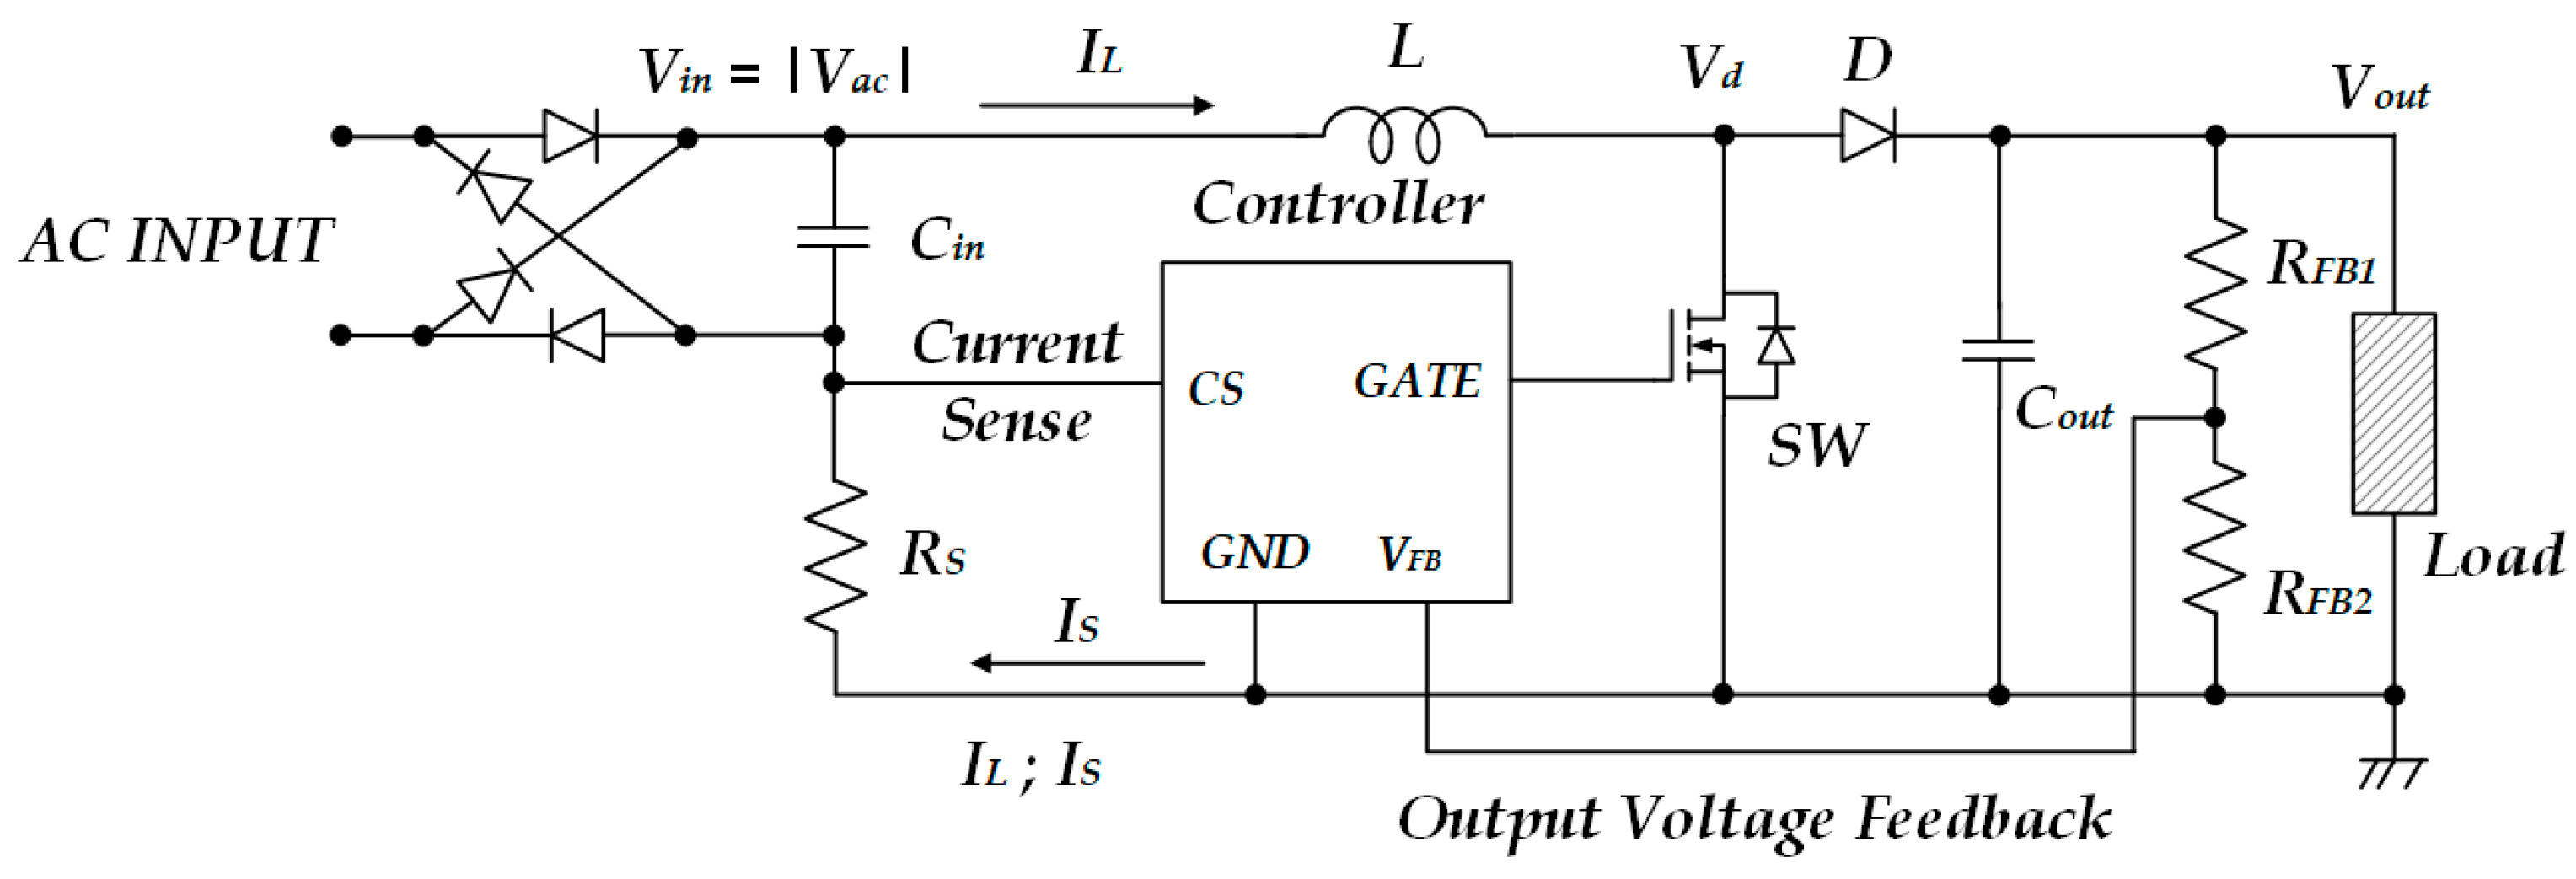
Figure 2.
Typical inductor current waveform of critical conduction mode (CRM) boost PFC control.
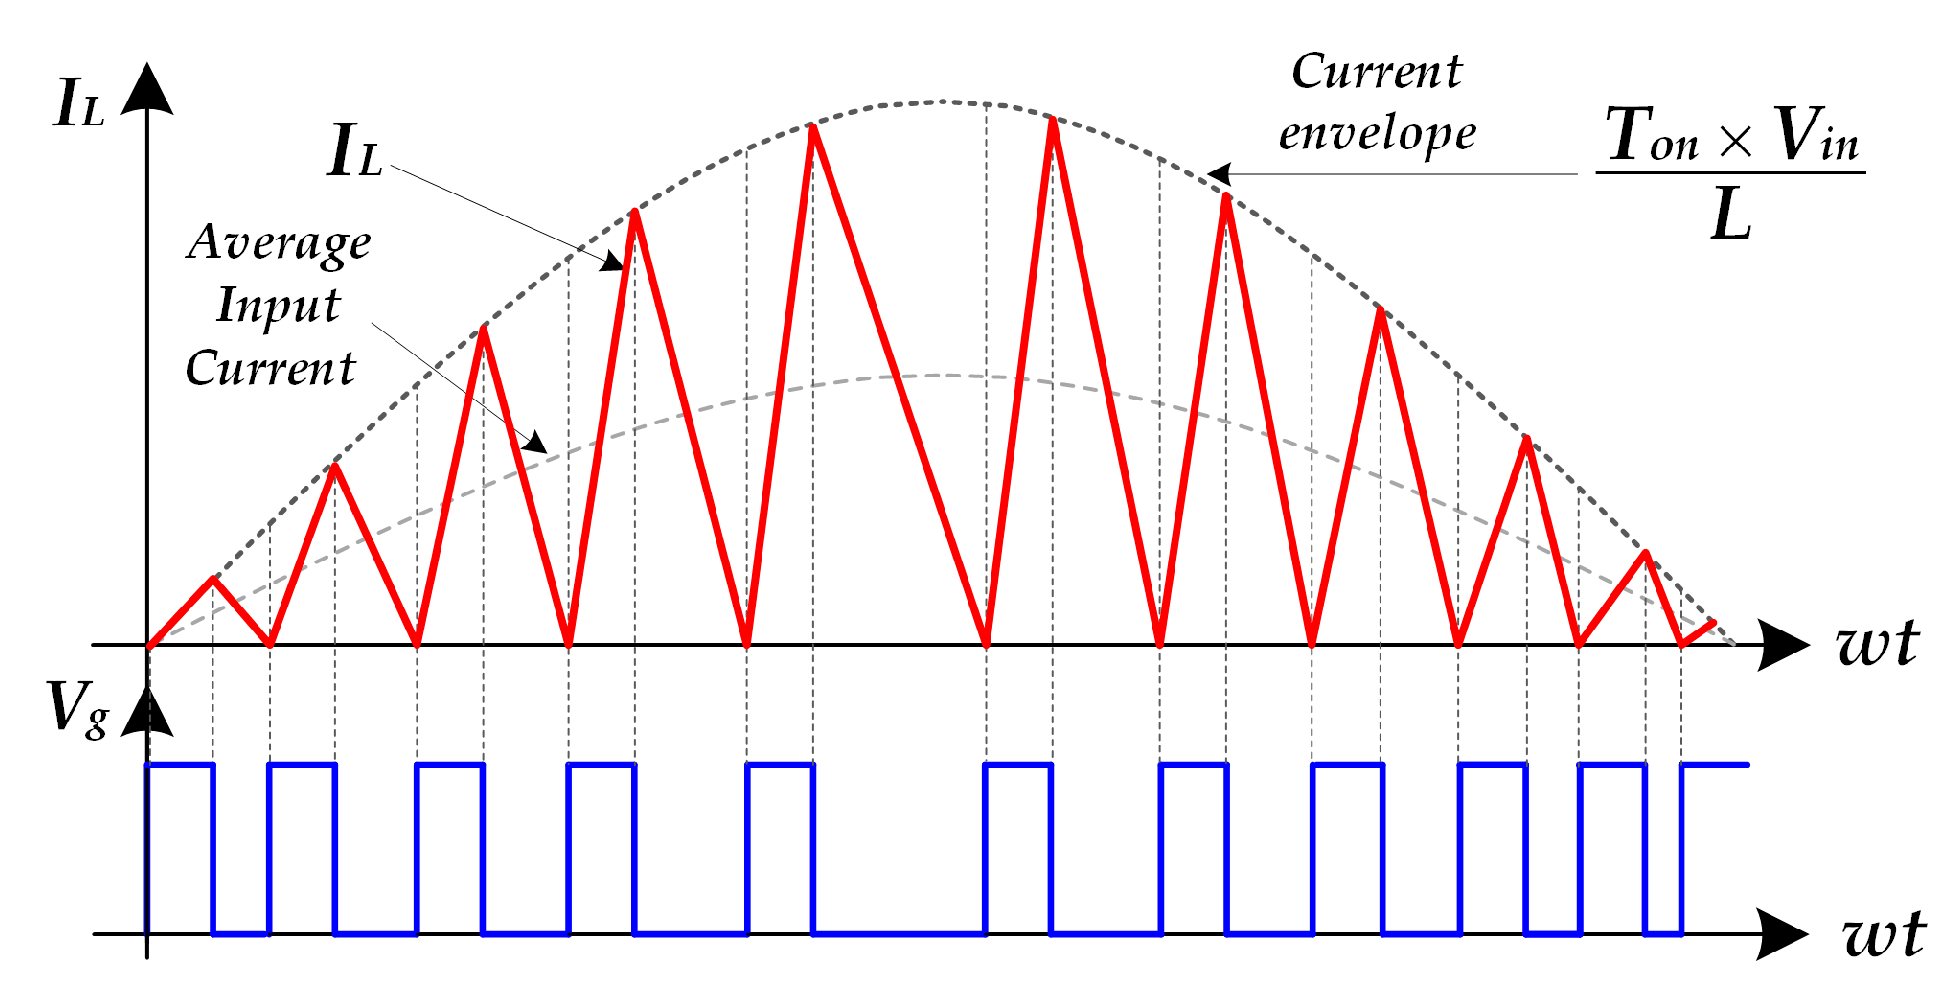
Figure 3.
Inductor current waveform of CRM boost PFC control with constant frequency limit.
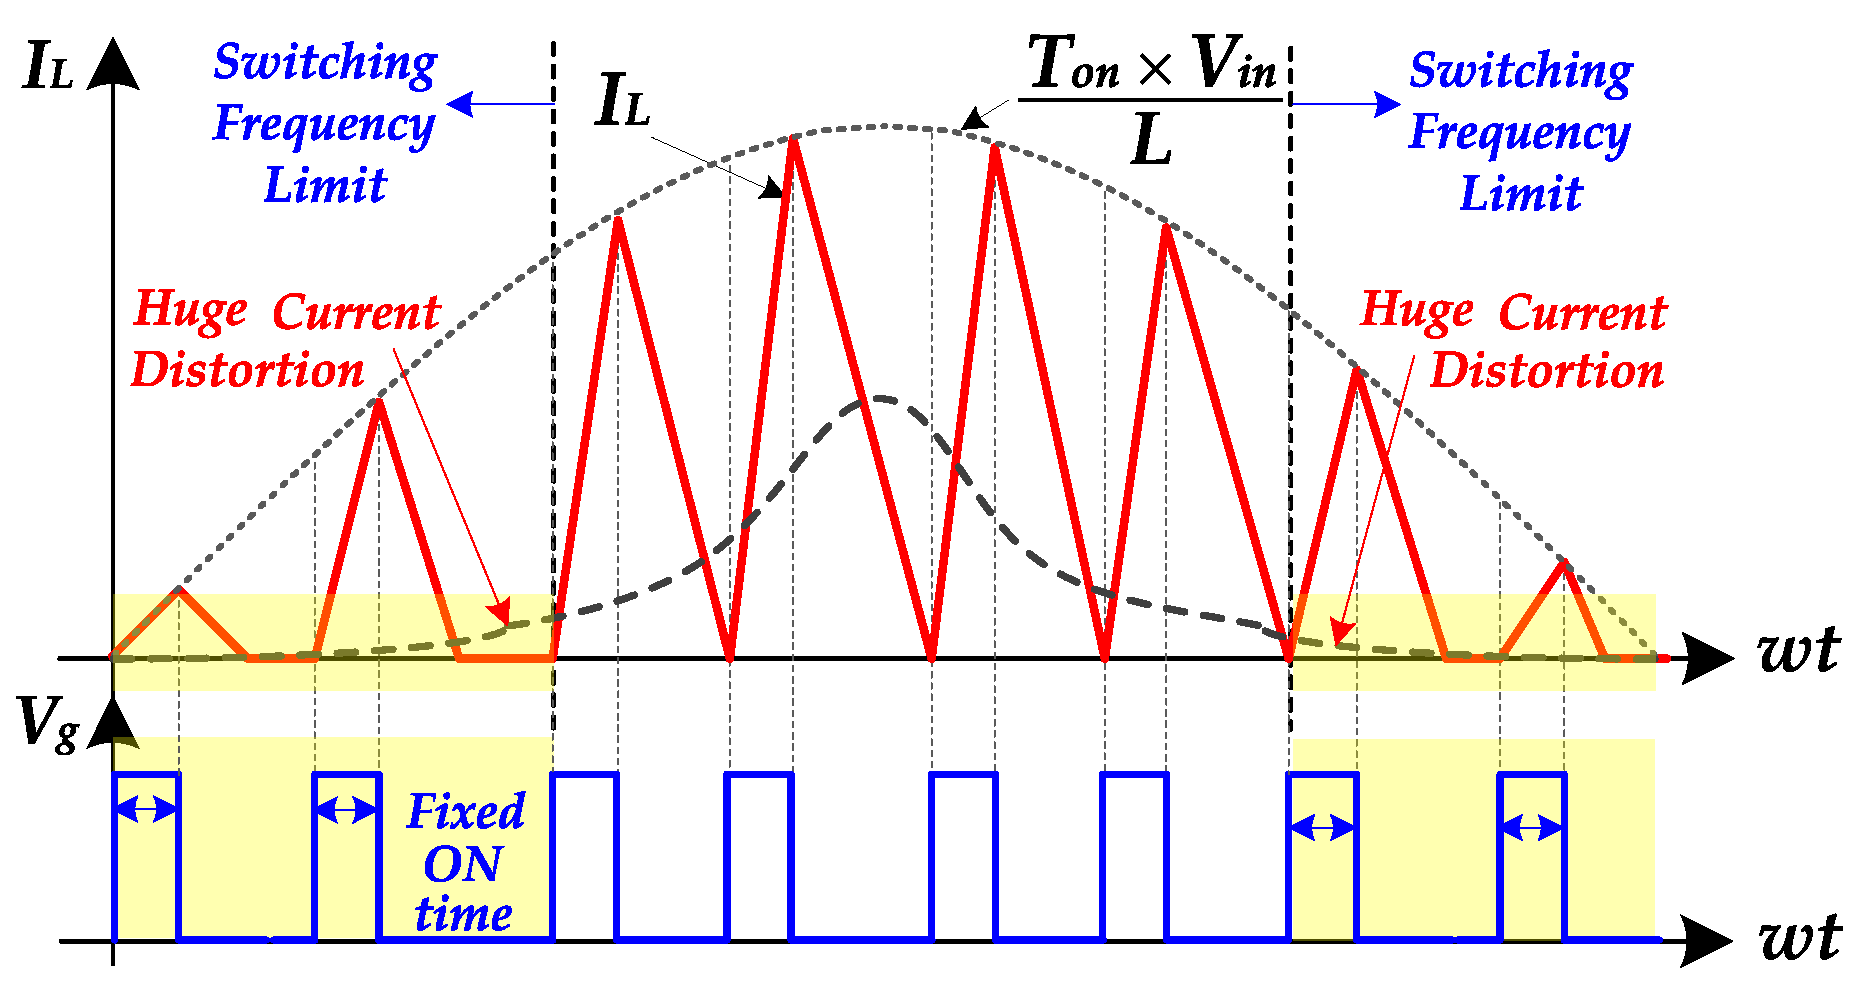
Figure 4.
Drain–Source voltage waveform of CRM PFC control with existing valley detection method.
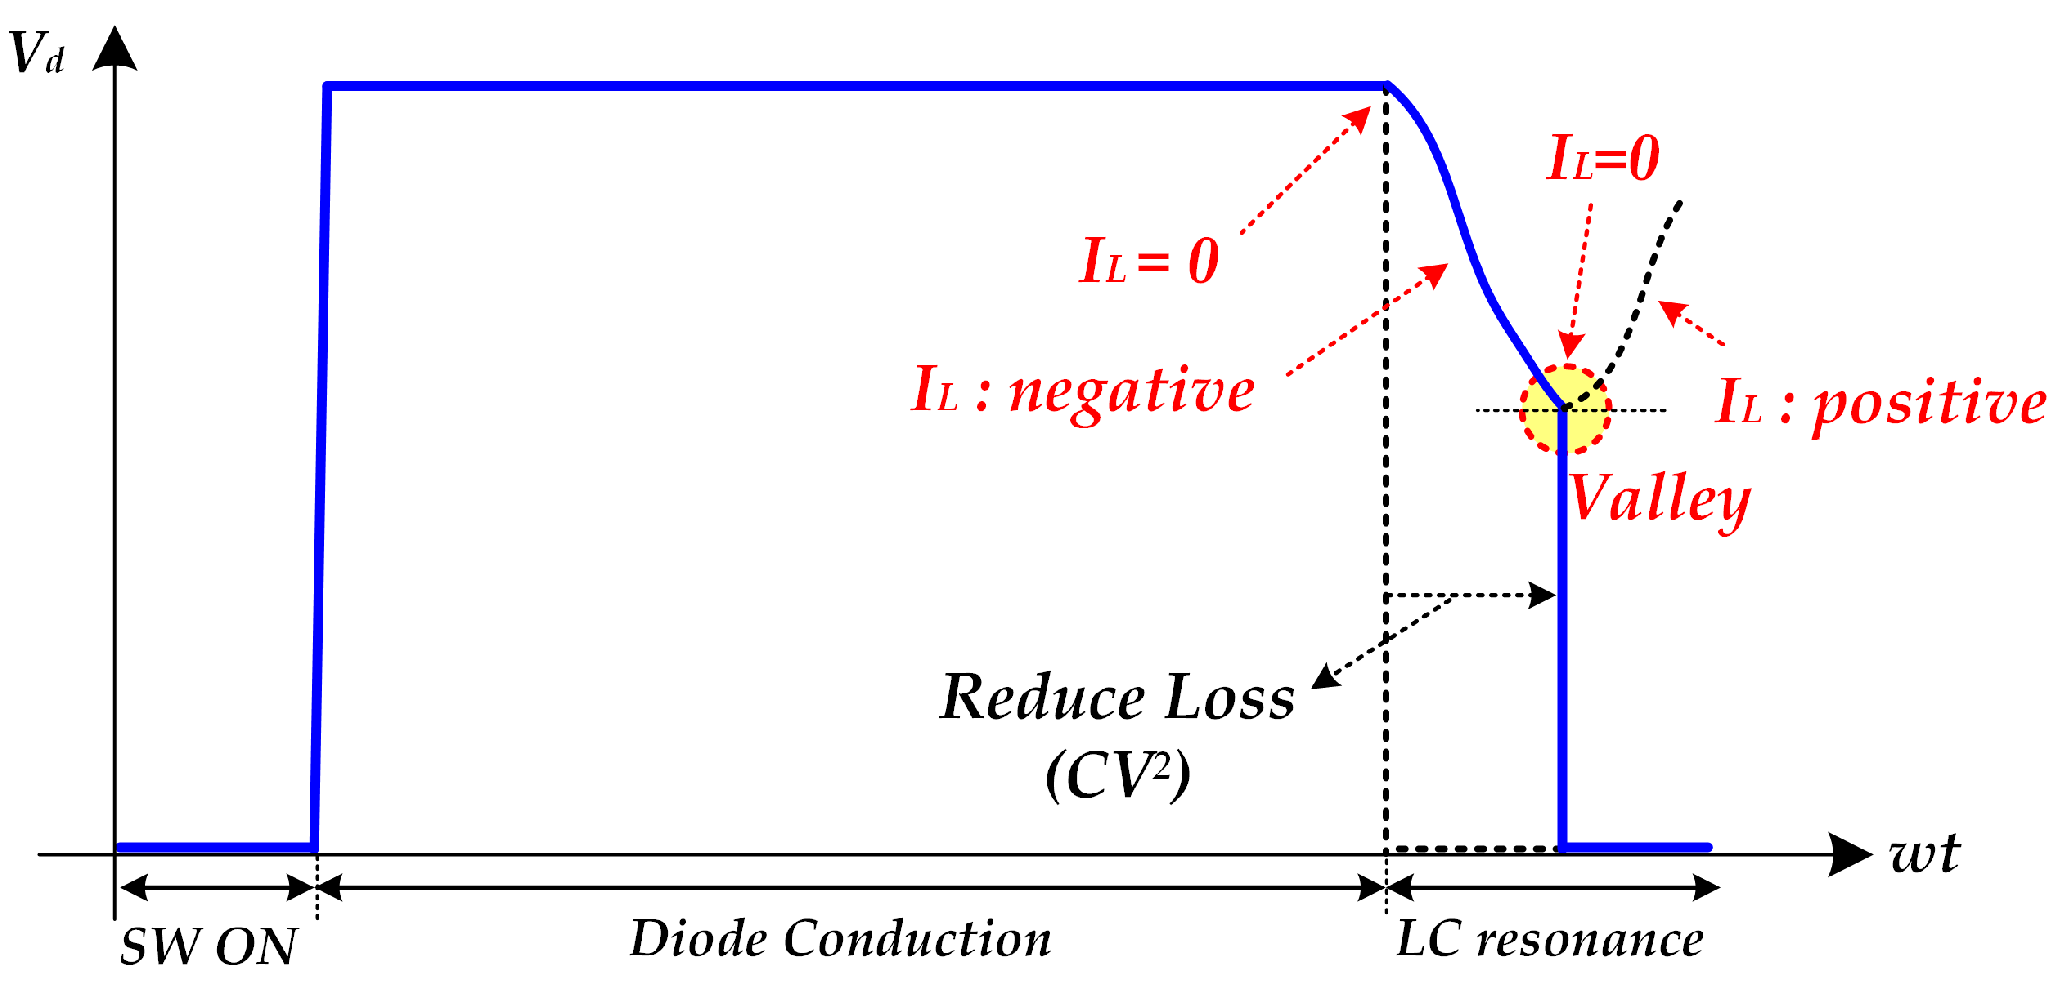
Figure 5.
Inductor current waveform of CRM boost PFC control with the proposed method.
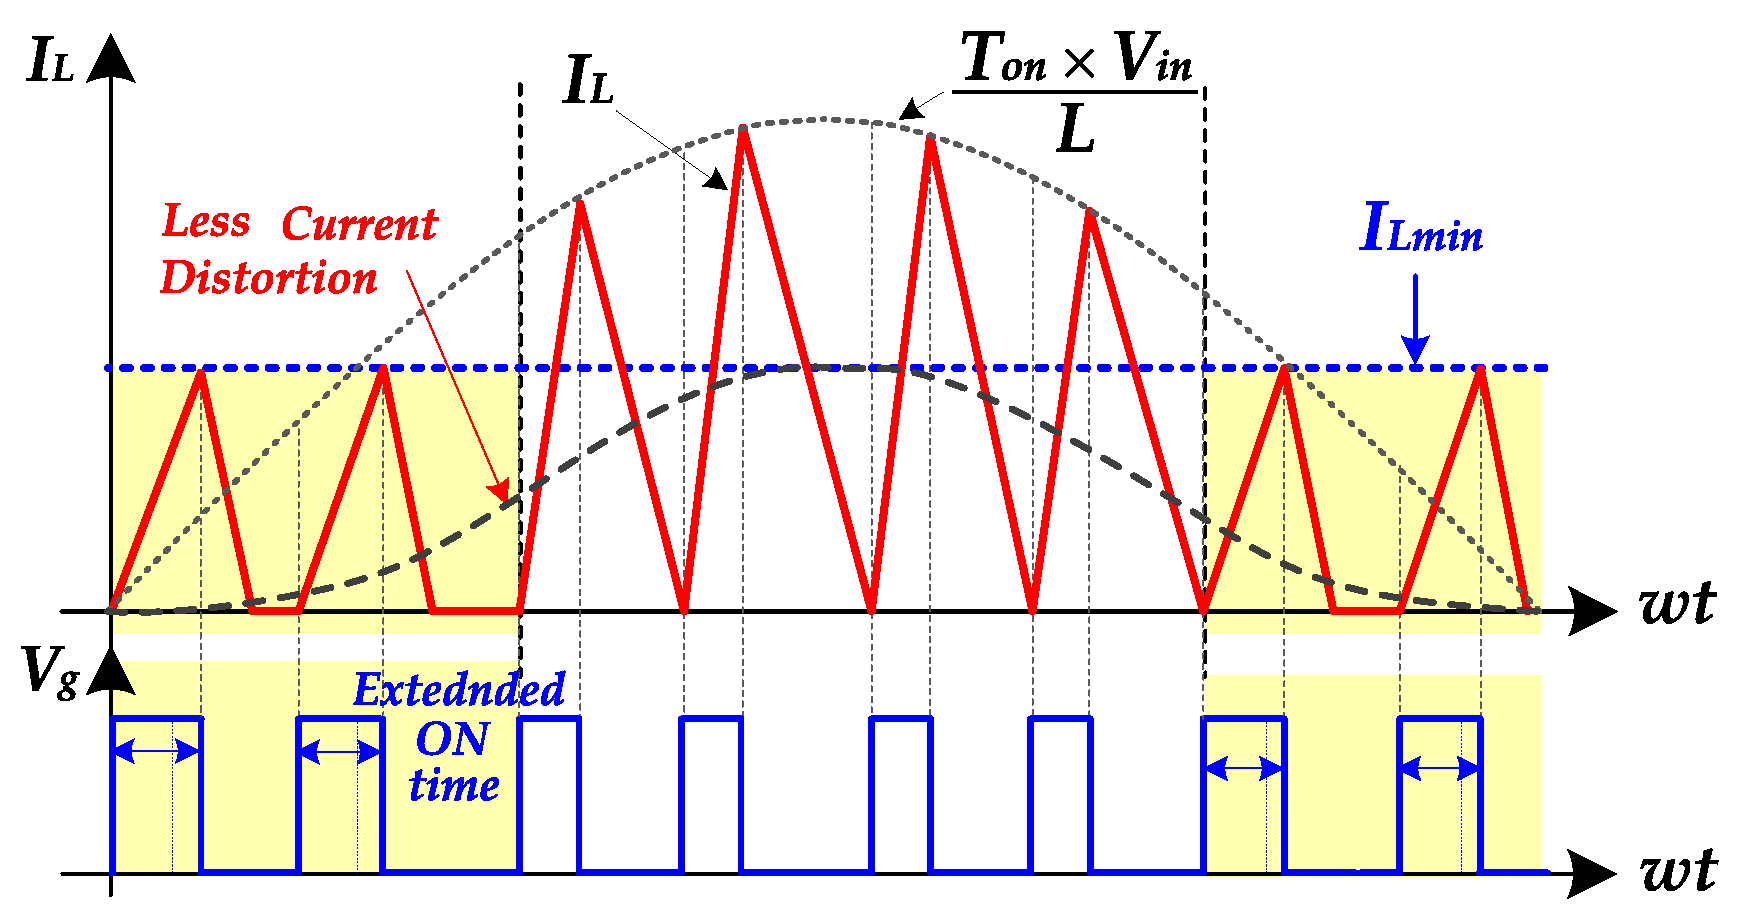
Figure 6.
Detailed inductor current waveform of PFC control with proposed method.
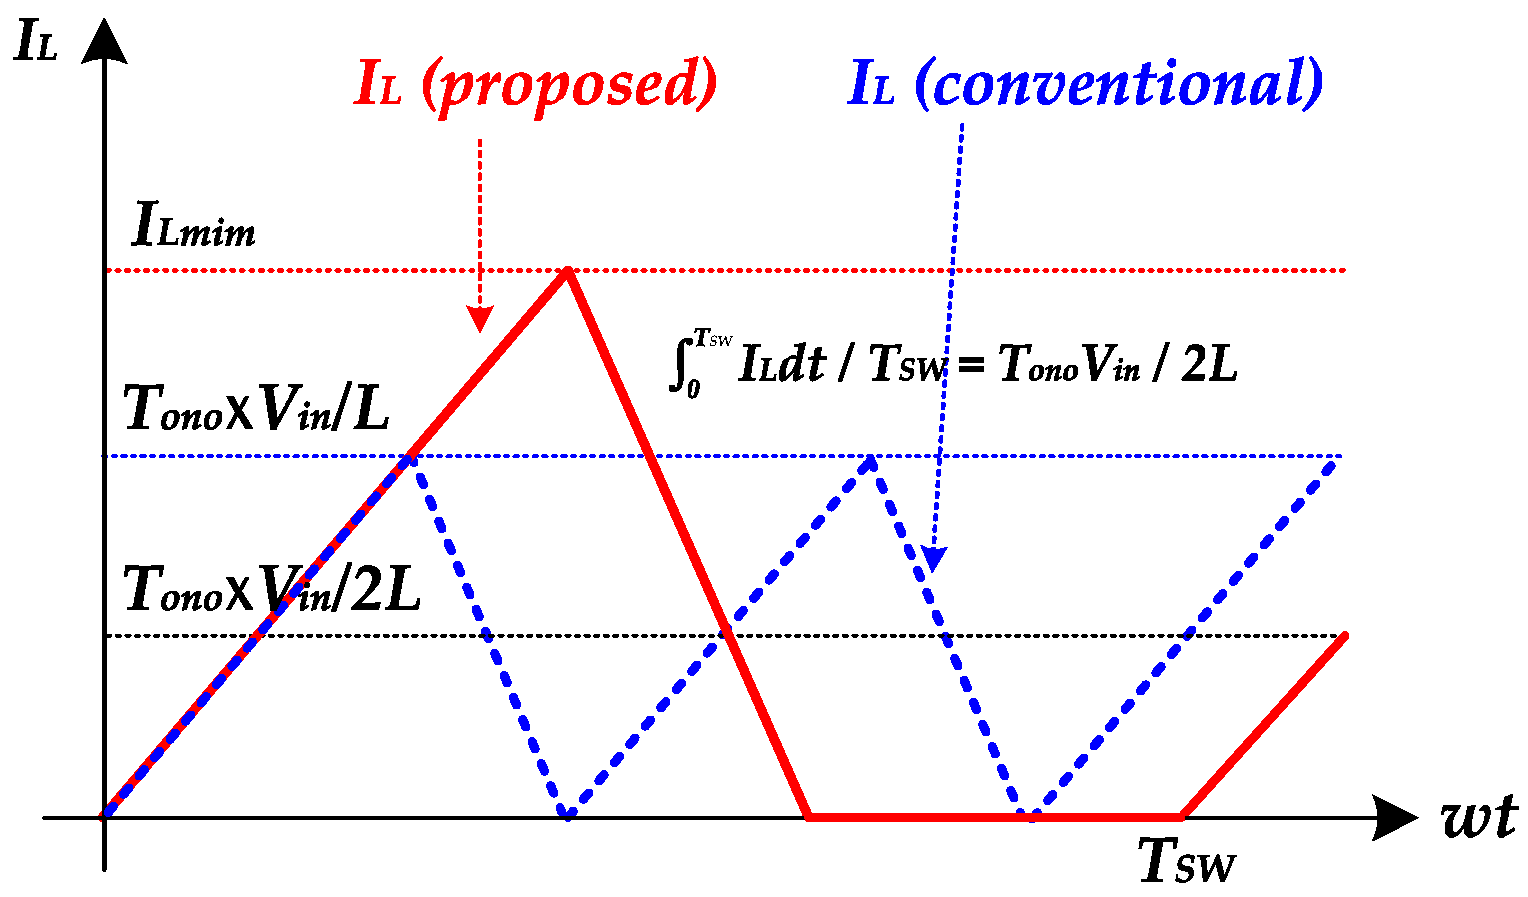
Figure 7.
Circuit diagram of PFC control with proposed valley detection method with ON-time extension.
Figure 7.
Circuit diagram of PFC control with proposed valley detection method with ON-time extension.
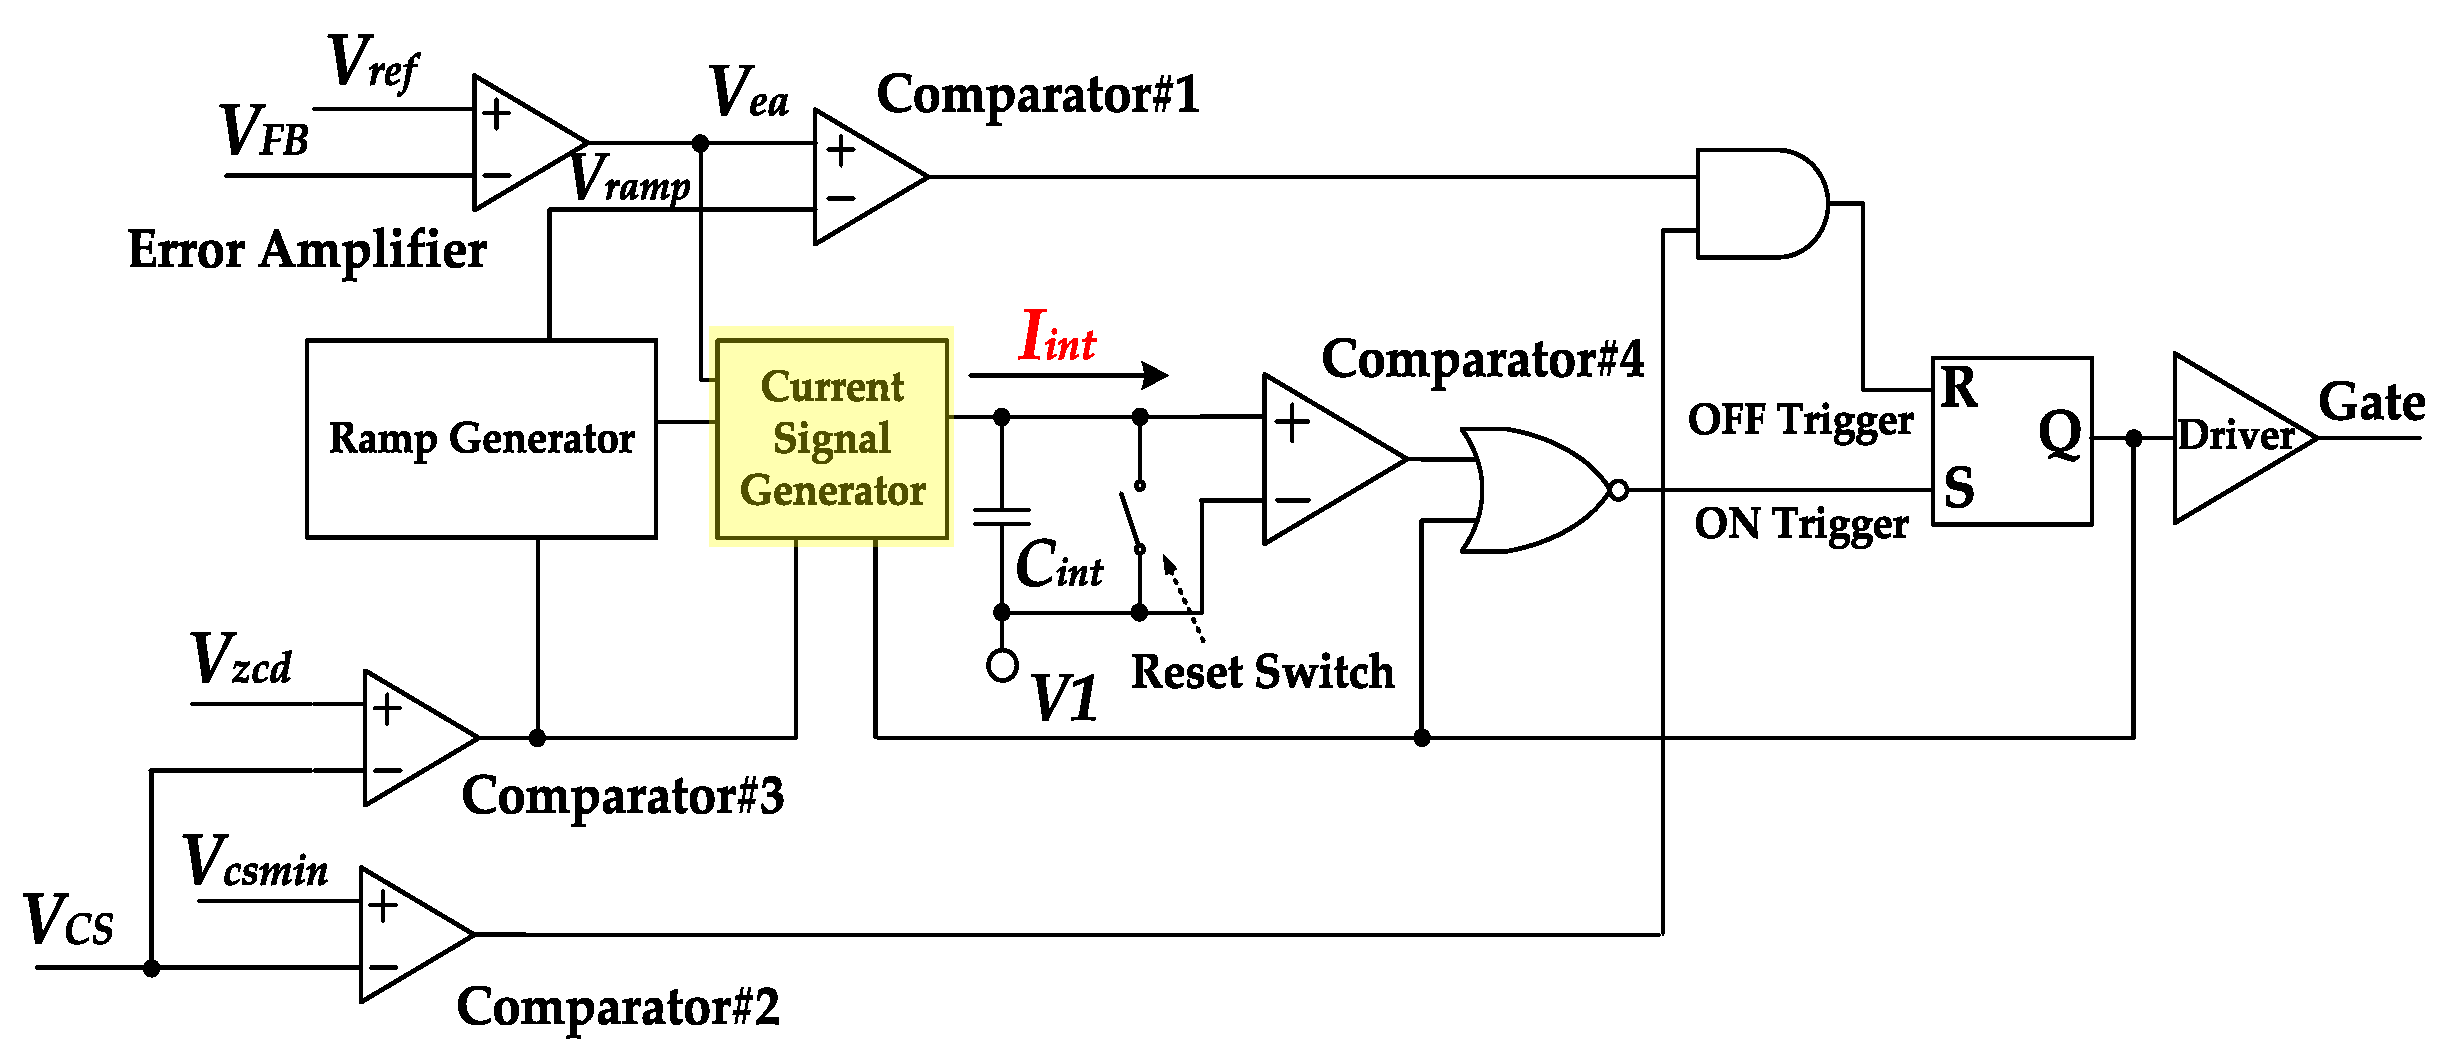
Figure 8.
Detailed inductor current waveform for ON-time extension.
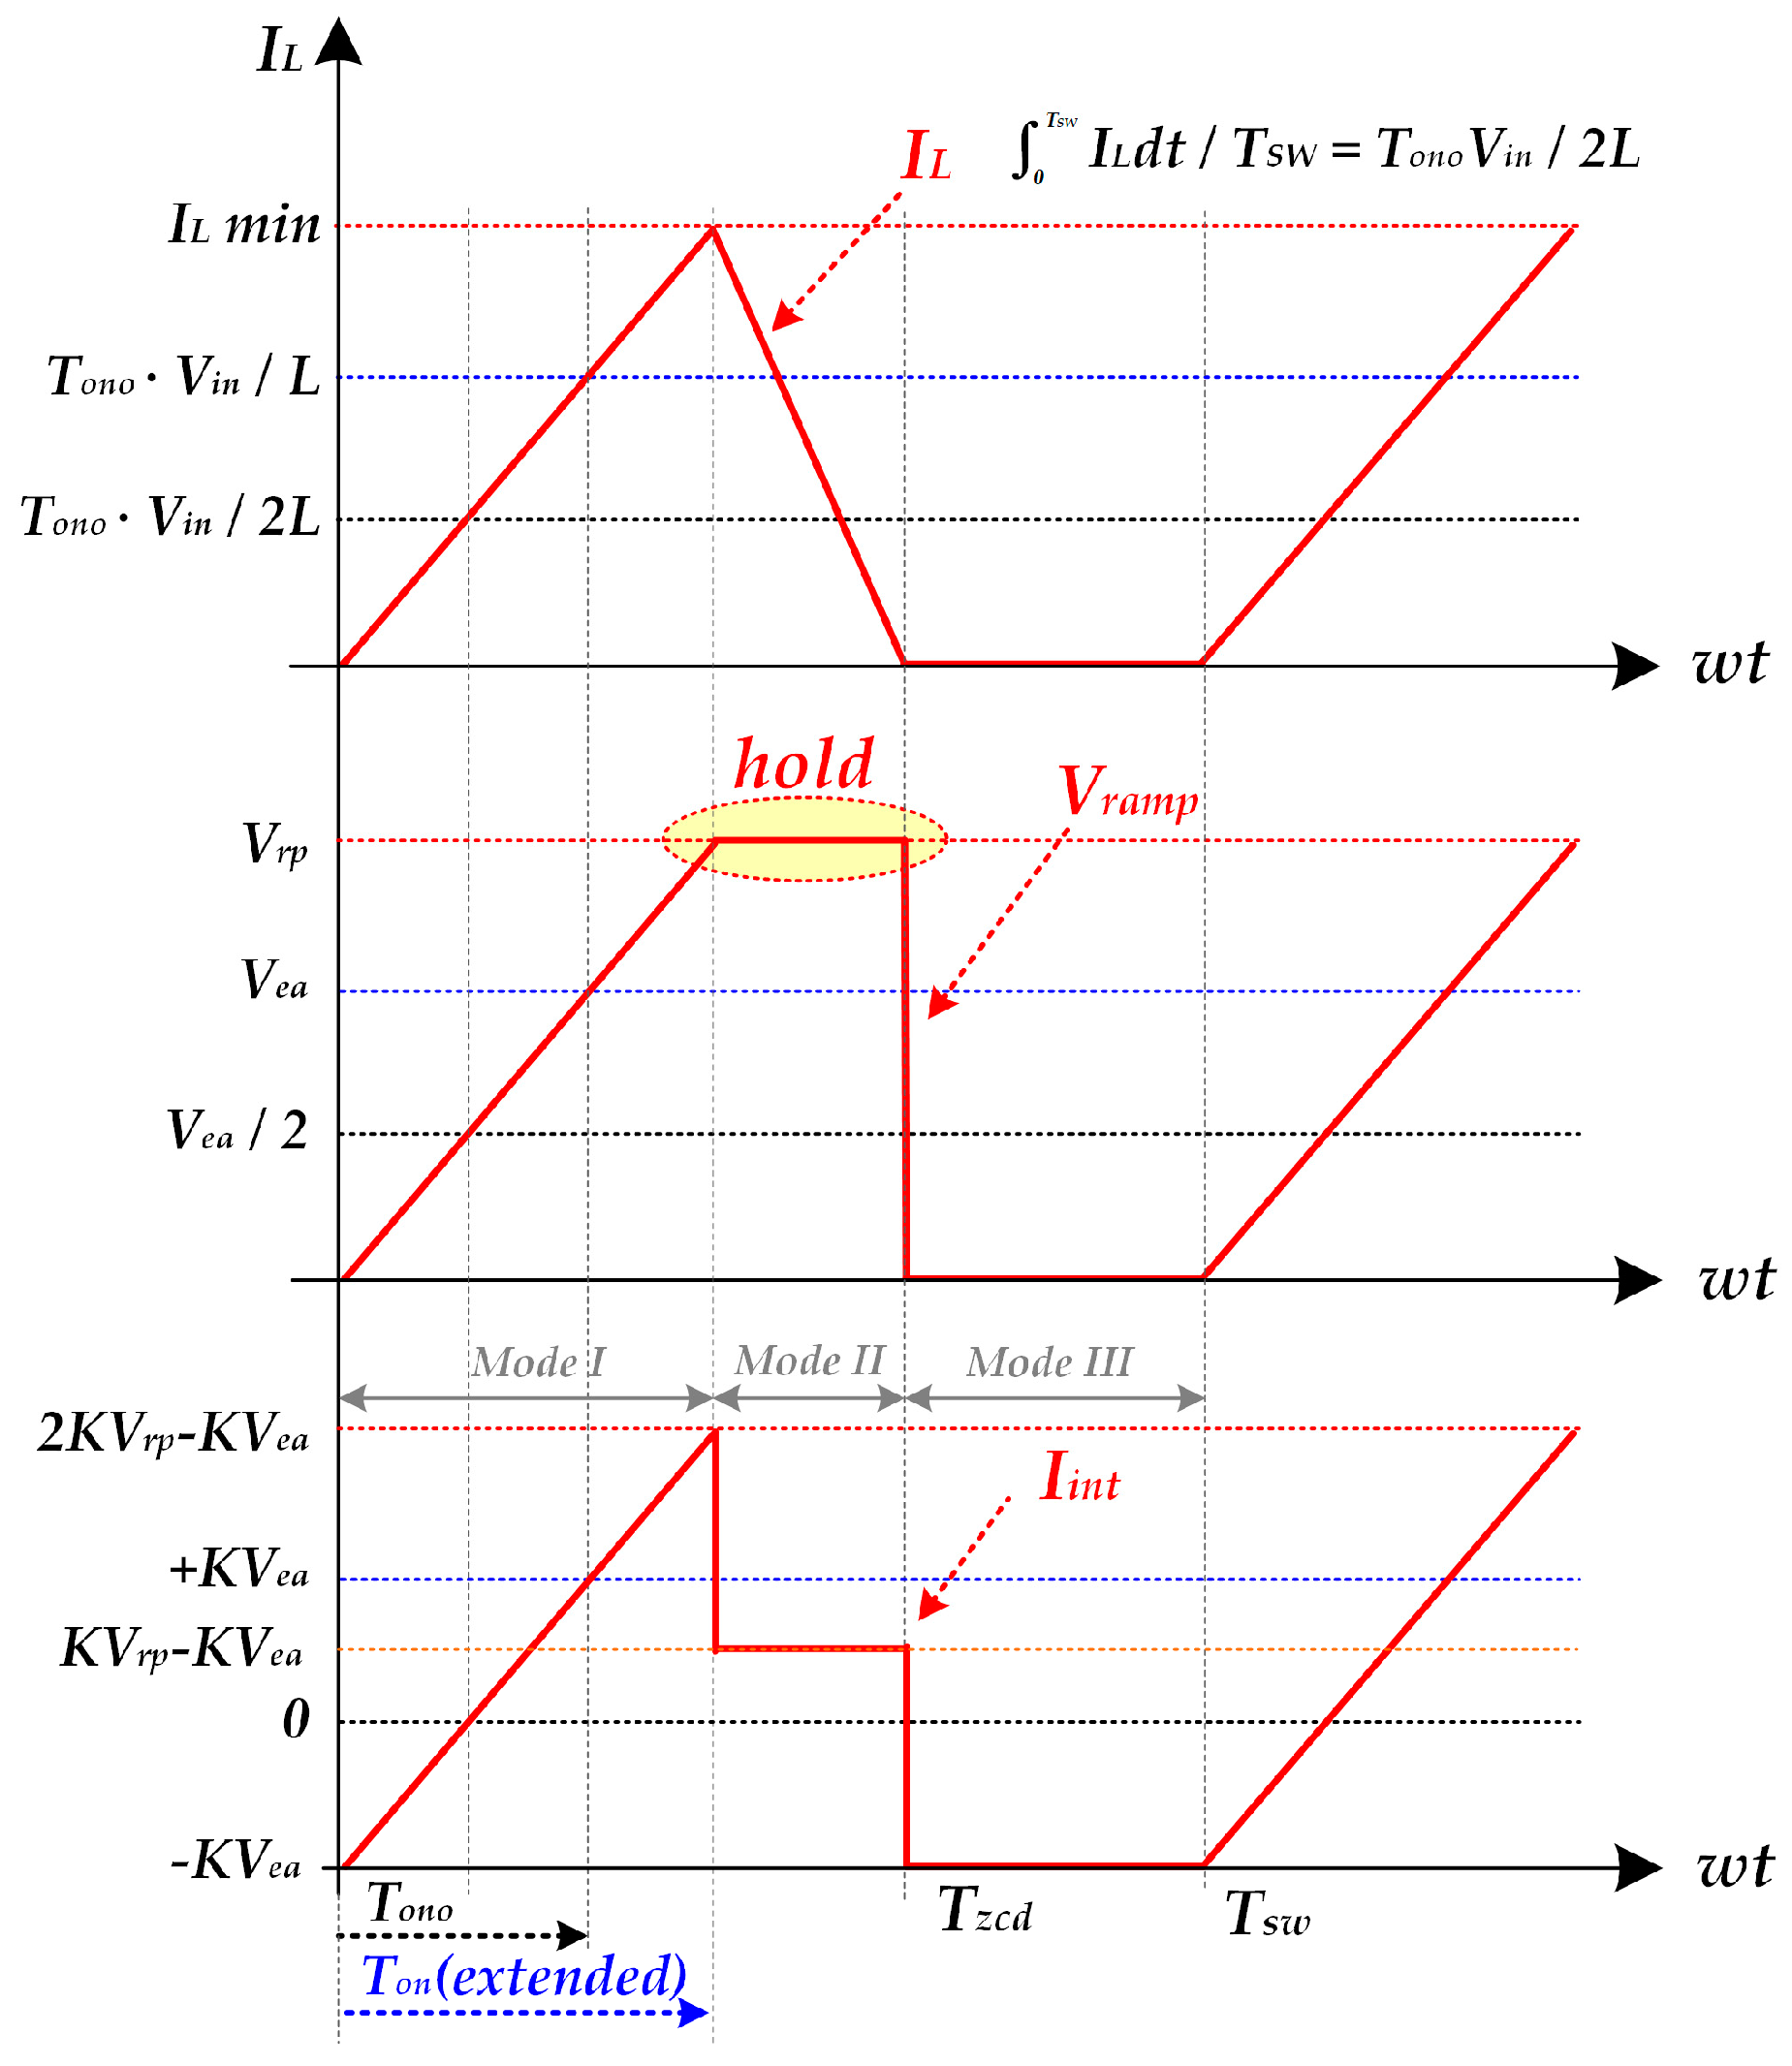
Figure 9.
The proposed valley detection circuit: (a) current sense voltage circuit; (b) divided drain voltage circuit.
Figure 9.
The proposed valley detection circuit: (a) current sense voltage circuit; (b) divided drain voltage circuit.
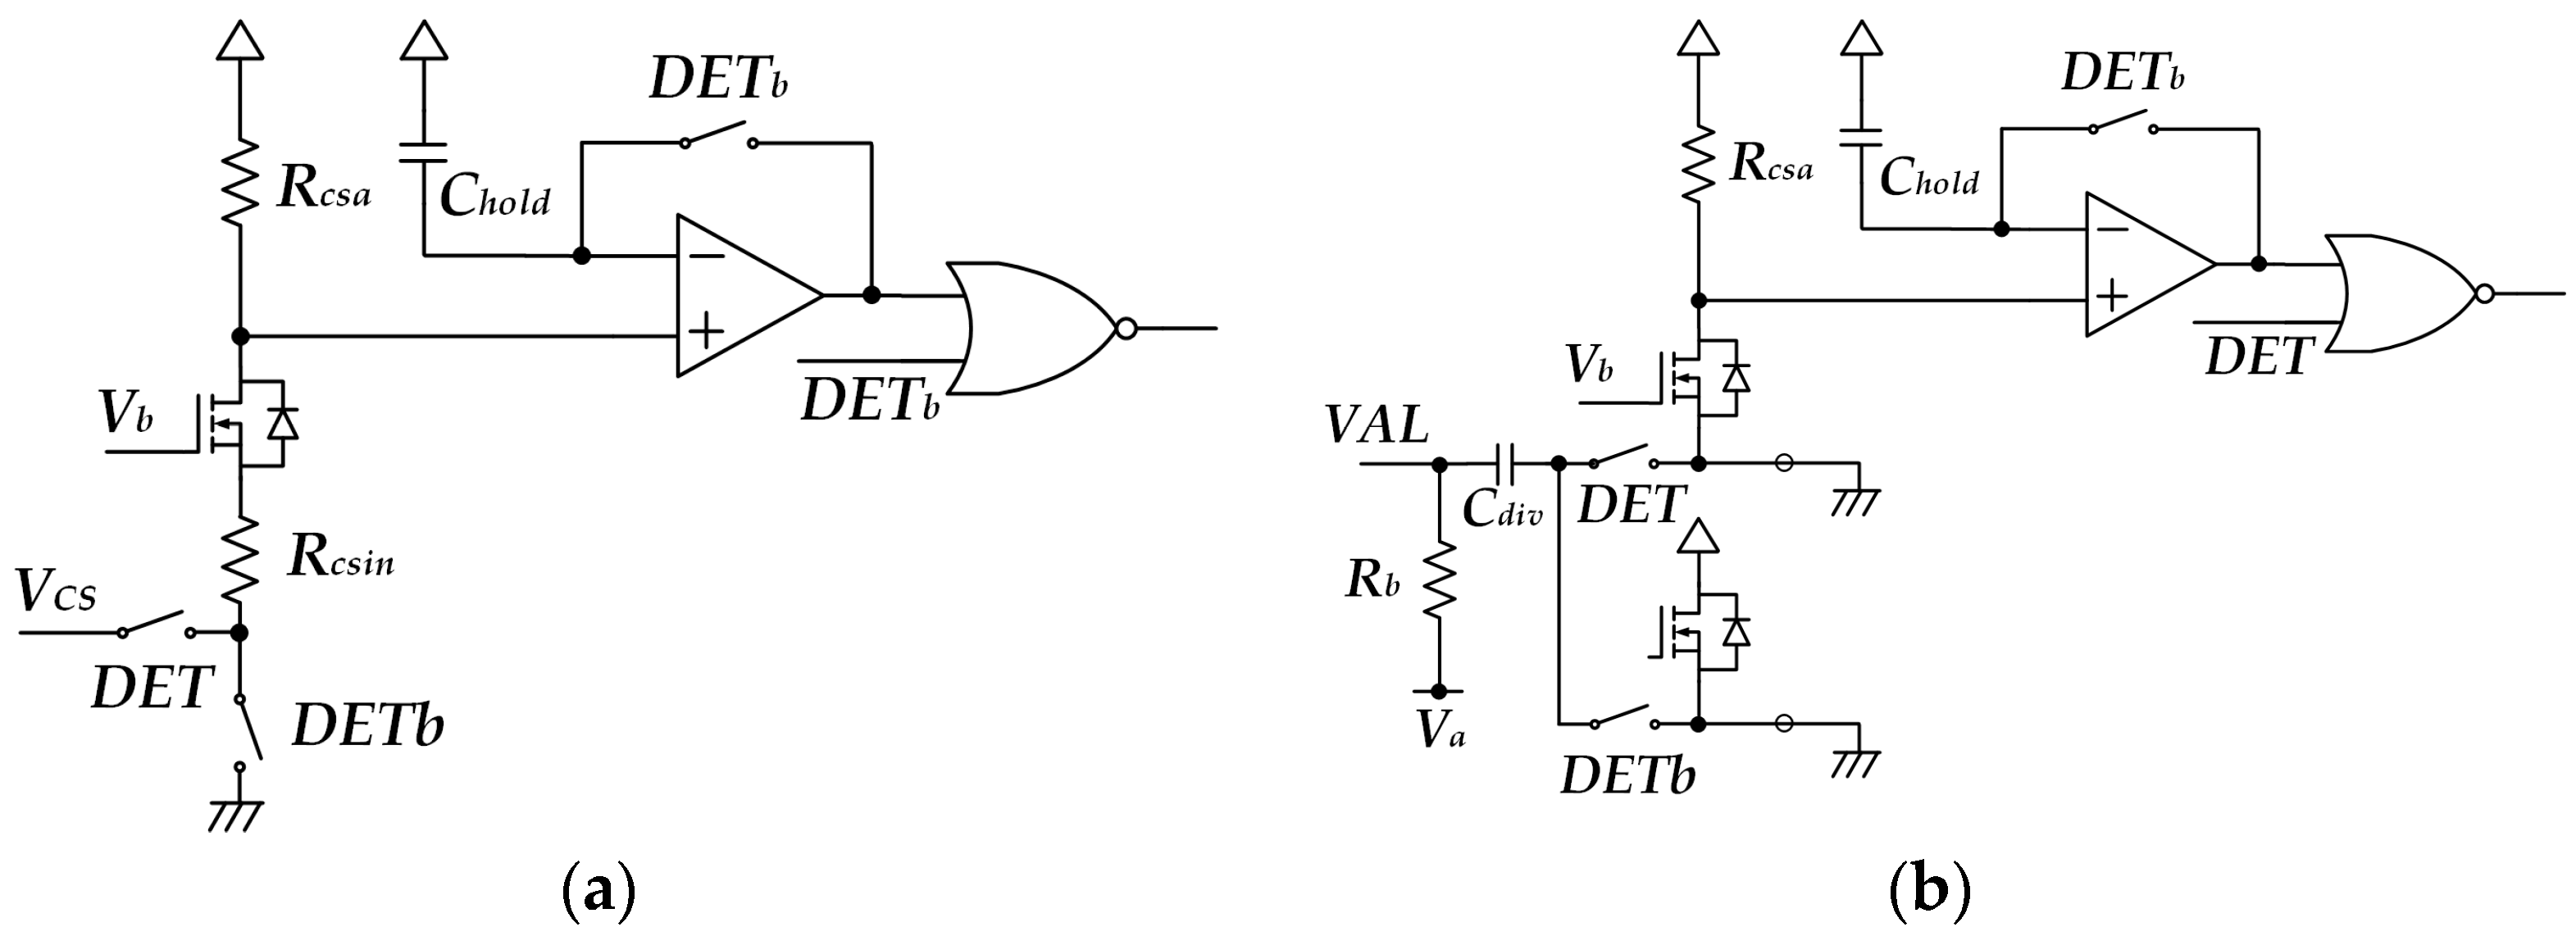
Figure 10.
PFC Converter with valley detection capacitors.
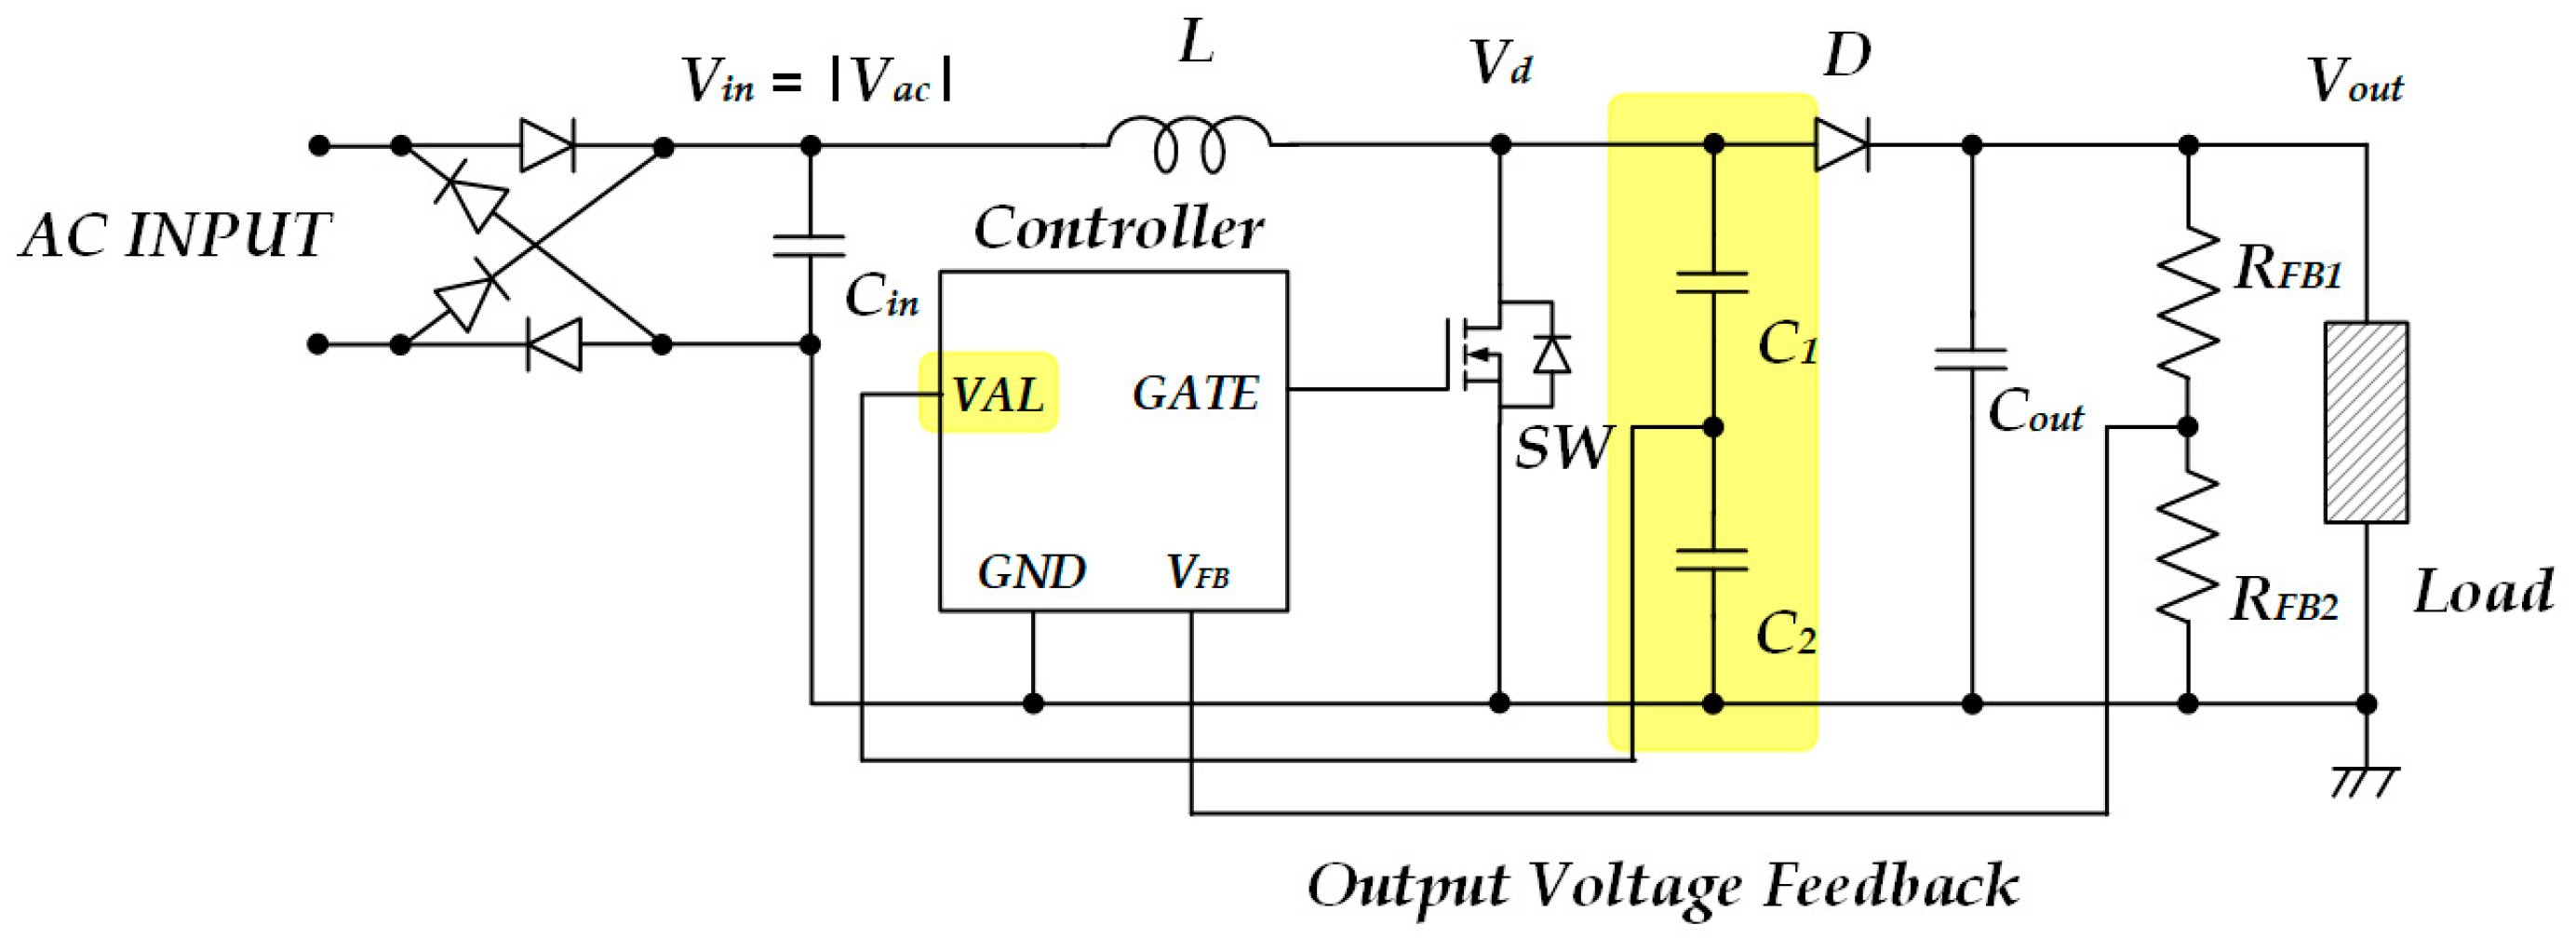
Figure 11.
Simulation circuit.

Figure 12.
Simulation results of valley detection from current sense voltage (VCS): (a) inductor current and drain–source voltage (Vin = 300 V, LPF = 50 Ω × 47 pF); (b) inductor current and drain–source voltage (Vin = 100 V, LPF = 50 Ω × 47 pF); (c) inductor current and drain–source voltage (Vin = 300 V, LPF = 39 Ω × 5 nF); (d) inductor current and drain–source voltage (Vin = 100 V, LPF = 39 Ω × 5 nF).
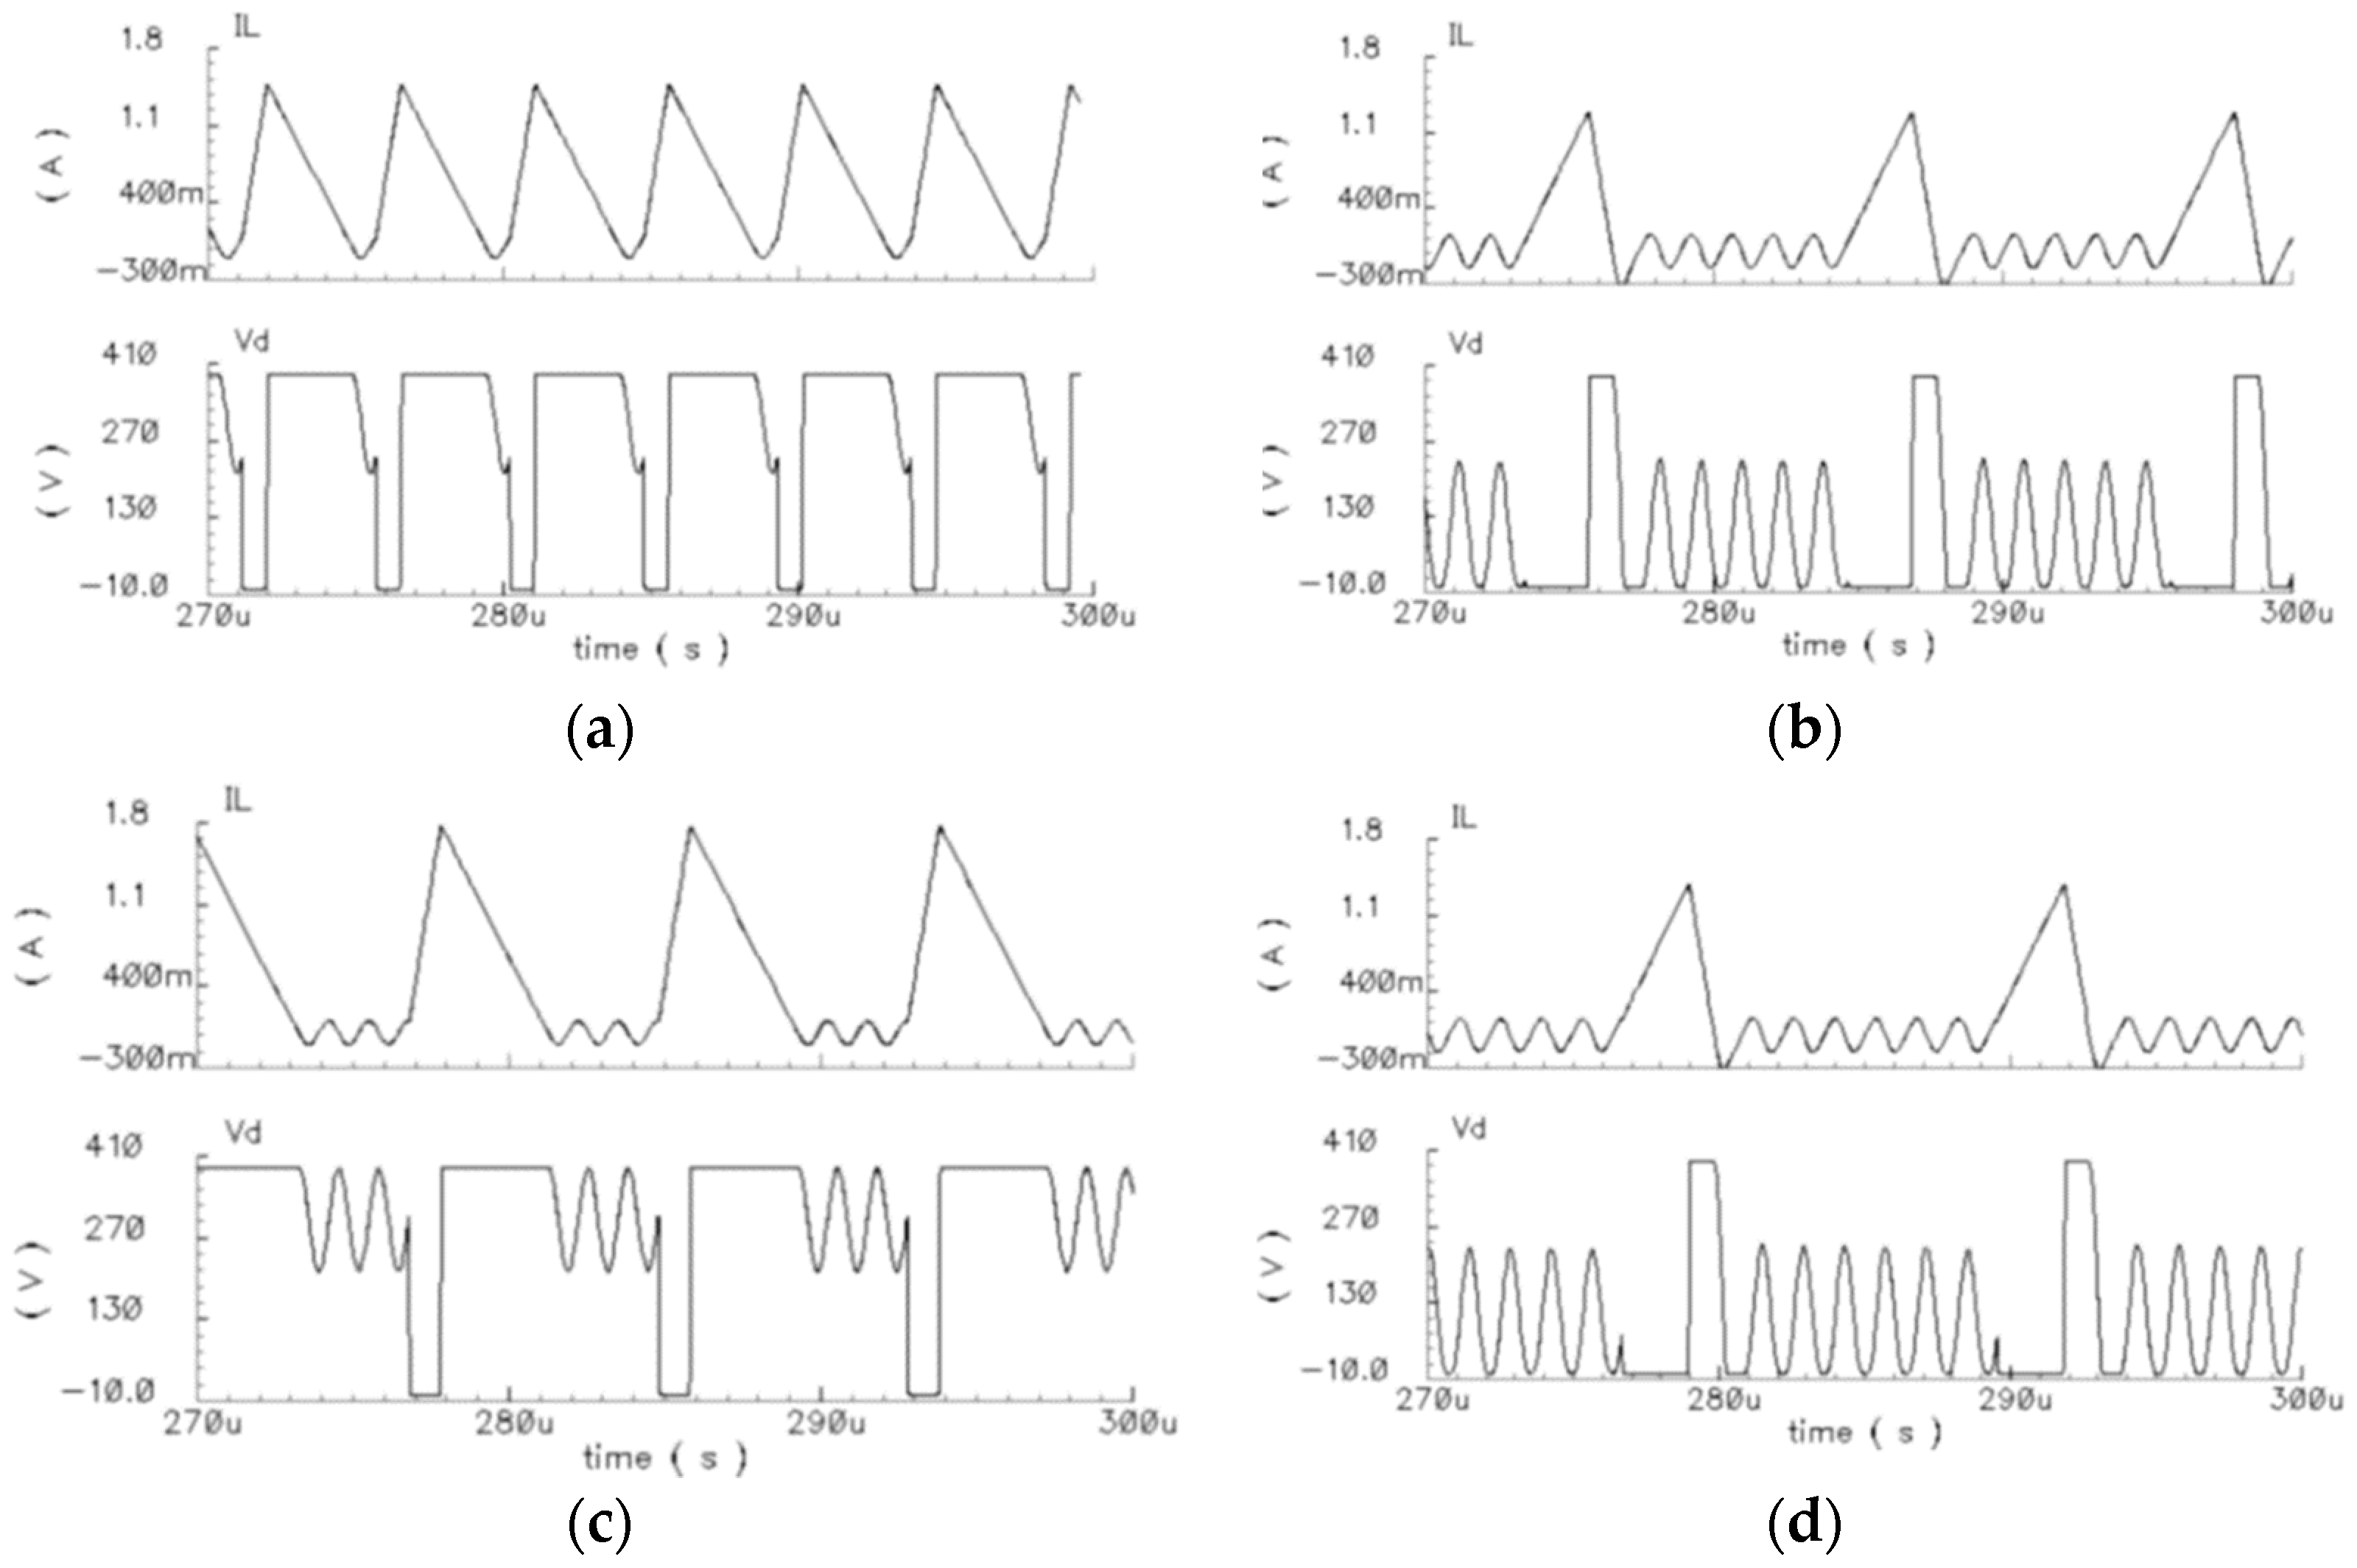
Figure 13.
Simulation results of valley detection from divided drain voltage (VVAL): (a) inductor current and drain–source voltage (Vin = 300 V, LPF = 50 Ω × 47 pF); (b) inductor current and drain–source voltage (Vin = 100 V, LPF = 50 Ω × 47 pF); (c) inductor current and drain–source voltage (Vin = 300 V, LPF = 39 Ω × 5 nF); (d) inductor current and drain–source voltage (Vin = 100V, LPF = 39 Ω × 5 nF).
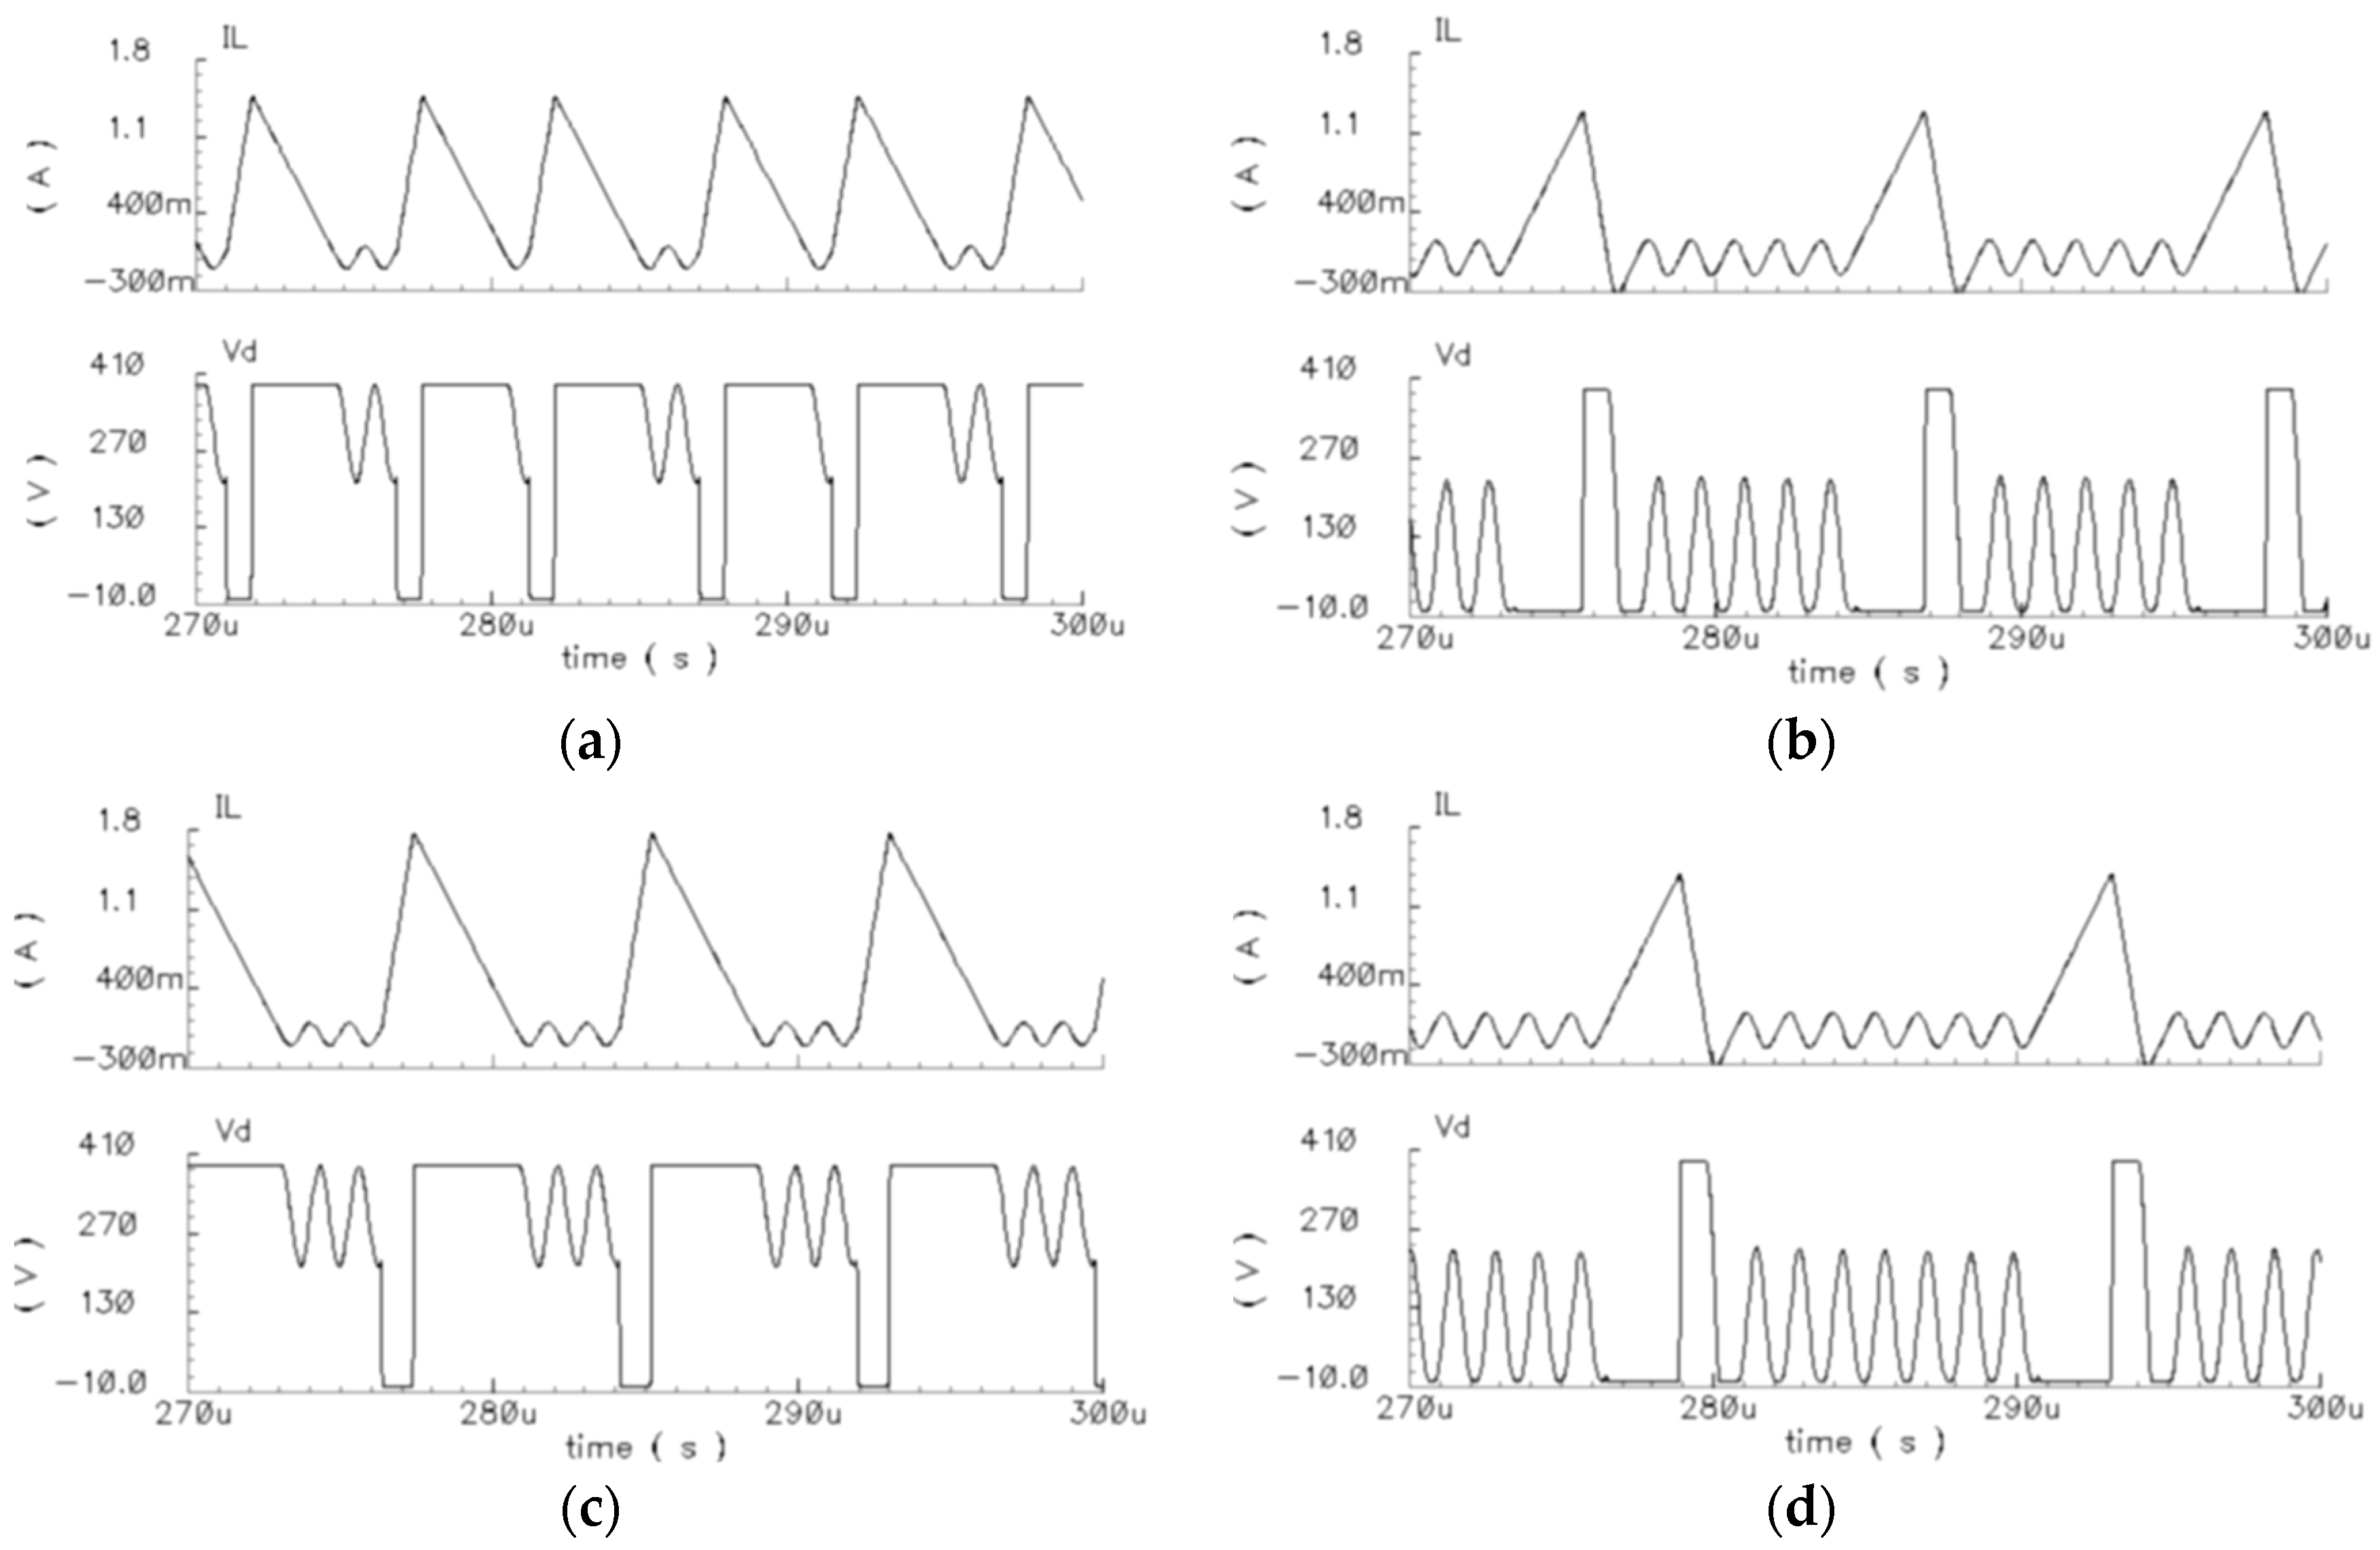
Figure 14.
Measurement setup: (a) realized valley detection CRM PFC IC; (b) test setup.
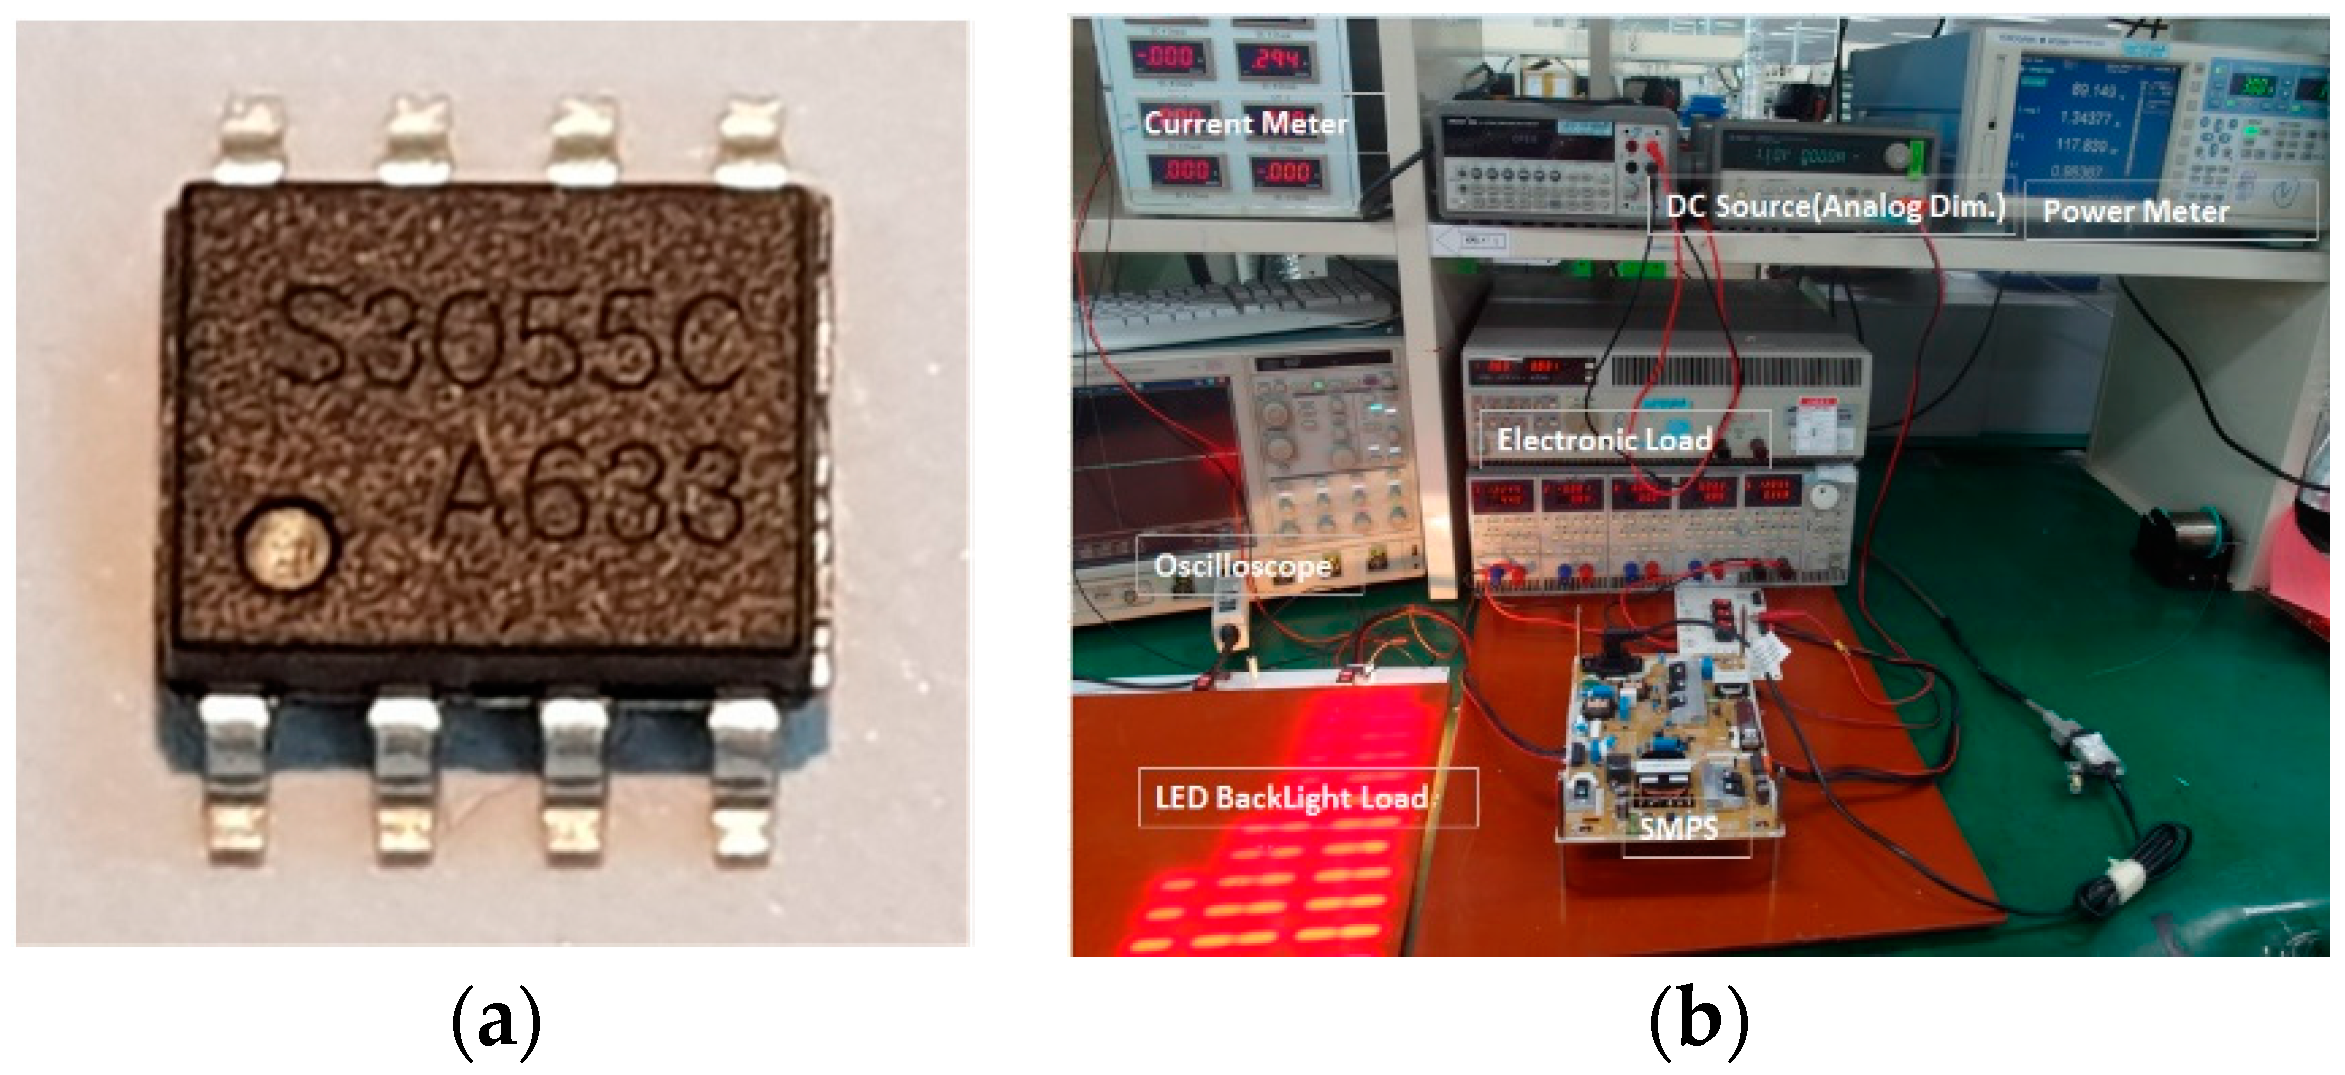
Figure 15.
Key experimental waveform: (a) ON-time extended inductor current with new valley detection from current sense voltage (VCS); (b) inductor current and drain–source voltage with conventional method; (c) inductor current and drain–source voltage with proposed valley detection method.
Figure 15.
Key experimental waveform: (a) ON-time extended inductor current with new valley detection from current sense voltage (VCS); (b) inductor current and drain–source voltage with conventional method; (c) inductor current and drain–source voltage with proposed valley detection method.

Figure 16.
Comparison results of efficiency and power factor: (a) efficiency for full load range; (b) light-load efficiency from 1 W to 80 W; (c) power factor for full load range.
Figure 16.
Comparison results of efficiency and power factor: (a) efficiency for full load range; (b) light-load efficiency from 1 W to 80 W; (c) power factor for full load range.
© 2019 by the authors. Licensee MDPI, Basel, Switzerland. This article is an open access article distributed under the terms and conditions of the Creative Commons Attribution (CC BY) license (http://creativecommons.org/licenses/by/4.0/).
Share and Cite
MDPI and ACS Style
Cho, K.-S.; Lee, B.-K.; Kim, J.-S. CRM PFC Converter with New Valley Detection Method for Improving Power System Quality. Electronics 2020, 9, 38. https://doi.org/10.3390/electronics9010038
AMA Style
Cho K-S, Lee B-K, Kim J-S. CRM PFC Converter with New Valley Detection Method for Improving Power System Quality. Electronics. 2020; 9(1):38. https://doi.org/10.3390/electronics9010038
Chicago/Turabian StyleCho, Kwang-Seung, Byoung-Kuk Lee, and Jong-Soo Kim. 2020. "CRM PFC Converter with New Valley Detection Method for Improving Power System Quality" Electronics 9, no. 1: 38. https://doi.org/10.3390/electronics9010038
Note that from the first issue of 2016, this journal uses article numbers instead of page numbers. See further details here.