Article

Field Trials for the Characterization of Non-Intentional Emissions at Low-Voltage Grid in the Frequency Range Assigned to NB-PLC Technologies

1
Bilbao Engineering College, University of the Basque Country (UPV/EHU), 48013 Bilbao, Spain
2
TECNALIA Research & Innovation—Digital Labs, 48160 Derio, Spain
3
ZIV Automation, 48170 Derio, Spain
*
Author to whom correspondence should be addressed.
Electronics 2019, 8(9), 1044; https://doi.org/10.3390/electronics8091044
Submission received: 2 June 2019 / Revised: 10 September 2019 / Accepted: 12 September 2019 / Published: 18 September 2019
(This article belongs to the Special Issue Advances of Power Line Communication (PLC))

Abstract

:
The paper describes the results of a measurement campaign to characterize the non-intentional emissions (NIE) that are present in the low voltage section of the electrical grid, within the frequency range assigned to narrowband power line communications (NB-PLC), from 20 kHz to 500 kHz. These NIE may severely degrade the quality of the communications and, in some cases, even isolate the transmission devices. For this reason, the identification and characterization of these perturbations are important aspects for the proper performance of the smart grid services based on PLC. The proper characterization of NIE in this frequency range is a key aspect for the selection of efficient configurations to find the best trade-off between data throughput and robustness, or even for the definition of new improved error detection and correction methods. The huge number of types of NIE, together with the wide variety of grid topologies and loads distribution (density and location of homes and industrial facilities) are great challenges that complicate the thorough characterization of NIE. This work contributes with results from field trials in different scenarios, the identification of different types of NIE and the characterization both in time and frequency domains of all the registered disturbances. This contribution will be helpful for a better knowledge of the electrical grid as a transmission medium for PLC and, therefore, for evaluating the appropriateness of different robustness techniques to be applied in the next generation of smart grid services.

1. Introduction

The increase of electronic devices connected to the electrical grid is affecting the levels of conducted emissions along the electrical grid in harmonics of the fundamental, and in frequencies in the range of kHz. Some of the sources of these non-intentional emissions (NIE) are related to the improvements in power electronics for energy efficiency and the current deployment of distributed energy resources (DER) and electrical vehicles (EV) chargers through the distribution grid [1,2,3,4,5,6,7]. The increasing number of such devices leads to more frequent and higher levels of emissions in the frequency range between 2 kHz and 150 kHz, as they operate with switching frequencies of several kHz [2,3,4]. Voltage levels above the compatibility levels increase the risk of interference for some equipment connected to the grid.
For frequencies below 2 kHz, emissions have been properly characterized and they are regulated by regional and national normative rules, such as the European Union (EU) EMC (Electromagnetic Compatibility) directive [5], which defines the limits to protect appliances against high harmonic current levels, as part of the CE (Conformité Européenne) marking. For frequencies above 2 kHz, the growth of high level and long-lasting NIE, which propagate through the electrical cables, may reduce the lifetime extension of the devices connected to the grid or even malfunctioning [6], as described in the list of examples compiled by the Comité Européen de Normalisation Electrotechnique (CENELEC) in [7]. In this higher frequency range, an additional issue is the impact on narrowband power line communications (NB-PLC), where disturbing NIE and communication signals coexist. The emissions may cause severe interferences on the transmitted data and the degree of impact depends on the level and spectral shape of the NIE [2,3,4,7,8].
With the aim of fostering the research on this topic, several ongoing working groups of different European and international organizations are currently addressing these topics: among others, CENELEC SC205 [7], IEC SC 77A group [9], IEEE EMC Society TC7 group [10], IEEE P1250 (Power and Energy Society) [11] and the CIGRE-CIRED working group C4.24 [12]. As a first representative example of the request of research results by regulatory bodies, the IEC has recently established a joint working group from IEC SC77A and CISPR SC/H, with the aim of defining requirements for the regulation of emissions in frequencies up to 150 kHz, in order to ensure the compatibility of electrical products [13]. Another representative example is related to the fact that the characteristics of NIE are highly dependent on the interactions between multiple sources in the grid and sinks of these frequencies, which continuously change over time. The need of the proper characterization of this issue has led to the establishment of the task force IEC SC77A WG9, in order to provide results on power quality measurement methods to IEC61000-4-30 [14]. As a last example, due to the lack of results from field measurements that provide real values for the proper operation in the grid, CENELEC has recently launched the SC 205 Working Group 11, in order to promote, gather and analyze NIE in electrical grids, and to determine adequate immunity levels for communications. For this purpose, SC 205 Working Group 11 is demanding results in this topic that provide the basis for updated criteria and immunity and compatibility levels [15].
One of the main difficulties of determining immunity and compatibility levels is that the emission from a device measured in laboratory conditions does not give a good estimation for the emission in a real installation [16]. Moreover, emission measurements are not reproducible at different locations, as changes in source impedance due to the connection and disconnection of neighboring devices will impact the NIE [1,17]. Therefore, it is important to gather measurements of NIE in real grid conditions in different environments, which provide a clearer picture of what is the actual level that may be present in the network, to evaluate the potential impact of these emissions on NB-PLC. This work provides field measurement results of NIE in different scenarios, in order to provide data, complementary to laboratory measurements, for the proper characterization of the disturbances in the communication channel used for NB-PLC.

2. Narrowband Power Line Communications (NB-PLC) and Non-Intentional Emissions (NIE)

The frequency range assigned to NB-PLC comprises from 9 kHz to 150 kHz in Europe, and up to 500 kHz in Asia and America [18,19,20]. Currently, these frequencies are being used in the deployment of advanced metering infrastructures (AMI), and in the near future, it is intended that they will allocate new and advanced services for the control and management of the grid [21]. In particular, the frequencies for AMI include, in Europe, the bands defined by CENELEC (9–148.5 kHz), the FCC band (9–490 kHz) in the USA set by the United States Federal Communications Commission, and in Asia, the ARIB band (10–450 kHz) specified by the Japanese Association of Radio Industries and Businesses. In the last years, there is an increasing interest in Europe to extend the frequency range for NB-PLC up to 500 kHz. Therefore, the characterization of the electrical grid as a propagation medium for data transmission should be evaluated up to 500 kHz, regardless of the region involved in the study.
Within the development of AMI, a considerable effort for deploying millions of smart meters (SM) has been carried out in the last few years by utilities and other companies related to power delivery. For this purpose, several NB-PLC technologies to provide data transmission have been conceived and implemented [18,19,20,22]. The main transmission technologies are Meters&More [23], G3-PLC specification [24] (published in Recommendation ITU-T G.9903 [25]), IEEE 1901.2 standard [26] and PRIME (PoweRline Intelligent Metering Evolution) [27], which comprises versions PRIME v1.3.6 [28] and PRIME v1.4 [29,30] (published by the International Telecommunication Union in Recommendation ITU-T G.9904 [31]).
These NB-PLC signals need to overcome non-intentional emissions during propagation over the LV distribution network. NIE in the range 9 kHz–500 kHz are generated, mainly, by photovoltaic inverters, battery chargers, hydropower systems and wind turbines [2,3,4,15,26], but also by electric vehicle chargers, home appliances and lightning devices [32,33]. The potential disturbance of EMI on NB-PLC may impede the performance of basic functionalities (monitoring of real-time consumption or generation) or advanced future applications (remote management of the EV charging process or remote control of DER). Moreover, many of these EMI sources are located close to the SM, as in the case of EV chargers and photovoltaic (PV) panel inverters, where the possibilities of being affected are higher.
Therefore, although the aforementioned NB-PLC technologies allow the use of robust modulation and coding techniques, strong disturbances in these frequencies may degrade the communications. Previous studies demonstrate that emission is this frequency range spreads mainly to neighboring locations and this might lead to think that there will be moderate levels of NIE in the grid [34]. However, several cases of quality degradation in NB-PLC due to NIE in the CENELEC-A band have been already described in the literature. In [3], it is reported that NIE from a PV inverter and a battery charger caused changes in the topology of a PRIME network and even blocked the access to some communication nodes. Similar observations of PV inverters interfering with a PLC transmission system with FSK (Frequency-Shift Keying) modulation are described in [35]. Reference [36] refers to underperformance of smart meters in real deployments in Spain due to non-permanent noise levels that were found to be significantly higher than maximum limits allowed for intended transmitters. CENELEC gathered several cases of interference to PLC systems in [7]. For instance, communication problems by a PLC system using S-FSK modulation due to the power supply of a television amplifier, a variable speed drive of an elevator and the power supply of a PC screen; and loss of communication of smart meters in Sweden caused by frequency-controlled ventilation systems, voltage converters or heat pumps. In [32] and [37] emission in the frequency range of 2 kHz to 150 kHz caused by electrical vehicle charging is evaluated, concluding that care has to be taken that NIE of the EV chargers does not interfere with the PLC communication.
The aforementioned interference cases are for PLC systems working below 150 kHz. By contrast, a less harsh propagation channel is expected from 150 kHz to 500 kHz. In particular, the transmission medium in the higher frequency range is expected to be less noisy, with a scarce presence of harmonics of switching frequency of inverters and, in general, a reduced number of conducted interfering emissions of diminished relevance. Nevertheless, the field trials developed in frequencies above 150 kHz are scarce and focused on a limited number of scenarios and grid topologies. For this reason, additional measurements that support this assumption are needed and they are currently demanded by some working groups of IEC and CENELEC [15,38].
In summary, the proper characterization of the different types of NIE above 9 kHz is a first step required to know the potential interferences that the NB-PLC have to face for an optimal performance. The huge variability of the types of NIE (many different types of loads and working regimes), the wide variety of measurement scenarios (different grid topologies and different density and distribution of homes and industries) and the resources required for the development of field trials complicate the characterization and understanding of NIE and their potential influence on NB-PLC.

3. Objectives

The main goal of this study is the analysis of empirical values of NIE in the LV section of the electrical distribution grid. For this purpose, a measurement campaign in several scenarios of the grid topology was scheduled in coordination with the Distribution System Operator Iberdrola. Therefore, the measurement methodology was adjusted to the frequency range of the NB-PLC technologies used by this Distribution System Operator for smart metering services in the LV distribution network: 20–500 kHz, for PRIME 1.3.6 [28] and PRIME 1.4 [29] transmission technologies.
The analysis methodology developed for this project was based, first, on the definition and implementation of an accurate and validated measurement system; then, on ad-hoc software for the data processing of the registered data; and last, in the thorough analysis of the field results, considering the particularities of the grid topology and the measurement areas.

4. Methodology

Unlike below 2 kHz, measurement methodologies in the range 2–500 kHz are only partially defined. In order to compare different measurements, it is essential that the same measurement method is applied. Multiple approaches are currently available (e.g., IEC 61000–4-7, IEC 61000–4-30 Ed.3 draft, CISPR 16), which apply to different frequency bands and can result in considerably different results for the same signal. Depending on the way of signal filtering, length and number of gaps in the measurement, bandwidth and aggregation method, significant differences in the measurement results can be obtained [7,39,40].
The method according to IEC 61000-4-7 is proposed for measurement of device emission between 2 and 9 kHz. Above 9 kHz a measurement method for device emission under laboratory conditions is defined in CISPR 16 [41]. IEC 61000-4-30 proposes a third method for the range 9 to 150 kHz, but it is not as detailed as CISPR specifications. Therefore, there is no normative method to measure the actual emission levels in real grids for the frequency range under study, from 20 kHz to 500 kHz [42].

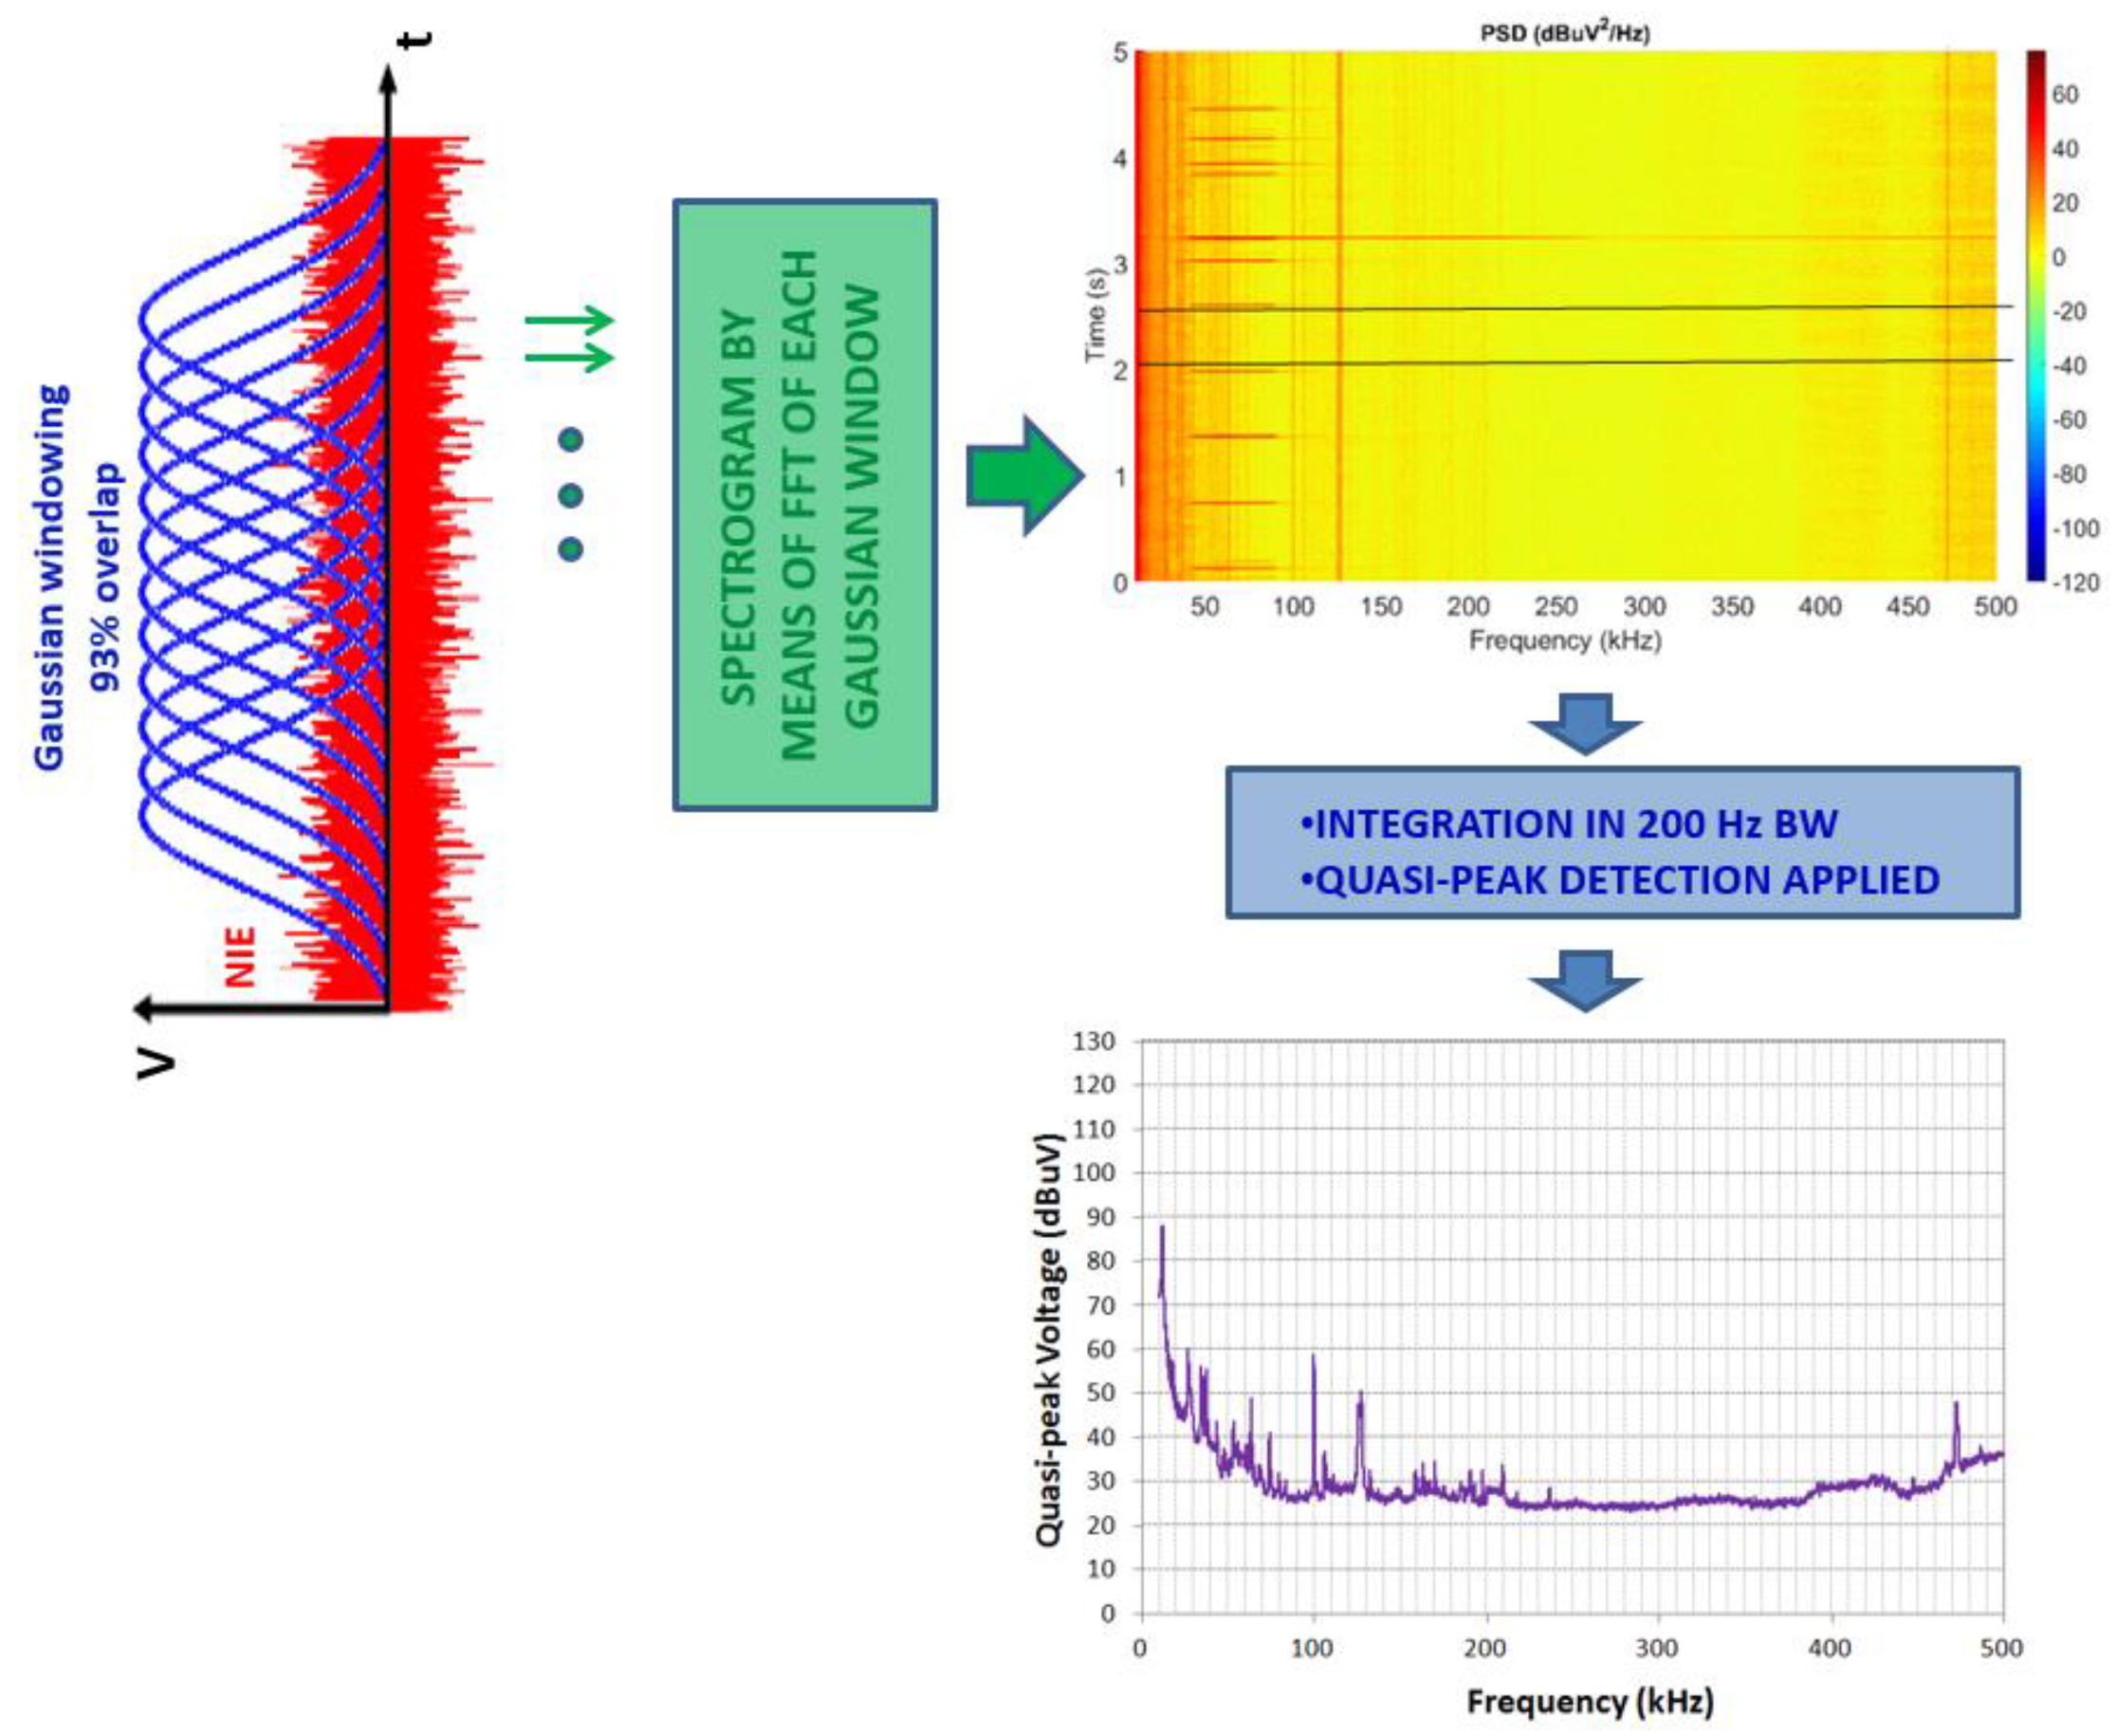
4.1. Measurement Methodology and Data Processing

The measurement method used in the field trials has been developed by the University of the Basque Country (UPV/EHU), for the characterization of the noise and NIE that are present at the LV electrical grid. The method is composed by, first, the recording of voltage values in a specific point of the grid, and second, the signal processing of the recorded values, in order to obtain a characterization of NIE in time and frequency domains [43]. The measurement method is optimized for the frequency range used by the different technologies of NB-PLC: 20 kHz to 500 kHz. This method has been presented in the CENELEC SC 205A Working Group 11 [43].
The measurement system is based on high-resolution measurements, both in time and in amplitude, of the voltage values for frequencies up to 500 kHz. It is composed of the following equipment (see Figure 1):
  • A voltage probe that connects the measurement system to the grid, provides galvanic isolation and protects the system against high level transitions.
  • A high-resolution oscilloscope (Picoscope series 5000) that samples the noise and NIE levels with high accuracy (16 bits resolution in magnitude) and high sampling frequency (8.92 MHz).
  • A laptop to configure the oscilloscope, automatize the measurements, and record the signals registered by the oscilloscope.
The measurement recordings are then post–processed to obtain the NIE values in time and frequency domains, by applying the CISPR specifications defined for narrowband signals up to 150 kHz [44,45,46]. The data processing described in the CISPR documents is applied for the whole frequency range (20 kHz to 500 kHz).
The data processing defined in the CISPR specifications has been summarized schematically in Figure 2. It consists of, first, a time-windowing to the dataset, and then, a Fourier analysis [47]. The time-windowing recommended by CISPR 16 is oriented to achieve a Gaussian window with a 6 dB bandwidth of 200 Hz, and a time overlap higher than 75%, in order to ensure that fast impulsive noises are removed or highly attenuated in this step [44,45,46]. According to this recommendation, in this measurement system, a specific 10 ms Gaussian window in time, with a time shift of 0.7 ms, which results on an overlap of 93%, is applied in order to obtain a 200 Hz 6 dB bandwidth in the frequency domain, and to fulfill the CISPR requirement of 75% time overlap condition (see Figure 2).
Then, a spectrogram is obtained by applying FFTs to the data resulting from the time-windowing. The frequency step size of the FFT is selected to be a quarter of the required bandwidth (50 Hz), which requires 29733 points FFTs; this way, it fulfills the CISPR 16 condition of being less than the half of the required values of the 6 dB bandwidth (200 Hz). Once the spectrogram is obtained, a digitally implemented quasi-peak detector is applied in a 200 Hz resolution bandwidth, during the specified measuring time. The required charge and discharge time constants and the meter time constants for quasi-peak detector are digitally implemented by means of infinite impulse response (IIR) filters and the measuring time can be selected by the user.
The system noise floor is limited mainly by the quantization error of the oscilloscope. The measurement system applies an adaptive dynamic range to the amplitude of the registered levels. Therefore, the system noise floor is not constant and it depends on both the adaptive dynamic range and the number of bits used in the sampling process. Considering that the sampling resolution of the oscilloscope is 16 bits/sample, and that the dynamic ranges used in most of the measurements are ±2 V, ±1 V and ±0.5 V, the system noise floor levels of the measurement system are 25 dBμV, 20 dBμV and 16 dBμV, respectively. Only a few measurements required a dynamic range of ±5 V and ±10 V, due to the presence of noises in the grid of high amplitude, which is linked to a noise floor level of 36 dBμV and 40 dBμV, respectively.
The above-mentioned procedure leads to a resolution of the measurement system of 10 ms in time and 200 Hz in frequency, with a time step of 0.7 ms and a frequency-step size of 50 Hz.
In the trials, measurement intervals of 5 s were recorded, in order to characterize the time-variability of the emissions but the measuring time to be introduced in the designed software was selected in order to be free of NB-PLC transmissions, in order to avoid that the communication signals distort the results and to ensure that only non-intentional emissions were considered [4,43]. These NB-PLC transmissions can easily be detected in the spectrograms. For example, all the horizontal red-lines between 42 kHz and 89 KHz in the spectrogram of Figure 2 correspond to PRIME v1.3.6 signal bursts and the selected measuring time for this example would be the one between the black horizontal lines in the spectrogram.

4.2. Types of Results

Three types of results were calculated for each recorded dataset:
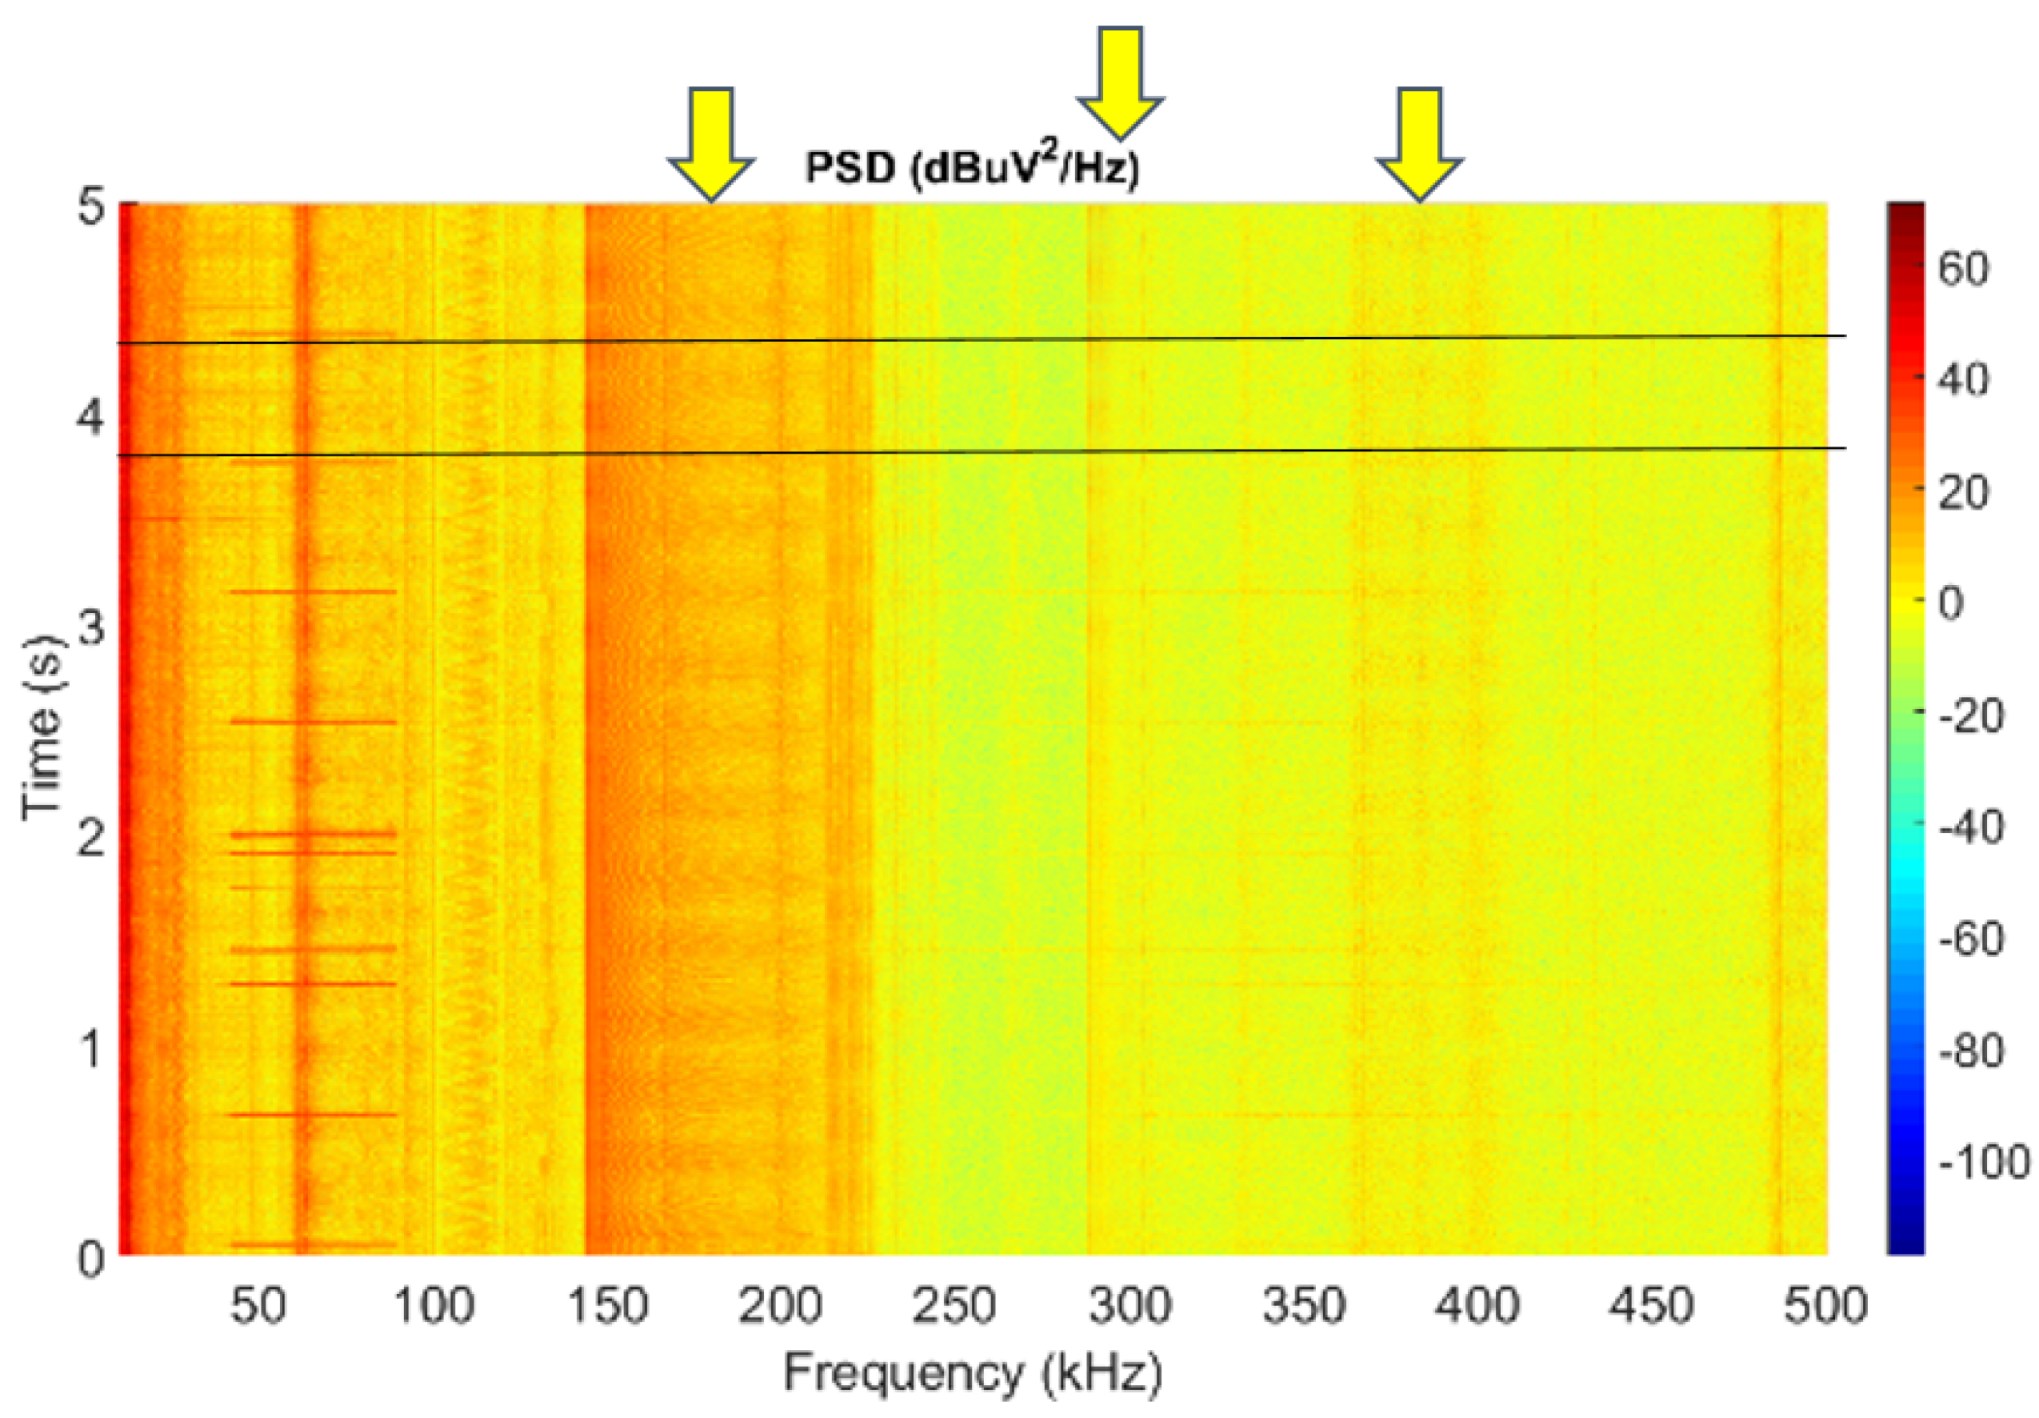
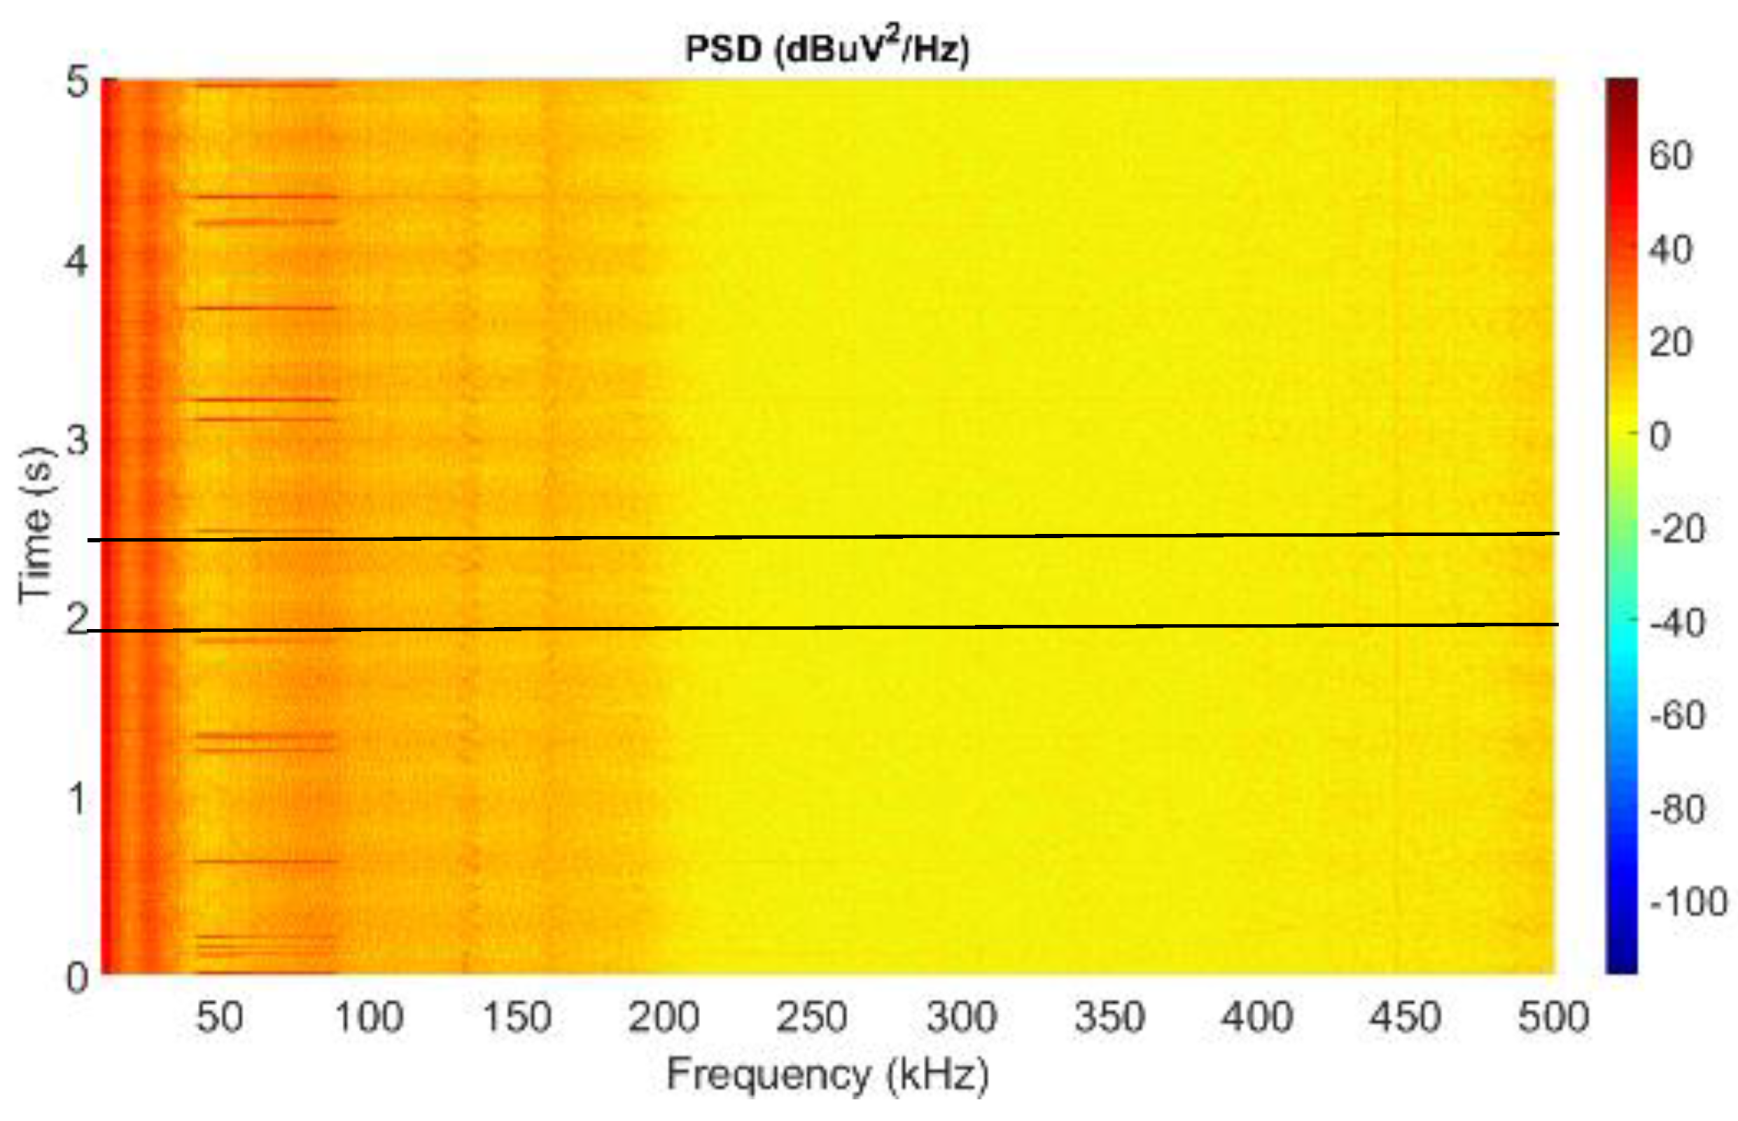
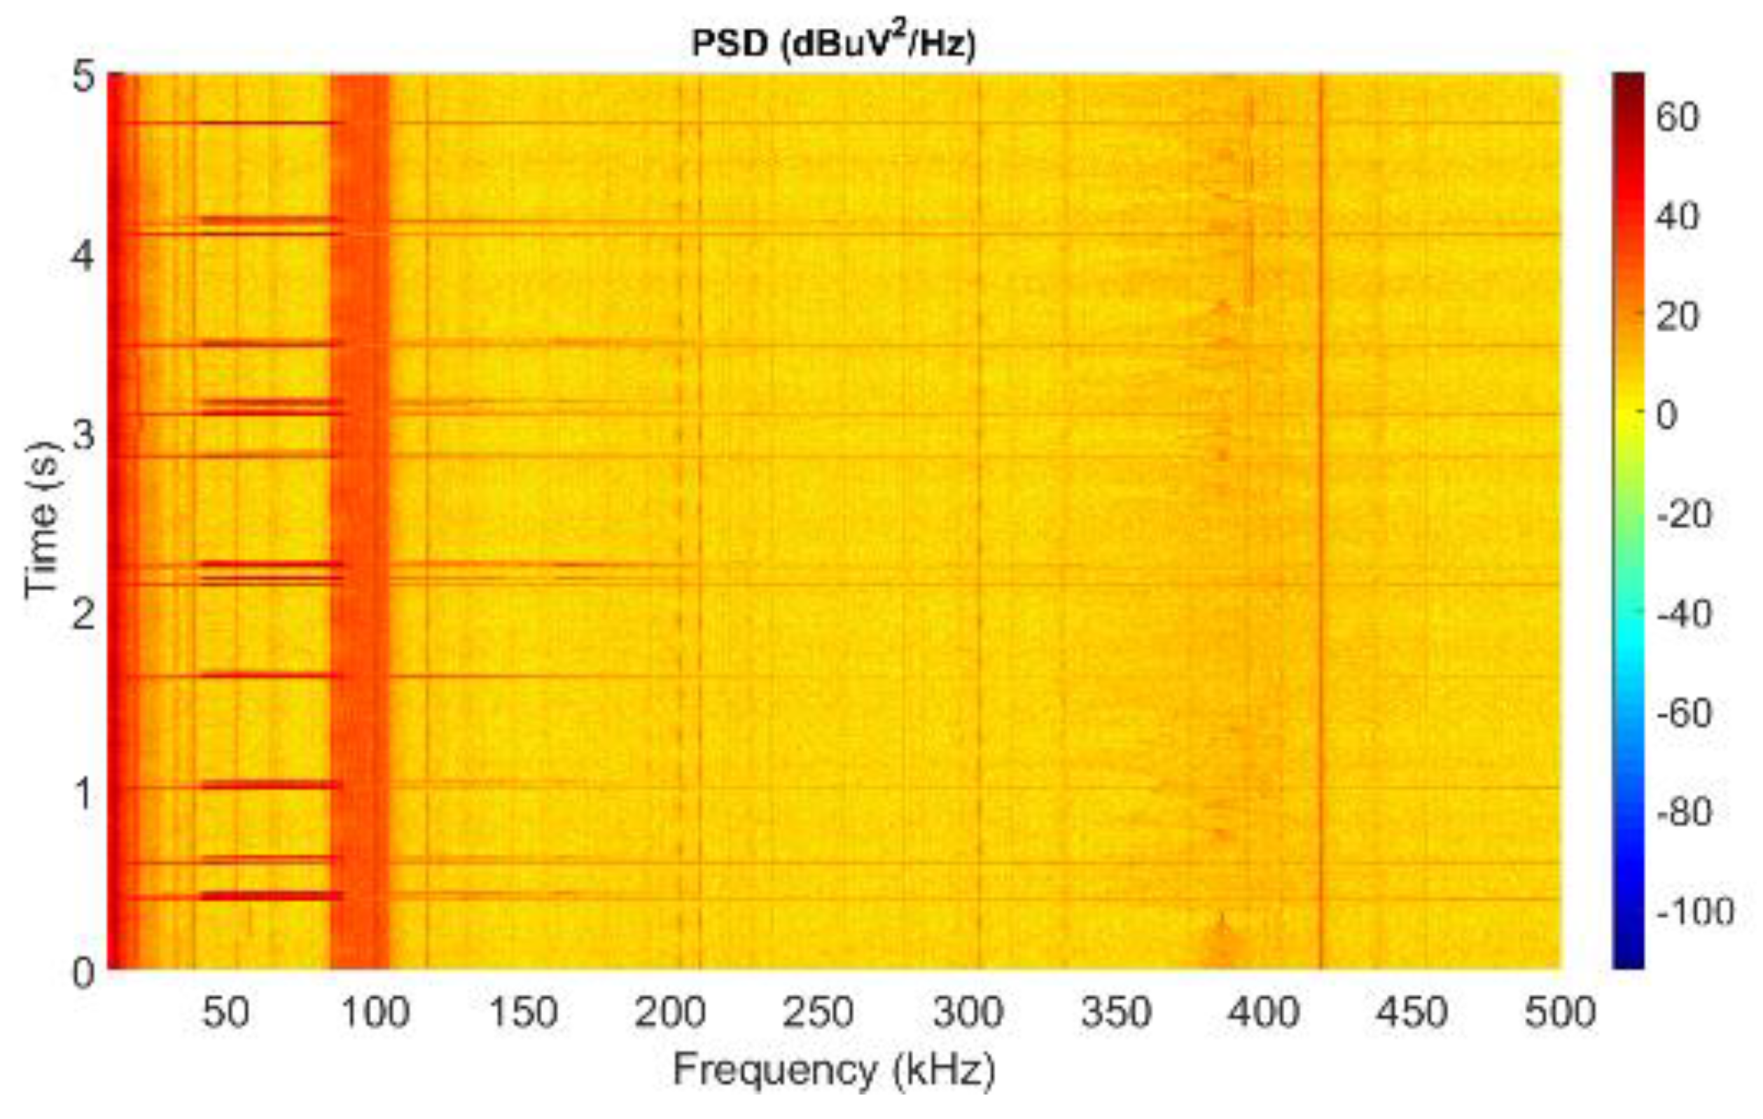
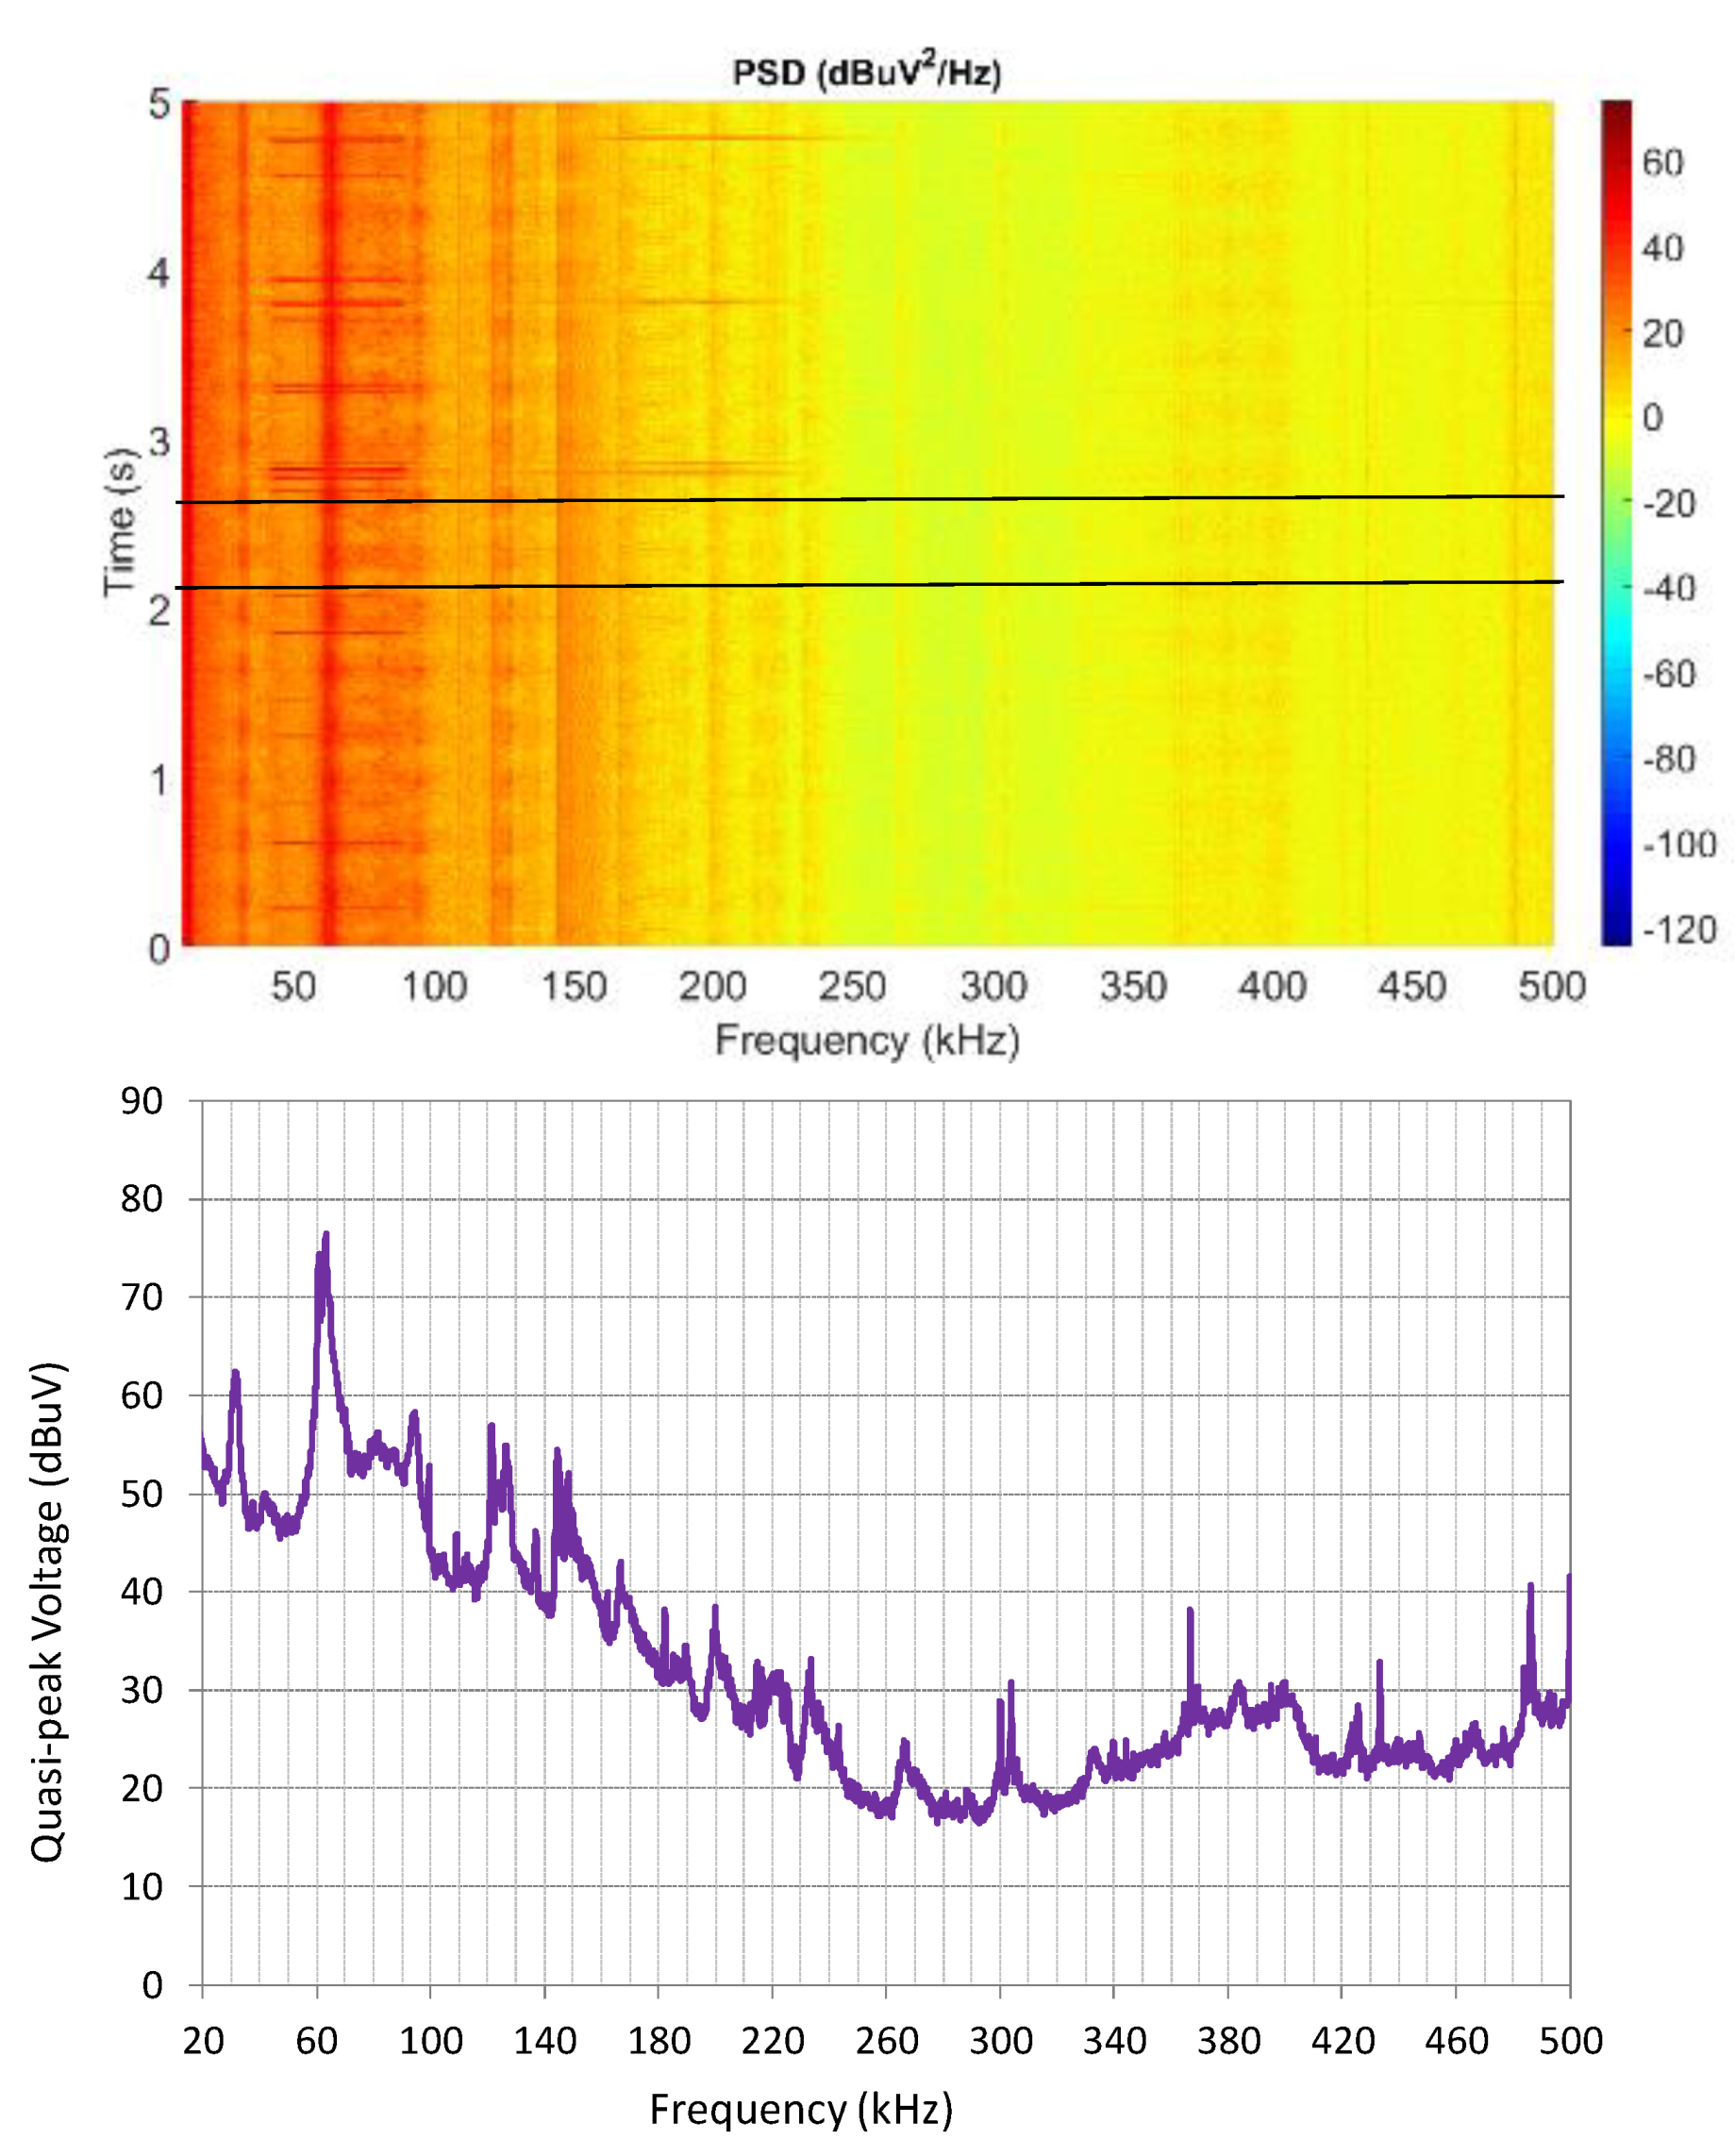
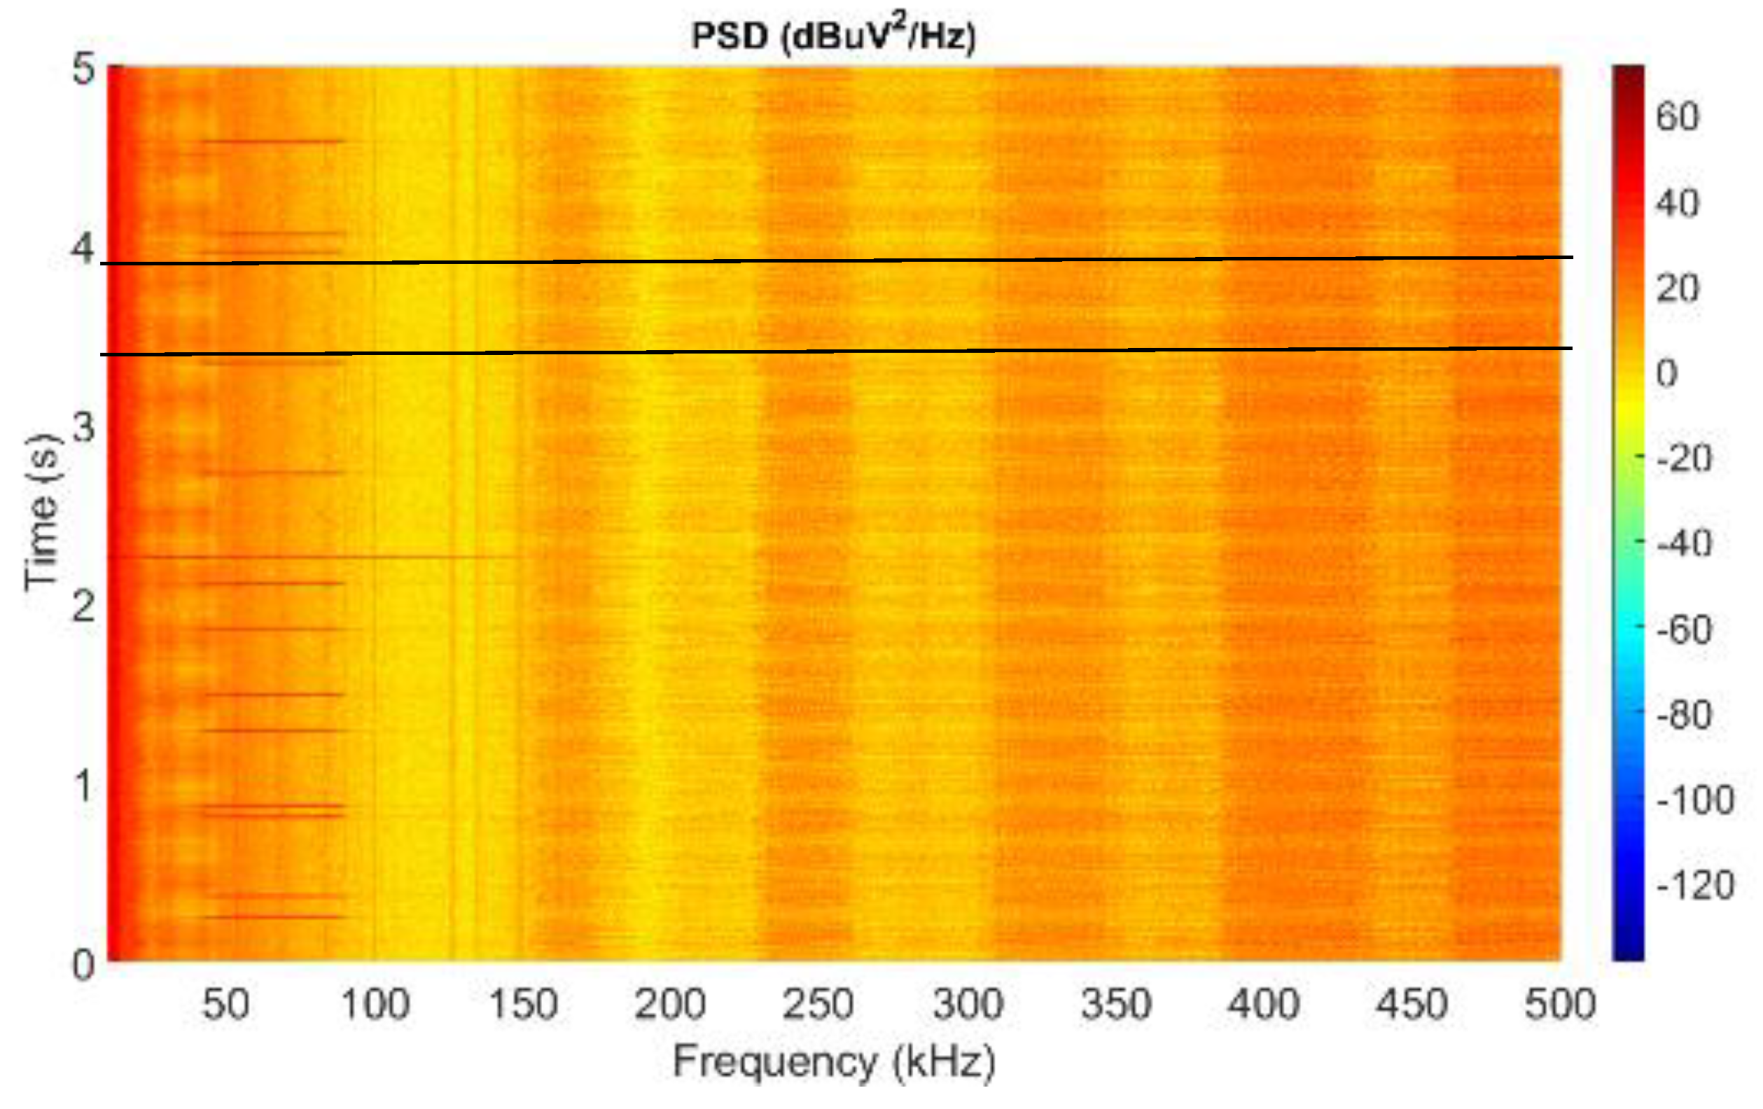
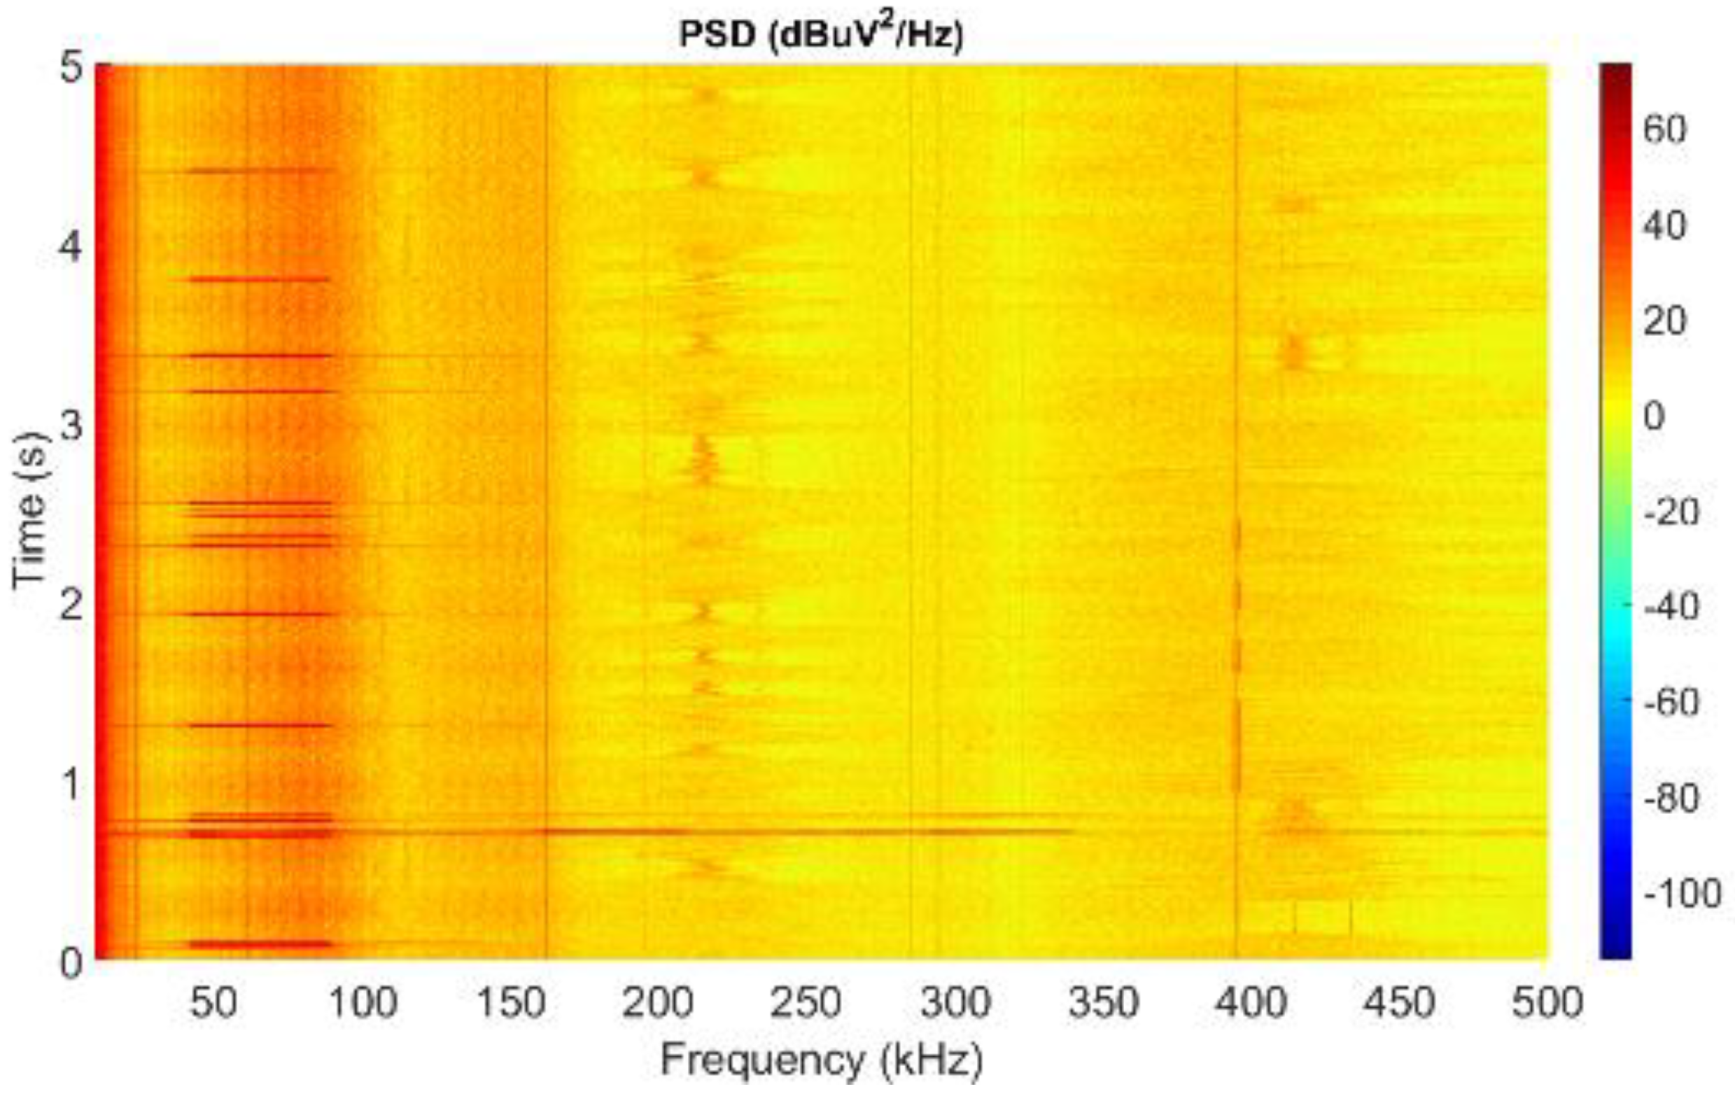
  • Spectrograms showing the evolution in time of the power spectral density (PSD) values of NIE were calculated and represented in a color scale, all of them for a frequency range of 20–500 kHz and a time period of 5 s. The spectrograms allow the characterization of both spectral and time behavior of NIE at each measurement point.
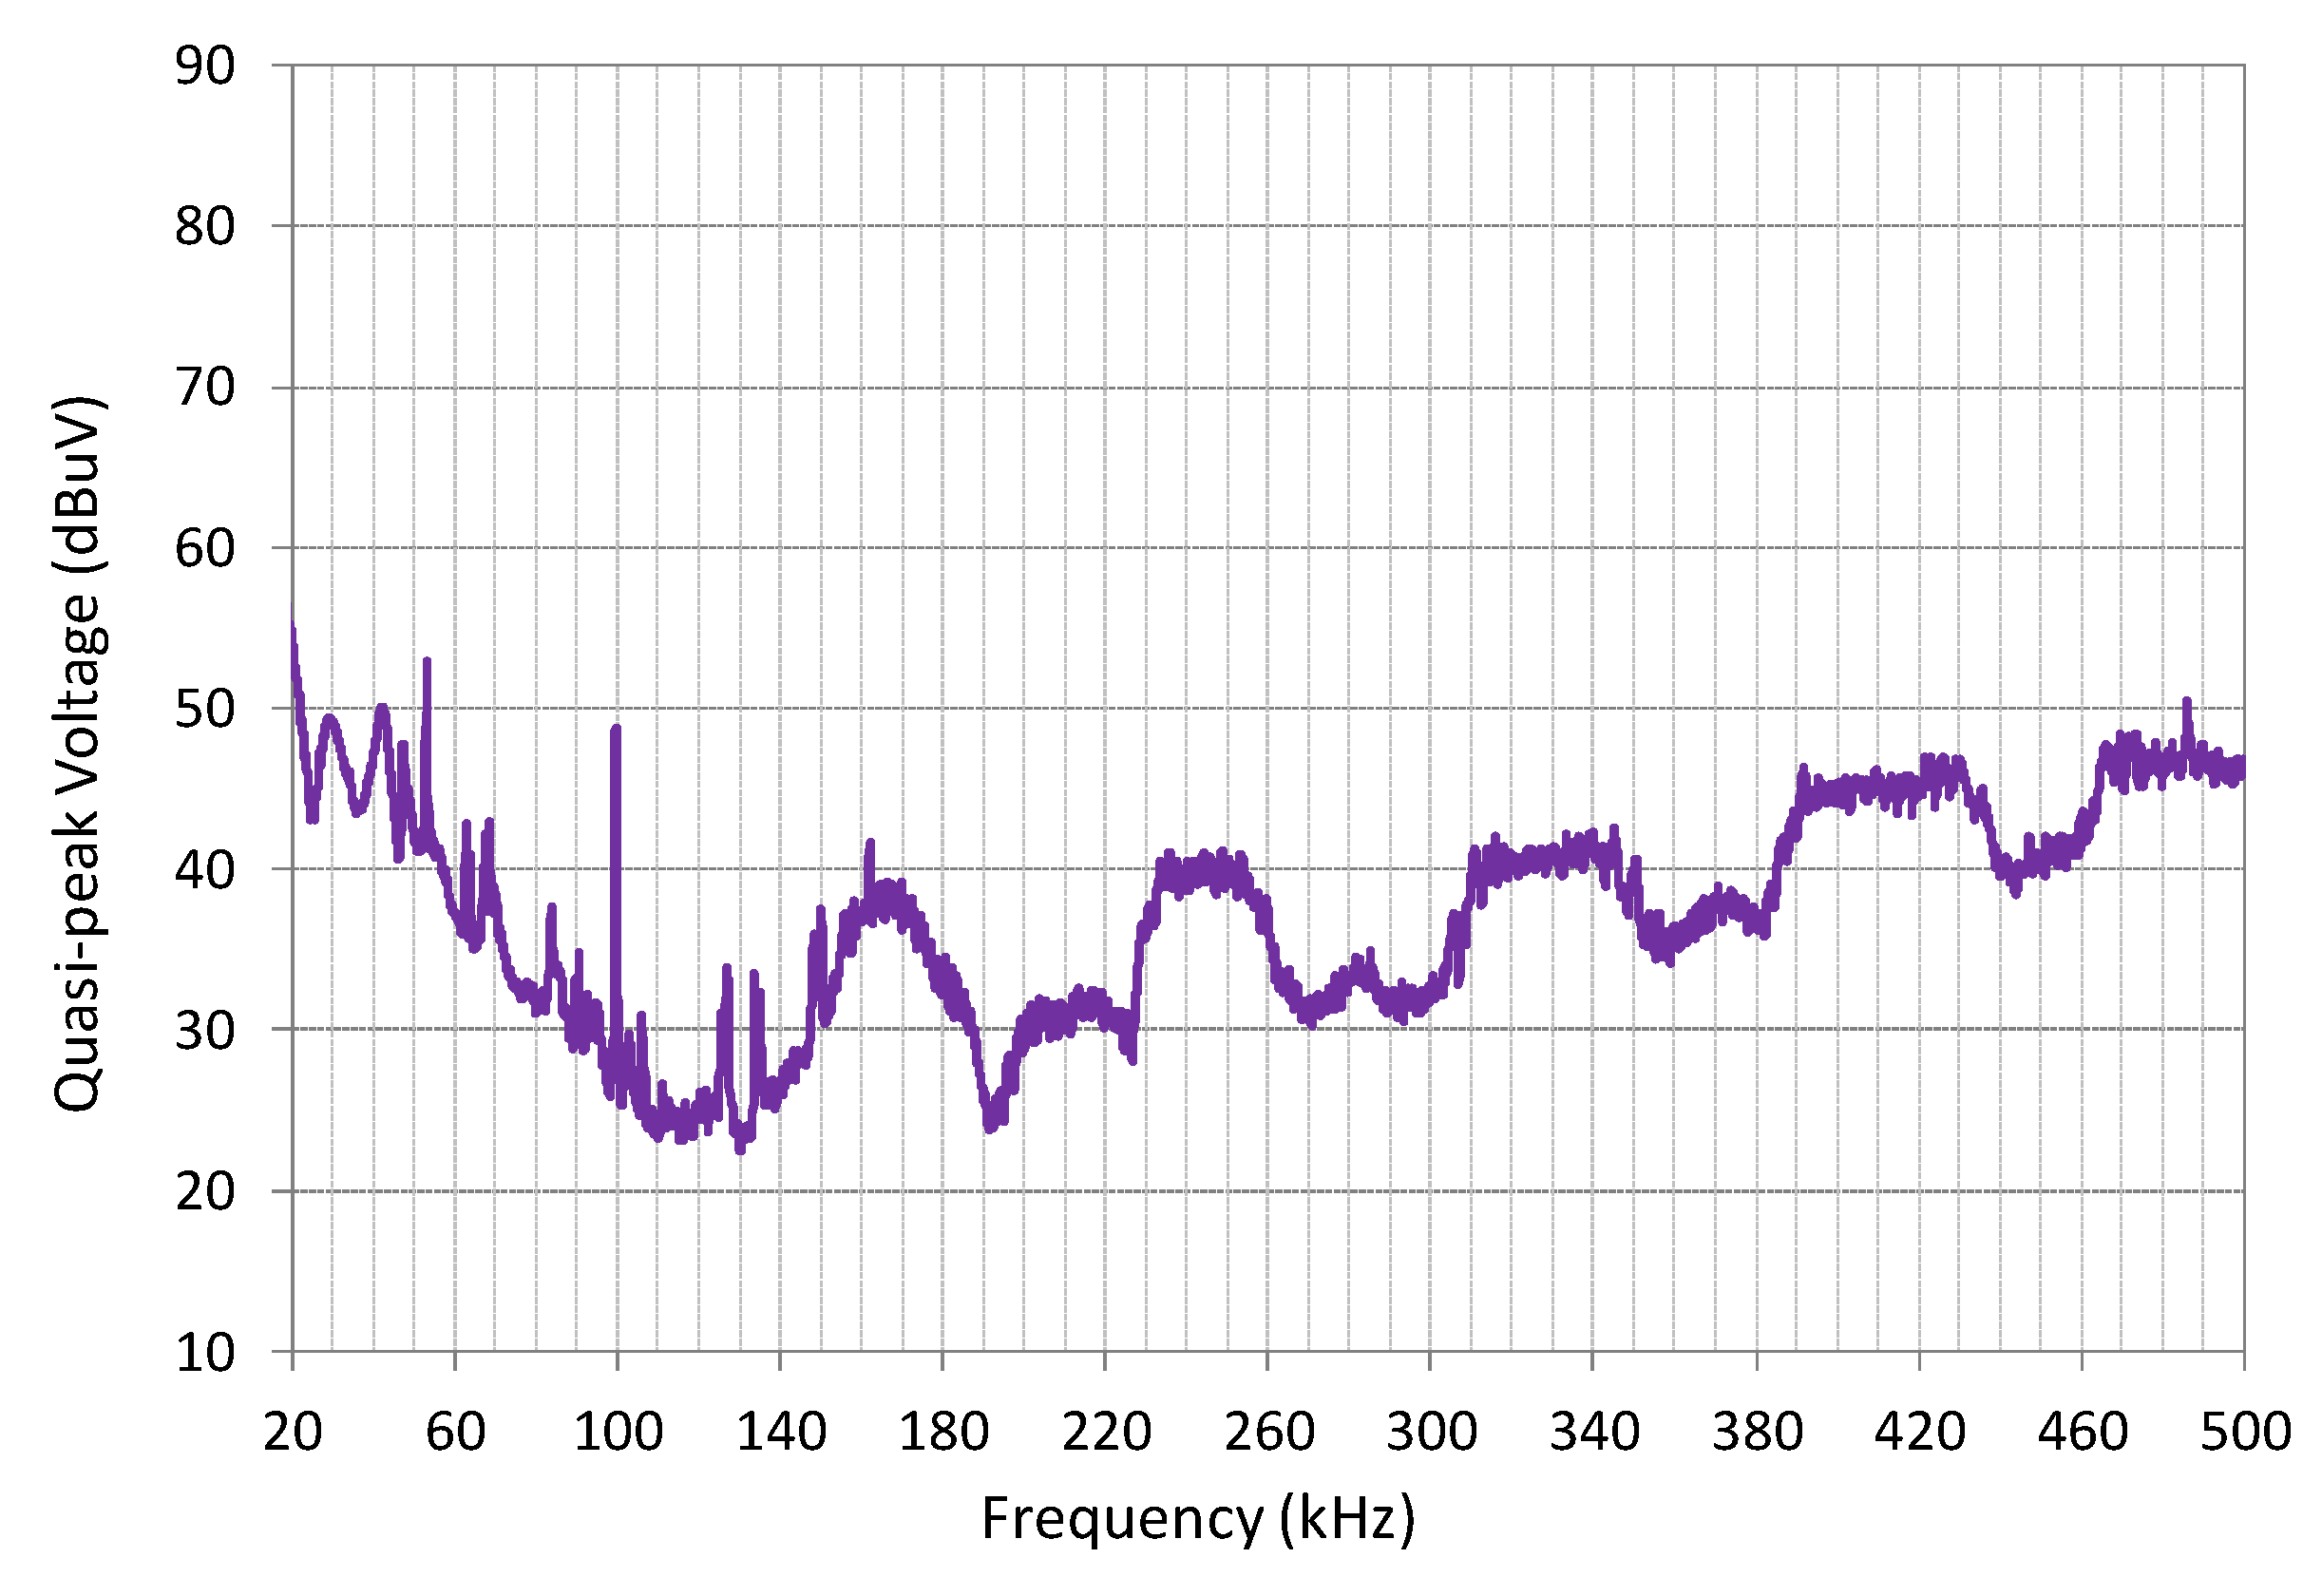
  • The quasi-peak amplitude of NIE, according to the CISPR 16 assessment methodology (see Section 4.1), provides a clear representation of the spectral shape and the relevance of different types of NIE. In order to avoid NB-PLC signals in the data processing, the quasi-peak amplitude of NIE is calculated for a time interval of 0.5 s (the time interval selected for this type of graph is indicated in the corresponding spectrogram by means of two black lines, as shown in Figure 3).
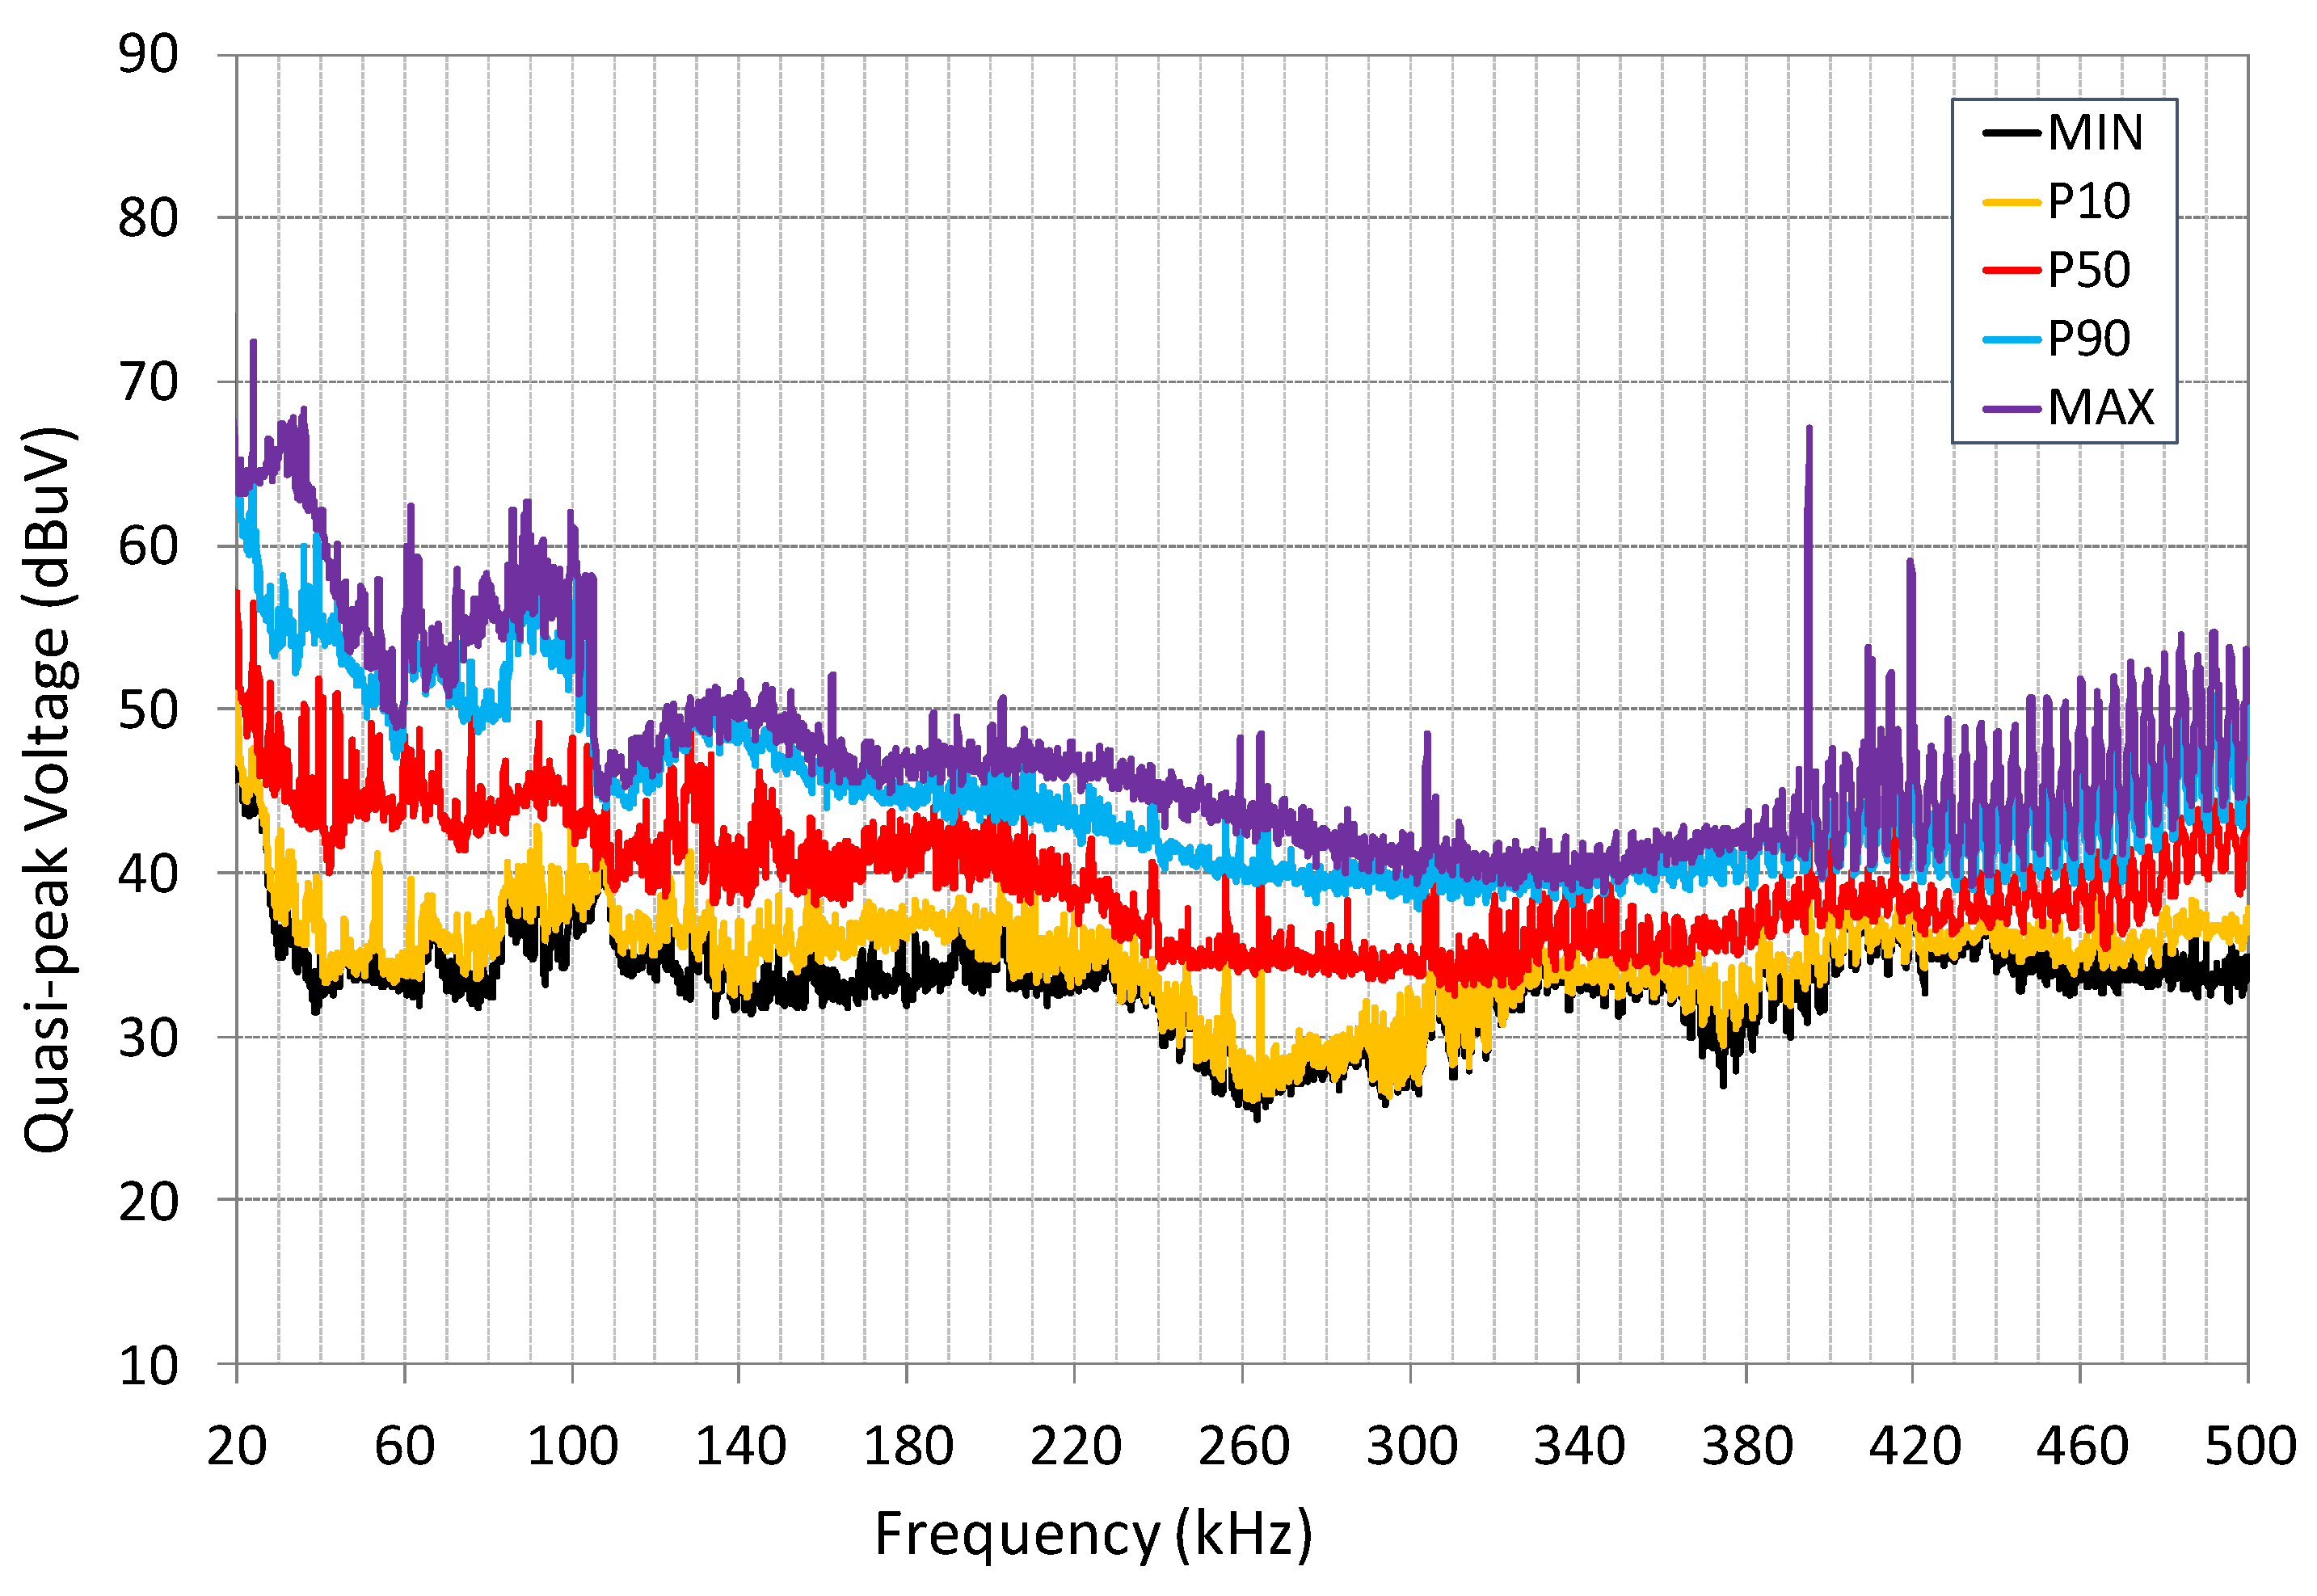
  • In order to compare the level of NIE for different scenarios and situations, the datasets are classified and compiled by groups. For each group, the values are statistically evaluated by means of a representative set of percentiles: 0th (minimum), 10th, 50th (median), 90th and 100th (maximum), and then, the results of different groups are compared in Section 6.4.
  • The combined analysis of spectrograms and the CISPR 16 graphs allows the identification and characterization of different types of NIE, both in time and frequency domains. An ad hoc software developed by the authors provides all the aforementioned types of results.

4.3. Analysis of Results

The obtained results have been analyzed according to different classifications or criteria:
  • First, emissions have been classified according to their spectral components.
  • Second, emissions have been analyzed as a function of the frequency range where they occur (below or above 150 kHz).
  • Third, the time variability of the recorded NIE is evaluated, by means of the spectrograms of the signals registered in all the measurement points, since this type of graphs shows in detail the time-variability of the amplitude for the whole frequency range.
  • Finally, NIE are classified as a function of the scenario where they have been recorded.

5. Planning of the Empirical Trials

5.1. Measurement Scenarios

The field trials were conducted in rural and urban scenarios of the LV distribution grid in Spain. In particular, several measurement points in two urban areas with buildings of 4–6 floors, and two rural areas with very low density of detached houses, were selected by the DSO Iberdrola as illustrative examples of rural and urban grid topologies in Spain.
The grid topology in the urban areas is an underground tri-phasic distribution, composed of a high number of short branches that cover a limited area around the transformer station. In the rural areas, the grid distribution is aerial, tri-phasic or mono-phasic, composed of a few branches connecting a low number of detached houses, separated several tens of meters. All the selected scenarios include a transformer substation and the corresponding downstream last-mile distribution grid to the homes.

5.2. Measurement Campaign

Measurement points were located both at the transformer substations and at a set of access points within the distribution grid between the substations and the homes. In all the measurement locations with tri-phasic grid distribution, measurements for each of the three phases were developed.
In total, the measurement campaign for the characterization of NIE and grid-impedance [48] was composed of 23 measurement locations (14 in urban scenarios and 9 in rural areas), most of them in tri-phasic distribution (19 tri-phasic, 4 mono-phasic locations), with more than one measurement in some locations, in different moments, which results in more than 70 measurements. A brief description of the measured locations for the NIE characterization has been included in Table 1 and additional details can be found in [48]:
The measurement campaign was developed with the collaboration of authorized staff, who was in charge of connecting the measurement system to the selected points in the LV distribution grid.

6. Results and Analysis

6.1. Types of NIE Registered in the Field Trials

Different types of NIE have been observed in the analysis of the measurements. They have been classified and the most representative samples have been selected for this section. It should be noted that all the figures are shown with the same horizontal and vertical scales, for an easier comparison of the results.

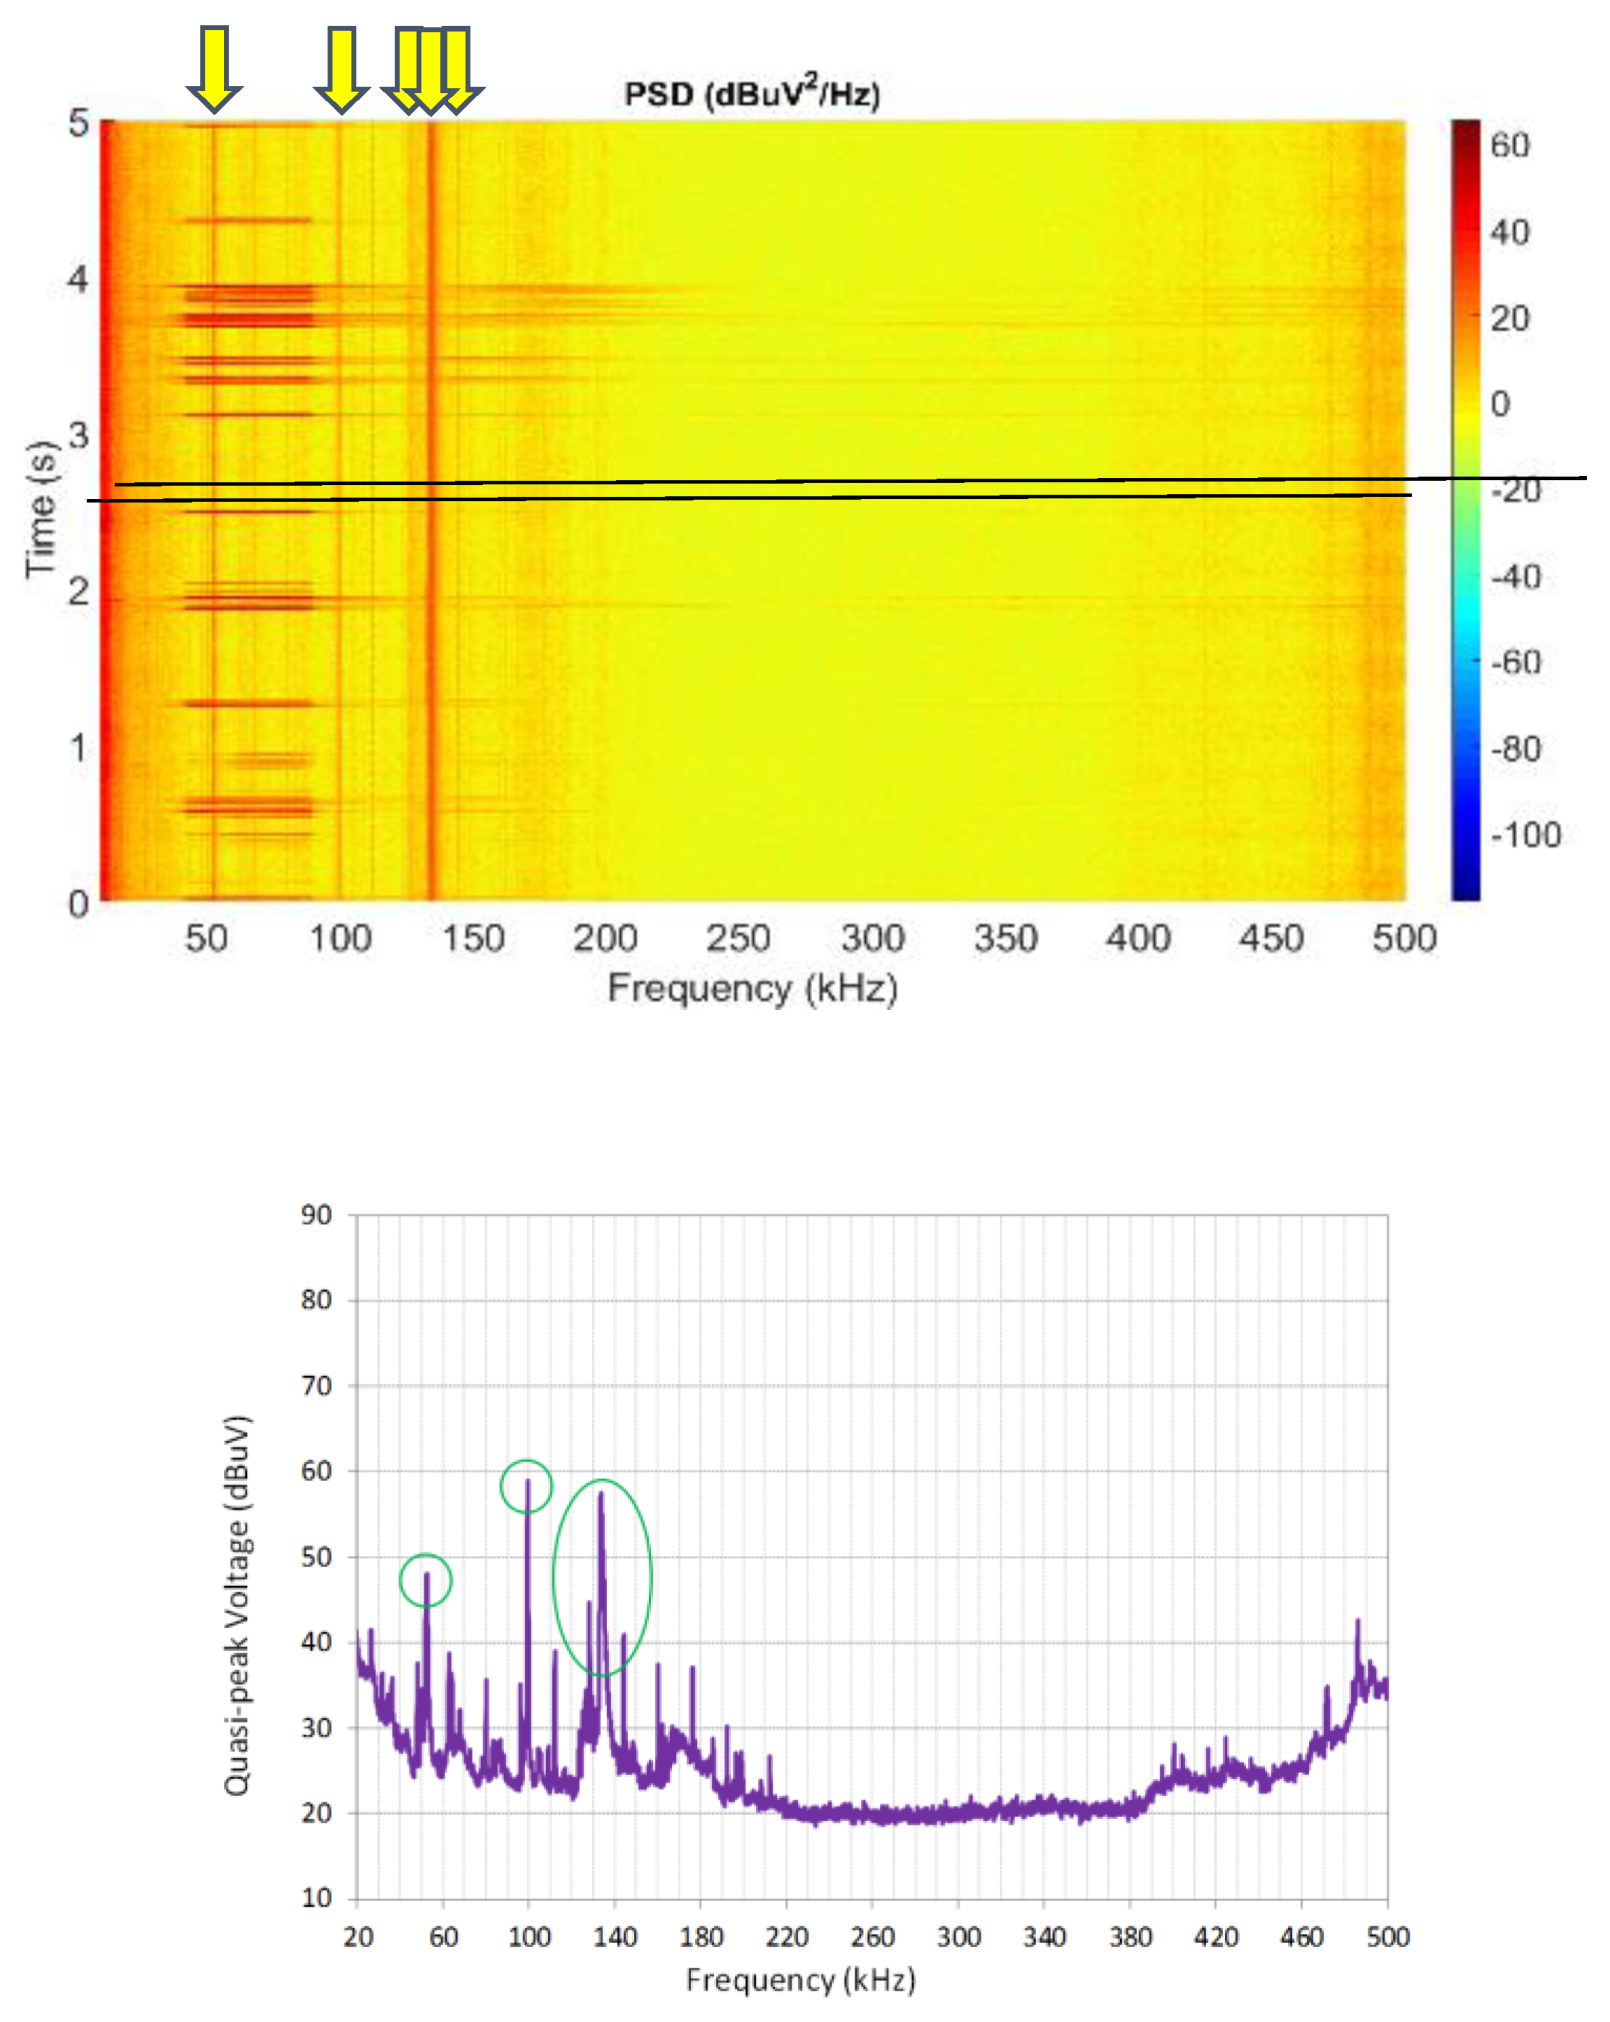
6.1.1. Tonal Emissions

In many measurement points, NIE in the form of tonal emissions at different frequencies are observed. Results shown in Figure 3 and Figure 4 (marked with yellow arrows in the spectrogram and with green circles in the CISPR-16 graph) are clear examples of this type of emissions.
The presence of NIE in the shape of tonal emissions has been previously reported in the literature. In [49,50], some measurements of NIE from 9 to 150 kHz in low voltage grids in Europe, North America and Asia are presented. These measurements show components at discrete frequencies (e.g. 48 kHz, 64 kHz, 70 kHz). Some of these components are not persistent over several days. Therefore, they might originate from loads that are not permanently connected or have some control that switch them on and off intermittently. This type of tonal emissions is frequently due to power-electronic converters [1,51]. Tonal emissions (named as ‘narrowband interferers’) were also found in the field trails in the LV grid developed in [26].

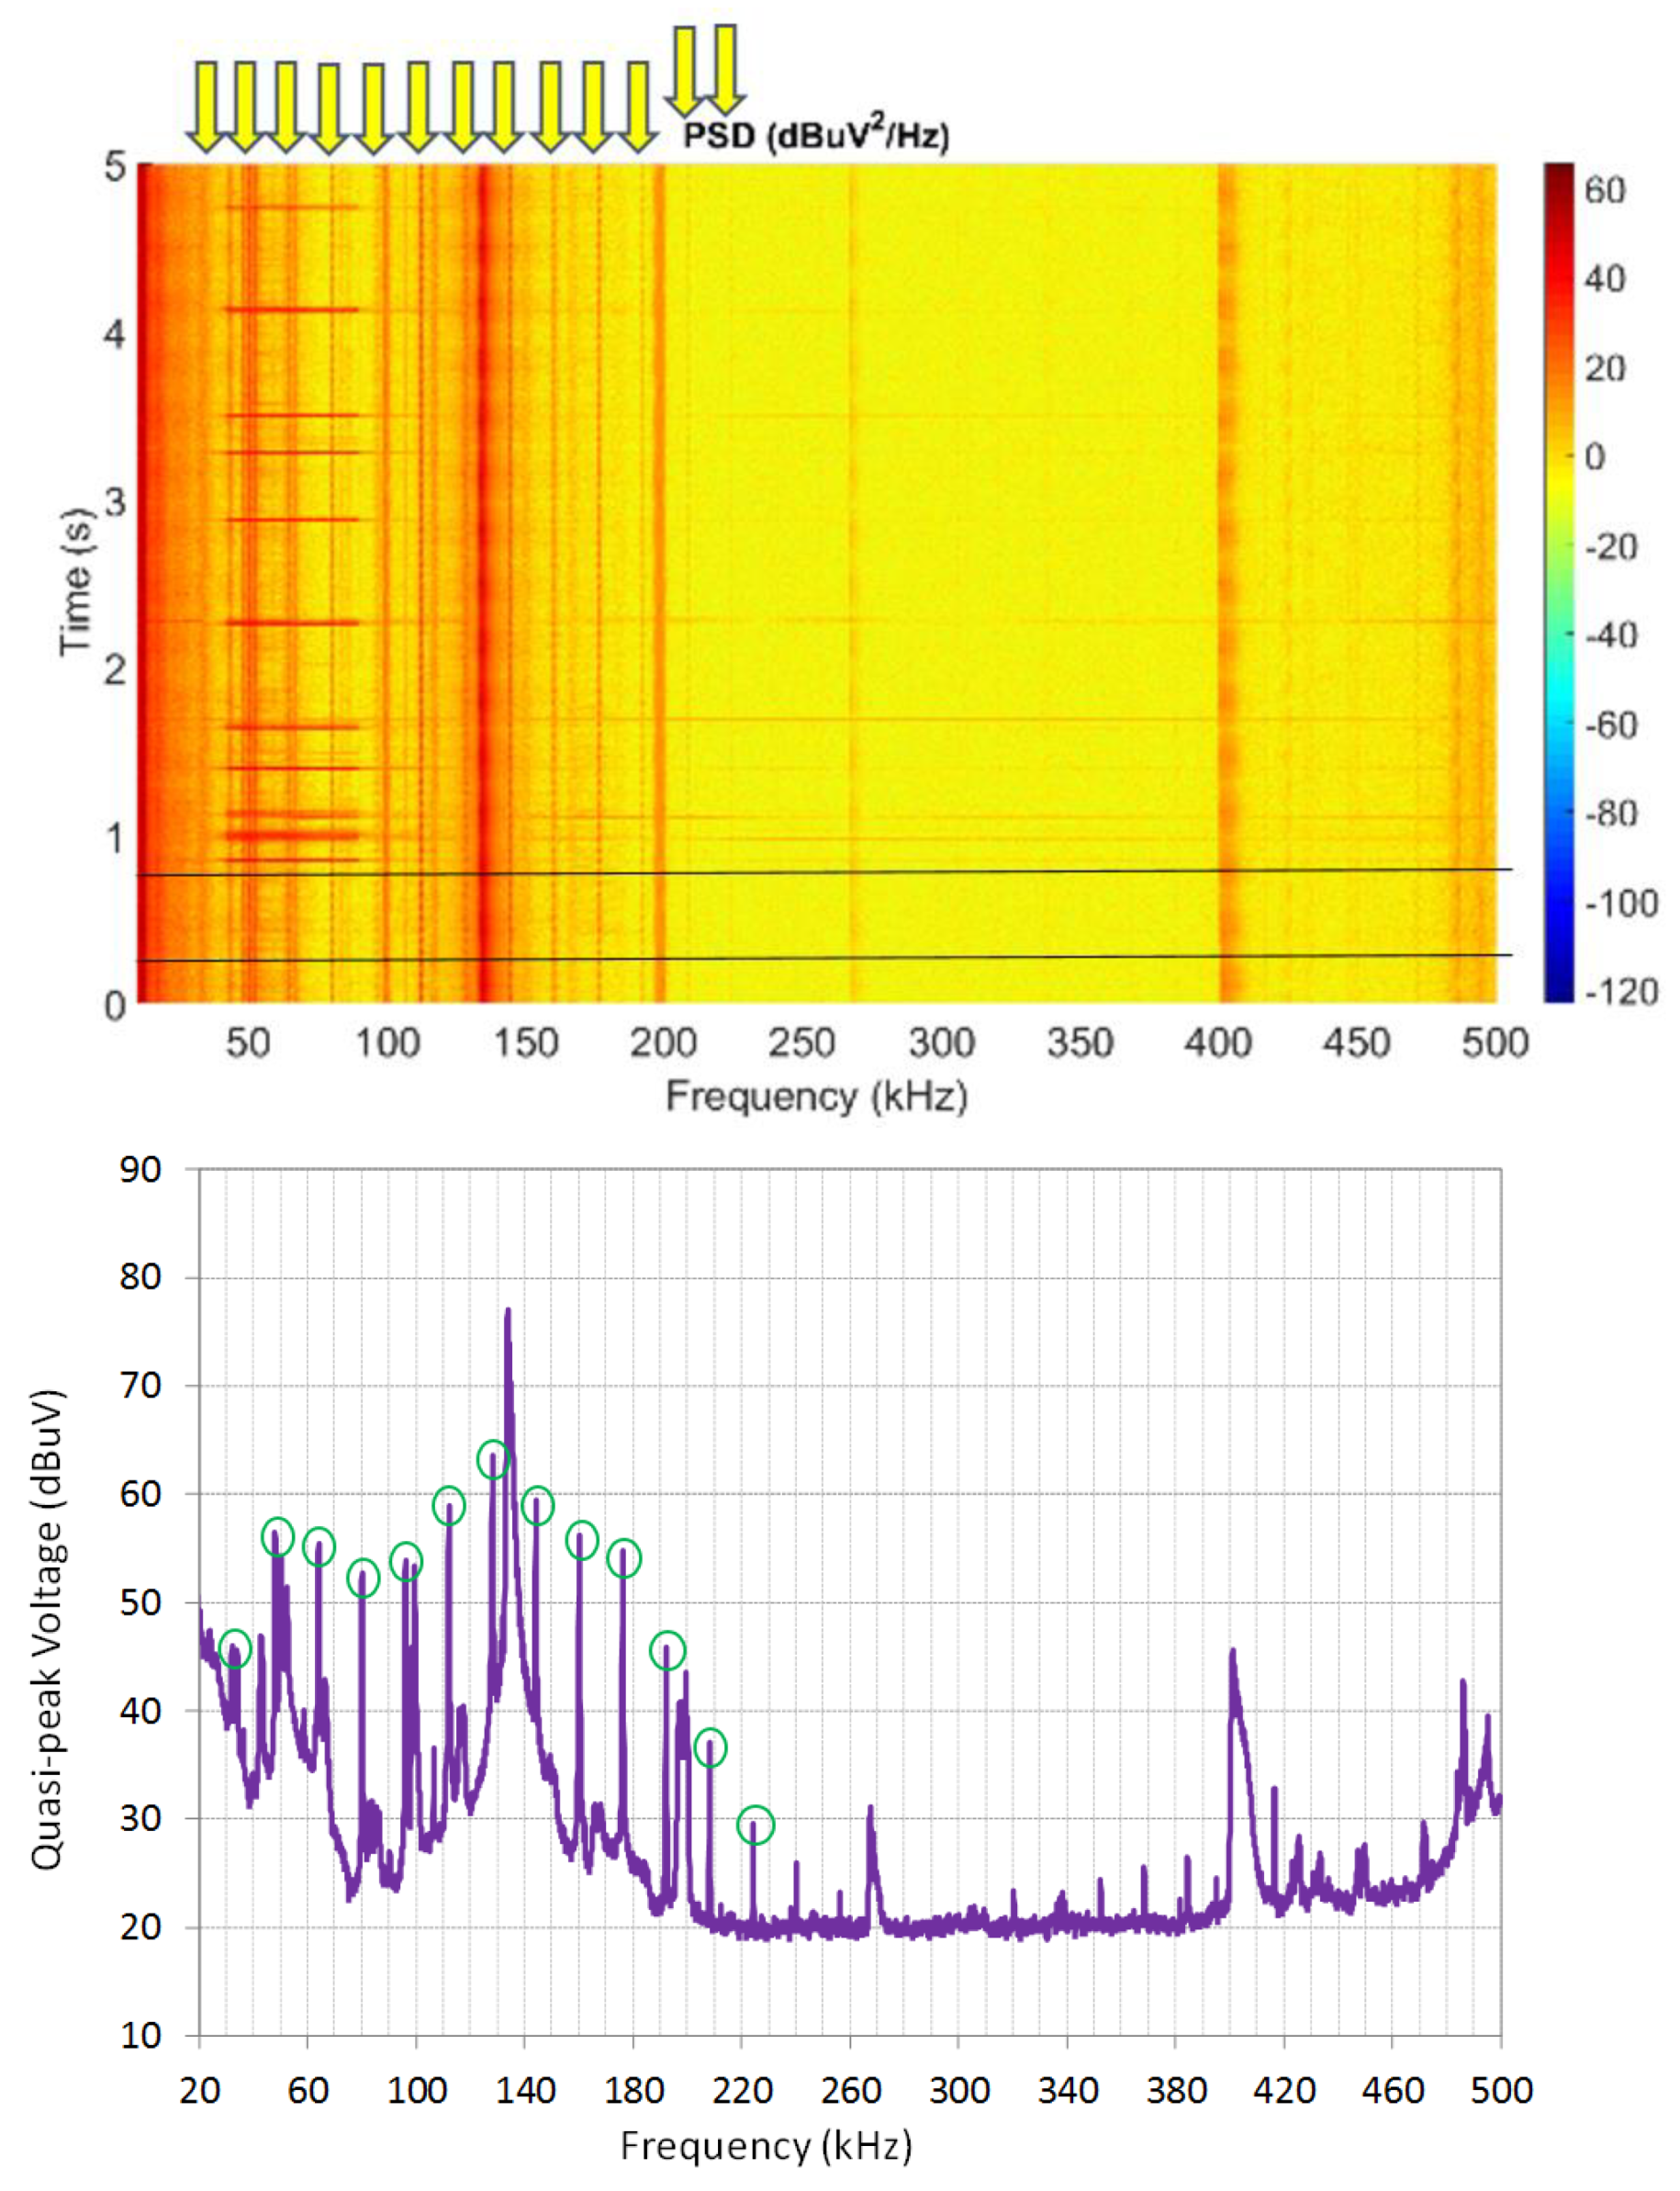
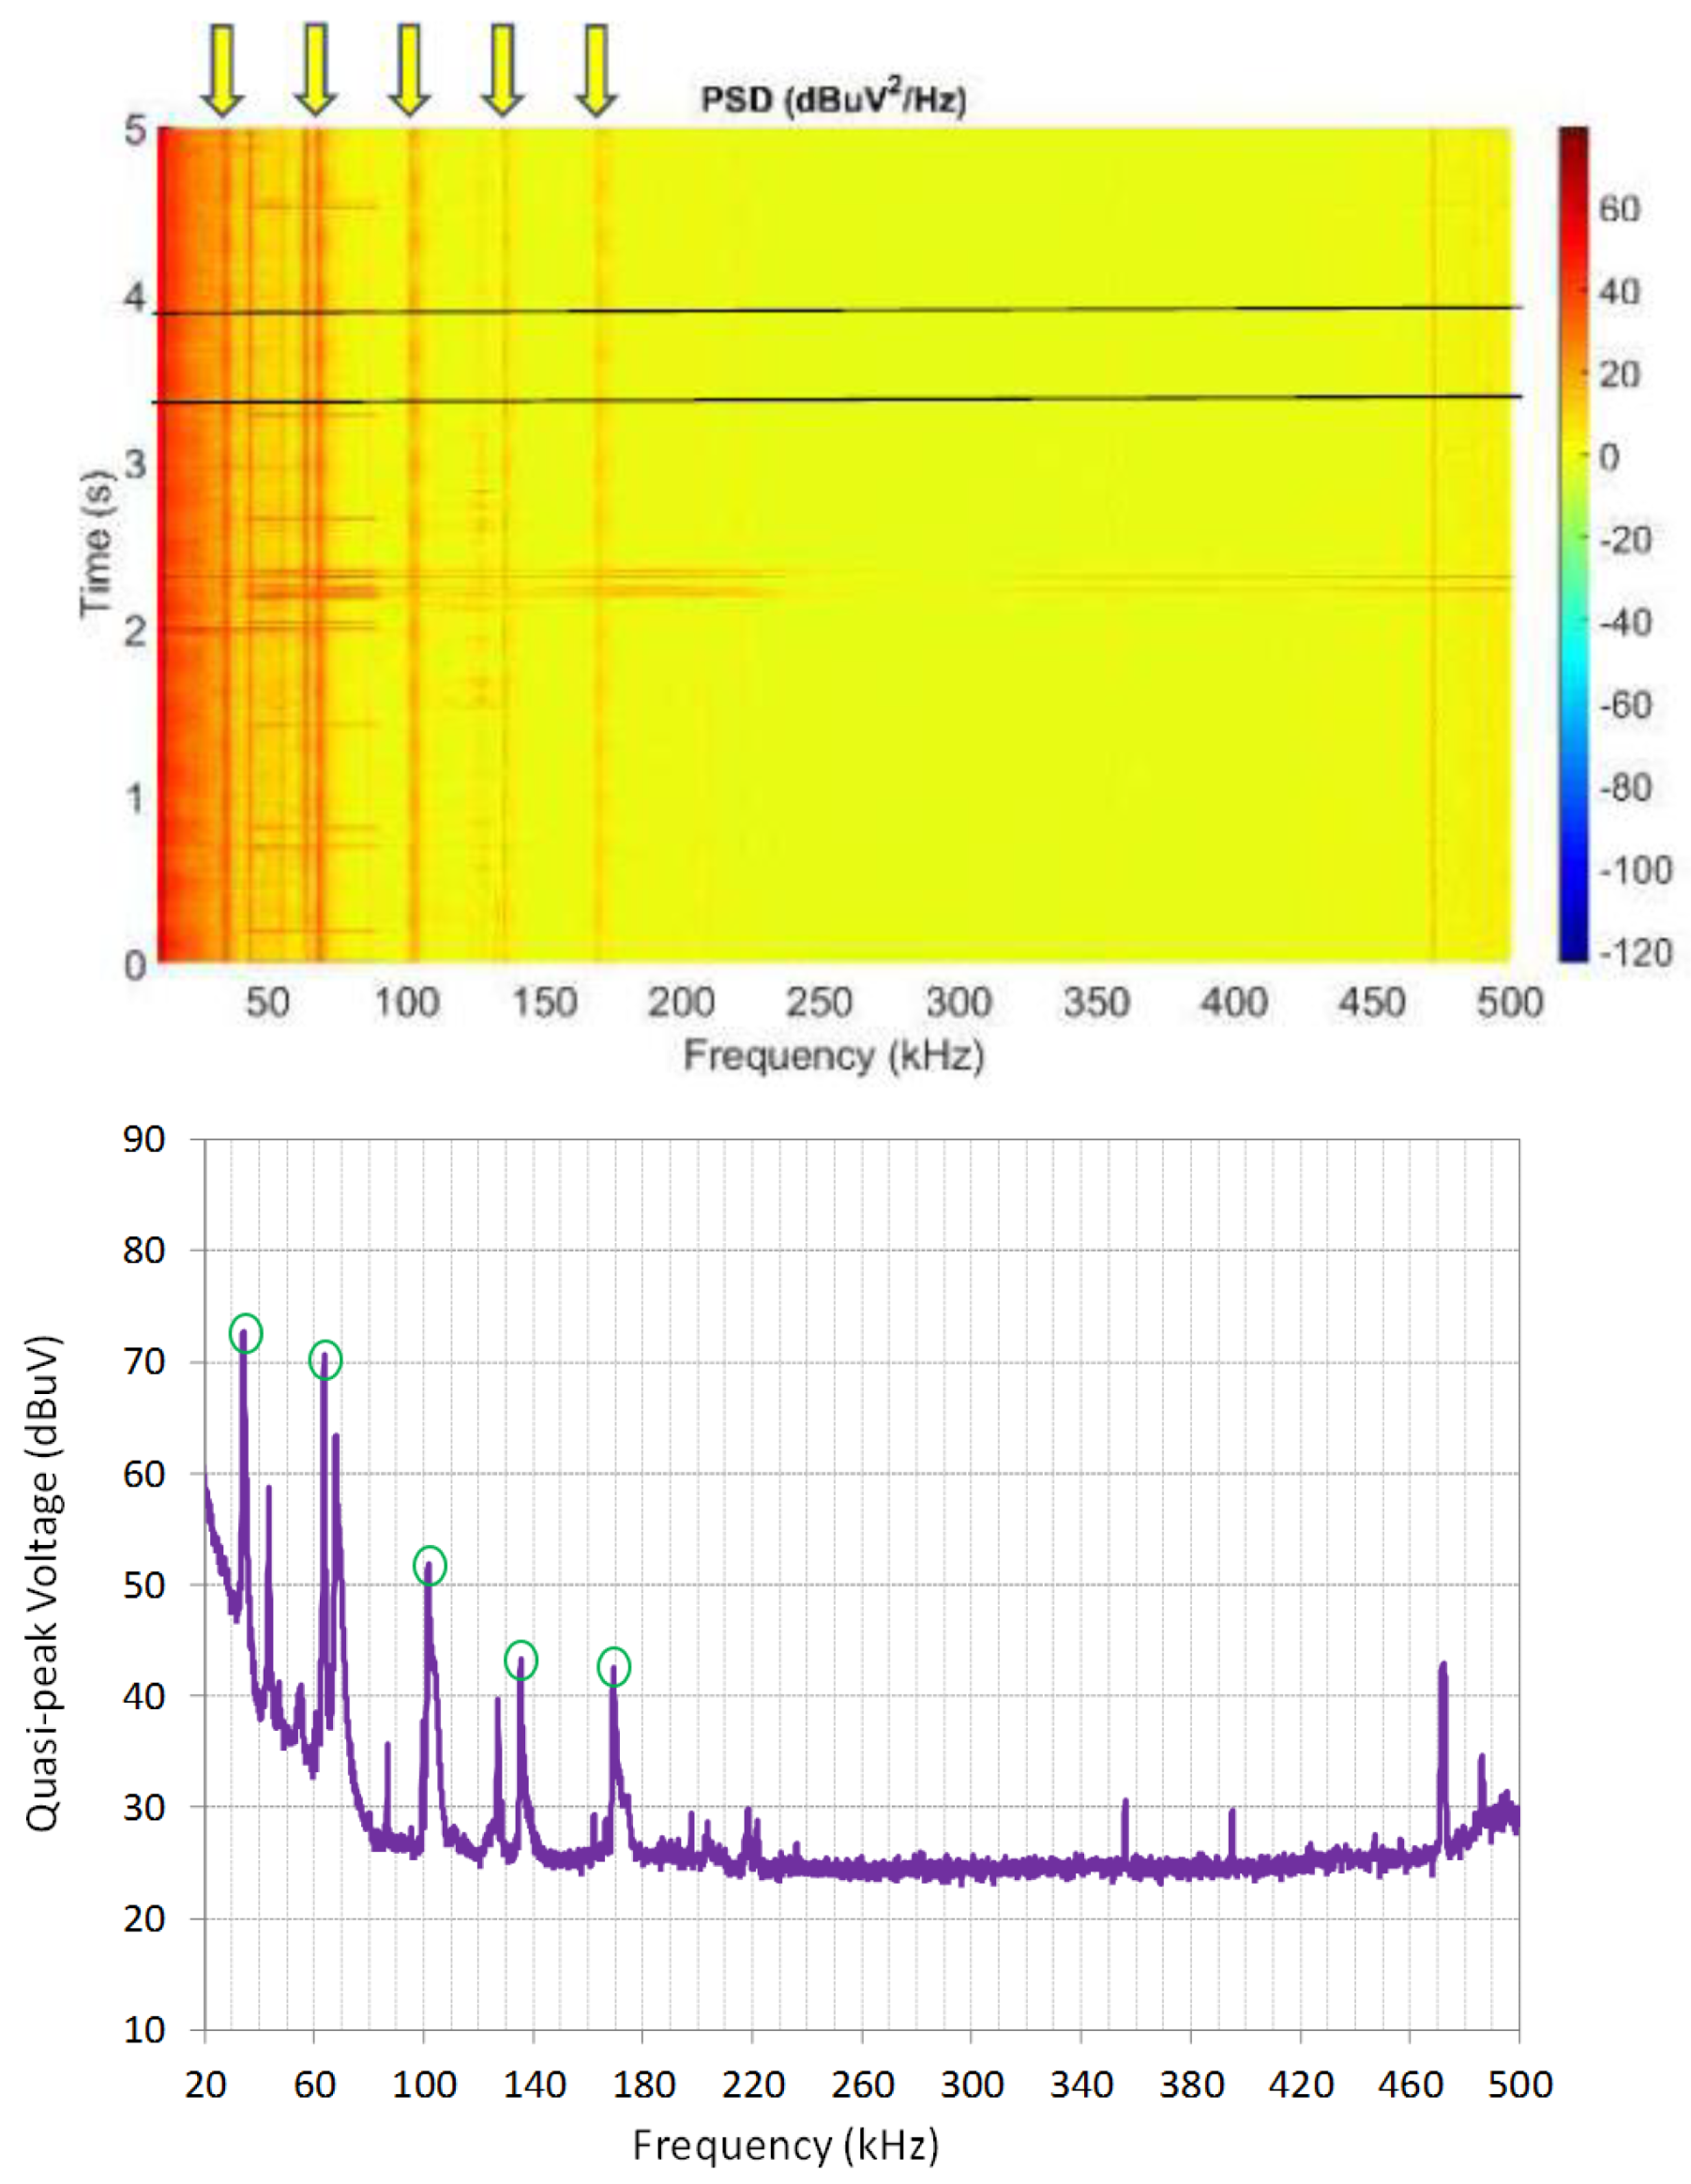
6.1.2. Harmonics of Tonal Emissions

Some of the tonal emissions that are present in the LV grid are caused by the non-linear behavior of inverters. In these cases, the spectral response is composed by a single tone located in the switching frequency of the inverter (in the range of tens of kHz), followed by a set of tonal emissions at frequencies multiple of the switching frequency, usually with an amplitude that decreases with frequency [1]. Observations of this type of emission have been related, for example, to PV inverters [3,4,52].
In the measurements developed in these trials, some cases of this type of high-frequency harmonics have been registered. As illustrative examples, Figure 5 shows harmonics at frequencies multiples of 16 kHz, while in Figure 6 multiples of 34 kHz can be observed.

6.1.3. Wide Band NIE

By contrast to the previous cases, there are also occurrences of NIE that occupy a relatively wide set of frequencies, as in the cases shown in Figure 7 and Figure 8, where NIE occupy bandwidths of 30 kHz to 50 kHz (Figure 7) or even up to 80 kHz (Figure 8).
Examples of wide band NIE are also reported in [53,54], where there is a component slightly above 40 kHz that disappears when the light is turned off at a shopping mall. Bursts of wide band NIE were also registered in measurements published in [26]. In [55], rather, broadband spectrums from 2 kHz to 150 kHz are obtained for light-emitting diode (LED) street lamps using active power factor correction and high-pressure sodium lamps with electronic ballasts. In [7], measurements of two EV chargers in laboratory conditions showed wide-band disturbances between 9 kHz and 65 kHz and between 9 kHz and 100 kHz, respectively.

6.1.4. NIE in the Form of Colored Noise

Emissions in the form of colored noise have been also registered in the field measurements. They consist of wide band noise of variable amplitude with frequency. This type of emission may be generated by different types of engines and electronic devices [3,4,15]. Some representative examples of these recordings are shown in Figure 9 (mainly for frequencies up to 200 kHz) and in Figure 10 (with high noise levels for the whole frequency range up to 500 kHz).
This type of noise might be the result of the addition of multiple noise sources or might come from a single device. For example, in [26] colored noise was found in measurements in LV grid, while in [56], the emissions introduced by a TV receiver and a water pump are shown to be in the shape of colored noise.

6.1.5. Replicas of NB-PLC Transmissions

The NB-PLC devices connected to the grid can also generate NIE in out-of-band frequencies. In these field measurements, the emissions consist of replicas of the transmitted signals in upper frequencies. Therefore, the spectral pattern of these ghost replicas is a set of emissions similar to the NB-PLC transmitted signal, in frequencies higher than the transmission channel (see Figure 11). These replicas only occur during the NB-PLC transmission bursts and last a few milliseconds, as it is shown in the measurement recordings of Figure 11.
It is remarkable that this type of NIE is caused only by part of the communication devices present in the grid. Figure 11 shows transmissions from different transmission devices, but only a small percentage of them generate replicas at higher frequencies.

6.1.6. Combination of Different Types of Noise

In practice, all the measurements registered in the field trials include several types of the emissions identified in the previous figures. Two representative examples of this combination of types of NIE in the same measurement point have been selected and represented in Figure 12 and Figure 13.
Results of Figure 12 include wide band emissions of high amplitude around 100 kHz, tonal emissions in several frequencies along the frequency range and replicas of NB-PLC transmissions in a high percentage of transmissions.
In Figure 13, the NIE are in the form of colored noise for the whole frequency range up to 500 kHz, a high number of tonal emissions and replicas of NB-PLC transmissions. The NB-PLC replicas only occur during NB-PLC transmissions, while the rest of NIE are continuous in time.
Beyond larger/commercial equipment and systems using power electronic technology, many different types of electronic mass market equipment (e.g. power supply units, lamps) can present relevant emission levels in the considered frequency range [7], and the combination of all of them leads to the type of spectrograms shown above, as results described in [26].

6.2. NIE in Function of the Frequency Range

The results of these field trials have been also analyzed from a perspective of the frequency range where they occur, to analyze the differences that may exist below and above 150 kHz.

6.2.1. Low Part of the Frequency Range (Below 150 kHz)

The number and level of disturbances for frequencies up to 100 kHz is usually high in all the measurement points, and very high at frequencies up to 40 kHz, as it can be observed in the figures of previous sections and in Figure 14, Figure 15 and Figure 16. Considering that the communications of power delivery companies in Europe are assigned in CENELEC A band (9 kHz–95 kHz), it is understandable the occurrence of some cases of interfered communications and even a small percentage of isolated communication devices due to the impact of NIE.
As representative cases of NIE in the lower part of the frequency range, Figure 14 and Figure 15 show NIE in the form of tonal emissions and wide band emissions, respectively. Additionally, Figure 16 shows a particular situation of a high level NIE within the CENELEC A band.

6.2.2. Upper Part of the Frequency Range (above 150 kHz)

Figure 17 and Figure 18 are clear examples of relevant levels of NIE at frequencies above 150 kHz. The NIE at these frequencies may have different spectral nature, as it can be observed in these representative cases.
When analyzing the results of the measurements, it cannot be concluded that in all the testing points the level of NIE at higher frequencies is lower than those observed below 150 kHz. On the contrary, there is a significant number of cases where the levels of NIE for upper frequencies are, at least, as high as the levels found at lower frequencies.

6.3. Variation with Time

Almost all the results registered in the trials contain NIE that, when observed on a large scale, are continuous in time, stable in frequency and quite constant in amplitude, as can be verified in all the previous figures. Only a small percentage of results vary with frequency during the measurement time (a representative case is shown in Figure 19, where a colored noise, variable both in time and frequency domains, is noticed).
Some variation in amplitude of the NIE is observed on a small scale (within the fundamental period). Figure 20 shows this periodical behavior with the mains period.

6.4. Comparison of Levels of NIE for Different Scenarios

In addition to the analysis described in the previous sections, an overall comparison of the level of emissions for the different scenarios has been carried out. For this purpose, a statistical assessment of the levels of NIE for all the measurements registered in a particular scenario has been calculated, by means of representative percentile values of the noise emissions: 0th (minimum), 10th, 50th (median), 90th and 100th (maximum). These statistical values provide a clear representation of the amplitude range of the NIE for the entire frequency band. In those measurements where a high dynamic range was required, only levels above the system noise floor have been taken into account for the statistics, in order to avoid that a high noise floor of the measurement system alter the statistics of the grid noise levels.

6.4.1. Rural vs. Urban Scenarios

Figure 21 shows the levels of the aforementioned percentiles of NIE, considering all the measurements carried out in rural environment (excluding the measurements at the transformer substation). Figure 22 is a representation of the same statistical parameters for the measurements in urban environment (also with the exception of the measurements at the transformer substation).
From the comparison of the results shown in Figure 21 (rural environment) and Figure 22 (urban environment), relevant conclusions can be determined.
As a first consideration, the urban scenario presents higher maximum values of NIE for all the frequencies. Nevertheless, the median values are considerably lower than in a rural environment (between 5 dB and 10 dB higher) for frequencies below 150 kHz, and comparable for higher frequencies. Results for 90th percentile in an urban environment are similar, and in some cases lower, with respect to the rural environment for a wide frequency range. Accordingly, the results of the statistical analysis demonstrates that urban environments present the highest levels of NIE for the whole frequency range, but only for a small percentage of measurement points.
The minimum measured level of NIE is similar in both environments (between 20 dBuV and 25 dBuV) for frequencies above 60 kHz, which may correspond, for some of the frequencies, to the noise floor of the system. For frequencies below 60 kHz, the minimum level of NIE is above the system noise floor and it is higher in rural scenarios. If values of 10th percentiles are also considered in the analysis, levels remain similar to the minimum for urban measurements, but not for a rural environment, where values around 5 dB higher are shown for most of the frequencies.
Regarding the spectral patterns of the statistical analysis, the urban environment shows plenty of NIE in form of tonal emissions of very high amplitude within the whole frequency range. By contrast, statistical results of rural measurements do not provide this type of NIE, and results are in the form of colored noise of variable amplitude for the whole frequency range.
Last, the lowest frequency range (below 150 kHz) provides the greatest levels of NIE for rural and urban environments, as it was expected [26]. In particular, the levels of NIE for frequencies below 40 kHz are remarkably high. The level of NIE decreases with frequency for all the percentiles in rural measurements; by contrast, in an urban environment, great values can be also observed for high frequencies.
Consequently, the use of higher frequencies for PLC transmission could provide a less noisy propagation channel for PLC transmissions in rural environment, but on the contrary, it does not guarantee a less noisy propagation channel in an urban environment.

6.4.2. NIE at Transformer Substations

The results of the measurements carried out in the transformer substations have been statistically analyzed separately. As in the previous cases, representative percentile values of the noise emissions have been calculated, only for the measurements developed in the transformer centers, and are represented in Figure 23.
Results show that the minimum measured levels in the trials are considerably higher at the transformer centers (Figure 23) with respect to the rest of the measurements both in rural and urban scenarios (Figure 21 and Figure 22). By contrast, the maximum levels of NIE are not higher than in the rest of the locations.
The levels of NIE are grouped in a relatively narrow amplitude range: between 32 dBuV and 68 dBuV for frequencies below 100 kHz, and between 27 dBuV and 50 dBuV for most of the frequencies above 100 kHz. This reveals that the emissions and noise from the substations included in this campaign are quite similar in amplitude and continuous in time.
As in rural and urban scenarios, the lowest frequency range (in this case, up to 100 kHz) provides the greatest level of NIE.

7. Conclusions

The proper characterization of the different types of NIE is a first step required to characterize the levels and natures of interference that the NB-PLC have to face for an optimal performance, as has been recently stated by the main international regulatory bodies. This characterization should cover the range up to 500 kHz, due to the use of or the recent interest in the whole frequency range for current and future Smart Grid services, and to the lack of results from field trials that cover the whole frequency range. Within this characterization, the main lack is related to field results from different scenarios of electrical grids.
This paper summarizes the results obtained in a field measurement campaign in Spain, where illustrative examples of rural and urban electrical grid topologies in Spain were selected by the DSO Iberdrola. In this study, different types of NIE have been identified and characterized in time and frequency domains: tonal emissions, wide band emissions, colored noise, harmonics of switching frequencies and replicas of NB-PLC transmissions, with a measurement system presented in CENELEC SC2015A Working Group 11 [43] and signal processing methods recommended by CISPR [44,45,46].
Moreover, a statistical analysis of the recordings in different scenarios has been developed. The evaluation of the NIE in differentiated scenarios has been developed by comparing the results, first, for rural and urban scenarios, where both the grid topology and the density of the connected loads differ, and second, for measurements in transformer centers.
The statistical analysis of the results demonstrates that some of the measurements in urban environment show the highest levels of NIE for the whole frequency range. The highest levels in urban areas are in the form of tonal emissions of very high amplitude within the whole frequency range, while in rural areas the colored noise of the variable amplitude predominates. The minimum levels of NIE registered in the trials are similar for both environments and slightly higher for rural areas in the lowest frequencies. The median levels of NIE (50th percentile) below 150 kHz are around 10 dB higher in rural areas with respect to urban environments, and comparable for frequencies above 150 kHz. Nevertheless, the differences in level between individual sites (rural or urban, indistinctly) are much higher than the difference between the median levels of urban and rural areas. This is because the presence of local emission sources, which generate different types of patterns of NIE, differs considerably between measurement points within the same environment.
Results obtained at the transformer centers show minimum levels considerably higher with respect to the rest of the measurements both in rural and urban scenarios. By contrast, the maximum levels of NIE are not higher than in the rest of the locations and they are grouped at frequencies below 100 kHz.
Regarding the expectations for a less harsh propagation medium above 150 kHz, the greatest levels of NIE are always for low frequencies (below 150 kHz), and mainly for frequencies below 40 kHz, where they are remarkably high. The highest frequency range provides a less noisy propagation channel for PLC transmissions in a rural environment, but by contrast, it does not guarantee a less noisy propagation channel in urban environment, where the noise level is similar in some measurement points. As a result, NIE levels at higher frequencies should not be expected of low level in all the connection points and, therefore, they should be evaluated in advance.
The results of this work provide a proper characterization of NIE in different scenarios, in the frequency range up to 500 kHz, in order to contribute with useful information for current configurations of robustness techniques for NB-PLC [57,58] and target mitigation actions [59,60,61].

Author Contributions

Conceptualization, D.d.l.V.; methodology, I.F.; software, I.F.; formal analysis, I.F., A.A., I.A.; investigation, I.F., A.A.; resources, D.d.l.V., N.U.-P., A.L.; data curation, A.A., I.A.; writing—original draft preparation, D.d.l.V.; writing—review and editing, I.A.; supervision, D.d.l.V.; project administration, N.U.-P.; funding acquisition, N.U.-P., D.d.l.V., A.L.

Funding

This work was funded in part by the Basque Government under the grants IT1234-19 and Elkartek KK-2018/00037 and the Spanish Government under the grant RTI2018-099162-B-I00 (MCIU/AEI/FEDER-UE).

Acknowledgments

The authors would like to thank Iberdrola for the availability and the collaboration of authorized staff for carrying out the field trials.

Conflicts of Interest

The authors declare no conflict of interest.

References

  1. Rönnberg, S.K.; Bollen, M.H.J.; Amaris, H.; Chang, G.W.; Gu, I.Y.H.; Kocewiak, Ł.H.; Meyer, J.; Olofsson, M.; Ribeiro, P.F.; Desmet, J. On waveform distortion in the frequency range of 2 kHz–150 kHz—Review and research challenges. Electr. Power Syst. Res. 2017, 150, 1–10. [Google Scholar] [CrossRef]
  2. Bartak, G.F.; Abart, A. EMI of Emissions in the Frequency Range 2 kHz—150 kHz. In Proceedings of the CIRED 22nd International Conference on Electricity Distribution, Stockholm, Sweden, 10–13 June 2013. [Google Scholar]
  3. Uribe-Pérez, N.; Angulo, I.; Hernández, L.; Arzuaga, T.; de la Vega, D.; Arrinda, A. Study of Unwanted Emissions in the CENELEC-A Band Generated by Distributed Energy Resources and Their Influence over Narrow Band Power Line Communications. Energies 2016, 9, 1007. [Google Scholar] [CrossRef]
  4. Fernandez, I.; Uribe-Pérez, N.; Eizmendi, I.; Angulo, I.; de la Vega, D.; Arrinda, A.; Arzuaga, T. Characterization of non-intentional emissions from distributed energy resources up to 500 kHz: A case study in Spain. Int. J. Electr. Power Energy Syst. 2019, 105, 549–563. [Google Scholar] [CrossRef]
  5. European Comission. Electromagnetic Compatibility (EMC) Directive. 2014. Available online: http://ec.europa.eu/growth/sectors/electrical-engineering/emc-directive_en (accessed on 4 September 2019).
  6. Meyer, J.; Haehle, S.; Schegner, P. Impact of higher frequency emission above 2 kHz on electronic mass-market equipment. In Proceedings of the 22nd International Conference and Exhibition on Electricity Distribution (CIRED 2013), Stockholm, Sweden, 10–13 June 2013. [Google Scholar]
  7. CENELEC. CLC/TR 50627. Study report on electromagnetic interference between electrical equipment/systems in the frequency range below 150 kHz. In CENELEC SC 205A Mains Communicating Systems; CENELEC: Brussels, Belgium, 2015. [Google Scholar]
  8. CENELEC. EN 55016-1-2. Specification for Radio Disturbance and Immunity Measuring Apparatus and Methods—Part 1–2: Radio Disturbance and Immunity Measuring Apparatus—Coupling Devices for Conducted Disturbance Measurements; CENELEC: Brussels, Belgium, 2014. [Google Scholar]
  9. Standardization in the Field of Electromagnetic Compatibility with Regard to Low Frequency Phenomena, IEC SC 77A. Available online: https://www.iec.ch/dyn/www/f?p=103:7:16479330001452 (accessed on 4 September 2019).
  10. IEEE EMC. On the Aim and Scope of TC 7—Document for the TC 7. In Proceedings of the Inaugural Annual Meeting, Santa Ana Pueblo, NM, USA, 13–15 August 2012. IEEE EMC Society Agenda Report. [Google Scholar]
  11. IEEE Guide for Identifying and Improving Power Quality in Power Systems. IEEE 1250–2018. Available online: https://standards.ieee.org/content/ieee-standards/en/standard/1250-2018.html (accessed on 4 September 2019).
  12. JWG C4.24/CIRED. Power Quality and EMC Issues with Future Electricity Networks. CIGRE Technical Brochure 719. 2018. Available online: www.e-cigre.org (accessed on 4 September 2019).
  13. IEC. Establishment of a Joint Working Group between CISPR SC/H and IEC SC77A on the Introduction of Requirements in the Frequency range 9–150 kHz; TC77A/987/INF; IEC: Geneva, Switzerland, 2017; Available online: https://www.iec.ch/dyn/www/f?p=103:52:0::::FSP_ORG_ID,FSP_DOC_ID,FSP_DOC_PIECE_ID:1384,1009394,317392 (accessed on 4 September 2019).
  14. IEC. Electromagnetic Compatibility (EMC)—Part 4-30: Testing and Measurement Techniques—Power Quality Measurement Methods, 3rd ed.; IEC 61000-4-30; IEC: Geneva, Switzerland, 2015. [Google Scholar]
  15. CENELEC SC 205A. CLC/TR 50669. Investigation Results on Electromagnetic Interference in the Frequency Range Below 150 kHz; CENELEC: Brussels, Belgium, 2017. [Google Scholar]
  16. Bollen, M.H.J.; Olofsson, M.; Larsson, E.O.A.; Rönnberg, S.K.; Lundmark, M. Standards for supraharmonics (2 to 150 kHz). IEEE Electromagn. Compat. Mag. 2014, 3, 114–119. [Google Scholar] [CrossRef]
  17. JWG C4/C6.29. Power Quality Aspects of Solar Power. CIGRE Technical Brochure 672. 2016. Available online: www.e-cigre.org (accessed on 4 September 2019).
  18. Lampe, L.; Tonello, A.M.; Swart, T.G. Power Line Communications: Principles, Standards and Applications from Multimedia to Smart Grid, 2nd ed.; Wiley: Chichester, UK, 2016. [Google Scholar]
  19. Laverty, D.M.; Morrow, D.J.; Best, R.; Crossley, P.A. Telecommunications for smart grid: Backhaul solutions for the distribution network. In Proceedings of the IEEE Power and Energy Society General Meeting, Providence, RI, USA, 25–29 July 2010. [Google Scholar]
  20. Galli, S.; Lys, T. Next generation Narrowband (under 500 kHz) Power Line Communications (PLC) standards. China Commun. 2015, 12, 1–8. [Google Scholar] [CrossRef]
  21. Andreadou, N.; Guardiola, M.O.; Fulli, G. Telecommunication Technologies for Smart Grid Projects with Focus on Smart Metering Applications. Energies 2016, 9, 375. [Google Scholar] [CrossRef]
  22. Oksman, V.; Zhang, J.G. HNEM: The new ITU-T standard on narrowband PLC technology. IEEE Commun. Mag. 2011, 49, 36–44. [Google Scholar] [CrossRef]
  23. Meters and More—Open Technologies. Available online: http://www.metersandmore.com/ (accessed on 4 September 2019).
  24. The G3-PLC Alliance. Available online: http://www.g3-plc.com/ (accessed on 4 September 2019).
  25. ITU-T Rec. G.9903. Narrowband Orthogonal Frequency Division Multiplexing Power Line Communication Transceivers for G3-PLC Networks. February 2014. Available online: http://www.itu.int/rec/T-REC-G.9903 (accessed on 4 September 2019).
  26. IEEE Standard 1901.2–2013. Standard for Low Frequency (Less Than 500 kHz) Narrow Band Power Line Communications for Smart Grid Applications; IEEE Standard: New York, NY, USA, 2013. [Google Scholar]
  27. PRIME Alliance. Advanced Meter Reading & Smart Grid Standard. Available online: http://www.prime-alliance.org/ (accessed on 4 September 2019).
  28. PRIME Alliance Technical Working Group. Draft Specification for PoweRline Intelligent Metering Evolution. Available online: http://www.prime-alliance.org/wp-content/uploads/2013/04/PRIME-Spec_v1.3.6.pdf (accessed on 4 September 2019).
  29. PRIME Alliance Technical Working Group. Specification for PoweRline Intelligent Metering Evolution. Available online: http://www.prime-alliance.org/wp-content/uploads/2014/10/PRIME-Spec_v1.4-20141031.pdf (accessed on 4 September 2019).
  30. PRIME Alliance Technical Working Group. PRIME 1.4 White Paper. Available online: http://www.prime-alliance.org/wp-content/uploads/2014/10/whitePaperPrimeV1p4_final.pdf (accessed on 4 September 2019).
  31. Narrowband Orthogonal Frequency Division Multiplexing Power Line Communication Transceivers for PRIME Networks. ITU-T Rec. G.9904. October 2012. Available online: http://www.itu.int/rec/T-REC-G.9904 (accessed on 4 September 2019).
  32. Schottke, S.; Meyer, J.; Schegner, P.; Bachmann, S. Emission in the frequency range of 2 kHz to 150 kHz caused by electrical vehicle charging. In Proceedings of the International Symposium on Electromagnetic Compatibility (EMC Europe), Gothenburg, Sweden, 1–4 September 2014; pp. 620–625. [Google Scholar]
  33. CENELEC EN 55015:2013 Limits and Methods of Measurement of Radio Disturbance Characteristics of Electrical Lighting and Similar Equipment; CENELEC: Brussels, Belgium, 2013.
  34. Rönnberg, S.K.; Bollen, M.H.J.; Gil-de-Castro, A. Harmonic Distortion from Energy-Efficient Equipment and Production in the Low-Voltage Network; Final Report Swedish Energy Administration Project 31681-2; Swedish Energy Administration: Luleå, Sweden, 2014. [Google Scholar]
  35. Roggo, D.; Horta, R.; Capponi, L.; Eggenschwiler, L.; Decorvet, F.; Pellodi, C.; Buholzer, F. Electromagnetic interferences in smart grid applications: A case study with power line communication smart meters and PV energy generation. Cired Open Access Proc. J. 2017, 2017, 607–611. [Google Scholar] [CrossRef]
  36. Sendin, A.; Berganza, I.; Arzuaga, A.; Pulkkinen, A.; Kim, I.H. Performance results from 100,000+ PRIME smart meters deployment in Spain. In Proceedings of the 2012 IEEE Third International Conference on Smart Grid Communications (SmartGridComm), Tainan, Taiwan, 5–8 November 2012; pp. 145–150. [Google Scholar]
  37. Meyer, J.; Mueller, S.; Ungethuem, S.; Xiao, X.; Collin, A.; Djokic, S. Harmonic and supraharmonic emission of on-board electric vehicle chargers. In Proceedings of the 2016 IEEE PES Transmission & Distribution Conference and Exposition-Latin America (PES T&D-LA), Morelia, Mexico, 20–24 September 2016; pp. 1–7. [Google Scholar]
  38. IEC TS 62578:2015. Power Electronics Systems and Equipment. Operation Conditions and Characteristics of Active Infeed Converter (AIC) Applications Including Design Recommendations for Their Emission Values below 150 kHz; IEC: Geneva, Switzerland, 2015. [Google Scholar]
  39. Meyer, J.; Bollen, M.; Amaris, H.; Blanco, A.M.; de Castro, A.G.; Desmet, J.; Kocewiak, L.; Rönnberg, S.K.; Yang, K. Future work on harmonics—Some expert opinions Part II—Supraharmonics, standards and measurements. In Proceedings of the 2014 16th International Conference on Harmonics and Quality of Power (ICHQP), Bucharest, Romania, 25–28 May 2014; pp. 909–913. [Google Scholar]
  40. Klatt, M.; Meyer, J.; Schegner, P. Comparison of measurement methods for the frequency range of 2 kHz to 150 kHz. In Proceedings of the 2014 16th International Conference on Harmonics and Quality of Power (ICHQP), Bucharest, Romania, 25–28 May 2014; pp. 818–822. [Google Scholar]
  41. Grevener, A.; Meyer, J.; Rönnberg, S.K. Comparison of Measurement Methods for the Frequency Range 2–150 kHz (Supraharmonics). In Proceedings of the 2018 IEEE 9th International Workshop on Applied Measurements for Power Systems (AMPS), Bologna, Italy, 26–28 September 2018; pp. 1–6. [Google Scholar]
  42. Grid Measurements of 2–150 kHz harmonics to support normative emission limits for mass-market electrical goods. European Metrology project 18NRM05 SupraEMI, EMPIR Call 2018. Available online: http://empir.npl.co.uk/supraemi/ (accessed on 4 September 2019).
  43. Fernández, I.; Arrinda, A.; Angulo, I.; Alberro, M.; Montalbán, J.; de la Vega, D. Measurement method for the characterization of NIE of LV networks for the frequency range for NB-PLC up to 500 kHz. In Proceedings of the CENELEC SC205A WG11 6th Meeting, Viena, Austria, 2 October 2018. [Google Scholar]
  44. IEC. CISPR16-1-1- Specification for Radio Disturbance and Immunity Measuring Apparatus and Methods—Part 1-1: Radio Disturbance and Immunity Measuring Apparatus—Measuring Apparatus; IEC: Geneva, Switzerland, 2010. [Google Scholar]
  45. IEC. CISPR16-2-1:2014. CISPR 16-2-1:2014. Specification for Radio Disturbance and Immunity Measuring Apparatus and Methods—Part 2-1: Methods of Measurement of Disturbances and Immunity—Conducted Disturbance Measurements; IEC: Geneva, Switzerland, 2014. [Google Scholar]
  46. IEC. CISPR16-2-2:2010. Specification for Radio Disturbance and Immunity Measuring Apparatus and Methods—Part 2-2: Methods of Measurement of Disturbances and Immunity—Measurement of Disturbance Power; IEC: Geneva, Switzerland, 2010. [Google Scholar]
  47. Proakis, J.G.; Manolakis, D.K. Digital Signal Processing, 4th ed.; Pearson: London, UK, 2007. [Google Scholar]
  48. Fernandez, I.; Arrinda, A.; Angulo, I.; de la Vega, D.; Uribe, N.; Llano, A. Field trials for the Empirical Characterization of the Low Voltage Grid Access Impedance from 35 kHz to 500 kHz. IEEE Access 2019, 7, 85786–85795. [Google Scholar] [CrossRef]
  49. Rönnberg, S.K.; de Castro, A.G.; Delgado, A.E. Variations in supraharmonic levels in low voltage networks. In Proceedings of the 25th International Conference on Electricity Distribution CIRED, Madrid, Spain, 3–6 June 2019. [Google Scholar]
  50. Rönnberg, S.K.; Gil-De-Castro, A.; Medina-Gracia, R. Supraharmonics in European and North American Low-Voltage Networks. In Proceedings of the 2018 IEEE International Conference on Environment and Electrical Engineering and 2018 IEEE Industrial and Commercial Power Systems Europe (EEEIC/I&CPS Europe), Palermo, Italy, 12–15 June 2018; pp. 1–6. [Google Scholar]
  51. Klatt, M.; Meyer, J.; Schegner, P.; Koch, A.; Myrzik, J.; Körner, C.; Darda, T.; Eberl, G. Emission Levels above 2kHz—Laboratory Results and Survey Measurements in Public Low Voltage Grids. In Proceedings of the 22nd International Conference on Electricity Distribution, CIRED, Stockholm, Sweden, 10–13 June 2013. [Google Scholar]
  52. Varatharajan, A.; Schoettke, S.; Meyer, J.; Abart, A. Harmonic emission of large PV installations—case study of a 1 MW solar campus. In Proceedings of the ICREPQ International Conference on Renewable Energies and Power Quality, Cordoba, Spain, 7–10 April 2014. [Google Scholar]
  53. Larsson, E.O.A.; Bollen, M.H.J.; Wahlberg, M.G.; Lundmark, C.M.; Ronnberg, S.K. Measurements of High-Frequency (2–150 kHz) Distortion in Low-Voltage Networks. IEEE Trans. Power Deliv. 2010, 25, 1749–1757. [Google Scholar] [CrossRef]
  54. Larsson, E.O.A. High Frequency Distortion in Power Grids Due to Electronic Equipment. Licentiate Dissertation, Luleå University Technology, Skellefteå, Sweden, 2006. [Google Scholar]
  55. Gil-de-Castro, A.; Moreno-Munoz, A.; Larsson, A.; de la Rosa, J.G.; Bollen MH, J. LED Street Lighting: A Power Quality Comparison among Street Light Technologies. Light. Res. Technol. 2013, 45, 710–728. [Google Scholar] [CrossRef]
  56. López, G.; Moreno, J.I.; Sánchez, E.; Martínez, C.; Martín, F. Noise Sources, Effects and Countermeasures in Narrowband Power-Line Communications Networks: A Practical Approach. Energies 2017, 10, 1238. [Google Scholar] [CrossRef]
  57. da Rocha Farias, L.; Monteiro, L.; Leme, M.; Stevan, S. Empirical Analysis of the Communication in Industrial Environment Based on G3-Power Line Communication and Influences from Electrical Grid. Electronics 2018, 7, 194. [Google Scholar] [CrossRef]
  58. Zhu, Q.; Chen, Z.; He, X. Resource Allocation for Relay-Based OFDMA Power Line Communication System. Electronics 2019, 8, 125. [Google Scholar] [CrossRef]
  59. Bernacki, K.; Wybrańczyk, D.; Zygmanowski, M.; Latko, A.; Michalak, J.; Rymarski, Z. Disturbance and Signal Filter for Power Line Communication. Electronics 2019, 8, 378. [Google Scholar] [CrossRef]
  60. Varajão, D.; Araújo, R.E.; Miranda, L.; Lopes, J.P. EMI Filter Design for a Single-stage Bidirectional and Isolated AC–DC Matrix Converter. Electronics 2018, 7, 318. [Google Scholar] [CrossRef]
  61. Wu, C.; Gao, F.; Dai, H.; Wang, Z. A Topology-Based Approach to Improve Vehicle-Level Electromagnetic Radiation. Electronics 2019, 8, 364. [Google Scholar] [CrossRef]
Figure 1. Measurement system for the characterization of non-intentional emissions (NIE) of the electrical grid.
Electronics 08 01044 g001
Figure 2. Schematic of the CISPR16 [44,45,46] data processing applied to the measurements.
Electronics 08 01044 g002
Figure 3. Spectrogram (top) and spectral characterization of NIE according to CISPR 16 (bottom) of a measurement point with NIE in the form of tonal emissions (some of them are marked with yellow arrows in the spectrogram and with green circles in the lower graph). The time interval selected for the figure at the bottom is marked in the spectrogram with two black lines.
Electronics 08 01044 g003aElectronics 08 01044 g003b
Figure 4. Spectrogram (top) and spectral characterization of NIE according to CISPR 16 (bottom) of a measurement point containing NIE in the form of tonal emissions (some of them are marked with yellow arrows in the spectrogram and with green circles in the CISPR-16 graph).
Electronics 08 01044 g004
Figure 5. Spectrogram (top) and spectral characterization of NIE according to CISPR 16 (bottom) of a measurement point containing harmonics of 16 kHz (marked with yellow arrows in the spectrogram and with green circles in the CISPR-16 graph).
Electronics 08 01044 g005
Figure 6. Spectrogram (top) and spectral characterization of NIE according to CISPR 16 (bottom) of a measurement point containing harmonics of 34 kHz (marked with yellow arrows in the spectrogram and with green circles in the CISPR-16 graph).
Electronics 08 01044 g006
Figure 7. Spectrogram (top) and spectral characterization of NIE according to CISPR 16 (bottom) of a measurement point containing wide band NIE (marked with yellow arrows in the figures).
Electronics 08 01044 g007
Figure 8. Spectrogram (top) and spectral characterization of NIE according to CISPR 16 (bottom) of a measurement point containing wide band NIE (marked with yellow arrows in the figures).
Electronics 08 01044 g008aElectronics 08 01044 g008b
Figure 9. Spectrogram (top) and spectral characterization of NIE according to CISPR 16 (bottom) of a measurement point with NIE in the form of colored noise for the frequency range (20 kHz–210 kHz).
Electronics 08 01044 g009aElectronics 08 01044 g009b
Figure 10. Spectrogram (top) and spectral characterization of NIE according to CISPR 16 (bottom) of a measurement point with NIE in the form of colored noise for the whole frequency range.
Electronics 08 01044 g010
Figure 11. Spectrogram (top) and spectral characterization of NIE according to CISPR 16 (bottom) of a measurement point with NIE in the form of replicas of narrowband power line communications (NB-PLC) transmissions.
Electronics 08 01044 g011
Figure 12. Spectrogram of a measurement point with several types of NIE: wide band emissions around 100 kHz, tonal emissions and replicas of NB-PLC transmissions.
Electronics 08 01044 g012
Figure 13. Spectrogram of a measurement point with several types of NIE: colored noise, tonal emissions and replicas of NB-PLC transmissions.
Electronics 08 01044 g013
Figure 14. Spectrogram (top) and spectral characterization of NIE according to CISPR 16 (bottom) of NIE in the form of tonal emissions below 150 kHz.
Electronics 08 01044 g014
Figure 15. Spectrogram (top) and spectral characterization of NIE according to CISPR 16 (bottom) of wide band emissions located below 150 kHz.
Electronics 08 01044 g015
Figure 16. Spectrogram (top) and spectral characterization of NIE according to CISPR 16 (bottom) of high level emissions below 150 kHz.
Electronics 08 01044 g016aElectronics 08 01044 g016b
Figure 17. Spectrogram (top) and spectral characterization of NIE according to CISPR 16 (bottom) of high level emissions in the form of wide band emissions in the upper part of the frequency range (> 150 kHz).
Electronics 08 01044 g017aElectronics 08 01044 g017b
Figure 18. Spectrogram (top) and spectral characterization of NIE according to CISPR 16 (bottom) of high-level emissions in the whole frequency range.
Electronics 08 01044 g018
Figure 19. Large-scale variation with time of NIE.
Electronics 08 01044 g019
Figure 20. Variation with time of NIE within the fundamental cycle for a measurement time of two mains periods.
Electronics 08 01044 g020
Figure 21. Statistical analysis of the level of NIE for rural scenario: levels corresponding to 0th (minimum), 10th, 50th (median), 90th and 100th (maximum) percentiles.
Electronics 08 01044 g021
Figure 22. Statistical analysis of the level of NIE for urban scenario: levels corresponding to 0th (minimum), 10th, 50th (median), 90th and 100th (maximum) percentiles.
Electronics 08 01044 g022
Figure 23. Statistical analysis of the level of NIE at the transformer substations: levels corresponding to 0th (minimum), 10th, 50th, 90th and 100th (maximum) percentiles.
Electronics 08 01044 g023
Table 1. Description of the measurement locations for the characterization of NIE.
NumberScenarioTransformer/Distribution-GridMono-/Tri-PhasicNumber of Measurements Per Phase
1Urban-1TransformerTri-phasic3
2Urban-1Distribution-gridTri-phasic1
3Urban-1Distribution-gridTri-phasic1
4Urban-1Distribution-gridTri-phasic1
5Urban-1Distribution-gridTri-phasic1
6Urban-1Distribution-gridTri-phasic1
7Urban-1Distribution-gridTri-phasic1
8Urban-1Distribution-gridTri-phasic1
9Urban-1Distribution-gridTri-phasic1
10Urban-1Distribution-gridTri-phasic1
11Urban-1Distribution-gridTri-phasic1
12Rural-1TransformerTri-phasic1
13Rural-1Distribution-gridTri-phasic1
14Rural-1Distribution-gridMono-phasic1
15Rural-1Distribution-gridMono-phasic1
16Rural-1Distribution-gridMono-phasic1
17Rural-2TransformerTri-phasic1
18Rural-2Distribution-gridTri-phasic1
19Rural-2Distribution-gridTri-phasic1
20Rural-2Distribution-gridMono-phasic1

