Improvement in SNR by Adaptive Range Gates for RCS Measurements in the THz Region


College of Electronic Science and Technology, National University of Defense Technology, Changsha, 410073, China
*
Author to whom correspondence should be addressed.
Electronics 2019, 8(7), 805; https://doi.org/10.3390/electronics8070805
Submission received: 14 May 2019
/
Revised: 27 June 2019
/
Accepted: 15 July 2019
/
Published: 18 July 2019
(This article belongs to the Special Issue Terahertz Technology and Its Applications)
Abstract
:One of the major concerns in radar cross-section (RCS) measurements is the isolation of the target echo from unwanted spurious signals. Generally, the method of software range gate is applied to extract useful data. However, this method may not work to expectations, especially for targets with a large length-width ratio. This is because the effective target zone is dependent on the aspect angle. The implementation of conventional fixed range gates will introduce an uneven clutter signal that leads to a decline in signal-to-noise ratio. The influence of this uneven clutter signal becomes increasingly severe in the terahertz band, where the wavelength is short and the illumination power is weak. In this work, the concept of adaptive range gates was adopted to extract a target echo of higher accuracy. The dimension of the range gate was determined by the angle-dependent radial projection of the target. In order to evaluate the performance of the proposed method, both experimental measurements and numerical simulations were conducted. Noticeable improvements in the signal-to-noise ratio at certain angles were observed.
1. Introduction
The radar cross-section (RCS) of a target is an important physical quantity that characterizes its capability of reflecting electromagnetic waves. The RCS is a physical quality of high complexity. It is related to not only the geometrical parameters and physical parameters of the target, such as the size, shape, material, and structure, but also the parameters of the incident wave, including the frequency, polarization waveform, etc. [1,2]. High-quality RCS data are strongly required for programs such as high-range-resolution profiling (HRRP) and synthetic aperture radar (SAR) imaging. Commonly, two different approaches are implemented in RCS measurements. One is to measure the RCSs of the full-size objects; the other is to measure the RCSs of scaled models and calculate the RCSs of the objects according to the law of electromagnetic similarity. These two approaches have their respective pros and cons [3,4]. Direct full-size measurements can be easily arranged for targets with moderate sizes within appropriate test sites. However, in terms of large objects, this method will become costly or even impossible owing to the requirement in large test-field and long measurement distance. In contrast, scaled measurements for large prototypes can be carried out in anechoic chambers; while this method requires radar systems with high-performance transceiver links and high operation frequencies. Therefore, obtaining RCS data in the terahertz (THz) band is of great significance for scaled measurements. In recent years, owing to the growing demand in RCS scaled measurements of large objects and producing vehicles with reduced RCS in the terahertz range, the development of THz RCS measurement systems has attracted increasing attention [5,6]. In accordance with the approach of THz wave generation and detection, various types of THz RCS measurement systems have been constructed, including THz laser-based systems, THz time-domain spectroscopy (THz-TDS)-based systems and solid-state THz systems [7,8,9,10].
It is realized that THz RCS measurements are very different from conventional RCS measurements. In THz band, the range resolution is significantly improved thanks to the large time-bandwidth product accompanied by the high carrier frequency. As a result, the contribution of different scattering centers can be isolated and analyzed. This is highly preferred in high-resolution radar imaging [11,12,13,14]. Meanwhile, due to the shortened wavelength of THz radiation, the contribution of the fine structure of the targets, such as surface roughness, can no longer be ignored [15,16]. This provides new insights regarding scattering mechanism studying. Therefore, the development of an accurate THz RCS measurement technique is in strong demand. However, with the increasing operation frequency, the transmitting power of the radar system decreases dramatically [17,18]. Besides, the influence of fluctuation in the signal source and measurement environment becomes increasingly significant. All these factors limit the precision of THz RCS measurements.
The performance of the THz RCS measurement system can be improved by upgrading the hardware and bettering the data processing technique. The former, however, is generally expensive and time-consuming. This work specifically focuses on the latter approach. Conventionally, the software range gate technique is applied in RCS measurements to filter the target echo from unwanted spurious signals and subsequently improve the signal-to-noise ratio (SNR). Range gates are generally configured with fixed dimensions that correspond to the size of the quiet zone [19]. This technique works well in microwave frequency measurements, as the range resolution is relatively low and small changes in radial projection size will not influence the range profile. However, for THz radars, the range resolution is significantly improved. Hence, an alteration in radial projection, corresponding to the aspect angle, can no longer be ignored. In this scenario, a fixed range gate will bring in the uneven contribution of the clutter signal corresponding to the aspect angle. The influence of this uneven clutter signal becomes increasingly significant in THz RCS measurements considering the nature of weak transmitting power in THz radars. As a result, the conventional range gate may not work up to expectations in THz RCS measurements, especially for targets with large length-width ratios.
To alleviate this problem, the new concept of an adaptive range gate is proposed in this work. The dimension of the adaptive range gate is adjusted according to the observation angle. This will effectively eliminate the uneven contribution of the clutter signal and improve the accuracy of RCS measurement. In the following sections, experimental measurements and numerical simulations will be carried out to evaluate the performance of our proposed method.
This paper is organized as follows. The theory of the step-frequency signal model and the concept of the adaptive range gate method are introduced in detail in Section 2. In Section 3, the THz RCS measurement system and the experiments are described. Measurement and correlated simulation results are presented and discussed in Section 4 to demonstrate the superiority of the adaptive range gate method. Conclusions are drawn in Section 5.
2. Method of the Adaptive Range Gate
2.1. The Signal Model of Step-Frequency Systems
Step-frequency (SF) signals are commonly used in RCS measurement systems because of its large bandwidth and high range resolution. In terms of the high-resolution frequency-stepped millimeter-wave (MMW) radar systems, a radar target is considered containing several strong scattering centers. By employing inverse Fourier transformation to the SF echoes, the synthetic range profile can be obtained, as well as the distribution of scattering centers [19,20].
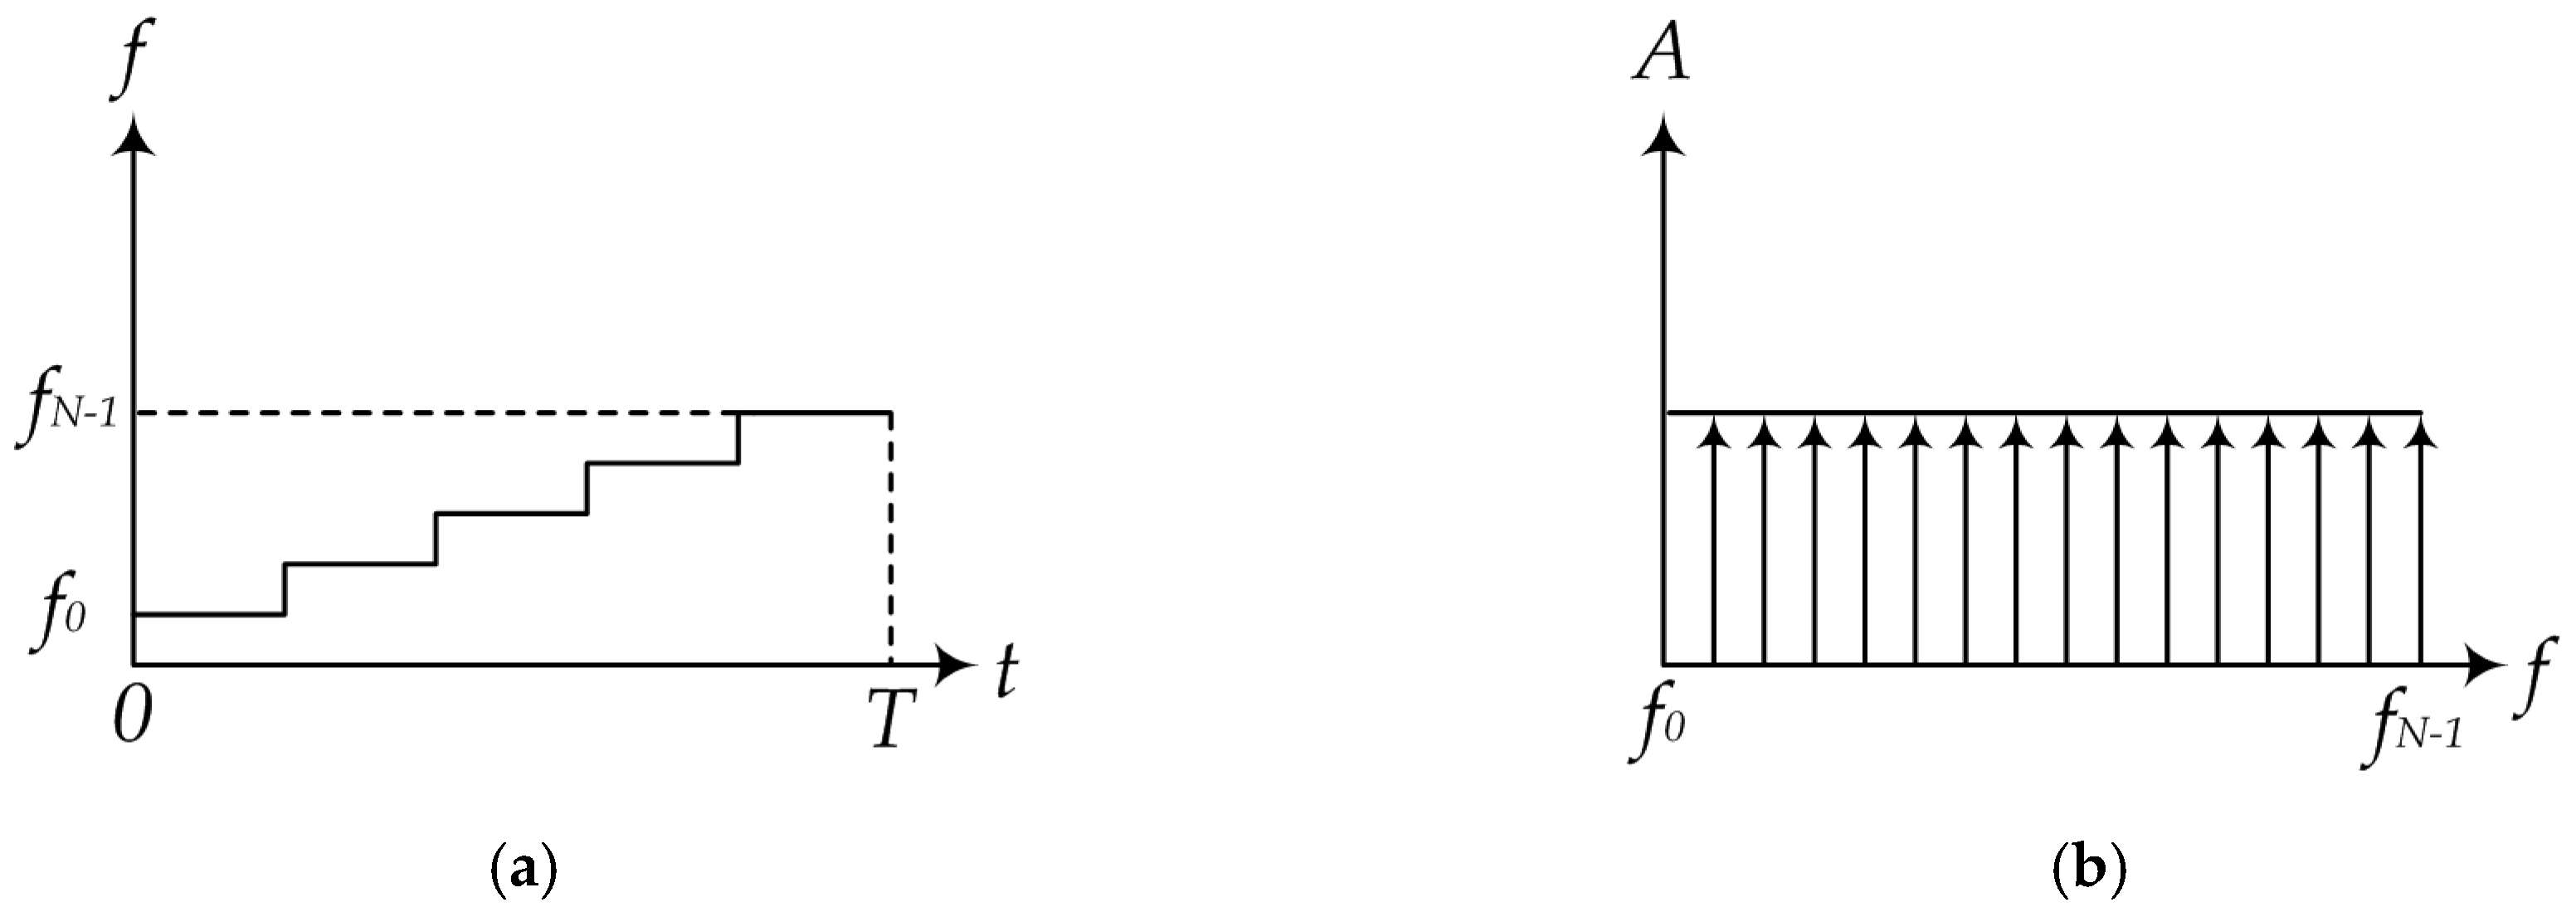
The time-frequency signal shown in Figure 1a represents a typical transmitted SF signal. The SF signal is composed of a sequence of pulses with different frequencies separated by a fixed spectral interval. The frequency of the signal varies by step in time, while generating an even spectral power distribution, as illustrated in Figure 1b. The transmitted SF signal S(f) can be described as the sum for a series of impulse functions:
where N is the number of impulses, f0 is the initial frequency, and Δf is the spectral step size. In the receiving end, the received signal corresponding to the ith frequency point at time t can be expressed as yi(t):
Considering a scattering center at range cell R, the echo signal corresponding to the ith pulse is obtained by replacing t with 2R/c:
where c is the speed of light.
The received echo can be considered as the sum of the ith impulse response yi(R) from the scattering center at range cell R. The distribution of the echo signal in the discrete-time domain H(l;R) can be obtained by implementing inverse Fourier transform on the received signal sequence Σyi(R) (i = 0, 1, …, N-1) as in Equation (4):
where l denotes the index of the time cell. The modulus of H(l;R) represents the distribution of power in the time domain, i.e., the range profile:
As in Equation (5), H(l;R) is in the form of a series of sinc functions [20]. The maximum of |H(l;R)| is realized when l0 = 2NΔfR/c. This corresponds to the radial distance of the scattering center R = cl0/2NΔf. After obtaining the range profile, a range gate corresponding to the dimension of the target zone is commonly applied in order to filter echoes from the target and suppress the clutters. This can effectively improve the quality of the signal. Hence, properly configured range gates are vital for accurate RCS measurements.
In THz RCS measurements, SF signals are transmitted and received through the transceiver links. Due to the high range resolution in the THz band, the scattering from targets in the terahertz band can be generally considered as multiple isolated scattering centers. In this sense, the distribution of the scattering centers could be obtained according to the precise synthetic range profile by implementing the above procedure. However, a problem arises when applying the range gates. For a specific object, the target zone is, in fact, dependent on the aspect angle. As a result, at certain aspect angles, a range gate of a fixed dimension will bring extra clutters to the signal, which leads to reductions in the SNR and measurement accuracy. This becomes increasingly significant in THz RCS measurements, especially for targets with a large length-width ratio, since the SNR of THz RCS measurement systems is low and THz waves are highly sensitive to alterations in distance. Addressing this problem, the adaptive range gate method is introduced in the next subsection as an improved scheme of data extraction in the time domain.
2.2. Method of the Adaptive Range Gate
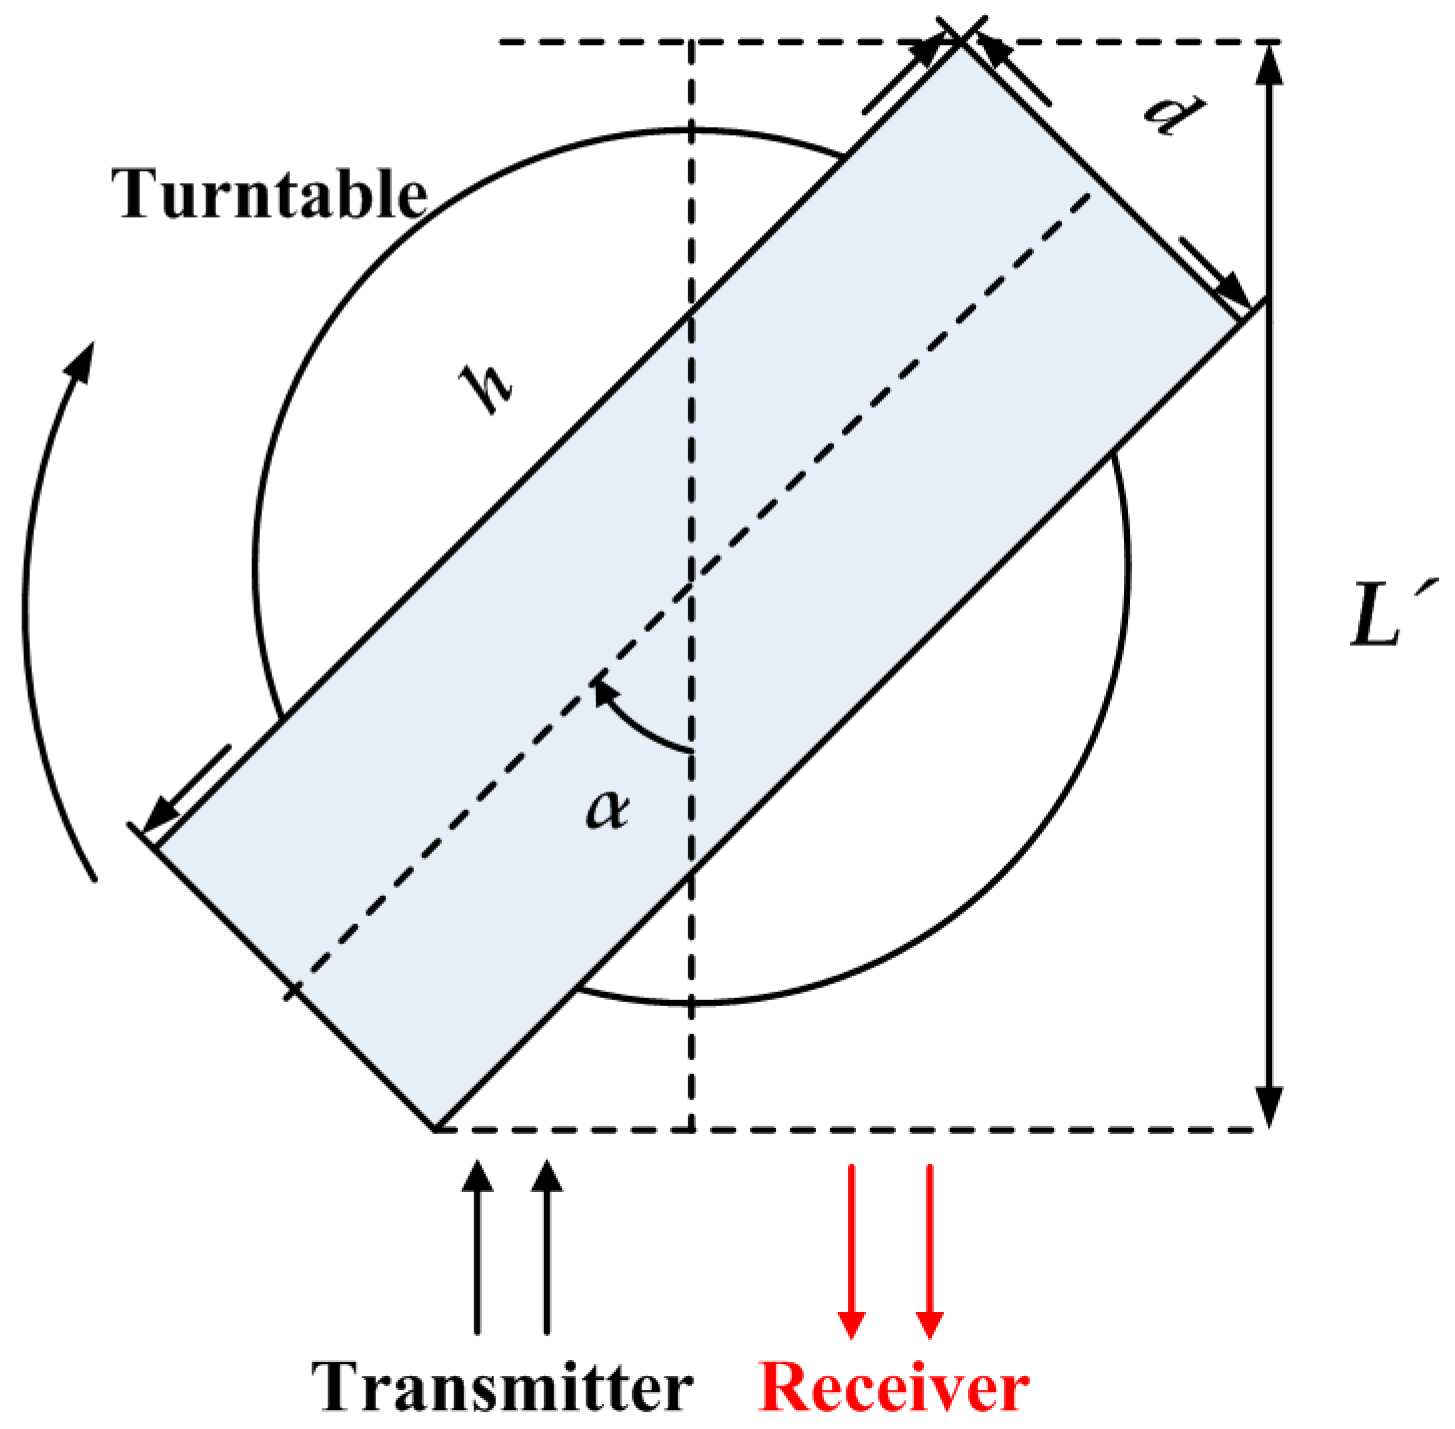
Comparing to traditional range gates, the dimension of adaptive range gates varies according to the angle-dependent target zone to precisely capture the echoes from the target and improve the SNR in RCS measurements. Figure 2 illustrates the schematic of the adaptive range gate. The rectangle with sides h and d represents the target area according to its characteristic dimensions and α is the aspect angle. The projection dimension in radial direction L’ and the size of the time-domain window for adaptive range gate M’ can be expressed as follows:
where M denotes the range gate corresponding to h. It is obtained by analyzing the distribution of scattering centers in the range profile at α = 0. In the adaptive range gate scheme, although the initial position in the time-domain echo varies with the azimuths angle, the gate center is considered as stationary. Here, the strongest echoes in the time domain at 0° and 90° are located and the gate center is selected according to the relationship between the geometrical size and range resolution.
Figure 3 highlights the difference between the fixed range gates and the adaptive range gates. The size of a fixed range gate is determined by the largest dimension of the target, while the size of the adaptive range gate is adjusted according to the projection dimension in the radial direction. As illustrated in Figure 3a, the size of adaptive range gate is constantly smaller than that of the fixed range gates (Case 2 and Case 3) with an only exception at the direction corresponding to the diagonal of the target area (Case 1). Figure 3b further provides a full-angle comparison between conventional and adaptive range gates according to Equations (6) and (7). The adaptive range gate can effectively capture the echoes from the target, while the clutter in the dashed area is eliminated.
3. The THz RCS Measurement System and Experiments
3.1. The Terahertz RCS Measurement System
To verify the effectiveness of the adaptive range gate method, a THz RCS measurement system was established and experiments based on a smooth metal cylinder were carried out. The measurement system consisted of the following parts: The THz radar system, the turntable with double axis and the system control center.
The THz radar system is the core of the THz RCS measurement system. The main components include the programmable network analyzer (PNA) and the frequency multiplier chains. The PNA provides the RF signal, intermediate frequency (IF) procession, as well as the data collection function. The multiplier chains contain the amplifier, doublers, mixer, and the transmitting and receiving antennas. The THz radar system can provide different carrier frequencies by changing the multipliers and antennas. In this paper, we constructed 220 GHz and 440 GHz radar systems for the RCS measurements. The two systems are similar except for the antennas and multipliers. In the 220 GHz system, the THz signals are transmitted and received by conical-horn antennas, while in the 440 GHz system, pyramidal-horn antennas are used. A schematic diagram of the radar systems and the THz multiplier chains are shown in Figure 4 and Figure 5, respectively.
The PNA provides a baseband signal varying between 13.45 and 14.25 GHz, and an IF signal of 960 MHz. The baseband signal is multiplied into the THz band after power amplifying. The orders of multiplication m for 220 and 440 GHz systems are 16 and 32, respectively. The available bandwidths are 12.8 GHz and 25.6 GHz, and their output powers are about 100 mW at 220 GHz and 5 mW at 440 GHz. In the receiving chain, the received THz signal is first down-converted to IF for super heterodyne reception through harmonic mixing. Then, the IF signal is down-converted to baseband and demodulated by an I/Q demodulator for A/D sampling. Finally, the collected data are transmitted to the system control center through the Ethernet for further processing.
3.2. The Experiments on a Metallic Cylinder
Experiments were carried out in a chamber equipped with absorbing material designed for THz operation. The absorption coefficient of the material at 200~500 GHz reached −36 dB, which could effectively suppress background noise and reduce the influence of multi-path interference such as the reflection wave from the wall and ground. In the experiment, the radar system was placed on a platform and the antennas were allocated side by side with a 5 cm gap between their front ends. This configuration could effectively suppress the influence of the direct leakage signal between the transmitter and the receiver. The target was placed on a foam bracket fixed on the turntable and it was 3.30 m away from the center of the antennas. The distance was much larger than the gap mentioned above, so the measurement system could be regarded as a mono-static system. In addition, the model center and the antenna center were on the same height and in the same vertical plane. With this experimental configuration, the dimension of the quiet zone was estimated as 30–40 cm in diameter, which was sufficiently large enough to cover the under-measurement target. The configuration of the measurement system and the metal cylinder are presented in Figure 6a,b.
The RCS of a metallic cylinder (of height 20 cm and radius 4 cm, shown in Figure 6b) at 220 GHz and 440 GHz were measured in the experiments. The turntable was controlled to rotate from 0° to 360° in 0.2° increments. The PNA was configured to operate at a stepped continuous wave mode so that the range profile could be obtained from Equation (5). The number of sweeping points was set at 801 for both frequency bands.
3.3. Data Processing and Calibration of Measurement Results
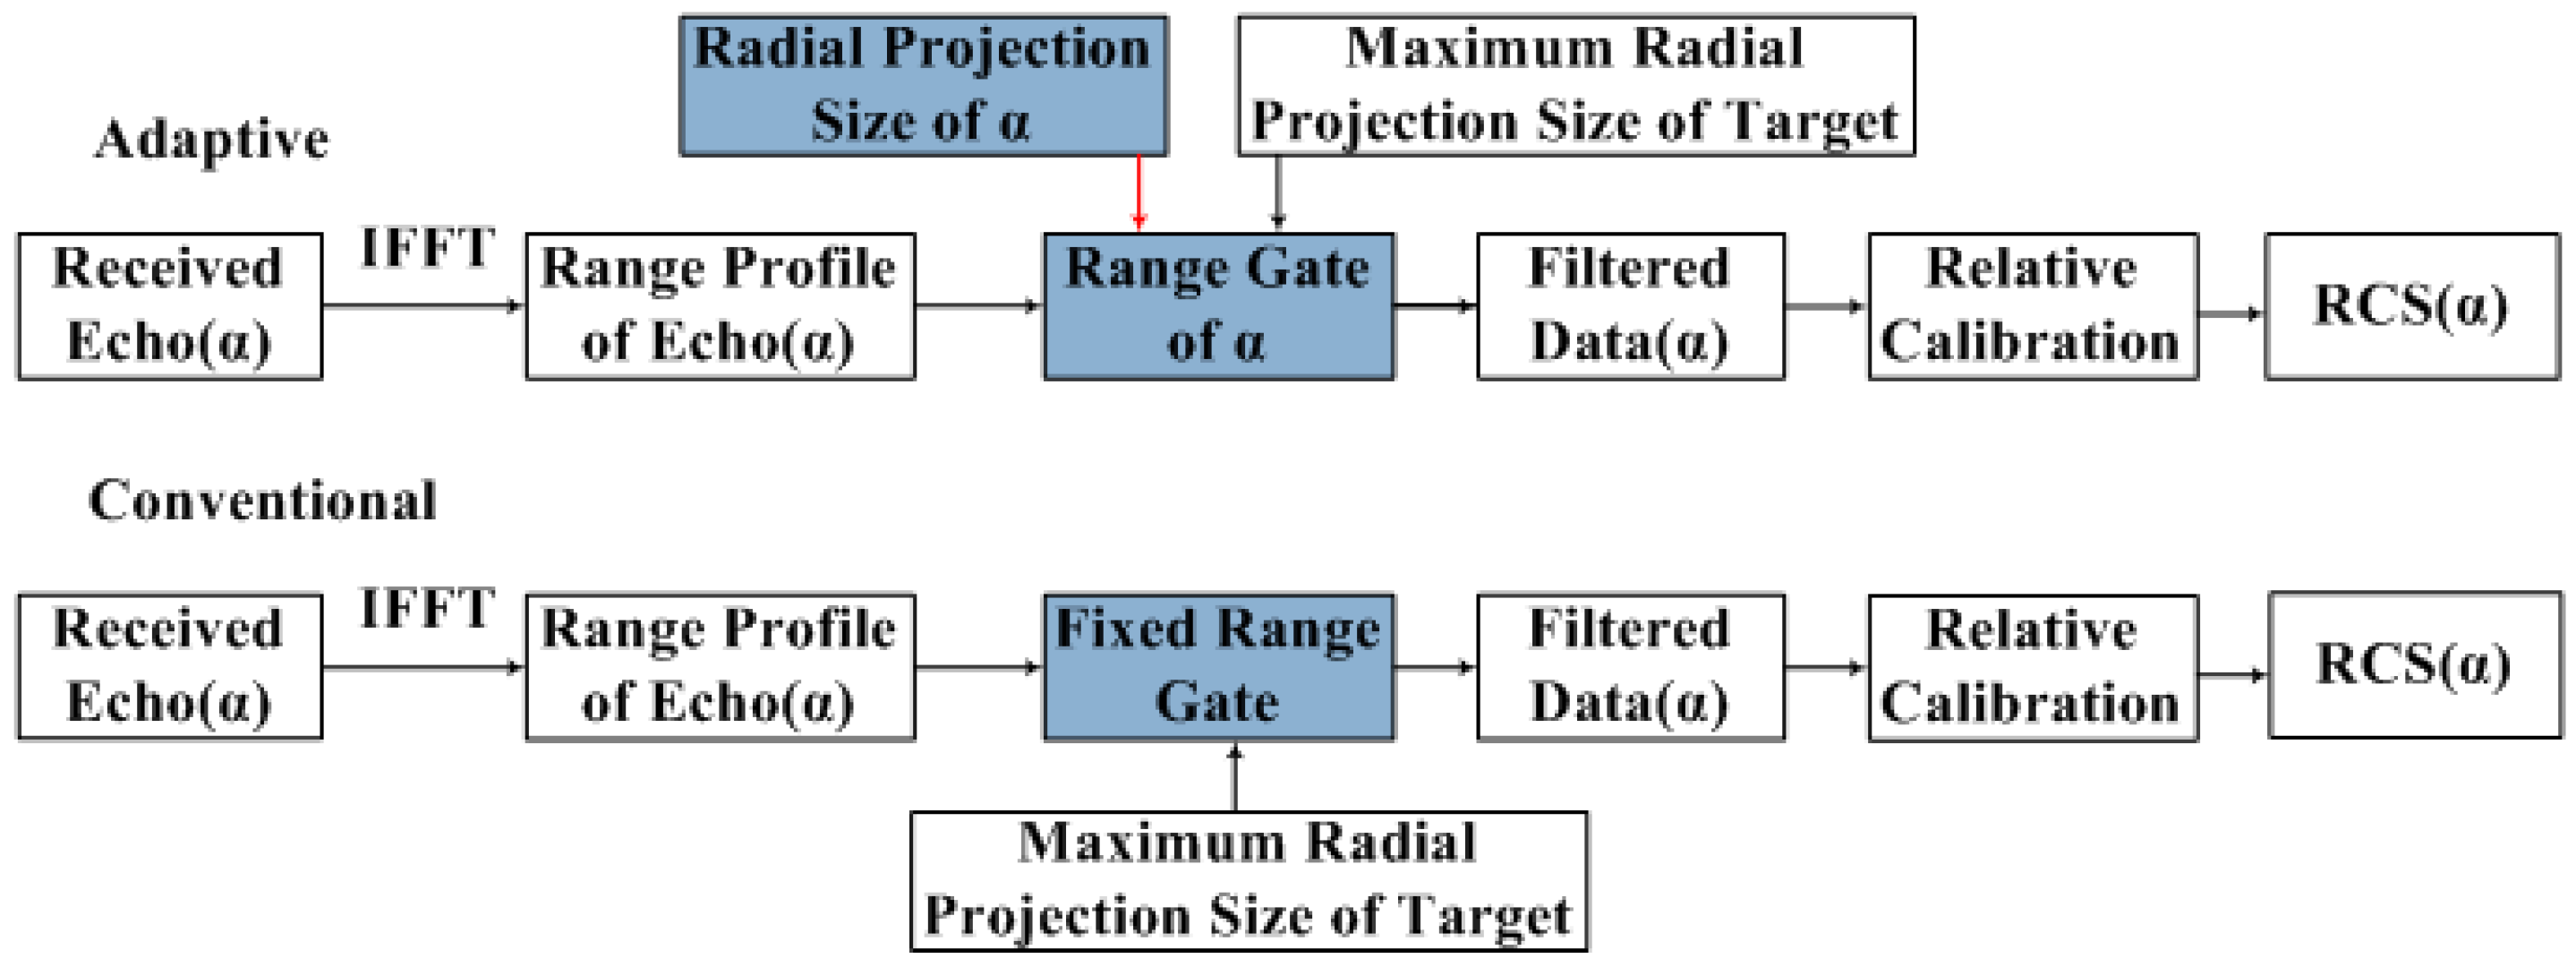
The data processing procedure to obtain the RCS results from the data measurement by the PNA is introduced in this subsection. This procedure mainly contained echo signal extraction from the target zone and calibration. Figure 7 presents the data proceeding process of the two range gate methods. First, for the received echo of aspect angle α, inverse Fourier transform was applied to obtain time-domain sequences. The range profile of aspect angle α was obtained according to Equation (5). Then, range gates were implemented to extract the target data from the range profile. For the adaptive range gate method, the size of the range gate was decided by the radial projection size of aspect angle α and the maximum radial projection size of the target. As for the size of the conventional range gate method, a fixed value determined by the maximum radial projection size of the target was applied. The data filtered by the range gate of aspect angle α corresponded to the echo of the scattering center. After calibration, the measured RCS of the target at aspect angle α was finally obtained.
Here in this work, the method of the relative calibration was adopted. In the experiments, the RCS of a standard object (a metallic sphere) was measured in advance under the same condition. The influence of the measurement environment was, therefore, accounted in the relative calibration procedure [19]. The calibrated RCS result of the measured target at a certain aspect angle σt(α) could then be obtained:
where E0 (α) is the measured echo of the metallic sphere, Et(α) is the measured echo of the target, and σ0(α) is the theoretical value of the metallic sphere.
4. Experimental Results and Analysis
The measurement results are presented in this section. Figure 8a illustrates the correlation between the azimuthal angle and the position of the measured cylinder. The measured range profiles at the aspect angle of 0° and 90° in the time domain at 220 GHz and 440 GHz are shown in Figure 8b,c, respectively.
As demonstrated, the distribution of the scattering zone in the range profile was dependent on the azimuthal angle. This was caused by the variation in the radial projection dimension of the target. At 0°, the radial projection dimension corresponded to the height of the cylinder, while at angle 90° the radial projection was relevant to the diameter of the cylinder.
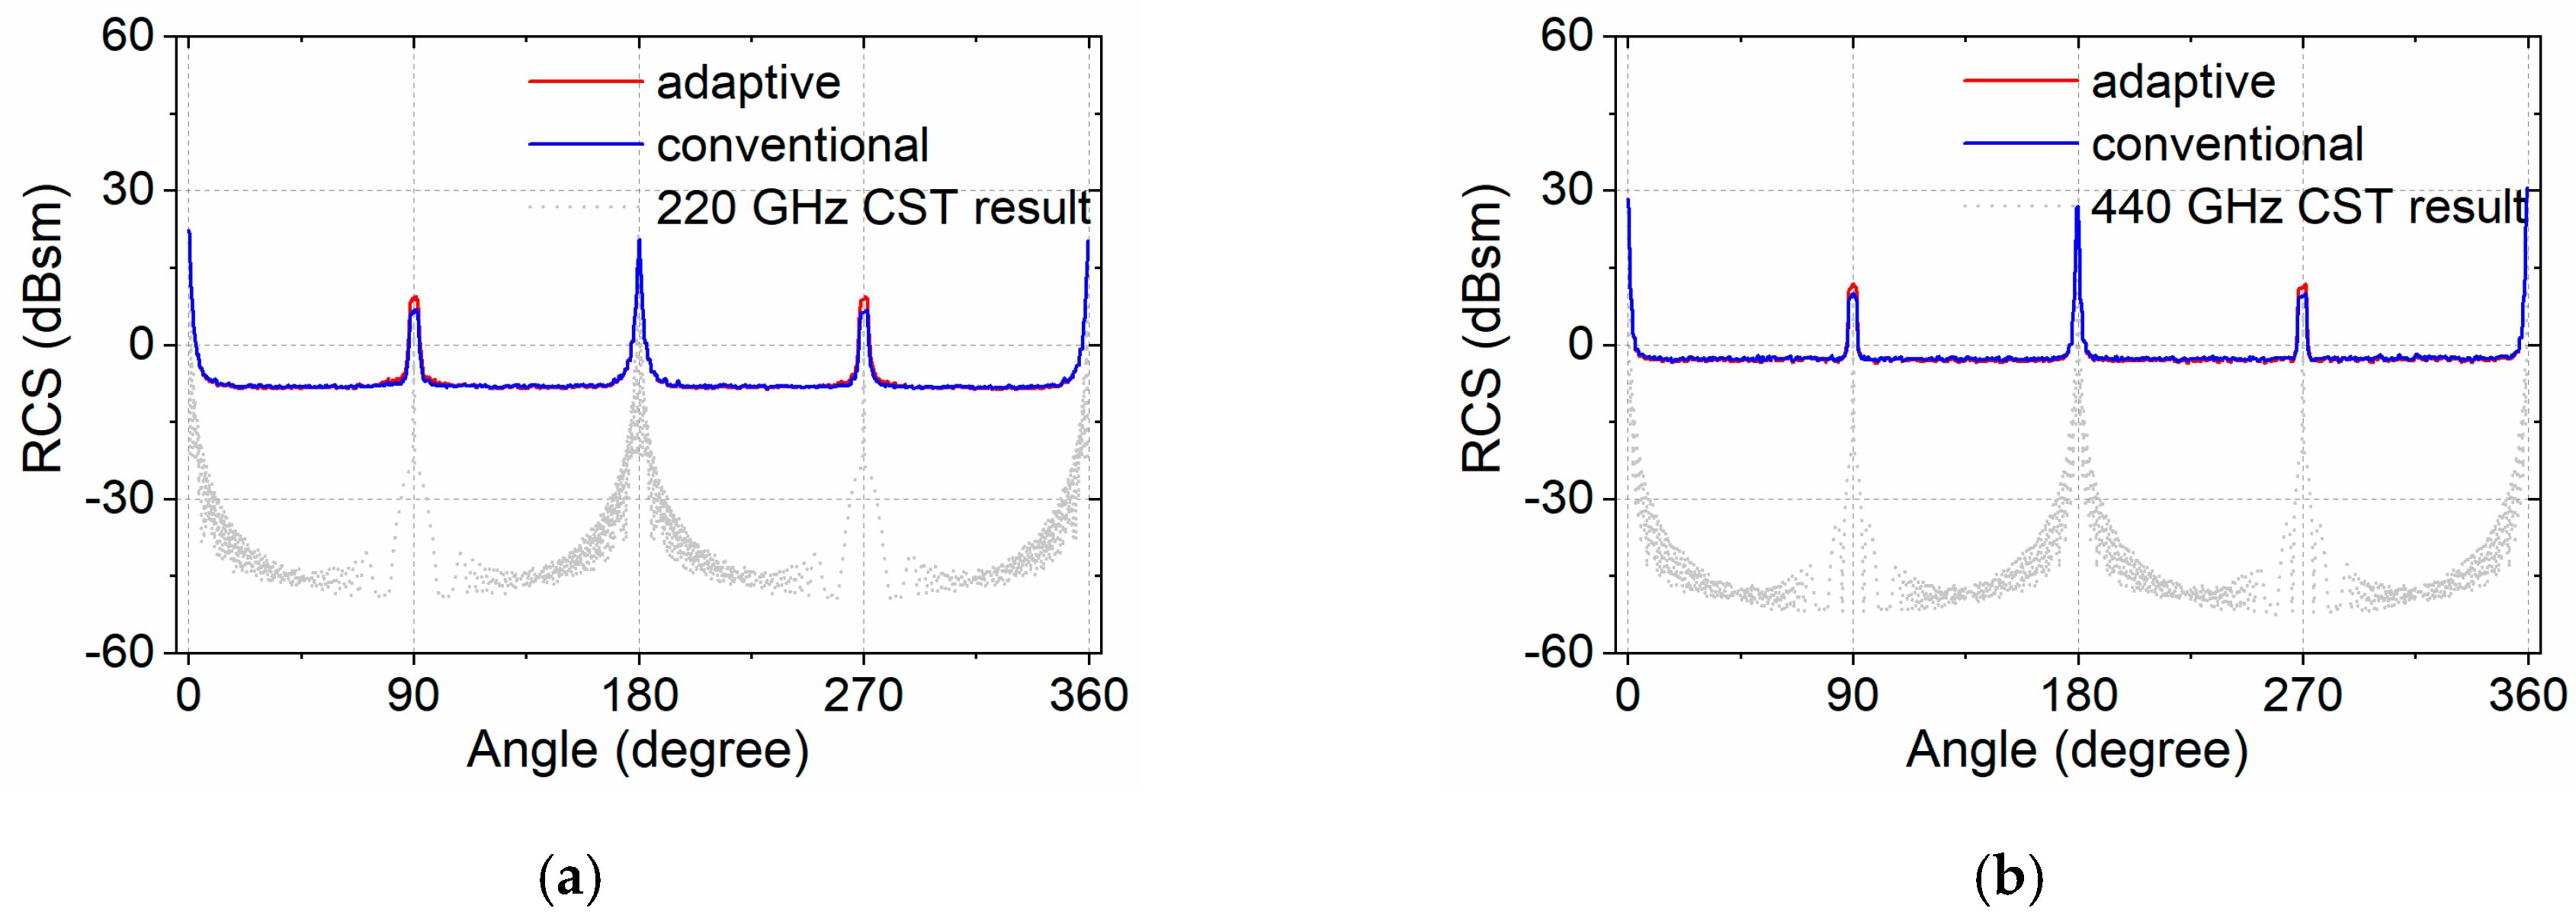
Figure 9 shows the RCS measurement results of the metallic cylinder at 220 GHz and 440 GHz, respectively. Comparisons were made between conventional range gates and our adaptive range gates. As illustrated, for specular reflections at 0° and 180°, the difference between the two methods was negligible as the dimensions of conventional range gates and adaptive rage gates were comparable. However, notable differences were realized at 90° and 270°, corresponding to the reflection from the side face of the cylinder. The results obtained from adaptive range gates were higher. This was contributed by the reduced noise collected by the adaptive range gates, indicating improved isolation between target and clutter.
In addition, the measurement results were compared with electromagnetism-simulated RCS values, calculated by the commercial software CST, denoted by the dash lines in Figure 9. The simulation results were computed by the asymptotic solver, based on the shooting and bouncing rays (SBR) technique in the frequency domain. The solver is typically designed for efficient scattering calculation of electrically very large objects, while the contribution edge diffractions are still considered. The simulation results were first compared with theoretical RCS values of standard objects including metallic spheres, plates, cylinders, etc. Good agreements were met, confirming the reliability of the numerical calculation [21]. Compared to the calculated results, the RCS measurement errors—corresponding to the side faces—were significantly reduced by applying the adaptive range gates (2.58 dBsm at 220 GHz and 1.82 dBsm at 440 GHz), owing to the suppressed influence of the clutter. Although the absolute SNRs of the two spectra were different due to the difference in transmission power, an improvement in signal quality and measurement accuracy in both spectra were observed. This suggested an improvement in the SNR by applying the adaptive range gate method.
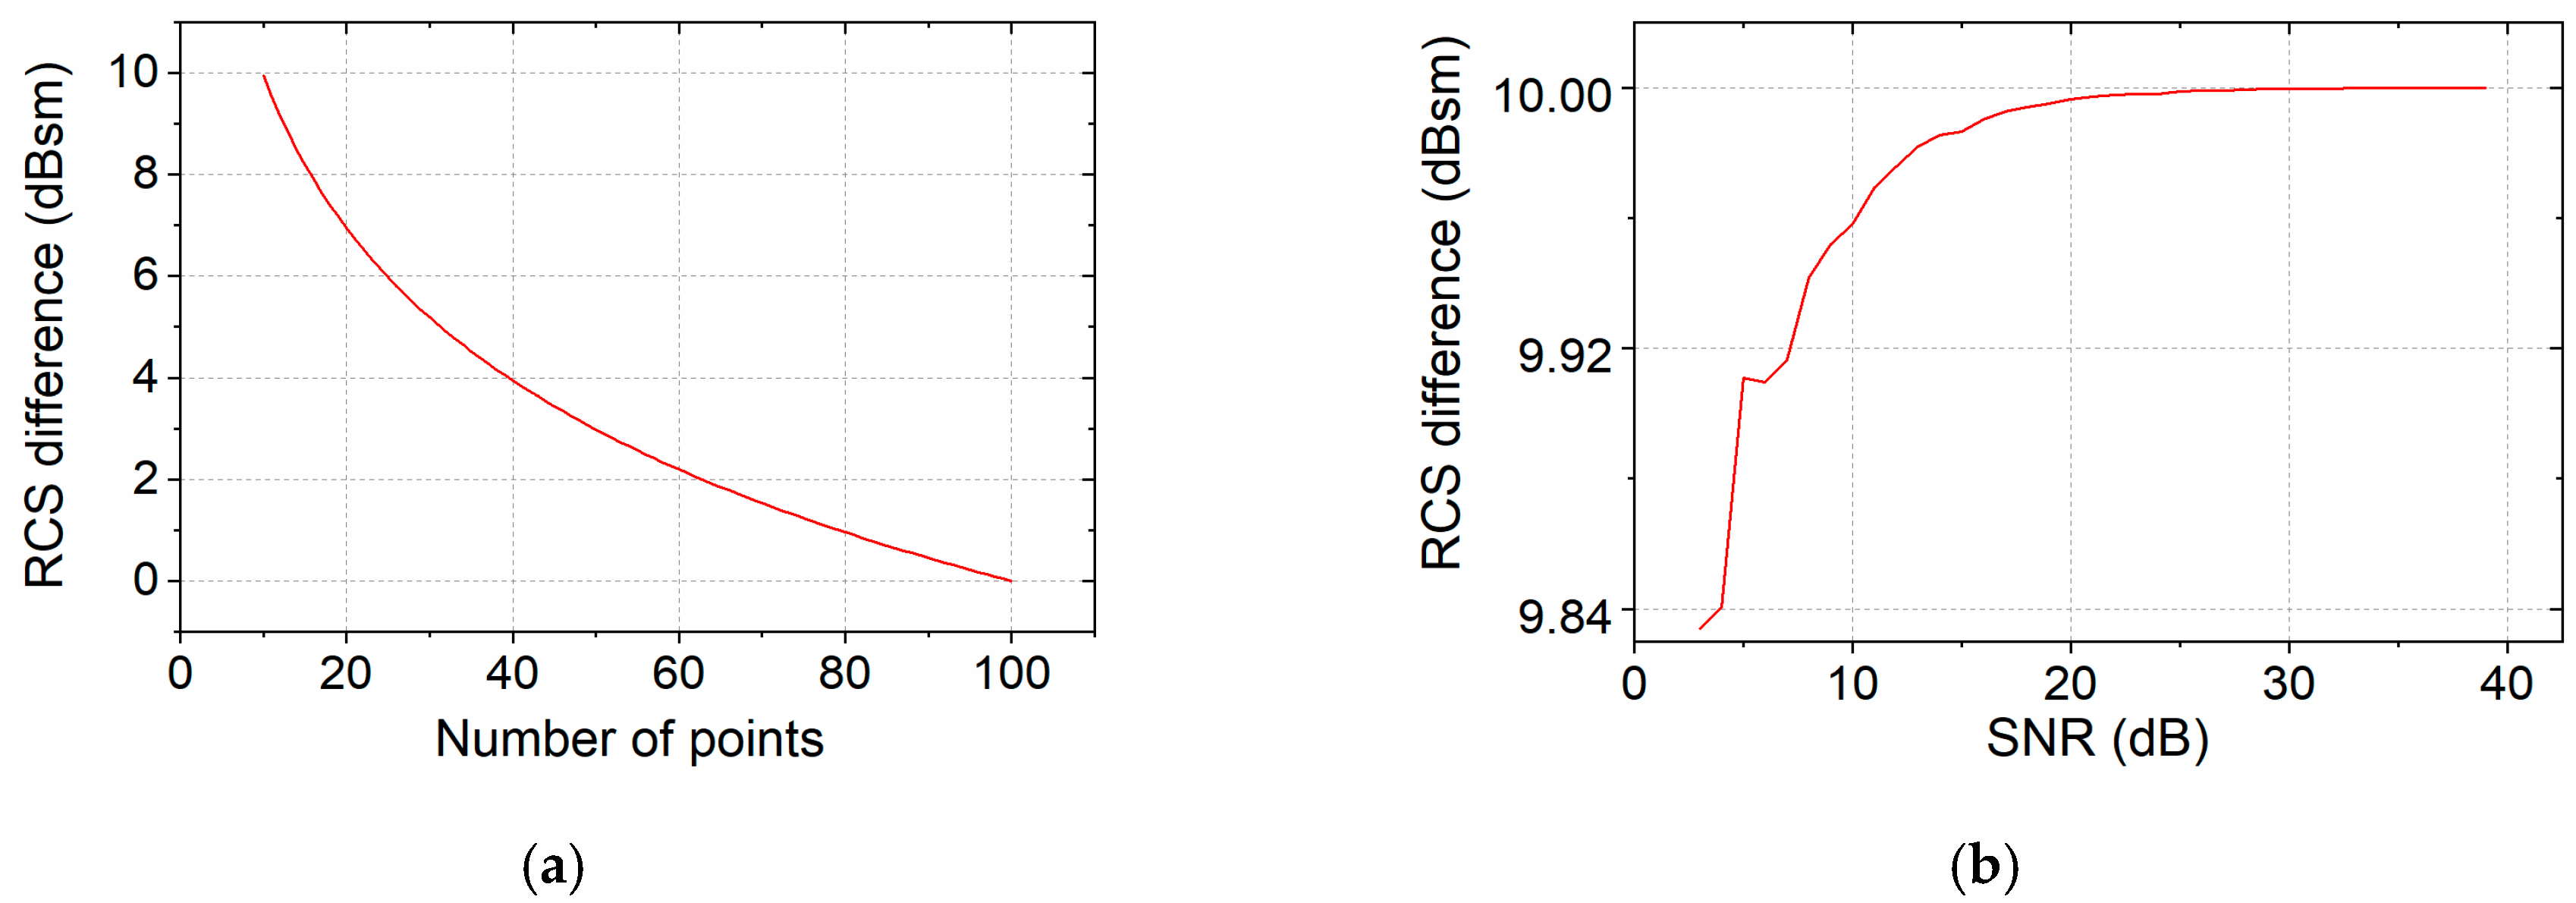
The effectiveness of our proposed method was further investigated by simulation. The simulation is carried out at 220 GHz. The RCS of a metallic cylinder with a large length-width ratio (height 60 cm and radius 3 cm) was calculated with the conventional range gate and adaptive range gate, respectively. The effectiveness of the adaptive range gate was quantitively evaluated by the difference in the RCS from the two methods, corresponding to the side face of the cylinder. The influences of two key factors in the adaptive range gate method were studied, i.e., the dimension of the range gate and the SNR of the measurement system. Figure 10a shows the variation of the RCS difference when the size of the range gate changed from 10 points to 100 points. The 100 point range gate corresponded to the dimension of the conventional range gates, while the 10 point range gate corresponded to the minimum used in the adaptive range gate method. Its dimension was approximately 15 cm, which was sufficiently large to capture all the echoes from the target. As the dimension of the range gate increased, the RCS difference reduced. This verified that the improvement in measurement accuracy was caused by the suppressed clutter with the reduced range gate dimension. Figure 10b shows the effectiveness of our method at different SNR levels, ranging from 3 dB to 40 dB. This simulation was conducted to explore the relationship between the improvement in the RCS using the adaptive range gate method and the SNR of the system. The difference in the RCS compared to conventional range gates was slightly increased with the increasing SNR of the system, while saturated at an SNR of 25 dB. This indicated that our method could be effectively applied to RCS measurement systems regardless of its SNR.
In the end, the adaptability of the adaptive range gate method should be discussed. In our proposed method, the dimension of the range gate was determined by the radial projection of the target. Hence, the method could be applied in RCS measurements regardless of the motion status of the target. On the other hand, in the adaptive range gate method, a linear relationship between the geometrical radial projection and the dimension of the scattering center is assumed. This is applicable for convex objects without structures causing multiple reflections. For echoes from multiple reflections, the corresponding range profile may fall out of the linear adaptive range gate, leading to insufficient echo signal capturing. Therefore, currently, the adaptability of our proposed method is limit to convex targets. Non-linear adaptive range gates should be developed for non-convex structures in the future.
5. Conclusions
In this paper, an adaptive range gate method for RCS measurement in the terahertz region was presented as a method to suppress the clutter signal and improve the SNR of RCS measurement systems. The method was developed based on a high-resolution range profile. The performance of the method was evaluated by experimental measurements, as well as numerical simulations. In our experiments, the RCS measurements of a cylinder were conducted at 220 GHz and 440 GHz, respectively. The measurement results illustrate the superiority of our method in SNR and measurement accuracy, compared to conventional fixed range gates. Simulation studies were then carried out to verify the origin of the improvement and explore the feasibility of the method. In conclusion, the adaptive range gate method was effective in improving the SNR in THz RCS measurement, especially for targets with a large length-to-width ratio. This could also work as a reference for other techniques, which require high precision scattering data of targets such as high-resolution SAR and ISAR imaging, and micro-motion detection [14]. Future development should focus on the development of non-linear adaptive range gates to extend the adaptability of the method to non-convex complex targets.
Author Contributions
S.P. conceived the adaptive range gate method, conducted the experiments and wrote the paper. Y.Z. provided theoretical guidance. Q.Y. revised the manuscript. B.D., Y.Q. and H.W. provided the experimental equipment.
Funding
This research was funded by The National Natural Science Foundation of China, grant number 61701513 and 61571011.
Conflicts of Interest
The authors declare no conflict of interest.
References
- Knott, E.F. Radar Cross Section; Artech House: Dedham, MA, USA, 1985. [Google Scholar]
- Ruan, Y.Z. Radar Cross Section and Stealth Technology; National Defense Industry Press: Beijing, China, 1998; pp. 6–10. [Google Scholar]
- Knott, E.F. Radar Cross Section Measurements; Van Nostrand Reinhold: New York, NY, USA, 1993. [Google Scholar]
- Dybdal, R.B. Radar Cross Section Measurements. IEEE Trans. Antennas Propag. 1987, 75, 498–516. [Google Scholar] [CrossRef]
- Cheng, Y.Q.; Zhou, X.L.; Xu, X.W.; Qin, Y.L.; Wang, H.Q. Radar Coincidence Imaging with Stochastic Frequency Modulated Array. IEEE J. Sel. Top. Signal Process. 2016, 99, 1. [Google Scholar] [CrossRef]
- Wang, H.Q.; Deng, B.; Qin, Y.L. Review of Terahertz Radar Technology. J. Radars 2018, 7, 1–21. [Google Scholar]
- Chopra, N.; Yang, K.; Abbasi, Q.H.; Qaraqe, K.; Philpott, M.; Alomainy, A. THz Time Domain Spectroscopy of Human Skin Tissue for In-Body Nano-networks. IEEE Trans. Terahertz Sci. Technol. 2016, 6, 803–809. [Google Scholar] [CrossRef]
- Iwaszczuk, K.; Heiselberg, H.; Jepsen, P. Terahertz Radar Cross Section Measurements. Opt. Express 2010, 18, 26399–26408. [Google Scholar] [CrossRef] [PubMed]
- Coulombe, M.J.; Horgan, T.; Waldman, J.; Szatowski, G.; Nixon, W. A 524 GHz Polarimetric Compact Range for Scale Model RCS Measurements. In Proceedings of the Antenna Measurement Techniques Association 21st Annual Meeting & Symposium (AMTA ‘99), Monterey Bay, CA, USA, 4–8 October 1999; pp. 458–463. [Google Scholar]
- Samoska, L.A. An Overview of Solid-State Integrated Circuit Amplifiers in the Submillimeter-Wave and THz Regime. IEEE Trans. Terahertz Sci. Technol. 2011, 1, 9–24. [Google Scholar] [CrossRef] [Green Version]
- Beaudoin, C.J.; Horgan, T.; Demartinis, G.; Coulombe, M.J.; Goyette, T.; Gatesman, A.J.; Nixon, W.E. A Prototype Fully Polarimetric 160-GHz Bistatic ISAR Compact Radar Range. In Proceedings of the SPIE 10188, Radar Sensor Technology XXI, Anaheim, California, CA, USA, 1 May 2017. [Google Scholar]
- Cooper, K.B.; Dengler, R.J.; Chattopadhyay, G.; Schlecht, E.; Gill, J.; Skalare, A.; Mehdi, I.; Siegel, P.H. A High-Resolution Imaging Radar at 580 GHz. IEEE Microw. Wirel. Compon. Lett. 2008, 18, 64–66. [Google Scholar] [CrossRef]
- Macfarlane, D.G.; Robertson, D.A.; Bryllert, T. Pathfinder—A High Resolution 220 GHz Imaging Radar Providing Phenomenological Data for Security Scanner Development. In Proceedings of the 2016 41st International Conference on Infrared, Millimeter, and Terahertz Waves (IRMMW-THz), Copenhagen, Denmark, 25–30 September 2016. [Google Scholar]
- Yang, Q.; Qin, Y.L.; Deng, B.; Wang, H.Q.; You, P. Micro-Doppler Ambiguity Resolution for Wideband Terahertz Radar Using Intra-Pulse Interference. Sensors 2017, 17, 993. [Google Scholar] [CrossRef] [PubMed]
- Chen, G.; Dang, H.X.; Tan, X.M.; Chen, H.; Cui, T.J. Scattering Properties of Electromagnetic Waves from Randomly Oriented Rough Metal Plate in the Lower Terahertz Region. J. Radars 2018, 7, 75–82. [Google Scholar]
- Song, Y.; Li, Y.P.; Pang, S.; Zhao, S.S.; Wang, H.Q. RCS Measurement at Terahertz Waves for Cylinders with Different Surface Roughness. Electron. Lett. 2018, 54, 714–716. [Google Scholar] [CrossRef]
- Choe, W.; Jeong, J. A Broadband THz On-Chip Transition Using a Dipole Antenna with Integrated Balun. Electronics 2018, 7, 236. [Google Scholar] [CrossRef]
- Siegel, P.H.; de Maagt, P.; Zaghloul, A.I. Antennas for Terahertz Applications. In Proceedings of the 2006 IEEE Antennas and Propagation Society International Symposium, Albuquerque, NM, USA, 9–14 July 2006. [Google Scholar]
- Zhang, X.L.; Li, N.J.; Hu, C.F.; Li, P. Scattering Characteristics Test and Imaging Diagnosis for Targets in Radar System; China Aerospace Publishing House: Beijing, China, 2009; pp. 1–47. [Google Scholar]
- Hu, C.F. Research on RCS Measurement System and Microwave Imaging Diagnosis Technology. Master’s Thesis, Northwestern Polytechnical University, Xi’an, China, March 2007. [Google Scholar]
- Li, Z.; Cui, T.J.; Zhong, X.J.; Tao, Y.B.; Lin, H. Electromagnetic Scattering Characteristics of PEC Targets in the Terahertz Regime. IEEE Antennas Propag. Mag. 2009, 51, 39–50. [Google Scholar]
Figure 1.
Evolution of a typical step-frequency (SF) signal composed of N pulses. (a) The frequency of the pulses increases by step in time; (b) The model of signals generated by the programmable network analyzer (PNA).
Figure 1.
Evolution of a typical step-frequency (SF) signal composed of N pulses. (a) The frequency of the pulses increases by step in time; (b) The model of signals generated by the programmable network analyzer (PNA).

Figure 2.
Schematic of the adaptive range gate.

Figure 3.
Comparison of two range gates at different azimuths. (a) Certain angles, (b) 0° to 360°.

Figure 4.
The schematic diagram of the radar system.

Figure 5.
The THz multiplier chains. (a) 220 GHz, (b) 440 GHz.

Figure 6.
The THz radar cross-section (RCS) measurement scene. (a) The measurement system, (b) The cylinder.
Figure 6.
The THz radar cross-section (RCS) measurement scene. (a) The measurement system, (b) The cylinder.

Figure 7.
The flowchart of the data extraction procedure to obtain the RCS of the target by the two range gate methods.
Figure 7.
The flowchart of the data extraction procedure to obtain the RCS of the target by the two range gate methods.

Figure 8.
The azimuthal angle configuration of the measurement (a) and the range profiles at 0° and 90° in the time domain and the respective adaptive range gates. (b) 220 GHz, (c) 440 GHz.
Figure 8.
The azimuthal angle configuration of the measurement (a) and the range profiles at 0° and 90° in the time domain and the respective adaptive range gates. (b) 220 GHz, (c) 440 GHz.

Figure 9.
RCS measurement results of a metallic cylinder. (a) 220 GHz, (b) 440 GHz.

Figure 10.
Comparison of RCS difference under two circumstances. (a) The variation of RCS difference with the size of the adaptive range gate, (b) the variation of RCS difference with SNR.
Figure 10.
Comparison of RCS difference under two circumstances. (a) The variation of RCS difference with the size of the adaptive range gate, (b) the variation of RCS difference with SNR.

© 2019 by the authors. Licensee MDPI, Basel, Switzerland. This article is an open access article distributed under the terms and conditions of the Creative Commons Attribution (CC BY) license (http://creativecommons.org/licenses/by/4.0/).
Share and Cite
MDPI and ACS Style
Pang, S.; Zeng, Y.; Yang, Q.; Deng, B.; Wang, H.; Qin, Y. Improvement in SNR by Adaptive Range Gates for RCS Measurements in the THz Region. Electronics 2019, 8, 805. https://doi.org/10.3390/electronics8070805
AMA Style
Pang S, Zeng Y, Yang Q, Deng B, Wang H, Qin Y. Improvement in SNR by Adaptive Range Gates for RCS Measurements in the THz Region. Electronics. 2019; 8(7):805. https://doi.org/10.3390/electronics8070805
Chicago/Turabian StylePang, Shuang, Yang Zeng, Qi Yang, Bin Deng, Hongqiang Wang, and Yuliang Qin. 2019. "Improvement in SNR by Adaptive Range Gates for RCS Measurements in the THz Region" Electronics 8, no. 7: 805. https://doi.org/10.3390/electronics8070805
Note that from the first issue of 2016, this journal uses article numbers instead of page numbers. See further details here.