Correction of Optical Delay Line Errors in Terahertz Time-Domain Spectroscopy
by
 , and
, and
Alexander Mamrashev
1,* ,
,
Fedor Minakov
1,2,
Lev Maximov
1,2,
Nazar Nikolaev
1 and
and
Pavel Chapovsky
2,3 1
Laboratory of Information Optics, Institute of Automation and Electrometry SB RAS, 630090 Novosibirsk, Russia
2
Physics Department, Novosibirsk State University, 630090 Novosibirsk, Russia
3
Laboratory of Nonlinear Spectroscopy of Gases, Institute of Automation and Electrometry SB RAS, 630090 Novosibirsk, Russia
*
Author to whom correspondence should be addressed.
Electronics 2019, 8(12), 1408; https://doi.org/10.3390/electronics8121408
Submission received: 24 October 2019
/
Revised: 18 November 2019
/
Accepted: 22 November 2019
/
Published: 26 November 2019
(This article belongs to the Special Issue Terahertz Technology and Its Applications)
Abstract
:One of the key elements of terahertz time-domain spectrometers is the optical delay line. Usually it consists of a motorized translation stage and a corner reflector mounted on its top. Errors in the positioning of the translation stage lead to various distortions of the measured waveform of terahertz pulses and, therefore, terahertz spectra. In this paper, the accuracy of position measurements is improved by using an optical encoder. Three types of systematic errors are found: Increasing and periodic offsets of the translation stage position, as well as a drift of its initial position in a series of consecutive measurements. The influence of the detected errors on the measured terahertz spectra is studied and correction methods are proposed.
1. Introduction
Terahertz time-domain spectroscopy (THz-TDS) has become one of the most common methods for studying optical and dielectric properties of materials in the frequency range of 0.1–10 THz with the development of femtosecond laser technology [1,2]. This method is used to study nonlinear optical crystals [3,4], nuclear spin isomers [5], complex biomolecules [6], and charge carriers in solids [7,8].
The principle of operation of terahertz time-domain spectrometers is based on the generation of terahertz pulses and measurement of their electric field waveform. An optical delay line allows changing of the path difference between generation and detection optical channels of the spectrometer. This enables point-by-point sampling of the terahertz pulse waveform. Digital Fourier transform is used to calculate the spectra of the measured signal that contain information on the absorption coefficient and the refractive index of the media under study. Details of the spectrometer operation will be discussed later.
Various elements of spectrometers exhibit random and systematic errors, leading to distortion of terahertz pulses and, therefore, terahertz spectra [9,10,11,12,13]. The errors in the amplitude of terahertz pulses are mainly determined by random fluctuations and the long-term drift of the THz generation system, which consists of a femtosecond pump laser and an optical-to-terahertz converter. Errors in the positioning of the optical delay line lead to more complex distortions. In [14], the effect of a drift of the initial position of the delay line in a series of sequentially measured terahertz pulses was considered. It was shown that it led to error proportional to the THz signal shifted by a quarter cycle. Spectroscopy of thin films and attenuated total internal reflection spectroscopy are especially sensitive to such error [15]. In [16], random errors of optical delay line positioning were considered. It was shown by Monte Carlo modeling that the terahertz spectrum was impaired by spectrally independent additive noise, which was directly proportional to the noise in the time domain and the square root of the sampling time steps of THz pulses. It was shown in [17] that periodic sampling error results in the presence of spurious mirror copies of the main pulse spectra, in which frequency and amplitude depend on the period and amplitude of the error, respectively.
Optical delay lines in THz spectrometers are usually based on corner reflectors on mechanical translation stages driven by voice coils or stepper motors. There are also conceptually different non-mechanical approaches for shifting time delay between generation and detection optical channels such as ECOPS and ASOPS techniques [18,19]. Imperfections in mechanical translation stages lead to positioning errors that are usually not considered by THz-TDS operators. However, these errors can be eliminated by software or hardware solutions. Algorithms are used to correct the time shift in a series of measured THz pulses [20,21]. Interferometers are used to more accurately measure the delay line position [22]. However, they require additional laser, optical elements and electronics making overall setup more expensive and difficult to operate.
In this paper, we propose a simple and cost-effective method to improve the accuracy of optical delay line positioning by using an optical encoder. We detect systematic positioning errors, study their effects on the measured terahertz spectra, and propose correction methods. The studies are conducted on a custom-made THz spectrometer with a delay line based on a motorized translation stage upgraded with the optical encoder.
2. Experimental Setup and Measurement Procedure
2.1. THz Spectrometer
To study the random and systematic errors of the optical delay line and the effect of these errors on the measured terahertz spectra, experiments were carried out on a THz spectrometer created in the Institute of Automation and Electrometry of Siberian Branch of Russian Academy of Sciences. The experimental setup is a standard terahertz time-domain spectrometer (Figure 1). The source of the femtosecond pump and probe pulses is an Er-doped fiber laser with a second harmonic generation module FFS-SHG (Toptica Photonics AG, Munich, Germany) providing radiation with the following parameters: Central wavelength—775 nm, pulse duration—130 fs, and mean power—80 mW. A photoconductive antenna iPCA-21-05-300-800-h with microlense array and interdigitated electrodes on semi-insulating GaAs substrate (Batop GmbH, Jena, Germany) serve as a THz generator. The terahertz field is detected by electro-optic sampling in a (110)-cut 2 mm ZnTe crystal. In this method, the probe pulse passes through ZnTe crystal that became birefringent under terahertz electric field and changes polarization. A quarter-wave plate and a Wollaston prism split the probe pulse into two beams with orthogonal linear polarizations. A pair of photodiodes detect the difference between the powers of two beams which is proportional to the electric field of the terahertz radiation. The differential signal is measured by a lock-in amplifier SR830 (Stanford Research Systems, Sunnyvale, CA, USA) tuned to the frequency of ~8 kHz provided by an iPCA voltage generator.
The optical path lengths of generation and detection arms are equal so that the terahertz pulse and probe laser pulse synchronously arrive at the detection crystal. The optical delay line allows changing of the optical path length of the detection arm and sampling of the terahertz pulse waveform. The Fourier transform of the measured waveform gives its spectrum. The delay line is a motorized translation stage 8MT173-50-20 (Standa Ltd., Vilnius, Lithuania) with a corner reflector mounted on its top. For such setup movement of the translation stage by a distance of Δl corresponds to a time delay of Δt = 2·Δl/c, where c is the speed of light.
2.2. Upgraded Optical Delay Line
The leadscrew of the translation stage 8MT173-50-20 is driven by a stepper motor operated by an 8SMC1-USBhF motion controller. Full step resolution of the motor is Δl = 1.25 μm which corresponds to a time delay of Δt = 8.34 fs. The controller provides resolution down to 1/8 of the step, speed up to 5 mm/s, long-range movements with programmable acceleration and deceleration. One revolution of the screw corresponds to a movement of Δl1 = 250 μm, i.e., Δt1 = 1.67 ps in the time domain. The full movement range is L = 50 mm, i.e., T = 334 ps. The controller of the stage measures only its relative position (there are no absolute data) by counting the number of steps done by a stepper motor.
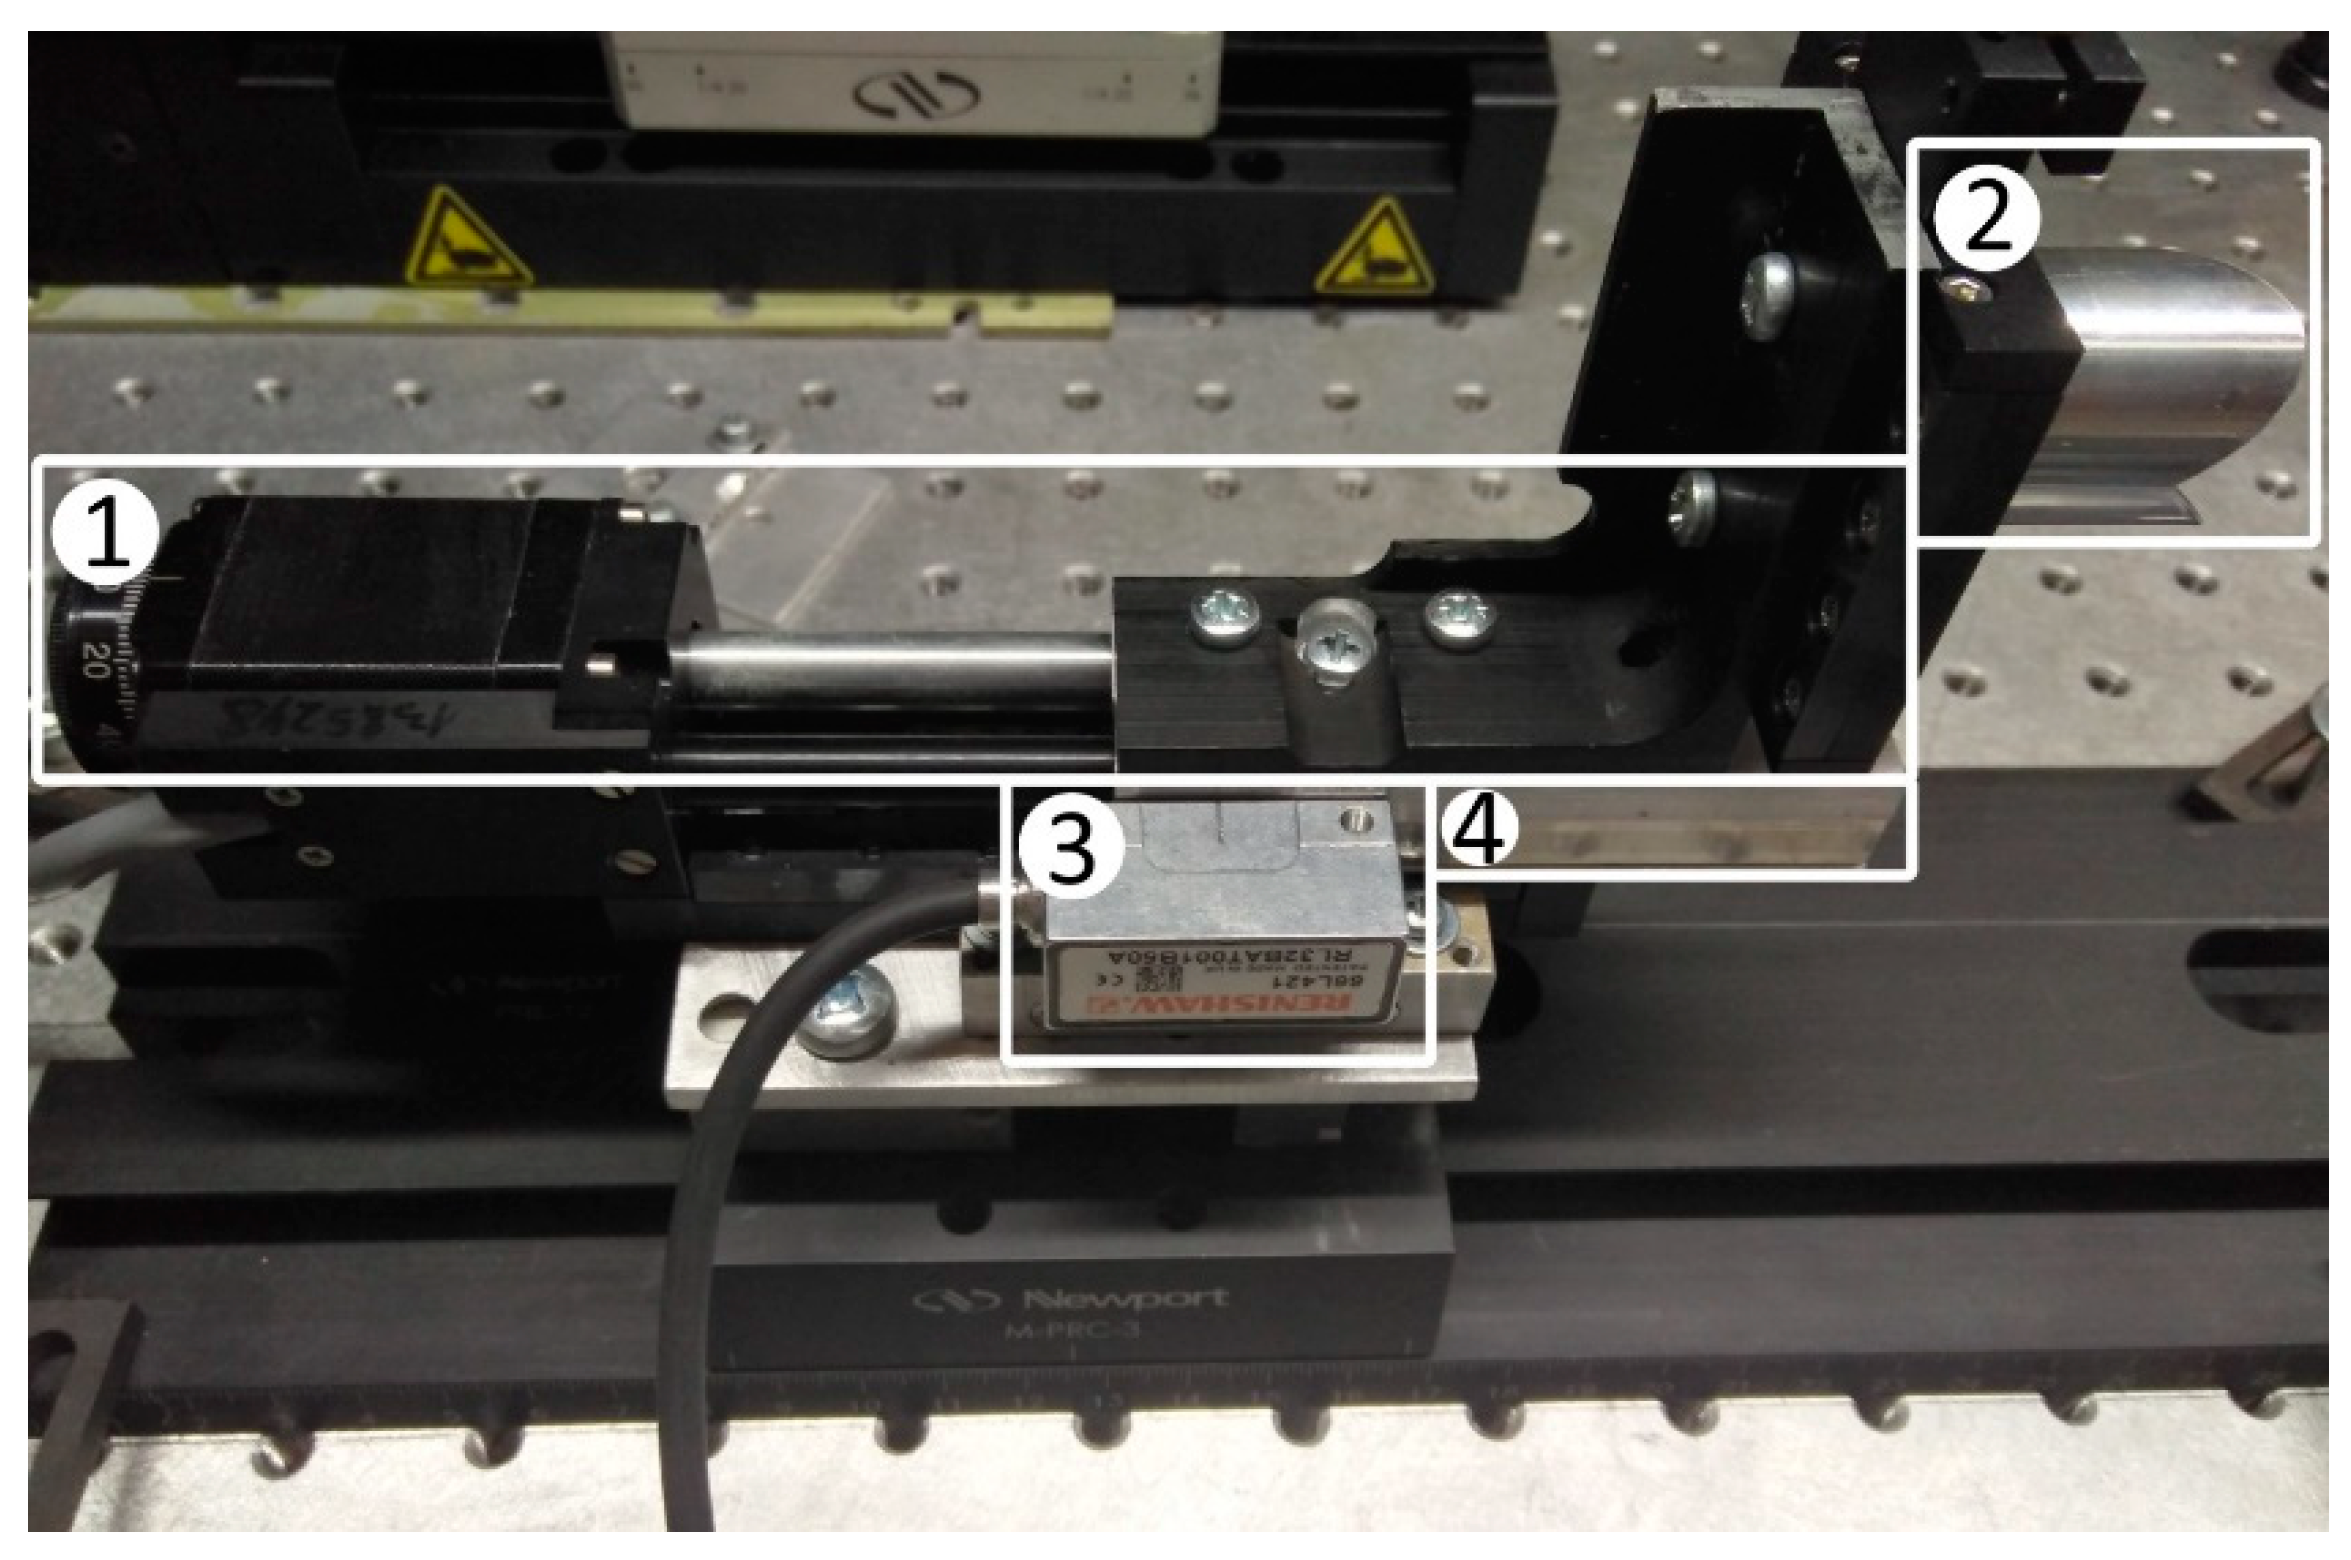
To study random and systematic errors of the optical delay line, a Resolute RL32BAT001B50 optical encoder with an absolute scale RTLA (Renishaw, Gloucestershire, United Kingdom) was installed on the translation stage (Figure 2). The readhead of the optical encoder scans the scale with a code allowing determination of the absolute position of the readhead relative to the scale. The scale is a low-profile stainless-steel tape. The accuracy of the scale is ± 5 μm/m, the coefficient of thermal expansion at the temperature of 20 °C is 10.1 ± 0.2 μm/m/°C. The resolution and sub-divisional error of the position measurements are 1 nm and ± 40 nm, respectively. For our task, a scale segment of 10 cm is cut, hence its absolute positioning accuracy is 0.5 μm, and the coefficient of thermal expansion is 1.01 μm/°C. These values correspond to the time domain absolute accuracy of ± 3.34 fs and random error of ± 0.27 fs. The readhead and its communication protocol support the sampling rate up to 25 kHz.
The design of the mounting of the optical encoder and the scale allows us quick exchange between four analogous translation stages for testing of their accuracies. The design also allows us to adjust the readhead inclination and its position in two axes and set the encoder to the optimal reading state. After adjustment, the readhead is fixed, and the scale mounted on the translation stage platform moves relative to the readhead.
2.3. Measurement Procedure
The measurements of the translation stage position were performed in a point-by-point manner. The translation stage speed was set to a default value of 0.78 mm/s. The measurements were performed with the step of 12.5 μm in the range of 45 mm. The step size of 12.5 um contained integer number of stepper motor full steps. When moving the translation stage, we recorded two sets of data: The position of the translation stage measured by counting stepper motor steps (Lst) and the position obtained from the optical encoder (Len). Values measured at the initial position of the translation stage were used as a reference (zero) position. A comparison of the Lst and Len positions was carried out for four analogous translation stages 8MT173-50-20 that are used in our terahertz spectrometer A comparison of the positions was carried out when the translation stages moved both in the positive and in the negative directions. No significant differences were found in these cases; therefore, further results are presented only for positive movement direction.
To assess the repeatability of the results an additional series of measurements for one of the translation stages positions was carried out. In this series, after each measurement, the translation stage returned to the zero starting position according to the value of Lst. The translation stage position was measured together with the terahertz pulse waveform. The lock-in amplifier time constant was set to 100 ms. We waited the amount of time required for the signal settlement at each point before saving the terahertz field measurement.
3. Results
Figure 3 shows the difference between the optical encoder measurements Len and the positions of the four translation stages Lst. All of them exhibit similar behavior. Two types of systematic errors can be seen in the figure: An increasing position difference and a periodic error. There are also sharp jumps in position due to scratches, damages, and other mechanical defects of the translation stage screw. Figure 3a shows an increasing offset of position relative to the more accurate data from the optical encoder for all four translation stages. Over the entire range, this offset has a magnitude of the order of tens of micrometers that significantly exceeds the encoder accuracy of 0.5 μm. As we zoom in (see Figure 3b) we can see some periodic position mismatch. The amplitude of the oscillations varies from 0.4 to 1 μm for different translation stages. The oscillation period is 250 μm, which corresponds to the full revolution of the translation stage screw.
The third type of systematic errors, a drift of the initial position is detected by repeated measurements of the first translation stage. Figure 4 shows the difference between the optical encoder measurements Len and the translation stage position Lst in a series of ten consecutive measurements. In the series, after each measurement, the translation stage was supposed to return to the zero starting position. However, Figure 4 shows that the initial position drifted according to the encoder measurements Len. The position shift was about 1 μm (corresponding to the time shift of 6.7 fs) between the first measurements and gradually decreased in the subsequent measurements in the series.
4. The Effect of Translation Stage Errors on Terahertz Spectra
For a start, an assessment of the distortions caused by the increasing position offset, i.e., a systematic error of the first type is made. We estimate the effect for one of the stages as an example. It has an offset of 16 μm in the range of 40 mm (see the red line in Figure 3a). The observed offset can be approximated by a straight line with a slope of α = –0.0004. Let E(tst) denote the amplitude of the terahertz signal. It depends on the time delay corresponding to the position of the translation stage. Time delay measured by the optical encoder ten can be expressed with the formula ten = tst + αtst. Therefore, the amplitude of the THz pulse equals E(ten /(1+α)) = E(α1ten), where α1 = 1.0004. We can see that the measured time-domain signal is stretched by the factor of α1 along the time axis. From the properties of the Fourier transform, it is clear that the spectrum is linearly squeezed along the frequency axis by the same factor. For example, for the frequency of 1 THz the corresponding frequency shift is 400 MHz. Such distortion becomes especially noticeable in spectra with narrow absorption lines.
Let us consider the influence of the second type of systematic error, i.e., oscillating mismatch between the optical encoder measurements and the position of the translation stage (see Figure 3b). According to [17], periodic positioning error leads to the emergence of spurious spectra. These spectra are mirror copies of the true spectrum of the THz pulse emerging around the frequency of the periodic error and its harmonics. In our case, the oscillation period of 250 μm corresponds to 1.67 ps in the time domain, which leads to the appearance of spurious spectra around the frequency of 600 GHz and its harmonics. The amplitude of the spurious spectra is proportional to the amplitude (~5 fs) and the frequency (600 GHz) of the periodic error according to the theoretical estimations in [17]. Thus, the proportionality coefficient can be calculated ≈ 3·10-3. The obtained value is comparable with the signal-to-noise ratio of the THz spectrometer, which makes it difficult to detect.
5. Correction
More accurate data from the optical encoder can be used to correct systematic errors of the delay line as well as errors due to the mechanical defects in the translation stage screw. For this, the THz electric field sampled at each position of the delay line is associated with the position more accurately measured by the optical encoder. Then by interpolation, the equidistance of the sampling positions is restored. As a result, the corrected waveform of the terahertz pulse is based on the positions measured with the optical encoder and does not contain systematic errors associated with the translation stage. The results of the correction algorithm that eliminates the systematic errors of the first and the second types are presented in Figure 5 and Figure 6, respectively.
In Figure 5 one can see an example of distortion caused by the error of the first type. We measure terahertz spectrum in the atmosphere containing water vapor that has many rotational absorption lines in the terahertz spectral range [5]. Thus, we can observe the effect of the error by studying THz spectra near two absorption lines of water vapor at 0.557 THz (Figure 5a) and at 1.411 THz (Figure 5b). As expected from the analysis of this error, the spectral shift increases with increasing frequency. It amounts to ~500 MHz for the line at 1.411 THz. Corrected spectra appear to be closer to the tabulated values of water absorption lines in HITRAN database [23] than the uncorrected ones.
We test the influence of the systematic error of the second type by measuring spectra of terahertz pulses passing through high-contrast quasi-optical bandpass filters. The filters are designed as multilayer frequency selective surfaces produced with technologies of photolithography and electroplating [24,25]. They were originally developed for spectro-radiometric applications in electron-beam-plasma experiments on generating high-power sub-terahertz radiation [25,26]. The filters have a bandwidth of 12%–20% and out-of-band transmission of ~10-4. Such filters provide us with an opportunity to clearly observe spurious terahertz spectra since they have a pronounced peak and near-zero out-of-band transmission.
Figure 6a shows the spectra of terahertz pulses passing through high-contrast bandpass filters with the center frequencies of 224, 264, and 312 GHz. It can be seen how the systematic error of the second type leads to the emergence of spurious spectra. The central frequencies of the false spectral features are 600 ± ν where 600 GHz is the frequency of the periodic error and ν is the filter frequency. Figure 6b shows the spectra for 376 GHz filter before and after correction. Its amplitude is ~580 times smaller than the amplitude of the main spectral feature and is practically at the noise level of the spectrometer.
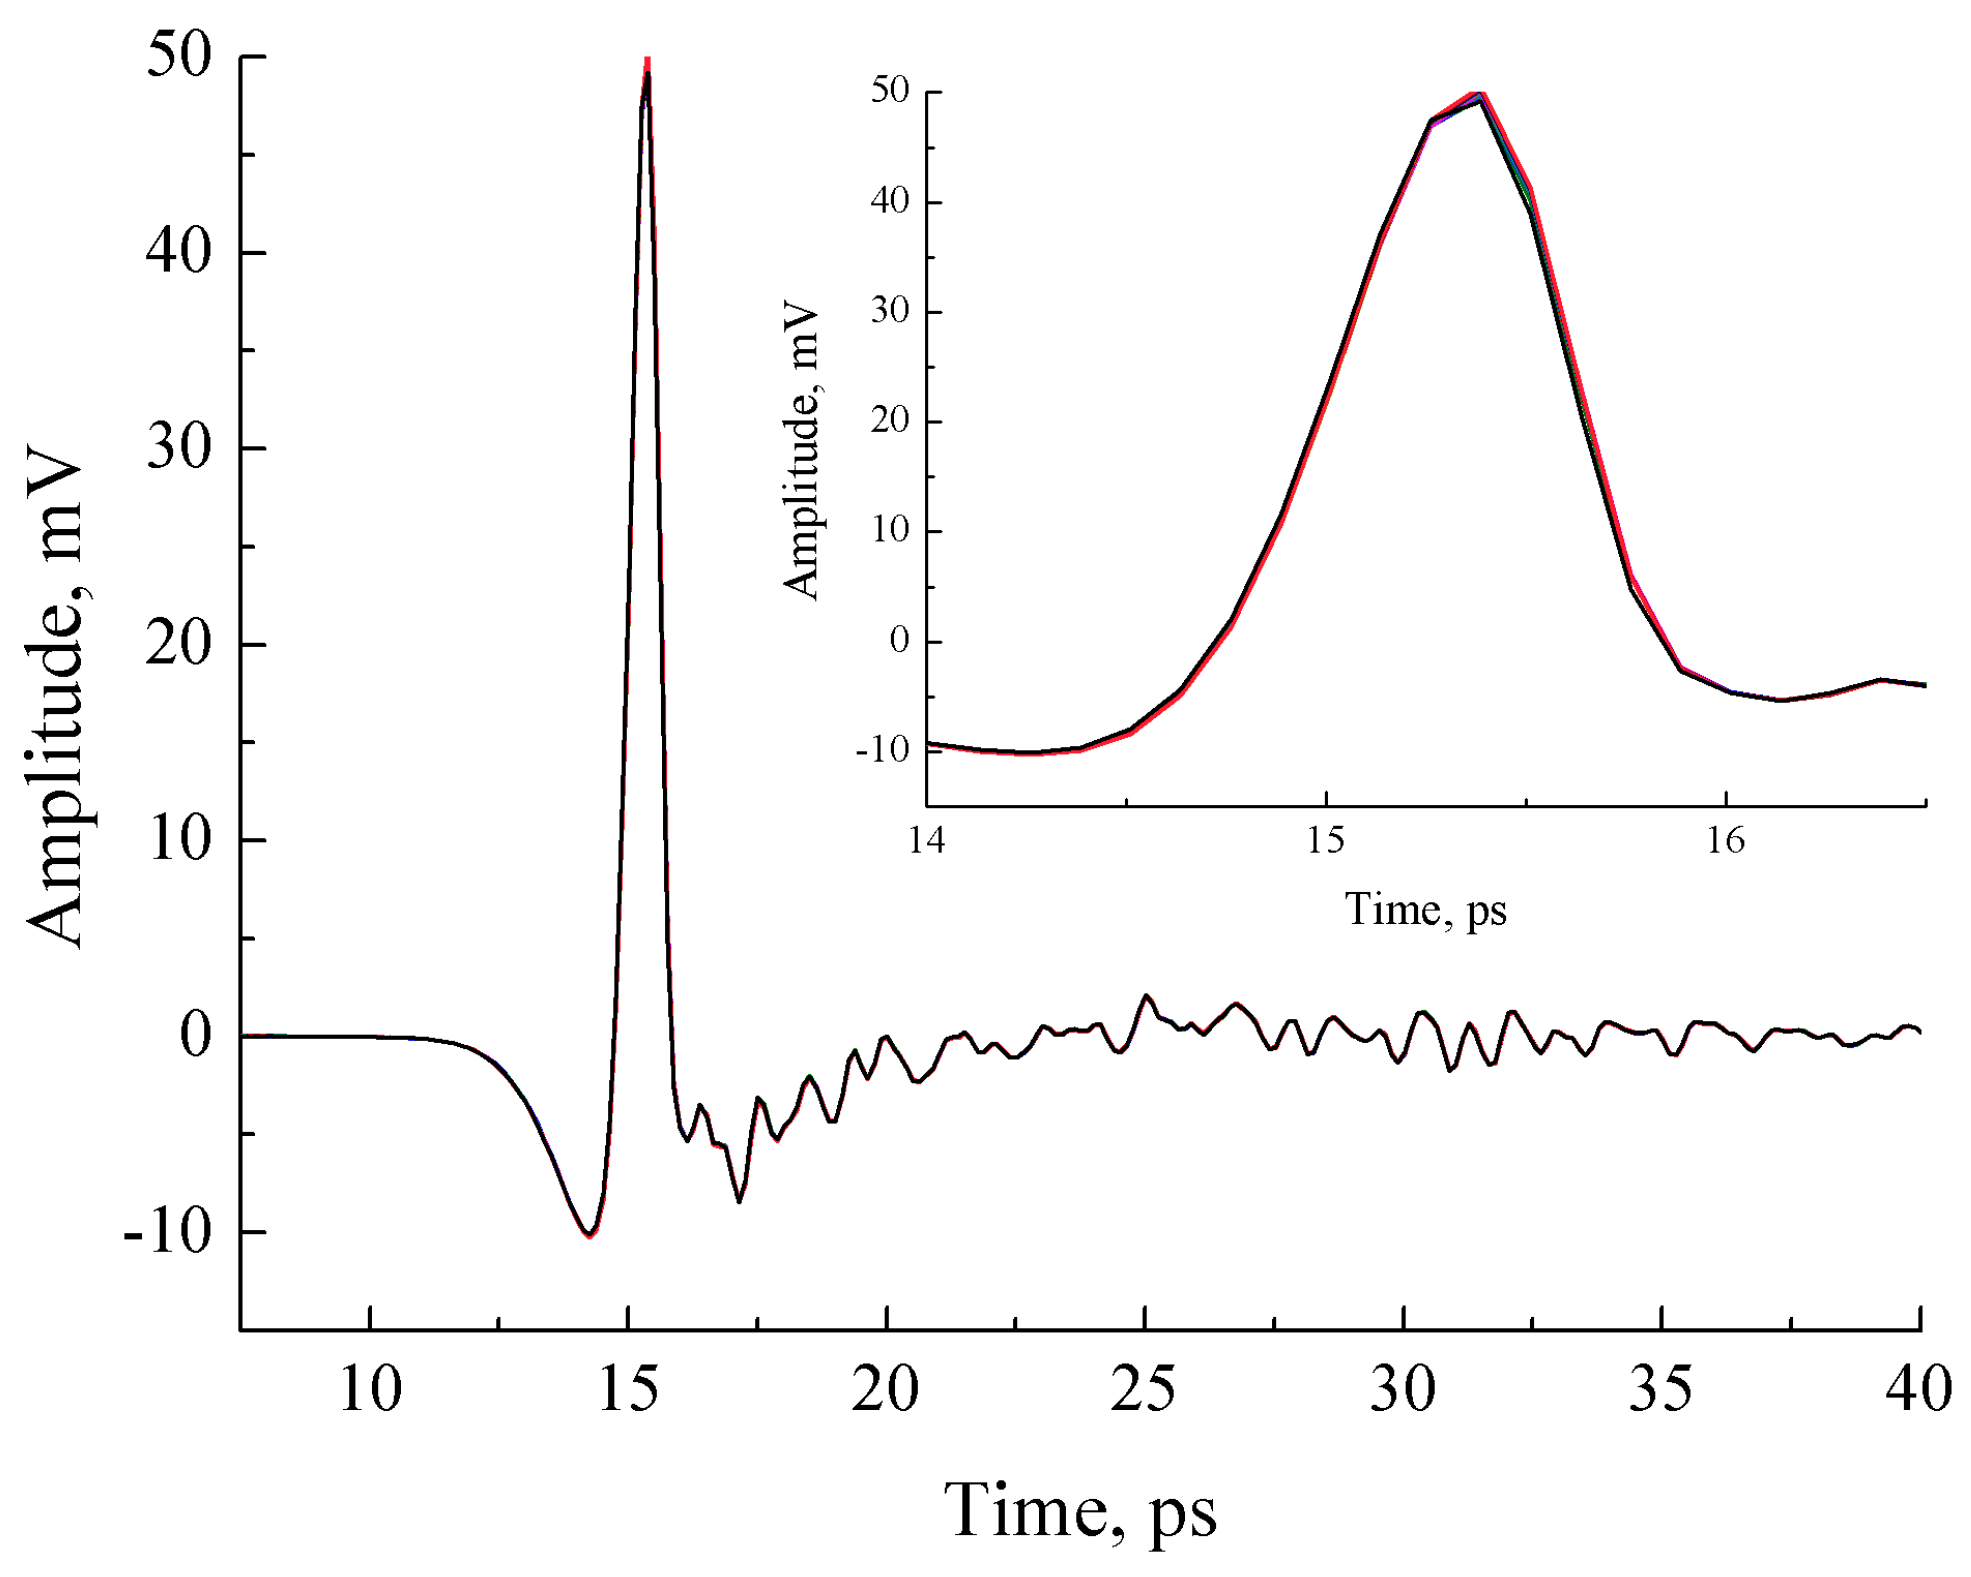
Lastly, we consider the systematic error of the third type. The drift of the initial position by 1 μm measured by the optical encoder (see Figure 4) should correspond to the time shift of 6.7 fs. However, such shift is barely noticeable in the waveforms of consecutively measured terahertz pulses (see Figure 7).
For clarity, we compare the initial position drift measured by encoder and time drift of THz pulses on the same scale in Figure 8. The drifts are calculated relative to the first measurement in the series. It can be seen that it takes more than 5 measurements until encoder position drift settles down at –3.5 μm. In contrast, time drift of THz pulses is significant only between the first and the second measurements due to translation stage backlash. Apparently, this discrepancy is associated with the heating of the stepper motor and translation stage platform during operation and the thermal expansion of the optical encoder scale. Heating by 1 °C leads to a shift of ~1 μm at the free end of the scale. As a result, setting the initial position based on counting steps of the translation stage stepper motor turns out to be more accurate than based on the optical encoder data. Residual THz time drift can be algorithmically compensated by time shift and interpolation of the signals [20,21].
6. Conclusions
In the work, we upgraded translation-stage-based optical delay line of the terahertz time-domain spectrometer. Additionally, we installed the optical encoder that made it possible to get more accurate information on the position of the translation stage during the terahertz measurements. We were able to study systematic errors associated with the translation stage without the optical encoder. We also used encoder positioning data to programmatically correct these errors. The proposed method is similar to interferometry-aided terahertz spectroscopy. However, the encoder is cheaper, easier to install and operate while having comparable accuracy.
Using the encoder, we detected three different types of systematic errors in the optical delay line. Firstly, an increasing difference in positions measured by the stepper motor of the translation stage and the optical encoder. This error led to a linear distortion of terahertz spectra along the frequency axis, which is especially critical in gas spectroscopy. Secondly, a periodic positioning error associated with the revolution of the translation stage screw was observed. It was shown that this error led to the appearance of spurious spectra having amplitude on the order of ~10-3 compared to the main pulse spectrum near the frequency of 600 GHz. The appearance of the spurious spectrum was demonstrated by studying the transmission of a band-pass filter with a central frequency of 376 GHz. Thirdly, in a series of ten consecutive measurements of terahertz pulses with the same delay line, a shift in the initial position of the translation stage was detected. Apparently, this effect appeared due to the heating of the stepper motor and translation stage platform during operation, which led to the heating of the optical encoder measuring scale.
It was shown that the measurements by the easy-to-use optical encoder can be employed to correct the first two types of positioning errors. In addition, the correction allowed us comprehensive elimination of the influence of scratches, damages, and other mechanical defects of the translation stage screw on the measured position. To correct the error of the initial position and increase the signal-to-noise ratio, it was proposed to use software correction methods.
Author Contributions
Conceptualization, P.C. and A.M.; Methodology, P.C. and A.M.; Software, F.M.; Validation, A.M., F.M., and L.M.; Formal analysis, A.M., F.M., and L.M.; Investigation, F.M. and N.N.; Resources, N.N.; Data curation, F.M.; Writing—original draft preparation, F.M. and A.M.; Writing—review and editing, A.M., P.C., and N.N.; Visualization, F.M. and A.M.; Supervision, P.C.; Project administration, P.C.; Funding acquisition, P.C.
Funding
This research was funded by the Russian Science Foundation (RSF), grant number 17-12-01418.
Acknowledgments
The authors would like to thank Sergey Kuznetsov for providing bandpass terahertz filters for 224, 264, 312, and 376 GHz.
Conflicts of Interest
The authors declare no conflict of interest.
References
- Jepsen, P.U.; Cooke, D.G.; Koch, M. Terahertz spectroscopy and imaging - Modern techniques and applications. Laser Photonics Rev. 2011, 5, 124–166. [Google Scholar] [CrossRef]
- Baxter, J.B.; Guglietta, G.W. Terahertz spectroscopy. Anal. Chem. 2011, 83, 4342–4368. [Google Scholar] [CrossRef] [PubMed]
- Antsygin, V.; Mamrashev, A.; Nikolaev, N.; Potaturkin, O.; Bekker, T.; Solntsev, V. Optical properties of borate crystals in terahertz region. Opt. Commun. 2013, 309, 333–337. [Google Scholar] [CrossRef]
- Mamrashev, A.; Nikolaev, N.; Antsygin, V.; Andreev, Y.; Lanskii, G.; Meshalkin, A. Optical Properties of KTP Crystals and Their Potential for Terahertz Generation. Cryst. 2018, 8, 310. [Google Scholar] [CrossRef]
- Mamrashev, A.A.; Maximov, L.V.; Nikolaev, N.A.; Chapovsky, P.L. Detection of Nuclear Spin Isomers of Water Molecules by Terahertz Time-Domain Spectroscopy. IEEE Trans. Terahertz Sci. Technol. 2018, 8, 13–18. [Google Scholar] [CrossRef]
- Xie, L.; Yao, Y.; Ying, Y. The Application of Terahertz Spectroscopy to Protein Detection: A Review. Appl. Spectrosc. Rev. 2014, 49, 448–461. [Google Scholar] [CrossRef]
- Ulbricht, R.; Hendry, E.; Shan, J.; Heinz, T.F.; Bonn, M. Carrier dynamics in semiconductors studied with time-resolved terahertz spectroscopy. Rev. Mod. Phys. 2011, 83, 543–586. [Google Scholar] [CrossRef]
- Lloyd-Hughes, J.; Jeon, T.-I. A Review of the Terahertz Conductivity of Bulk and Nano-Materials. J. Infrared Millimeter Terahertz Waves 2012, 33, 871–925. [Google Scholar] [CrossRef]
- Duvillaret, L.; Garet, F.; Coutaz, J.-L. Influence of noise on the characterization of materials by terahertz time-domain spectroscopy. J. Opt. Soc. Am. B 2000, 17, 452. [Google Scholar] [CrossRef]
- Withayachumnankul, W.; Fischer, B.M.; Lin, H.; Abbott, D. Uncertainty in terahertz time-domain spectroscopy measurement. J. Opt. Soc. Am. B 2008, 25, 1059. [Google Scholar] [CrossRef]
- Krüger, M.; Funkner, S.; Bründermann, E.; Havenith, M. Uncertainty and ambiguity in terahertz parameter extraction and data analysis. J. Infrared, Millimeter Terahertz Waves 2011, 32, 699–715. [Google Scholar] [CrossRef]
- Naftaly, M. Metrology issues and solutions in THz time-domain spectroscopy: Noise, errors, calibration. IEEE Sens. J. 2013, 13, 8–17. [Google Scholar] [CrossRef]
- Zaytsev, K.; Gavdush, A.A.; Karasik, V.E.; Alekhnovich, V.I.; Nosov, P.A.; Lazarev, V.A.; Reshetov, I.V.; Yurchenko, S.O. Accuracy of sample material parameters reconstruction using terahertz pulsed spectroscopy. J. Appl. Phys. 2014, 115, 193105. [Google Scholar] [CrossRef]
- Cohen, N.; Handley, J.W.; Boyle, R.D.; Braunstein, S.L.; Berry, E. EXPERIMENTAL SIGNATURE OF REGISTRATION NOISE IN PULSED TERAHERTZ SYSTEMS. Fluct. Noise Lett. 2006, 6, L77–L84. [Google Scholar] [CrossRef]
- Soltani, A.; Probst, T.; Busch, S.F.; Schwerdtfeger, M.; Castro-Camus, E.; Koch, M. Error from Delay Drift in Terahertz Attenuated Total Reflection Spectroscopy. J. Infrared Millimeter Terahertz Waves 2014, 35, 468–477. [Google Scholar] [CrossRef]
- Jahn, D.; Lippert, S.; Bisi, M.; Oberto, L.; Balzer, J.C.; Koch, M. On the Influence of Delay Line Uncertainty in THz Time-Domain Spectroscopy. J. Infrared Millimeter Terahertz Waves 2016, 37, 605–613. [Google Scholar] [CrossRef]
- Rehn, A.; Jahn, D.; Balzer, J.C.; Koch, M. Periodic sampling errors in terahertz time-domain measurements. Opt. Express 2017, 25, 6712. [Google Scholar] [CrossRef]
- Kim, Y.; Yee, D.-S. High-speed terahertz time-domain spectroscopy based on electronically controlled optical sampling. Opt. Lett. 2010, 35, 3715–3717. [Google Scholar] [CrossRef]
- Dietz, R.J.B.; Vieweg, N.; Puppe, T.; Zach, A.; Globisch, B.; Göbel, T.; Leisching, P.; Schell, M. All fiber-coupled THz-TDS system with kHz measurement rate based on electronically controlled optical sampling. Opt. Lett. 2014, 39, 6482–6485. [Google Scholar] [CrossRef]
- Humphreys, D.A.; Naftaly, M.; Molloy, J.F. Effect of time-delay errors on THz spectroscopy dynamic range. In Proceedings of the 2014 39th International Conference on Infrared, Millimeter, and Terahertz waves (IRMMW-THz), Tucson, AZ, USA, 14–19 September 2014. [Google Scholar]
- Coakley, K.J.; Hale, P. Alignment of noisy signals. IEEE Trans. Instrum. Meas. 2001, 50, 141–149. [Google Scholar] [CrossRef]
- Molter, D.; Trierweiler, M.; Ellrich, F.; Jonuscheit, J.; Von Freymann, G. Interferometry-aided terahertz time-domain spectroscopy. Opt. Express 2017, 25, 7547. [Google Scholar] [CrossRef] [PubMed]
- Gordon, I.; Rothman, L.; Hill, C.; Kochanov, R.; Tan, Y.; Bernath, P.; Birk, M.; Boudon, V.; Campargue, A.; Chance, K.; et al. The HITRAN2016 molecular spectroscopic database. J. Quant. Spectrosc. Radiat. Transf. 2017, 203, 3–69. [Google Scholar] [CrossRef]
- Kuznetsov, S.A.; Astafyev, M.A.; Gelfand, A.V.; Arzhannikov, A.V. Microstructured frequency selective quasi-optical components for submillimeter-wave applications. In Proceedings of the 2014 44th European Microwave Conference, Rome, Italy, 6–9 October 2014; pp. 881–884. [Google Scholar]
- Arzhannikov, A.V.; Burdakov, A.V.; Vyacheslavov, L.N.; Ivanov, I.A.; Ivantsivsky, M.V.; Kasatov, A.A.; Kuznetsov, S.A.; Makarov, M.A.; Mekler, K.I.; Polosatkin, S.V.; et al. Diagnostic system for studying generation of subterahertz radiation during beam-plasma interaction in the GOL-3 facility. Plasma Phys. Rep. 2012, 38, 450–459. [Google Scholar] [CrossRef]
- Thumm, M.K.A.; Arzhannikov, A.V.; Astrelin, V.T.; Burdakov, A.V.; Ivanov, I.A.; Kalinin, P.V.; Kandaurov, I.V.; Kurkuchekov, V.V.; Kuznetsov, S.A.; Makarov, M.A.; et al. Generation of High-Power Sub-THz Waves in Magnetized Turbulent Electron Beam Plasmas. J. Infrared Millimeter Terahertz Waves 2014, 35, 81–90. [Google Scholar] [CrossRef]
Figure 1.
Scheme of the custom-made terahertz time-domain spectrometer.

Figure 2.
Upgraded optical delay line consisting of a translation stage (1), a corner reflector (2), an optical encoder readhead (3), and a scale (4).
Figure 2.
Upgraded optical delay line consisting of a translation stage (1), a corner reflector (2), an optical encoder readhead (3), and a scale (4).

Figure 3.
The difference between the translation stage positions and the optical encoder measurements for four translation stages in the ranges: (a) 45 mm; (b) 10 mm.
Figure 3.
The difference between the translation stage positions and the optical encoder measurements for four translation stages in the ranges: (a) 45 mm; (b) 10 mm.

Figure 4.
The drift of the initial position measured by the optical encoder in a series of ten consecutive measurements (each is depicted with its own color). Sequence of measurements is from top to bottom.
Figure 4.
The drift of the initial position measured by the optical encoder in a series of ten consecutive measurements (each is depicted with its own color). Sequence of measurements is from top to bottom.

Figure 5.
Terahertz (THz) spectra near two water vapor absorption lines before (black line) and after (red line) applying the correction: (a) 0.557 THz (b) 1.411 THz.
Figure 5.
Terahertz (THz) spectra near two water vapor absorption lines before (black line) and after (red line) applying the correction: (a) 0.557 THz (b) 1.411 THz.

Figure 6.
Spectra of THz pulses passed through bandpass filters with the central frequency: (a) 224 GHz (black line), 264 GHz (red line), and 312 GHz (blue line), arrows indicate the frequencies of the spurious spectra (b) 376 GHz before (black line) and after (red line) correction.
Figure 6.
Spectra of THz pulses passed through bandpass filters with the central frequency: (a) 224 GHz (black line), 264 GHz (red line), and 312 GHz (blue line), arrows indicate the frequencies of the spurious spectra (b) 376 GHz before (black line) and after (red line) correction.

Figure 7.
Waveforms of ten consecutively measured THz pulses presented in the ranges of 5–40 ps (main figure) and 14–16.5 ps (inset).
Figure 7.
Waveforms of ten consecutively measured THz pulses presented in the ranges of 5–40 ps (main figure) and 14–16.5 ps (inset).

Figure 8.
The drift of the initial position measured by the optical encoder (black squares) and measured based on the time shift of terahertz pulses (red triangles) relative to the first measurement.
Figure 8.
The drift of the initial position measured by the optical encoder (black squares) and measured based on the time shift of terahertz pulses (red triangles) relative to the first measurement.

© 2019 by the authors. Licensee MDPI, Basel, Switzerland. This article is an open access article distributed under the terms and conditions of the Creative Commons Attribution (CC BY) license (http://creativecommons.org/licenses/by/4.0/).
Share and Cite
MDPI and ACS Style
Mamrashev, A.; Minakov, F.; Maximov, L.; Nikolaev, N.; Chapovsky, P. Correction of Optical Delay Line Errors in Terahertz Time-Domain Spectroscopy. Electronics 2019, 8, 1408. https://doi.org/10.3390/electronics8121408
AMA Style
Mamrashev A, Minakov F, Maximov L, Nikolaev N, Chapovsky P. Correction of Optical Delay Line Errors in Terahertz Time-Domain Spectroscopy. Electronics. 2019; 8(12):1408. https://doi.org/10.3390/electronics8121408
Chicago/Turabian StyleMamrashev, Alexander, Fedor Minakov, Lev Maximov, Nazar Nikolaev, and Pavel Chapovsky. 2019. "Correction of Optical Delay Line Errors in Terahertz Time-Domain Spectroscopy" Electronics 8, no. 12: 1408. https://doi.org/10.3390/electronics8121408
Note that from the first issue of 2016, this journal uses article numbers instead of page numbers. See further details here.