Real-Time Ventricular Fibrillation Detection Using an Embedded Microcontroller in a Pervasive Environment

1
College of Engineering, Youngsan University, 288, Junam-ro, Yangsan-si 50510, Gyeongsangnam-do, Korea
2
The Tilbury Research Group, College of Engineering, University of Michigan, Ann Arbor, MI 48109, USA
3
College of Information Sciences and Technology, The Pennsylvania State University, E327 Westgate Building, University Park, PA 16802, USA
*
Author to whom correspondence should be addressed.
†
Current Address: Department of Computer Science, Kent State University, 241 Mathematics and Computer Science Building, Kent, OH 44242-0001, USA.
Electronics 2018, 7(6), 88; https://doi.org/10.3390/electronics7060088
Submission received: 1 May 2018
/
Revised: 26 May 2018
/
Accepted: 30 May 2018
/
Published: 3 June 2018
(This article belongs to the Special Issue Real-Time Embedded Systems)
Abstract
:Many healthcare problems are life threatening and need real-time detection to improve patient safety. Heart attack or ventricular fibrillation (VF) is a common problem worldwide. Most previous research on VF detection has used ECG devices to capture data and sent to other higher performance units for processing and has relied on domain experts and/or sophisticated algorithms for detection. In this case, it delayed the response time and consumed much more energy of the ECG module. In this study, we propose a prototype that an embedded microcontroller where an ECG sensor is used to capture, filter and process data, run VF detection algorithms, and only transmit the detected event to the smartphone for alert and call for services. We discuss how to adapt a common filtering and scale process and five light-weighted algorithms from open literature to realize the idea. We also develop an integrated prototype, which emulates the VF process from existing data sets, to evaluate the detection capability of the framework and algorithms. Our results show that (1) TD outperforms the other four algorithms considered with sensitivity reaching 96.56% and specificity reaching 81.53% in the MIT-BIH dataset. Our evaluations confirm that with some adaptation the conventional filtering process and detection algorithms can be efficiently deployed in a microcontroller with good detection accuracy while saving battery power, shortening response time, and conserving the network bandwidth.
1. Introduction
Cardiovascular disease (CVD) is life threatening and there is a need for real-time detection to improve patient safety. CVD, caused by the malfunction of heart and blood vessels, is a common problem worldwide. The World Health Organization [1] reported that 17.7 million people died from CVD in 2015, accounting for about 31% of all deaths globally. According to the WHO, if there is no attempt to solve this problem, the rate of death from CVD will increase continuously. Among the various forms of heart disease, ventricular fibrillation (VF) is one of the most severe and dangerous abnormal heart rhythms. Indeed, VF can lead to death within a few minutes or a few days. The survival rate for a person who has a VF outside the hospital ranges between 7% and 70%, depending on the timing of first-aids [2].
Over the past decades, two streams of research have emerged in real-time VF detection: (1) designing wearable devices that can be used to continuously and reliably monitor health conditions [3,4] and (2) developing efficient algorithms that can correctly detect VF abnormality, especially in real-time [5]. However, with limited resources available in microcontrollers and smartphones, several research questions remain unresolved.
First, most of these wearable monitoring devices have no or only have simple detection functions and use wireless transmission to send data to a receiving unit [5]. They lack capability for real-time detection. In addition, the wireless transmission operations consume lots of battery power in comparison to other operations in the microcontroller, and use more network bandwidth [6]. Thus, how to increase diagnosis intelligence and reduce wireless data transmission to increase the battery life of the monitoring devices without replacing or recharging batteries within reasonable time duration is an important issue.
Secondly, previous studies on VF detection have been predominantly focused on evaluating the relative performance of the proposed algorithms in a centrally located computer or a smartphone. Meanwhile, most VF detection algorithms in previous studies used the “filtering.m” filtering process (available online [7]), which consists four successive steps: (1) mean value subtraction, (2) 5th order moving average filter, (3) drift suppression using high pass filter (1 Hz cut-off frequency), and (4) drift high frequency suppression using low pass Butterworth filter (30 Hz cut-off frequency); however, most studies assumed that the process to remove various noises was a preliminary step. That means, this process was not included as part of the evaluation process. Thus, misreporting the detection accuracy.
Thirdly, with the rapid development of mobile devices and microchip sensors, and their increasing usage in e-health, there is also an emerging need to examine how to reduce unavoidable noises in real time [8] in a pervasive environment, especially in a microcontroller.
Accordingly, the following issues still need to be examined: How should we include or deploy these filtering processes and detection algorithms in mobile devices or microcontrollers to reduce unavoidable noises? How effective are these filtering processes? What is the potential power consumption concern? How well do these algorithms perform? Moreover, how can we properly determine the system parameters of the algorithms such as window segmentation and threshold value?
Traditionally, a centrally located machine, cloud or smartphone is used to receive and process the raw ECG data from wearable sensing devices and a human expert or algorithms are then called in to detect VF abnormality. These approaches still need to rely on a microcontroller inside the embedded module to sample the raw digital data produced by the analog-to-digital converter (ADC) and then transmit them to higher performance machines for processing. The data transmission process consume a significant amount of battery power, delays the response time, and exposes the possibility of data leakage. In this study, we propose a methodology that uses an embedded microcontroller as a fog node to filter noise, extract signals and detect VF and only send the detected events to smartphones to alert and request healthcare services. Once an abnormality is detected, the complete heart signal can then be captured and transmitted to a server or cloud for in-depth analysis and treatment. The proposed methodology would shorten the incident response time and significantly reduce the battery consumption of the wearable ECG device, as most of the device’s power consumption stems from the abundance of data transmitted via wireless communications [9]. Table 1 summarize the characteristics of these approaches.
As a benchmark, we adapt five light-weighted algorithms from open literature and use the complete set of MIT and Boston’s Beth Israel Hospital arrhythmia database (MIT-BIH) and Creighton University (CU) Ventricular Tachyarrhythmia databases [10] for tests. Performance results are measured based on common quality metrics such as sensitivity, selectivity, positive predictivity, accuracy, computational time, power consumption and receiver operating characteristic (ROC) curve.
2. Related Studies
There have been many studies focused on evaluating VF detection algorithms for automated external defibrillators (AEDs) [11,12,13,14,15,16] or mobile phone [17,18,19]. In addition, there are several studies focusing on designing wearable ECG devices that can transmit data efficiently and securely [5,6,9,20,21].
The most recent and seminal work that compares different algorithms are the studies by Amann et al. [12,13,22], Ismail et al. [14], Abu et al. [15] and Arafat et al. [16]. Amann et al. [12] compared five well-known standard QRS complex and five new VF detection algorithms with a large amount of data that has been annotated by qualified cardiologists. They choose the three annotated databases without pre-selection of certain ECG episodes for tests. Within the results, TCI [23], VFF [24], and TOMP [25] are particularly noteworthy.
In a follow-up study, Amann et al. [22] developed a VF detection algorithm, called Time Delay (TD), based on phase space reconstruction and then evaluated it against four extant algorithms, TCI, VFF, spectral algorithm (SPEC), and complex measure (CPLX), all of which were reported in their previous study [12]. TD, which counts the number of boxes based on the phase-space plots of random signals, can also be easily implemented in a microcontroller [26]. Ismail et al. [14] compared five different algorithms including CPLX, MEA, TCI, TD, and VFF and explored the impact of combining two algorithms. They concluded that combining two algorithms might improve the performance. Abu et al. [15] developed a sequential detection algorithm using empirical mode decomposed (EMD) analysis that showed improved performance over six algorithms including TD and TCI. However, EMD requires relatively high computational complexity comparing with others. Arafat et al. [16] developed a time domain algorithm, called TCSC, adapted from TCI and compared its performance with six algorithms including CPLX, TCI, and TD. They concluded that TCSC performed better than TCI based on positive threshold.
The literature has shown mixed results among detection methods from different studies. This variation could be due to the use of different threshold values for comparison and experimental settings; unfortunately, most studies did not report the threshold parameters used in their studies. However, one clear thing is that TCI, TCSC, TD, VFF, and TOMP are among the popular methods used for benchmark testing. In addition, to the best of our knowledge, there is no study attempting to perform real-time VF detection on microcontrollers, despite that doing so can reduce battery consumption and shorten response time when life-threatening emergencies occur. That is the focus of this study.
In terms of real-time health monitoring, Flores-Mangas and Oliver [6] examined the progress of previous work, revealed system requirements and proposed a framework for real-time monitoring and analyzing physiological signals. They have also used sleep apnea as an example which demonstrated, experimented and evaluated the prototype performance. The paper did not provide details on key information processing tasks such as data filtering and segmentation. Dagtas et al. [9] presented a 3-tiered wireless architecture and prototype using Zigbee for heart failure monitoring and detection. The paper provided detailed description, noise filtering, basic QRS detection and secured data communication setting. The ideas and implementation are similar to our proposed methodology—using microcontroller (MCU) to capture, process, and detect abnormality and then send detailed signal after detection. However, they only used a simple algorithm to detect QRS (not VF). Meanwhile, no detailed evaluation result has been provided. Pantelopoulos and Bourbakis [5] conducted a state-of-the-art survey on wearable sensor-based systems for health monitoring. They reviewed the current systems developed and identified the technological shortcoming and challenge issues, which can provide directions for future research improvements. Choudhary et al. [20] developed a real-time wireless system based on Zigbee technology for remote monitoring of patients’ heart rate and oxygen saturation in blood. The proposed methodology used MCU to store, convert and send signals periodically back to PC for further analysis by users. There is no filtering and detection capability in the MCU unit. Yadav et al. [21] designed a mobile health monitoring system using heart beat and body temperature for potential heart disease detection. The study provided fundamental system framework and illustrated the role of GPS in location detection but it only used simple threshold rule for heart rate and temperature, which cannot accurately detect heart attack and thus the proposed system is not much useful for practical real world situation. Clearly, the development of wearable systems for real-time health monitoring is evolving; however, a well-designed methodology that considers the integration of hardware, software and services for usability, real-time data processing and detection for effective and fast response, lower power consumption, and secure data communications is still expected. In this paper, we studied the integration of hardware and software, real-time data processing and detection for effective and lower power consumption.
3. Methodology
This paper proposes a methodology with three alternative strategies to increase the responsiveness and accuracy of detection and reduce power consumption:
- Adopt an interrupt service routine (ISR) to reduce power consumption.
- Use the microcontroller of the embedded ECG module to filter, scale and process the data, and detect VF patterns and only transmit the event via a smartphone to shorten response time and reduce power consumption.
- Select and adapt VF detection algorithms that have accurate and efficient workloads for the microcontroller used.
3.1. The Proposed VF Detection Methodology
In this study, we propose a methodology that uses the embedded microcontroller as a fog node to filter noise, extract signals and detect VF and only send the detected events to a smartphone to alert and request healthcare services. Once an abnormality is detected, the complete heart signal can then be captured and transmitted to a server or cloud for in-depth analysis and treatment. The proposed methodology would shorten the incident response time and significantly reduce the battery consumption of the wearable ECG device, as most of the device’s power consumption stems from the abundance of data transmitted via wireless communications [3].
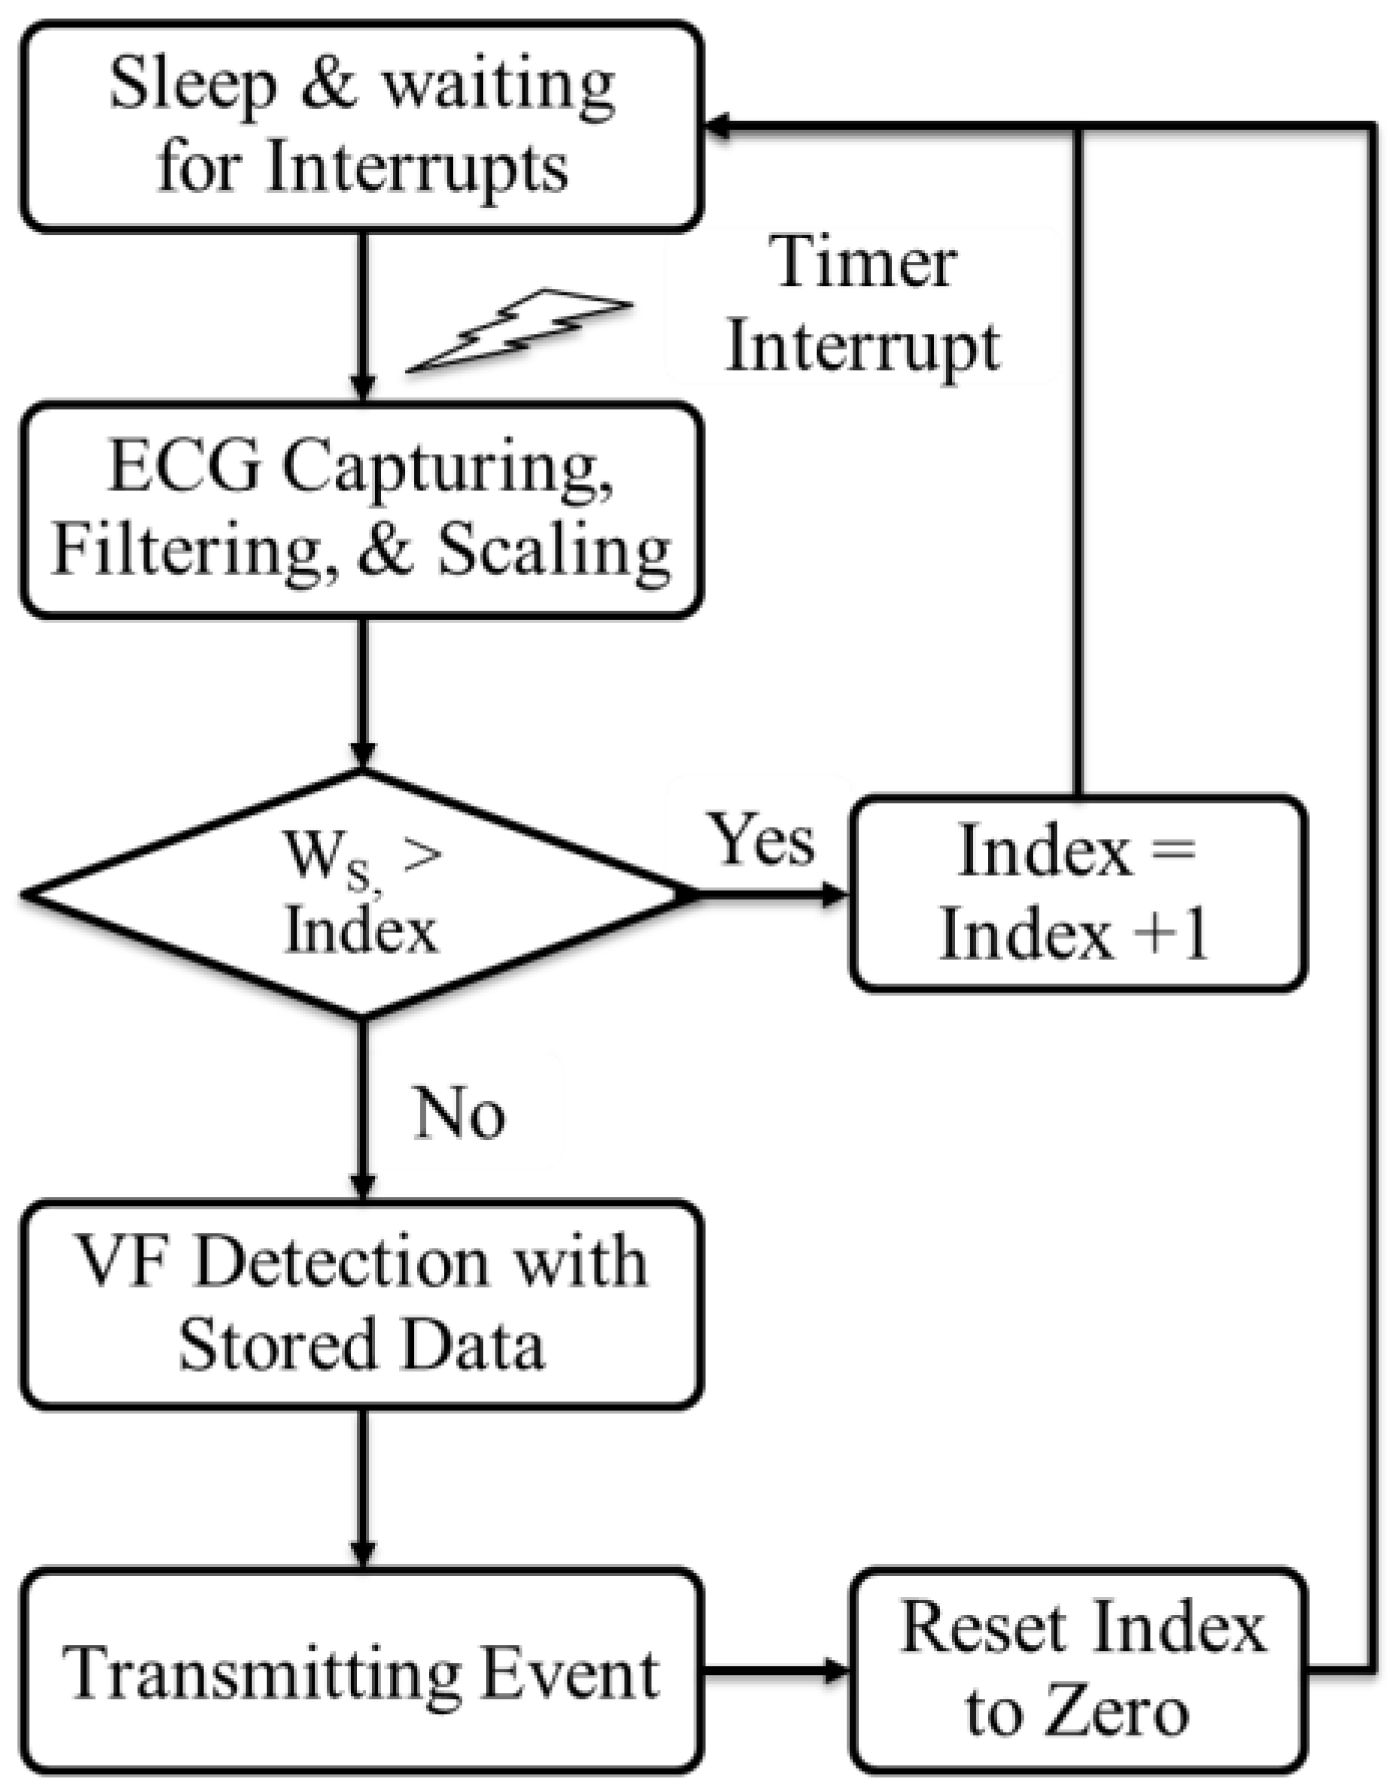
Figure 1 illustrates the implemented process. The process starts with a timer interrupt for capturing ECG, filtering, and scaling at every sampling point. The captured data is stored in the window storage of the memory. Once the window size, Ws, is filled with the captured data, VF detection algorithm is applied to check whether VF event is occurred or not, and the result is transmitted to the smartphone or main computer through wireless communications.
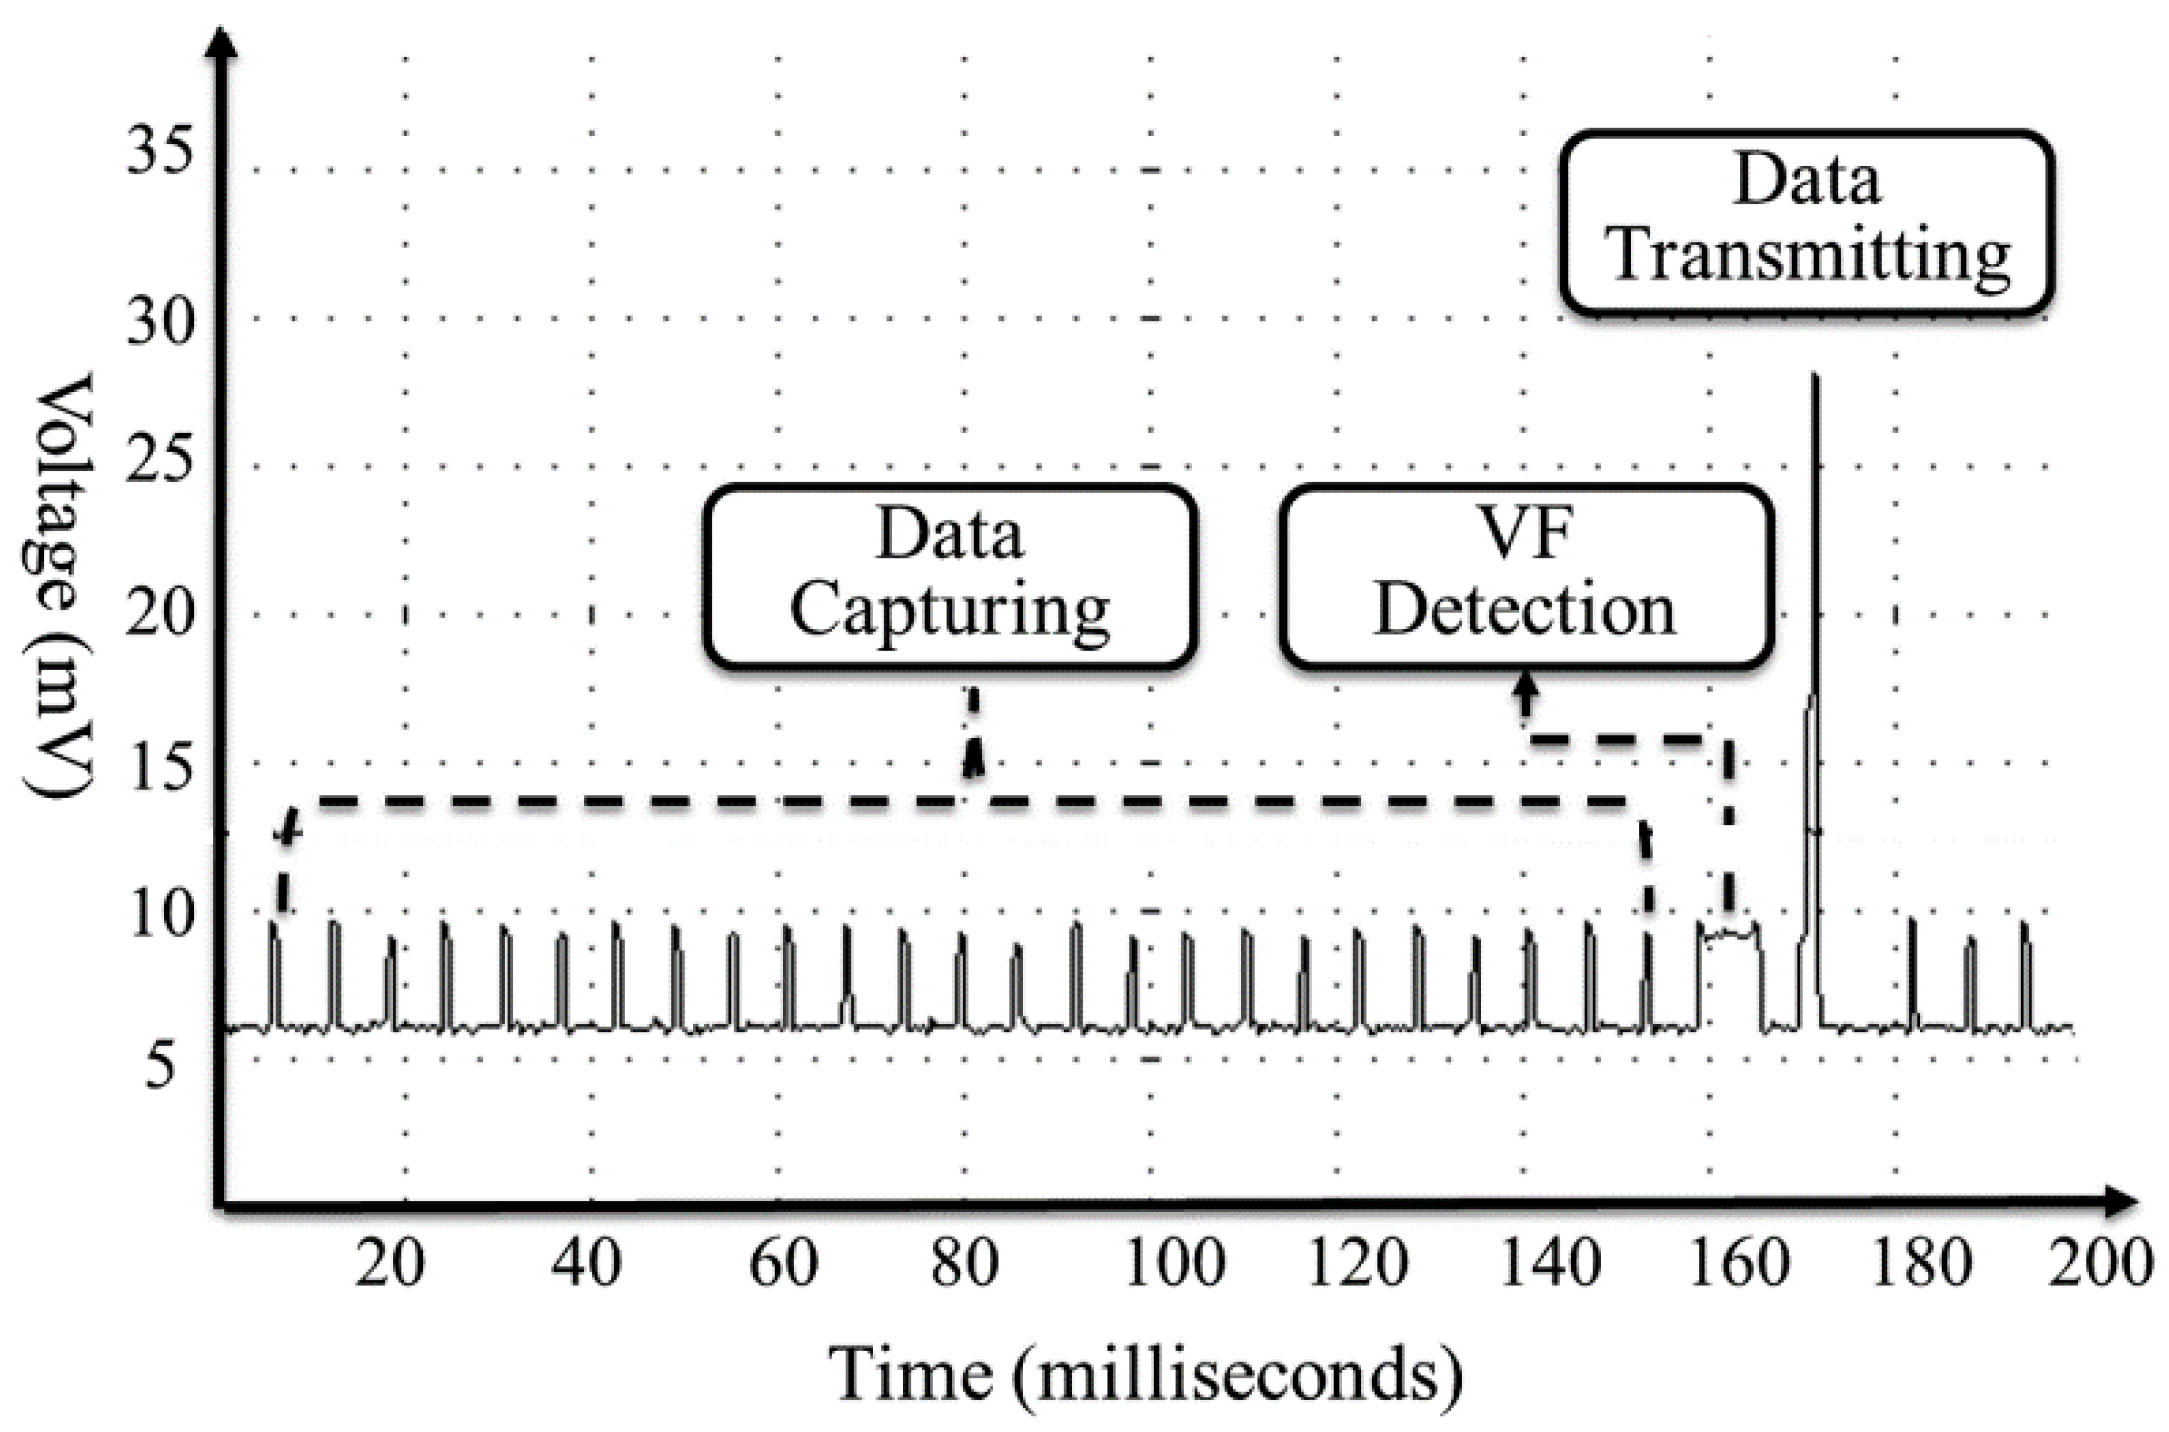
The power consumption of related operations—signal acquisition, VF detection and data transmission is shown in Figure 2. As can be seen, transmitting operation takes five times more battery power voltage than signal acquisition and detections if we assume the operating duration is the same. In Figure 2, the transmission operation sends only the result event, which is only one value so that it takes short duration relative to acquisition. If the system transmits all the captured data, the transmission consumes much more power than other operations. With our proposed implementation, instead of transmitting all data captured to smartphone, we process VF detection at microcontroller and only transmit the detected events; thus, we can save the transmitting power as in a way proportional to the number of capturing.
3.2. The Filtering Process
Many earlier studies in VF detection used a filtering function, called filtering.m, implemented in Matlab [8] and conducted offline. The function contains four sub-routines: mean value subtraction, 5th order moving average to remove high frequency noise like interspersions and muscle noise, drift suppression using high pass filter (1 Hz cut-off frequency), and low pass Butterworth filter (30 Hz cut-off frequency), which suppresses the high frequency noises even more.
The conventional filtering.m function, however, does have some disadvantages if the process is implemented in real time using an embedded microprocessor that has limited computational resources and battery energy. First, the battery life will be significantly shortened. Secondly, in real time situations, it is hard to calculate the mean value and moving average of the whole ECG signal. Thirdly, according to our pilot tests, the detection performance is not significantly affected by removing the mean value subtraction and moving average filtering. Therefore, in our implementation, we drop the first two subroutines, adapt the high-pass (1 Hz) and low-pass (30 Hz), and introduce the Kalman filters in the testbed.
3.2.1. High and Low Pass Filter for Removing Noise
The cut off frequency of high pass filter (1 Hz) and low pass filter (30 Hz) can typically be calculated as follows:
We can then apply R (Resistor) and C (Capacitor) values to the transfer function of the high pass filter as shown:
Using the z-transform, the transfer function can be obtained with R and C values. Although there are several ways to transfer the z-transform, we use the Tustin method with the c2d function available in the Matlab [8]. As a result of this process, the transfer function for the high-pass filter can be obtained with coefficients as shown:
where Y(z − 1) is the previous output value; U(z) is the current input value; and U(z − 1) is the previous input value. We then apply R and C values to the transfer function of the low-pass filter:
Using the same process as the high-pass filter, the transfer function for the low-pass filter is obtained with coefficients as follows:
3.2.2. Kalman Filter for Tracking Baseline
The threshold-based algorithms such as TCI and TCSC need to track a baseline to have detections that are more accurate. A baseline is a reference line that indicates the trend of an ECG signal without QRS which represents the rapid depolarization of the right and left ventricles and other factors. Thus, we assume those factors as noises when we track the baseline. We use the linear Kalman filter [27], which is a method that calculates a posteriori estimate using:
where is a posteriori estimate value; K is variable weight; zk is a measured value and H is a system model parameter. Although the format of Kalman filter is similar to one-dimension low-pass filter, it has a priori estimate, measured value, and dynamic weight K, which recalculated every time.
where Pk is the error of the posteriori estimate value, which has a linear relationship with the estimate error:
In addition, the following relationship is established between posteriori estimate value and error covariance value about xk.
The process of Kalman filter can be described in two repeated steps:
(1) Prediction. First, a target system is modeled, based upon which, the Kalman filter predicts a priori estimate and error covariance. Where error covariance is a measure of the error of the posteriori estimate value. The performance of the filter depends on how similar the modeled system is to the actual system.
(2) Estimation. The filter then calculates a new posteriori estimate value based on the difference between the measured value and the priori estimate value. In the Kalman filter, noise is an important variable. The status variable, error covariance and system model are expressed as:
In this paper, we set the parameters, based on our tests using CU database, as: A = 1, H = 1, Q = 0 and R = 4.
3.3. The Scaling Process
The amplitude of the ECG signal from a human body is normally about 1.3 mV. However, the minute ECG signal is often amplified through the front-end device and active filters to fit the total range of power. The voltage of the microprocessor is recently 3 V and the analog-to-digital converter has resolutions of 8–12 bits. The larger the amplified ECG signal that is achieved, the better the detecting accuracy will be. Thus, we can assume that the raw ECG signal (the range of 1 mV~5 mV) is simply amplified to fit into the maximum limitation. However, there is always a short-term or long-term drift noise. If the baseline noise is not taken into account during the amplification process, a clipping fault in which the signal exceeds the limited range of the ADC can occur.
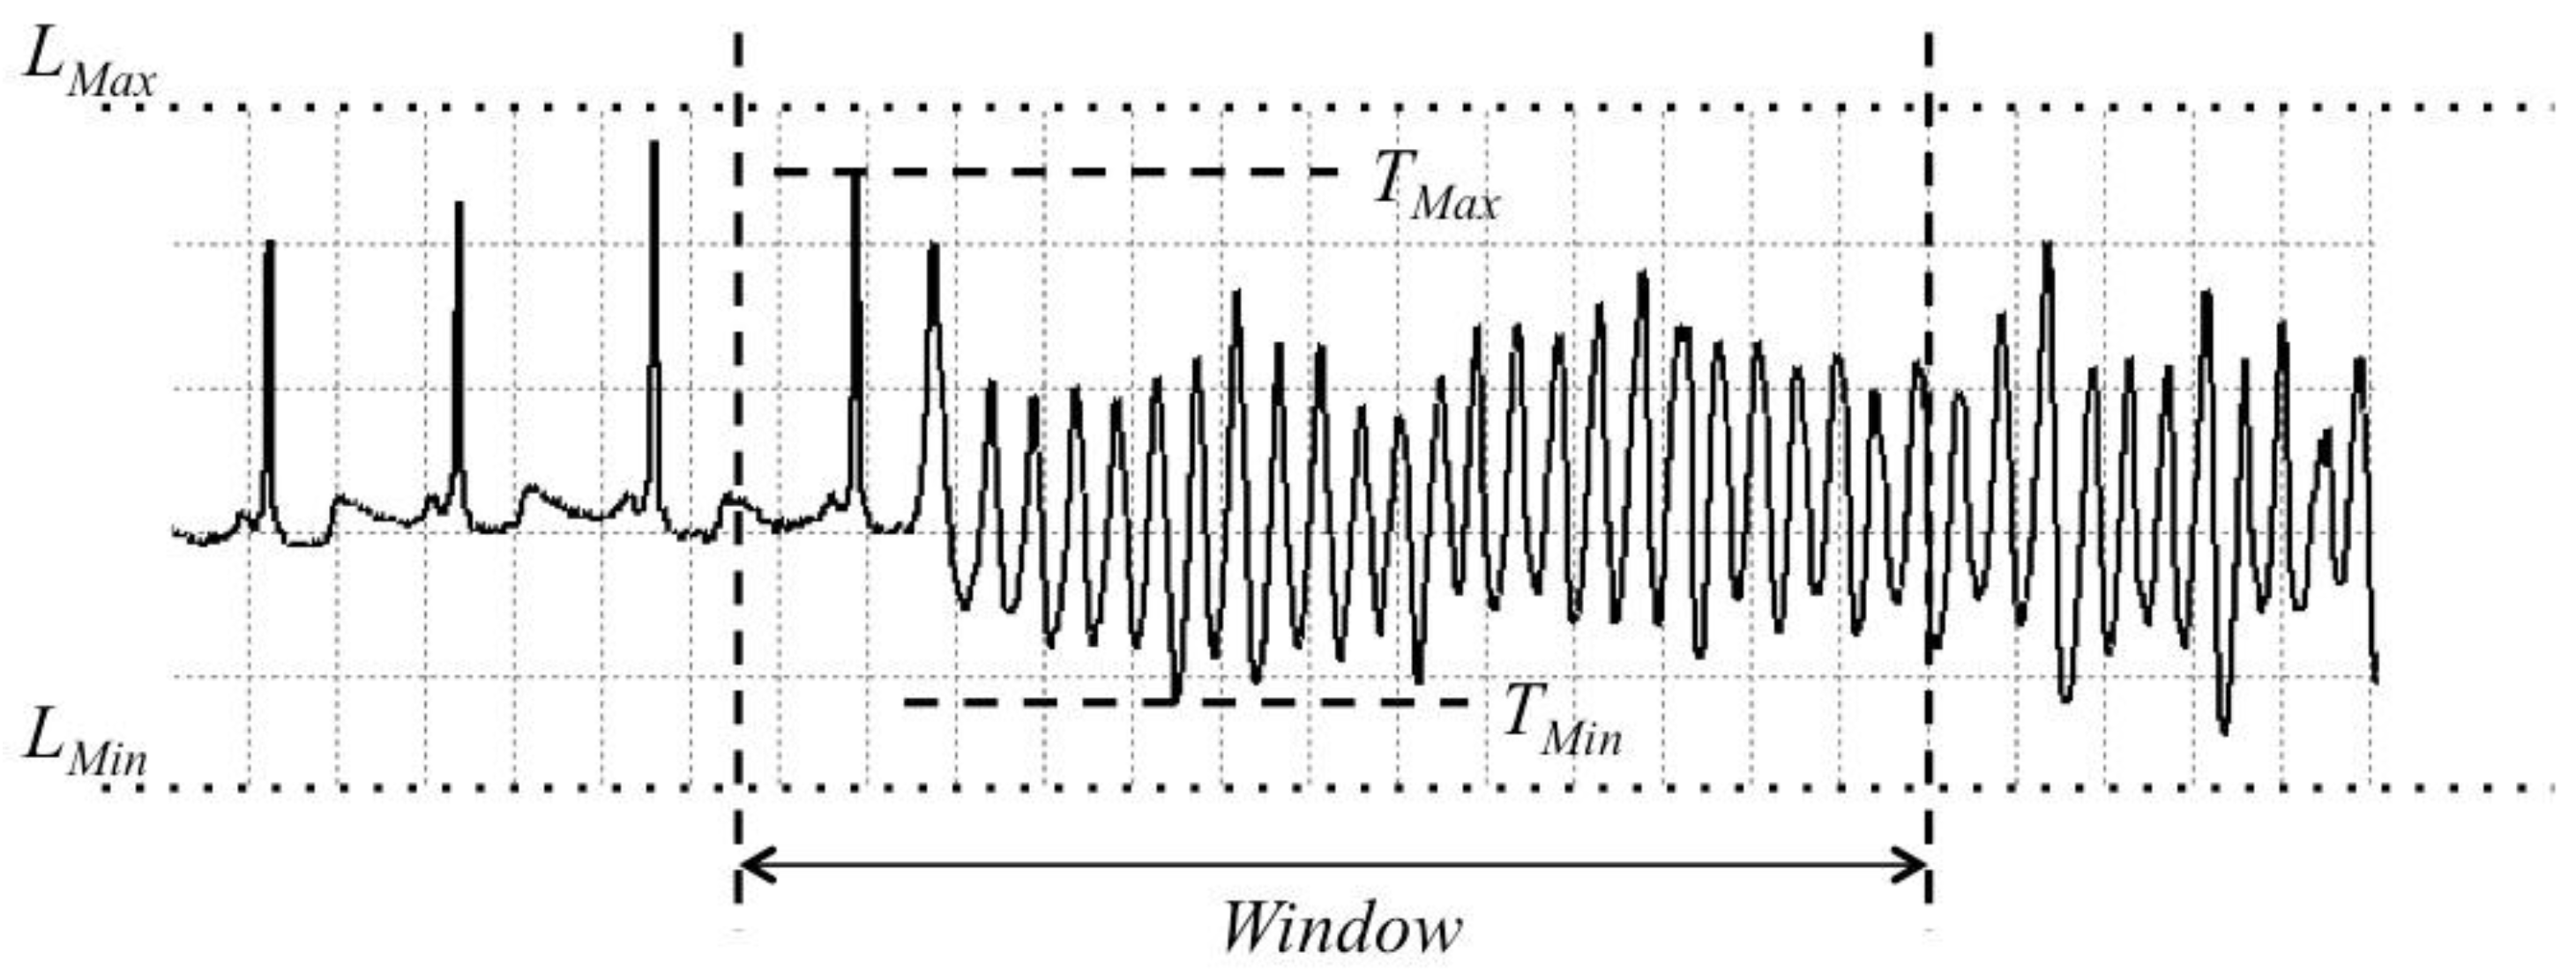
In VF detection, the amplitude of ECG signal is varied in the cases of sinus and VF signals. Scaling is a process by which ECG signals of a window segment with different peak-to-peak amplitudes are stretched into one uniform amplitude size. If there is no scaling, the parameter values vary from the size of peak-to-peak amplitudes. In real-time detection, the variances are unpredictable, meaning that errors may occur with the wrong thresholds. To obtain accurate thresholds, the periodic changing of the maximum and minimum values of the scale in the segment blocks is required. If the period is too short, the algorithm may lose the QRS complexes. On the other hand, if the period is too long, small VF events can be detected as sinus rhythms. We apply a scaling process for every window segment, which is 5 seconds in our implementation. Figure 3 shows the proposed scaling process.
The scaled value Vt can be calculated as:
where St is raw ECG data; VMul is the value for multiplication; and VAdd is the value for addition. The VMul and VAdd values are calculated simply using Equations (15) and (16). LMax is the maximum limitation and LMin is the minimum limitation. Since we use an 8-bit sampling ADC resolution, the LMin is zero and the LMax is 255 (i.e., 28 − 1). If a 10-bit resolution was used, then the LMin is zero and the LMax is 1023 (i.e., 210 − 1). TMax is the maximum value of signal; and TMin is the minimum value of signal.
3.4. The Revision in Detection Algorithms
Due to the memory limitation of microcontroller, every algorithm in this study uses a 5-s window size to fit in a temporal memory. Based on the window size, we slightly revise the algorithms and determine the threshold of VF and SR. We discuss each algorithm with the revision below.
3.4.1. The TCI algorithm
TCI [23] calculates the threshold value (T), the number of crossing signals (C) and the number of intervals (I) in three consecutive 1-second blocks to determine the VF or non-VF decision based on the number and the position of the crossings. TCI estimates the average interval between ECG signal threshold crossings. The mean TCI value is calculated as:
where N is the number of impulses in segment S (1 s interval) and t1~t4 are intervals between crossing points and each end points of the S. If a prescribed threshold value, TCI0, is greater than the TCI value, VF is declared. There is no revision applied to this algorithm.
3.4.2. The TCSC Algorithm
TCSC [16] is an improved method over the TCI algorithm, which removes the drawbacks of TCI such as using 1-second blocks as analysis windows that causes trouble when the heartbeat is fewer than 60 bpm and one threshold (20% of the maximum value) that causes a missing problem with negative peak value of ECG. Three additional extensions TCSC adds over TCI are:
- A 3-second block is investigated instead of a 1-second block.
- Both positive and negative thresholds are used instead of only the positive threshold.
- Samples above the thresholds are counted instead of only the pulses.
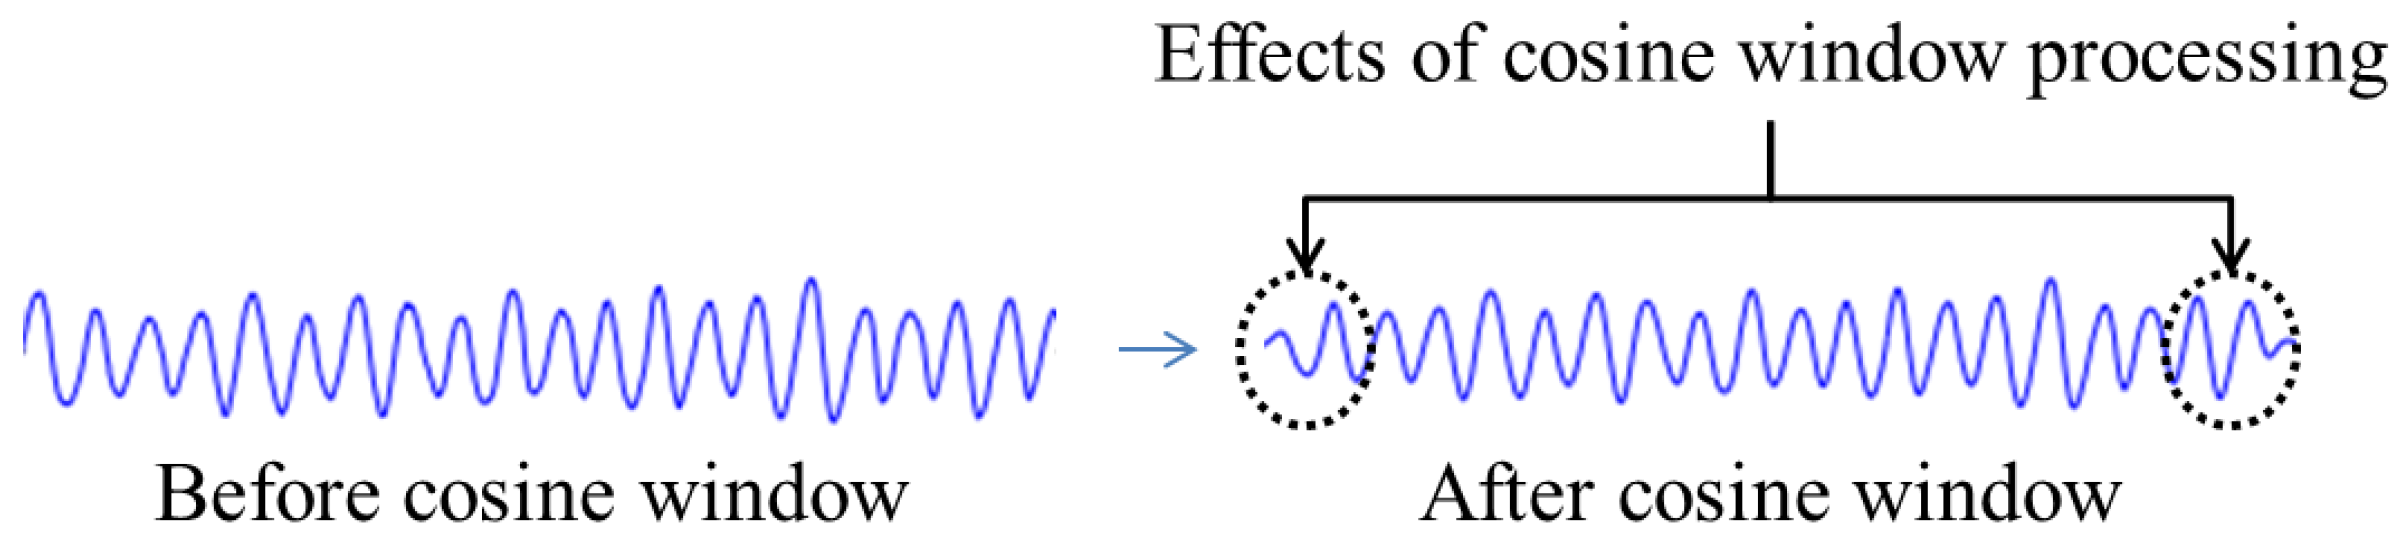
Our proposed revision: In the original TCSC algorithm, each segment is multiplied by a cosine window w(t) that minimizes the effect from end-to-end of each segment. We skip the multiplication of the cosine window, which only minimize the effects of amplitudes in the beginning and ending 0.25 s of each window segment (see Figure 4), but it needs high computational math functions compared with the performance in a microcontroller. Based on our experiment, the impact on signal detection is minimized but on computational time is significant. For instance, the computational time with cosine window in one window segment (5 s in our case) is 17.84 ms but it only takes 6.8 ms without using the cosine window.
3.4.3. The TD Algorithm
TD [22] uses a 40 × 40 squares grid of the two-dimensional phase space diagram that refers to different types of plotting using normal data X(t) as the x-axis and X(t + τ) as the y-axis, with τ = 0.5 s. The values are plotted in the 1600 squares and the resultant parameter is the number of visited boxes. To distinguish QRS complex from VF cases, TD counts the density of visited boxes and compares it with a threshold value. If the calculated density is less than a prescribed threshold density, the ECG signal is considered as a normal QRS complex; otherwise, it will be classified as a VF case. In general, this algorithm performs well in detecting VF. We skip the process of computing a density value as the step is just divided by the total number of all boxes visited using a floating point calculation, which is more computational intensive and redundant. Moreover, we assign the one box into one single bit so that memory usage is minimized.
3.4.4. The VFF Algorithm
VFF [24] uses a narrow band elimination filter in the scope of the mean frequency of the ECG signal for analysis. After the scaling process, Equations (18) and (19) are applied to the ECG data to get the VF filter leakage l:
Once the VF occurs, the window segment is shifted by half a period. If the data in a segment is similar to a periodic signal like VF, this algorithm cancels it so that the VF-filter leakage becomes small. The signal peak of QRS complexes affects the threshold of the VFF algorithm. If the signal is higher than the peak of QRS complex from the previous window segment, the threshold is set as 0.406. Otherwise, the threshold is set as 0.625. There is no revision applied to this algorithm.
3.4.5. The TOMP Algorithm
TOMP [25] is based on a real-time detection method of QRS complex. It applied a squaring function and a moving-window integration to detect QRS complexes. Since the sliding integration window with a width of 150 ms is applied, the slope γ (j) of the ECG data x(j) can be calculated as:
where n is the sample number and T is the sampling period of the ECG signal. The sliding integration window moves and sums the absolute values of the difference between current data and the previous data in a width of 150 ms. The short period of sliding window captures the high peak QRS complexes in ECG data. Using this method, even positive or negative QRS complexes can be easily detected by this sliding window. The TOMP algorithm sets two thresholds about the number of QRS complexes, such as l0 = 2 and l1 = 32. If the number of QRS complexes is out of this range (l0 > l and l1 < l), it is diagnosed as VF. Thus, it is very important to determine the offset value for deciding whether a VF wave is detected or not.
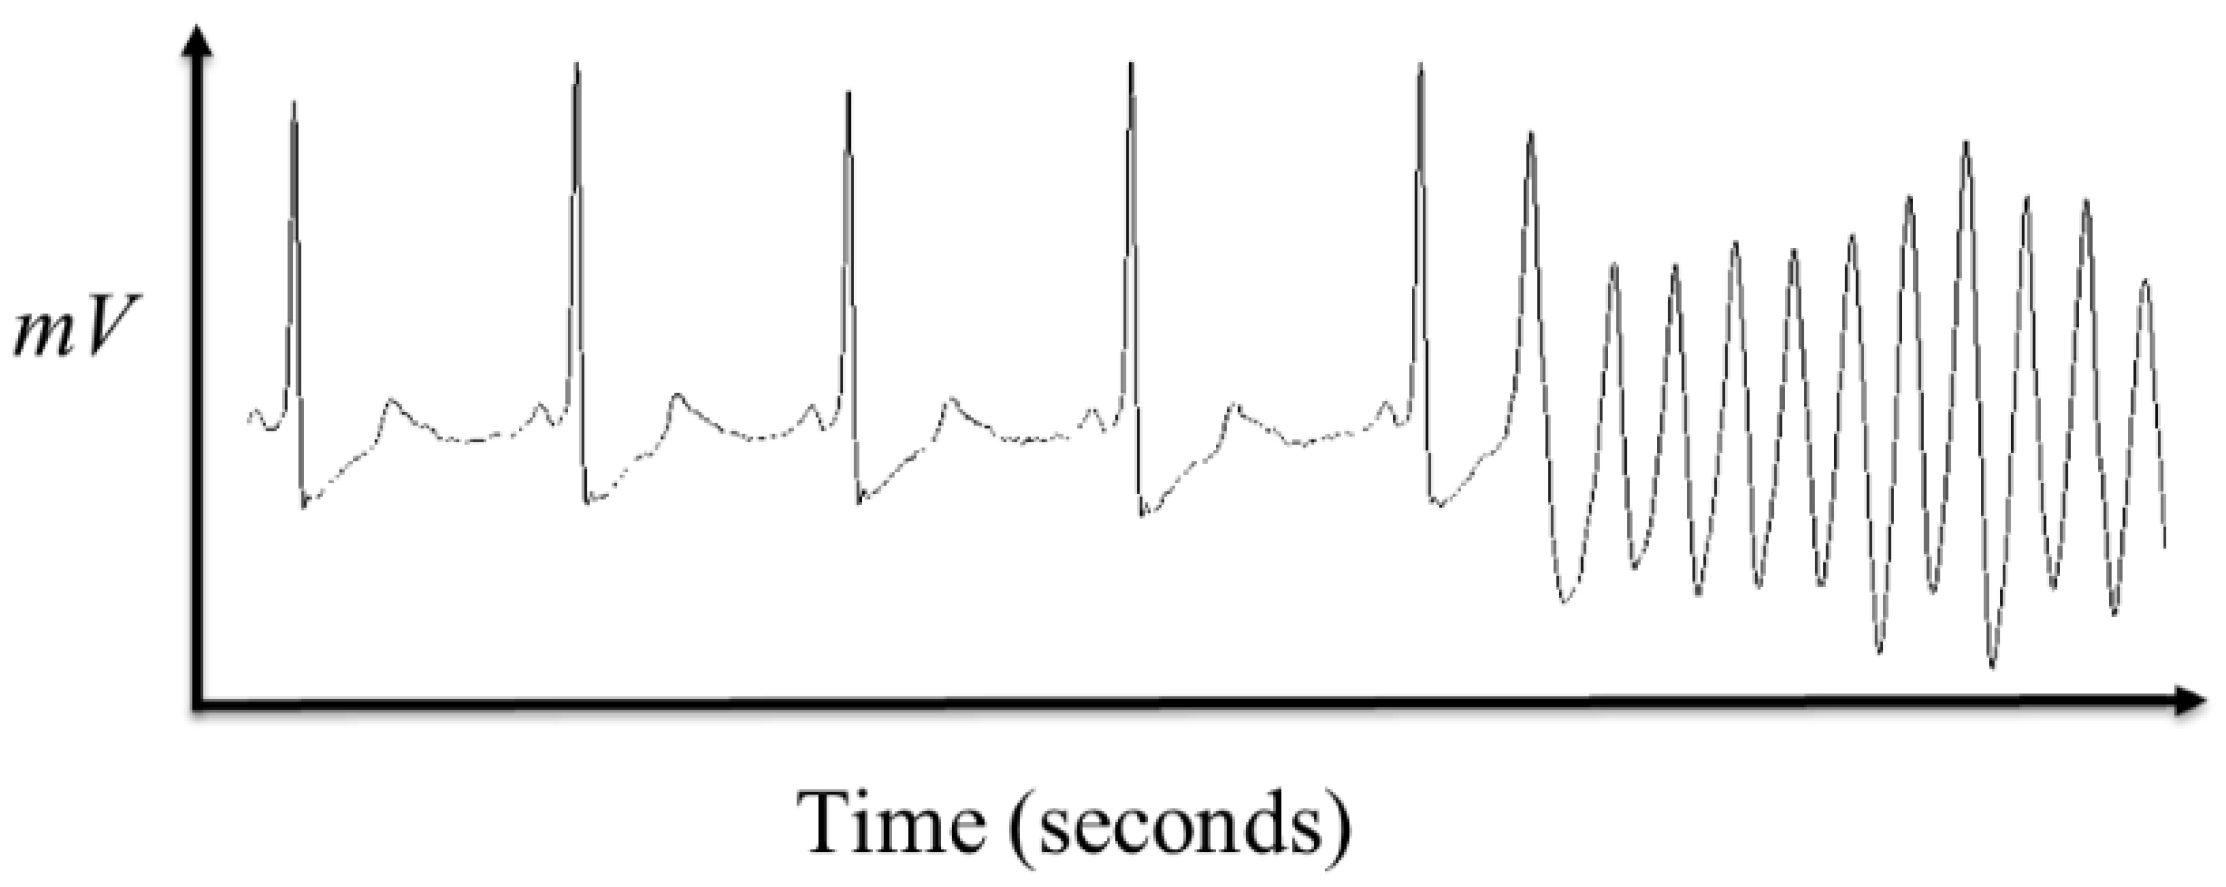
In general, there is no clear symptom that can indicate when the VF event will happen because the ECG signals normally have no pre-noticeable changing point from the SR (normal ECG) to the VF (as shown in Figure 5). In addition, SR and VF obviously have different features that distinguish QRS complexes from VF signal like a sine wave (or a cosine wave).
Furthermore, QRS complexes vary from signal to signal and are hard to predict, too. For instance, Figure 6 shows different shapes of the QRS complexes in the CU database. In addition, when the VF event occurs, there is no QRS complex in the ECG signal. Therefore, the threshold-based algorithms have difficulty of detecting the various types of QRS complexes.
3.5. The Development of Testing Prototype
We develop an integrated sensing module as a testbed, based upon which to test the performance and energy consumption of the VF detection methods. Figure 7 shows the conceptual framework of the proposed testing environment.
The proposed testing environment, or so-called artificial ECG prototype, contains three modules: (1) virtual patients that house the available testing databases and enable the generation of an analog ECG signal to provide ECG signal with VF events. The artificial ECG can be used to serve as a source to evaluate the VF detection algorithms and the integrated preprocessing filters; (2) the integrated module, which has the VF detection algorithms, hardware and software filtering logic built in. The module receives the ECG signal, removes the noise, and judges whether VF events are occurring. The results from the integrated module are then sent to the evaluation system through wireless communication; and (3) the evaluation system. In the evaluation system, the results of VF detection are compared with previous annotated information, which is then used to calculate the quality parameters.
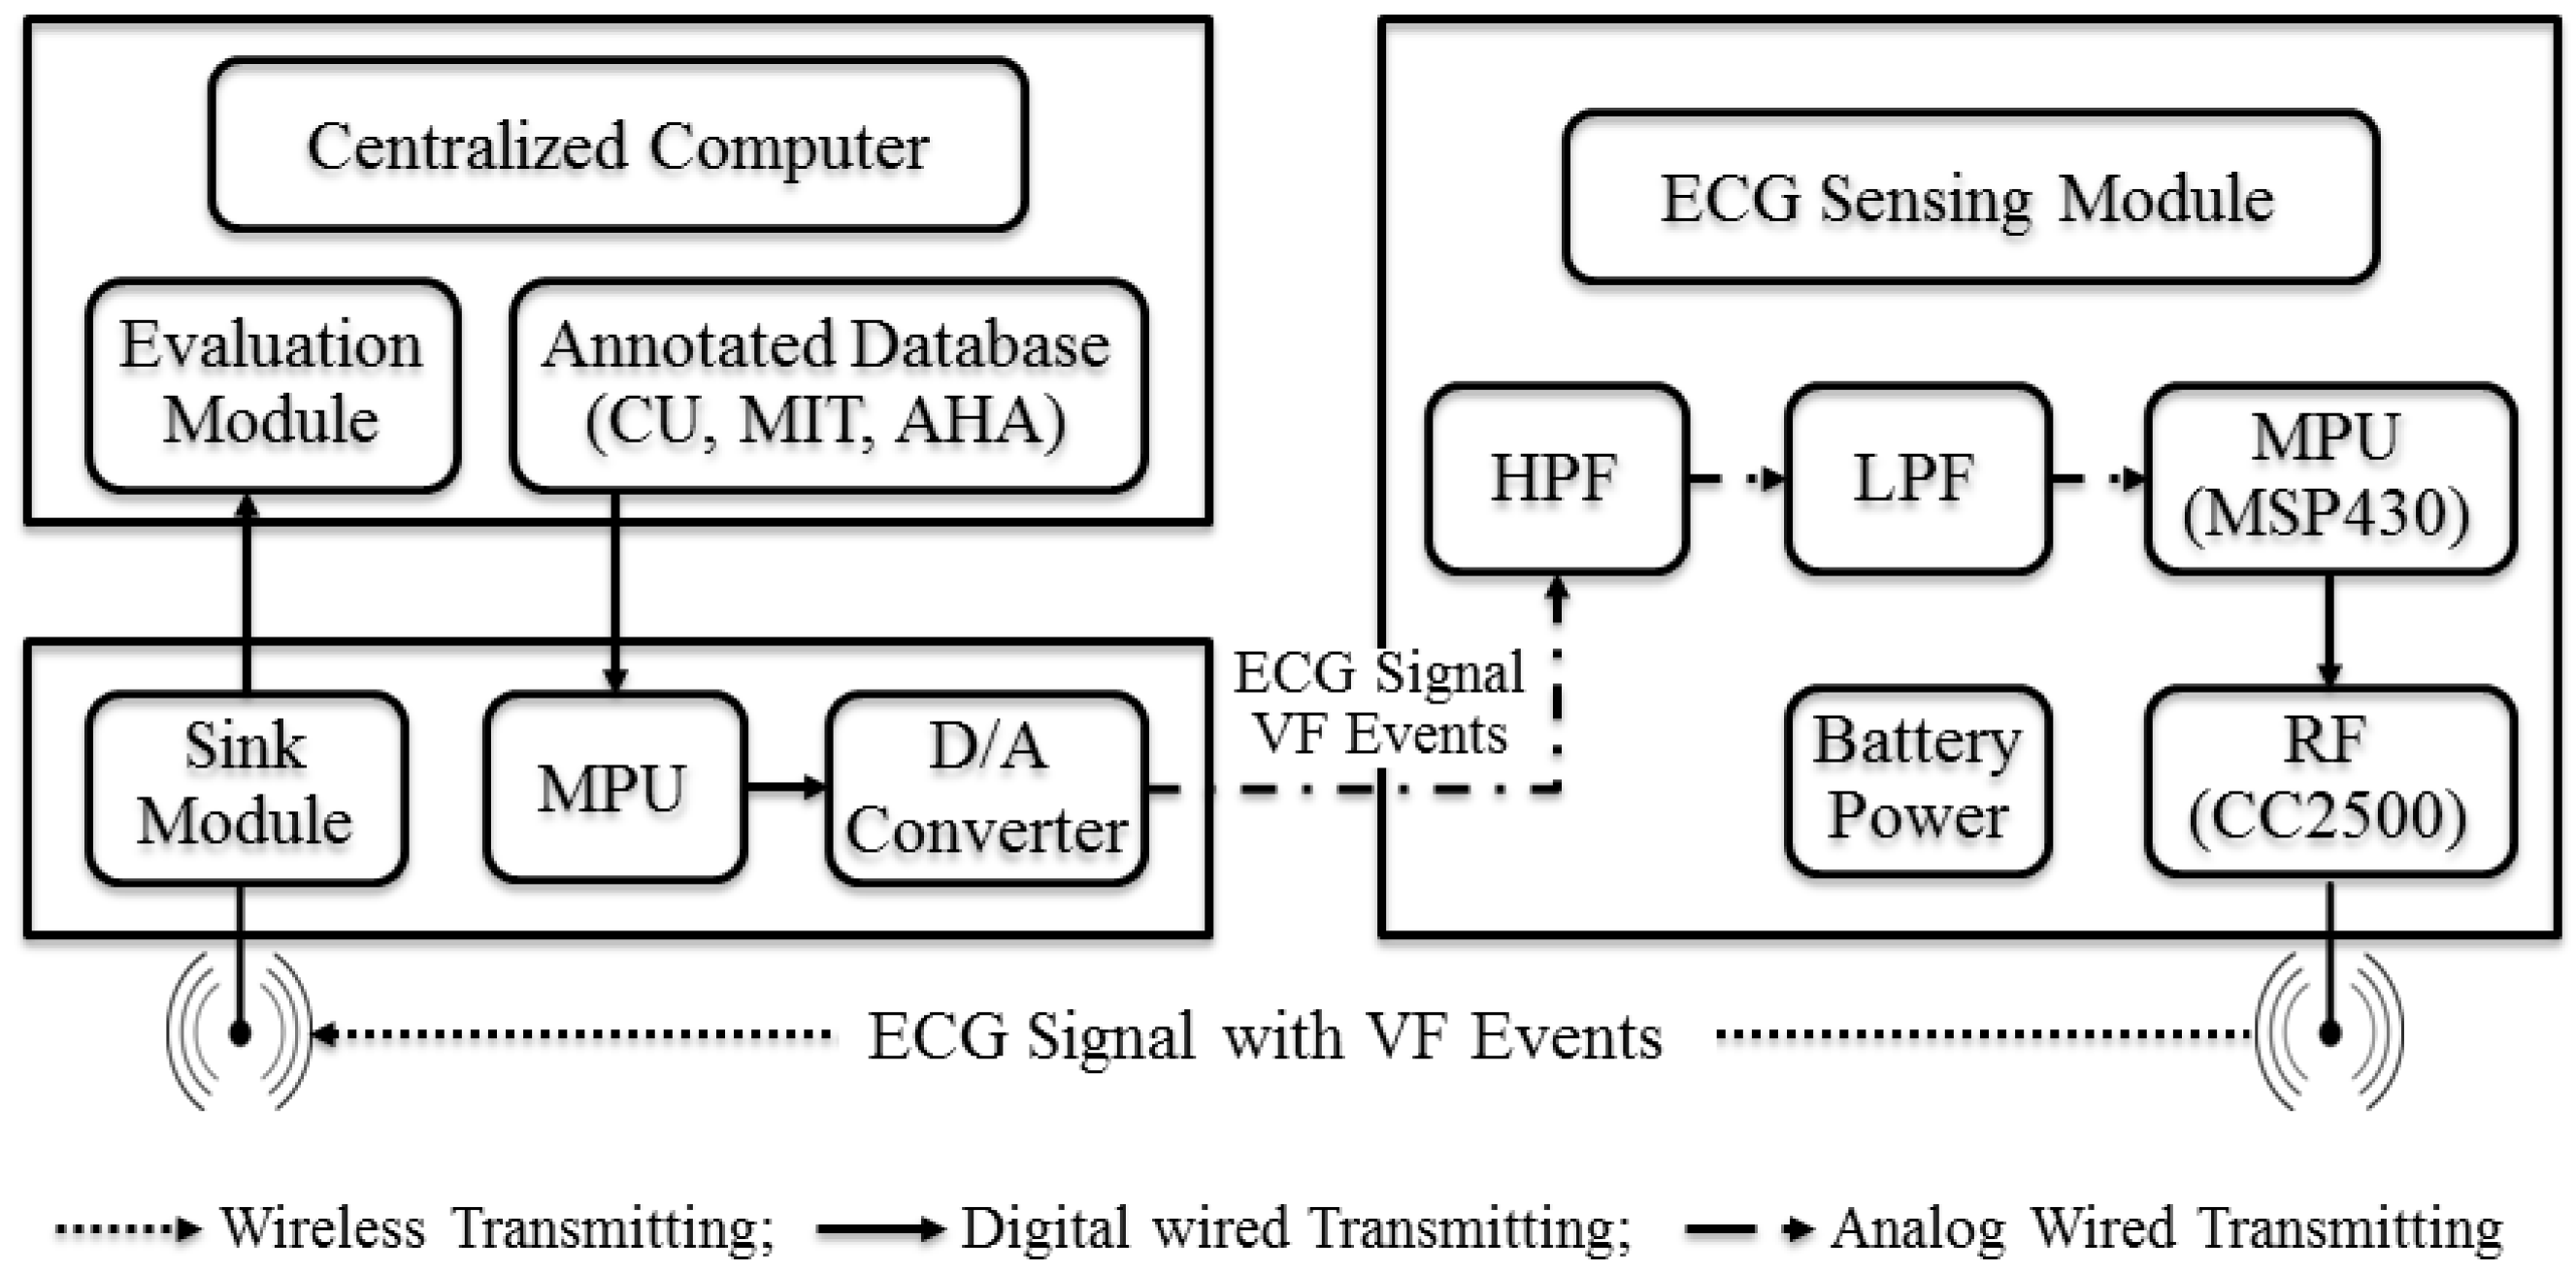
Figure 8 depicts more specific block diagram of the testing environment. The centralized computer includes the virtual patients and evaluation system. The virtual patients’ digital data is converted from analog signals using a digital-to-analog (D/A) converter. Preprocessing in this system consists of three steps: a high pass filter, a low pass filter, and a Kalman filter. The VF detection events are sent to the centralized computer or mobile phone through RF-communication chip, which is TI’s CC2500 [28].
4. Performance Evaluation
4.1. Experimental Design
We conduct two experiments to verify the feasibility and effectiveness of our proposed development. In experiment 1, we deploy our virtual patients and evaluation system in a laptop computer and evaluate the performance of our algorithms using an 8-second window length, so that our results can be directly compared with those reported in the open literature. This comparison helps to assess the effectiveness of the proposed filtering process and verifies the coding accuracy. In experiment 2, we conduct evaluations using the testing prototype. The same filtering process and algorithms are deployed in the microcontroller unit with minor modifications to meet microcontroller memory requirements (as discussed in Section 3.2 and Section 3.4). Signals are extracted every 5 s. Results are then compared with those obtained from experiment 1. This comparison helps to assess the effectiveness of the filtering process and algorithms performed under a microcontroller. It also helps to estimate and justify the potential power saving of our proposed approach.
4.2. The Prototype and Real-Time Evaluation Program
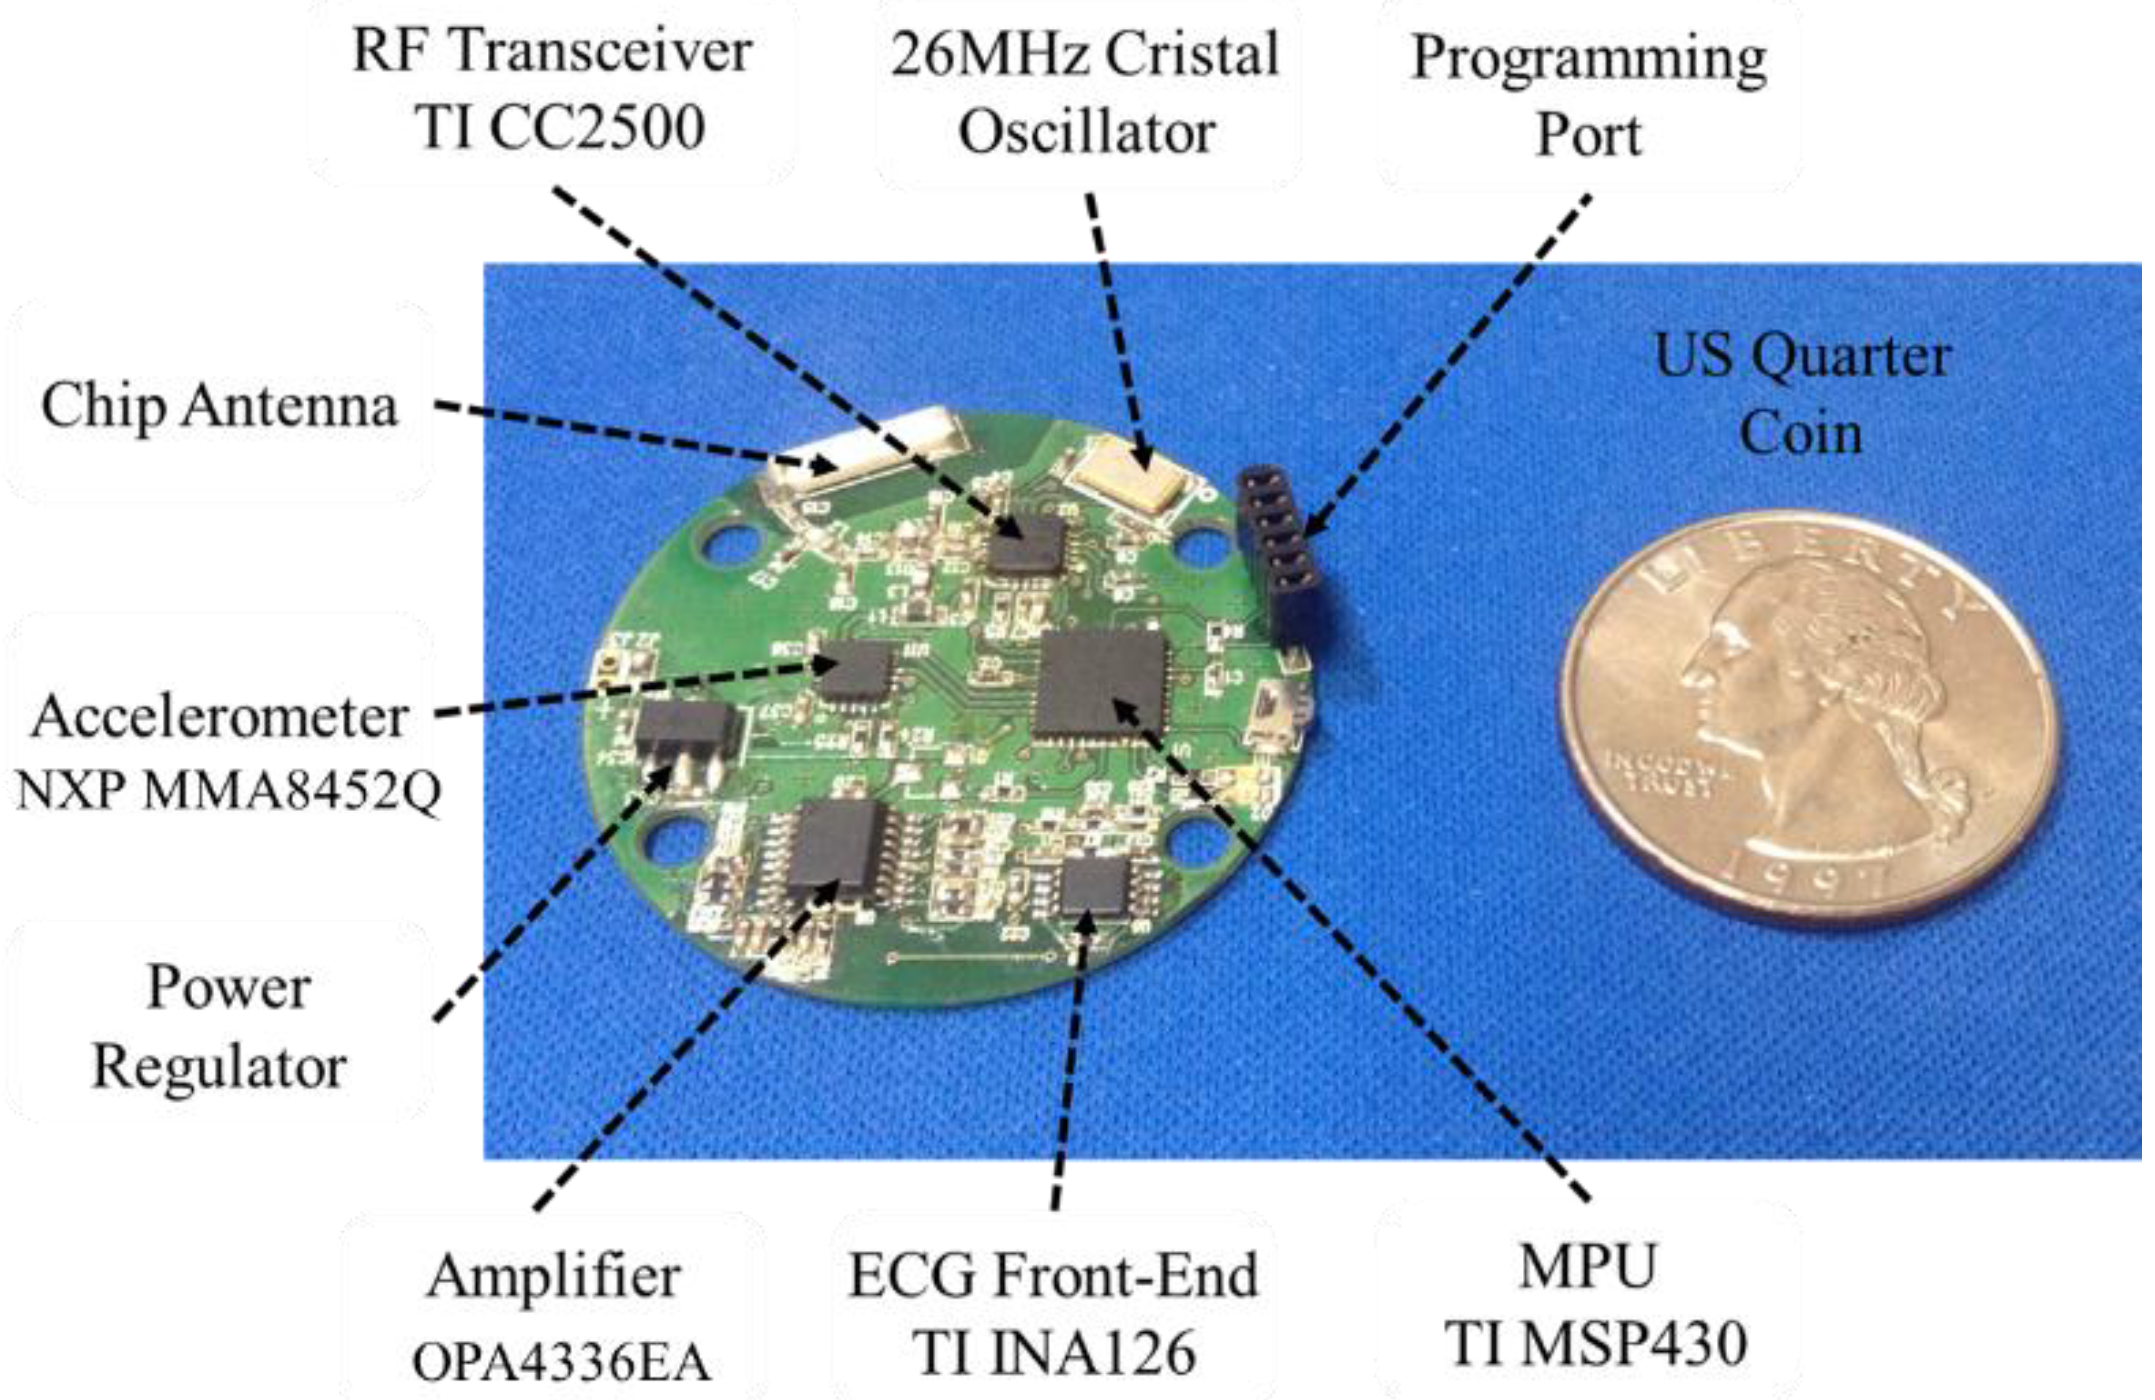
VF detection algorithms need a preprocessing (scaling and filtering) step to improve their detecting performance. We use TI’s MSP430-2500 (Texas Instruments, Dallas, TX, USA), which consists of MSP430f2274 microcontroller (Texas Instruments, Dallas, TX, USA) with 32 KB + 256 B of Flash Memory (ROM) and 1 KB of RAM, and CC2500 radio chip (Texas Instruments, Dallas, TX, USA) using 2.4 GHz, to deploy our integrated module. Figure 9 shows the final optimized embedded prototype that we developed. The size of the module is relatively small, which is slightly bigger than a US quarter coin. It can be inserted into a watch type case or into a cloth built in case. The current module has multiple sensors built in, including ECG sensor, temperature sensor (inside the MPU), and accelerometer (i.e., motion detection sensor). The chip antenna and RF transceiver are used for wireless data communication. The MPU contains ADC, memory to store filtering and detection software and captured data, and perform timely analysis and detection. The programming port, which can be removed later, is used to input and update the software programs such as filtering and detection algorithms.
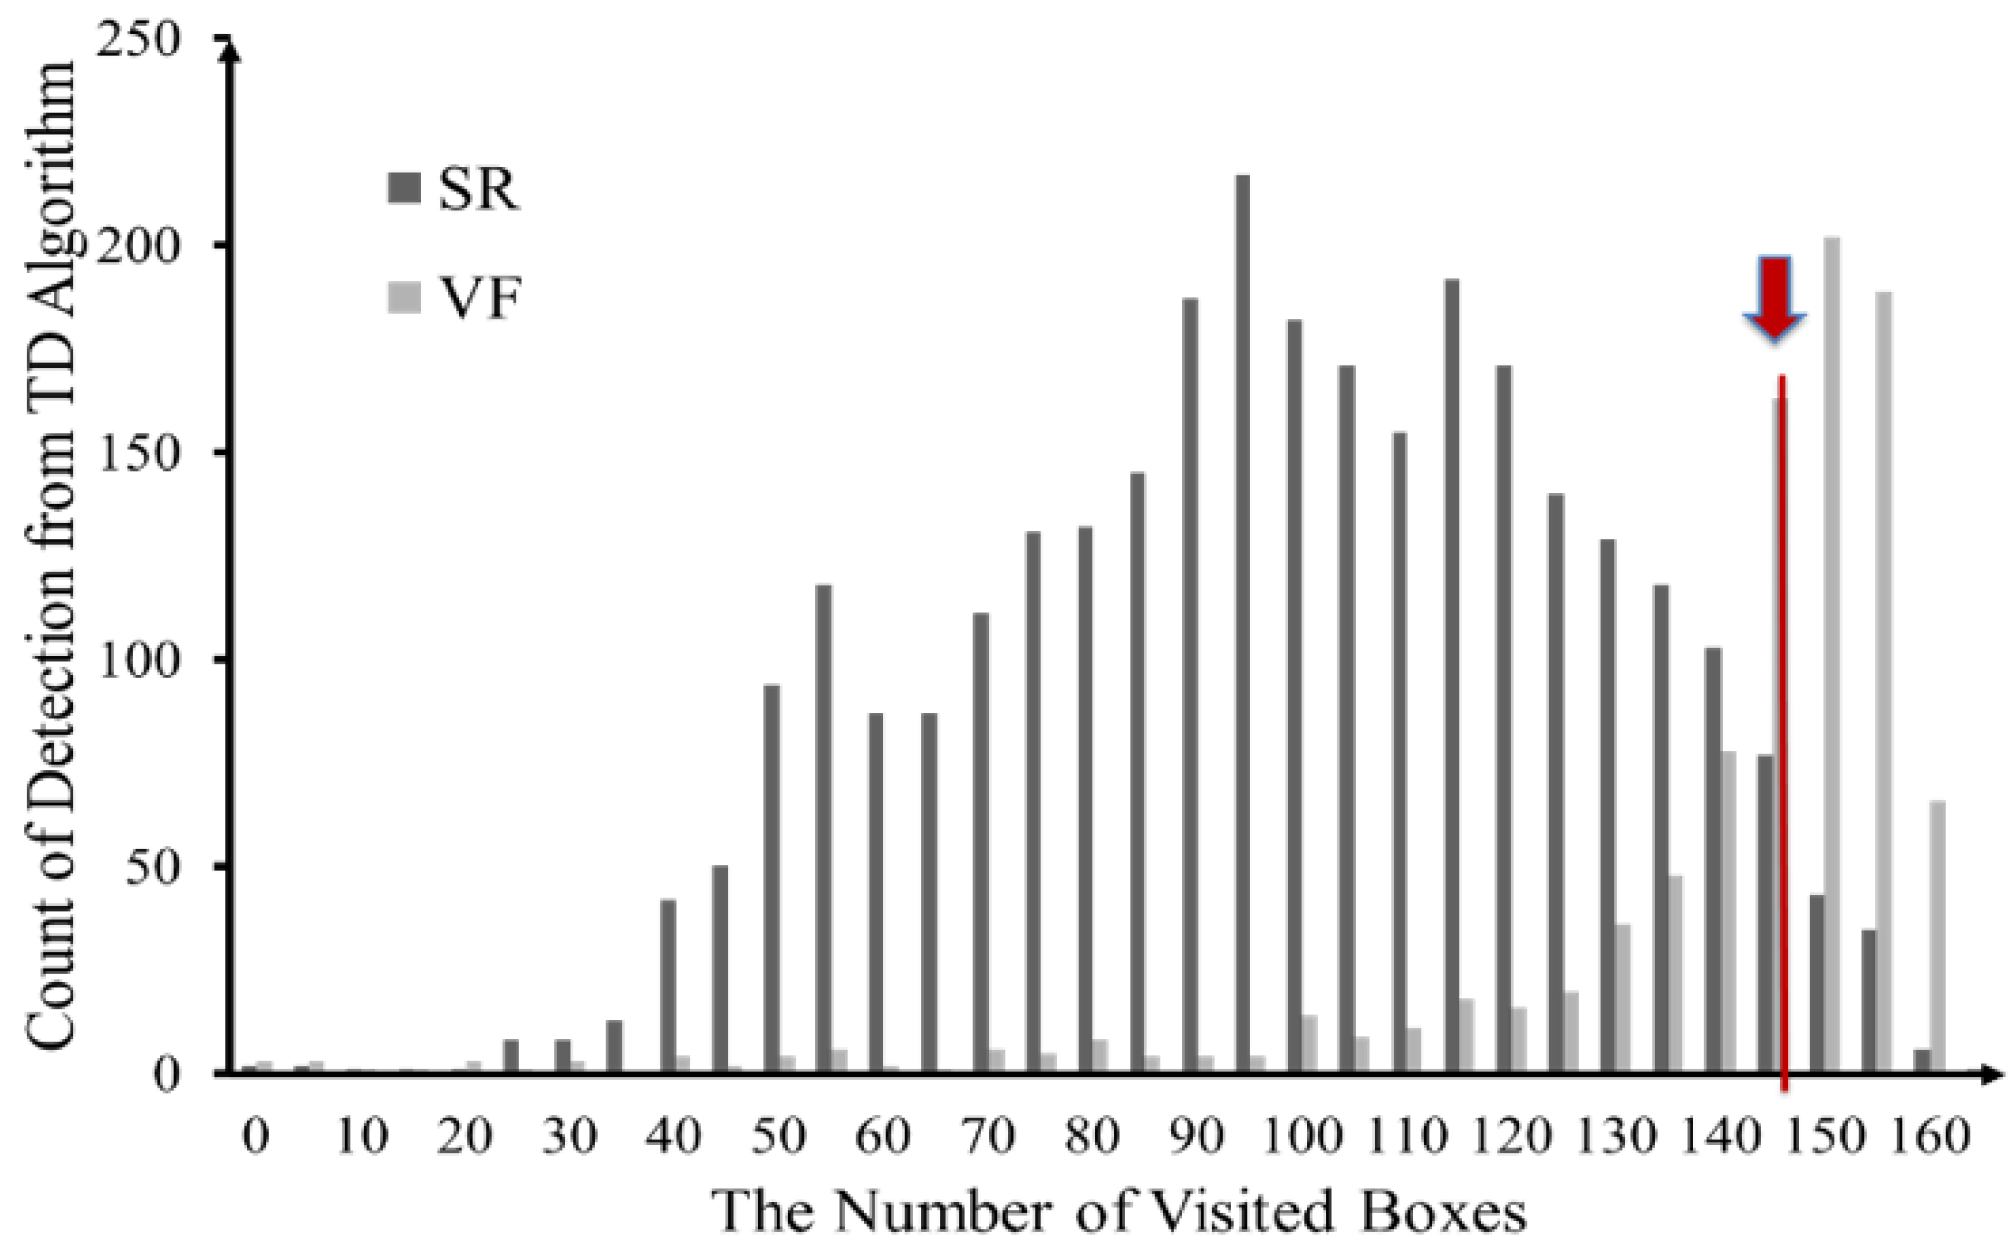
The real-time evaluation system is coded in C# programming language running in a laptop with Windows 7 operating system. We classify ECG signals into three classes: VF, SR and no VF-SR (Note: There are several periods in the ECG signal marked as “-”, which we labeled them as no VF-SR here). Determining the proper threshold parameter is essential but difficult to do. We use a simple discriminant analysis to aid the estimation. According to our tests, most of the algorithms show relatively high reparability between the decisions of SR and VF. The thresholds of each algorithm can be decided at the boundary between the density distributions of SR and VF. Figure 10 shows the probability histograms of the parameter NTime delay within the CU database. For example, in this case, the best threshold value for TD is around 145. That is, NTime delay = 145. Using similar approach, we obtain the threshold values for other algorithms as follows: NTCSC = 15, NTOMP = 10, and NVF filter = 0.5060.
4.3. Performance Measures
Four quality performance statistics, sensitivity, specificity, positive predictivity and accuracy, which are commonly employed in automated ECG analysis [7,12,13,14,15,16,17,29], ROC curve [30] and two other measures related to computation and energy efficiency are also considered to assess performance.
The detecting ability of the algorithms can be compared to the annotations on the database. The comparing process produces four values from raw data: false positives (FP), false negatives (FN), true positives (TP), and true negatives (TN). Using these values, various performance indexes can be derived. These measures have been commonly used in evaluating the VF detection research. In order to calculate these measures, four types of values from the systems are collected: false positives (FP), false negatives (FN), true positives (TP), and true negatives (TN). Using these values, various performance measures can be derived. The metrics (Sn, Sp, Pp, and Ac) can then be calculated as follows:
Sn = (detected cases of VF)/(all cases of VF) = TP/(TP + FN),
Sp = (detected cases of no VF)/(all cases of no VF) = TN/(TN + FP),
Pp = (detected cases of VF)/(all cases classified by the algorithm as VF) = TP/(TP + FP),
Ac = (all true decisions)/(all decisions) = (TP + TN)/(TP + FP + TN + FN).
In general, a good detection algorithm should produce high sensitivity as well as high specificity. However, sometime this is hard to achieve and needs trade-off due to data imbalance issue commonly found in medical diagnosis problem [30]. The ROC curve, which plots the values of sensitivity and (1–specificity) together in the diagram, is used as a single quality parameter to gauge the quality performance for VF detection.
The computational time, Ct, for different algorithms to perform the analysis is recorded in percent rounded to 2 digits relative to the total operation time to assess computational efficiency. In a pervasive sensing monitoring, energy consumption is another important factor for the mobile device. To calculate the average energy consumption for the VF detection algorithms, the integral of the power curve and execution time is needed. We calculate the power value from measured voltage and load resistor. ET is the total energy consumption in Joule (J), which is a derived unit of energy. T is the total executed time of the database. Vt and It are the voltage and current values at each time t, respectively. For example, if the average power consumption (P = V × I) is 0.3 mW (10 mV × 0.03 A) with total executed time 300-seconds, E300 is calculated as 90 mJ (0.3 mW × 300 s).
4.4. The Testing Database
To verify the proposed algorithms, it is very important that the correct annotations suggested by cardiologists can be compared with the decisions between VF and no-VF events derived from the algorithms. Two annotated databases, MIT-BIH (VF) and CU [9], which have been widely used in VF studies [10,11,12,13,15,16], are used in this study. The types of rhythms included in these databases are normal sinus rhythm, ventricular tachycardia, and ventricular fibrillation. We review the key characteristics and revise some (mainly sampling frequency (62.5 Hz) and ADC resolution (8 bit)) to perform our evaluation. The key features are summarized in Table 2, where the values in boldface are those we have changed.
5. Results and Analysis
5.1. Performance of the Proposed Filtering Method
Table 3a,b summarize the average computational results from experiment 1 using the CU and MIT-BIH (VF) databases, respectively. The boldface values indicate the two best results and the values in italic style or in red color are the two worst results. We have included the corresponding results from three open literatures for comparison. We excluded the most recent literature [14], because they evaluate three databases (CU databae, MIT database, VF database) but used average values for the four quality parameters. If the result is shown as average values of all databases, the accuracy of quality parameters is hard to compare because the results from each database are quite different, for example, as can be seen from Table 3a,b, the results between CU database is quite different from those of MIT-BIH database.
As shown, there is no single algorithm stands out in all four measures either from literature or from our study. However, literature and this study both indicate that VFF algorithm performs better than other algorithms in terms of specificity, positive predictivity, and accuracy; but, it does not do well on the sensitivity measure, which is a major deficiency of VFF. This is because that most data sets, especially the MIT-BIH (VF) data sets, have much more SR signals than VF events. In terms of sensitivity measure, both results show that other algorithms, especially TCI and TCSC, performed much better than VFF.
Overall, in terms of all four quality measures, TCSC and TD performed better than other methods and TOMP performed the worst. In terms of calculation time, early literature did not consider this issue except Amann et al. [11]. Our study indicated that TCSC and TCI are more computationally efficient, followed by VFF, TOMP and TD.
Please note that, in addition to reveal the above similar trend, most of the corresponding values between literature and this study are relatively closer to each other. This assures us that the performance of the proposed filtering process is comparable to the popular filtering.m implementation. The results also help to verify the accuracy of our coding process for the algorithms that we adopted. The potential variations in values between literature and this study are due to the differences in several factors (e.g., parameters, sampling frequency, etc.) that may impact the results and unfortunately, most references do not provide specific information about those factors; thus, it is impossible to simulate and verify the exact values from open literature.
5.2. Feasibility and Effectiveness
Table 4a,b summarize the average computational results from experiment 2 running on a microcontroller. Where, the boldface values indicate the best results and the italic values (or in red color) indicate their performance is worse than 50%. As shown, most of the values are slightly lower, but not significantly lower, than the corresponding values using 8-s window size. The results give us confidence that both the revised filtering process and the VF detection algorithms were efficiently deployed in a microcontroller with good performance. The slightly degradation in performance can be attributed to the shorter window size used in data extraction.
Similar to the results of experiment 1, the results indicate that VFF is performed the best in terms of specificity, positive predictivity and accuracy for both databases, VFF did not perform well in sensitivity measure; therefore, VFF cannot be the best method for VF detection. On the other hand, TD algorithm is performed quite well in all quality measures (but not necessarily the best for all measures). We need to have a more objective way of choosing proper method, which is where the receiver operating characteristic (ROC) curve was called in. ROC curve takes into consideration of both sensitivity and specificity.
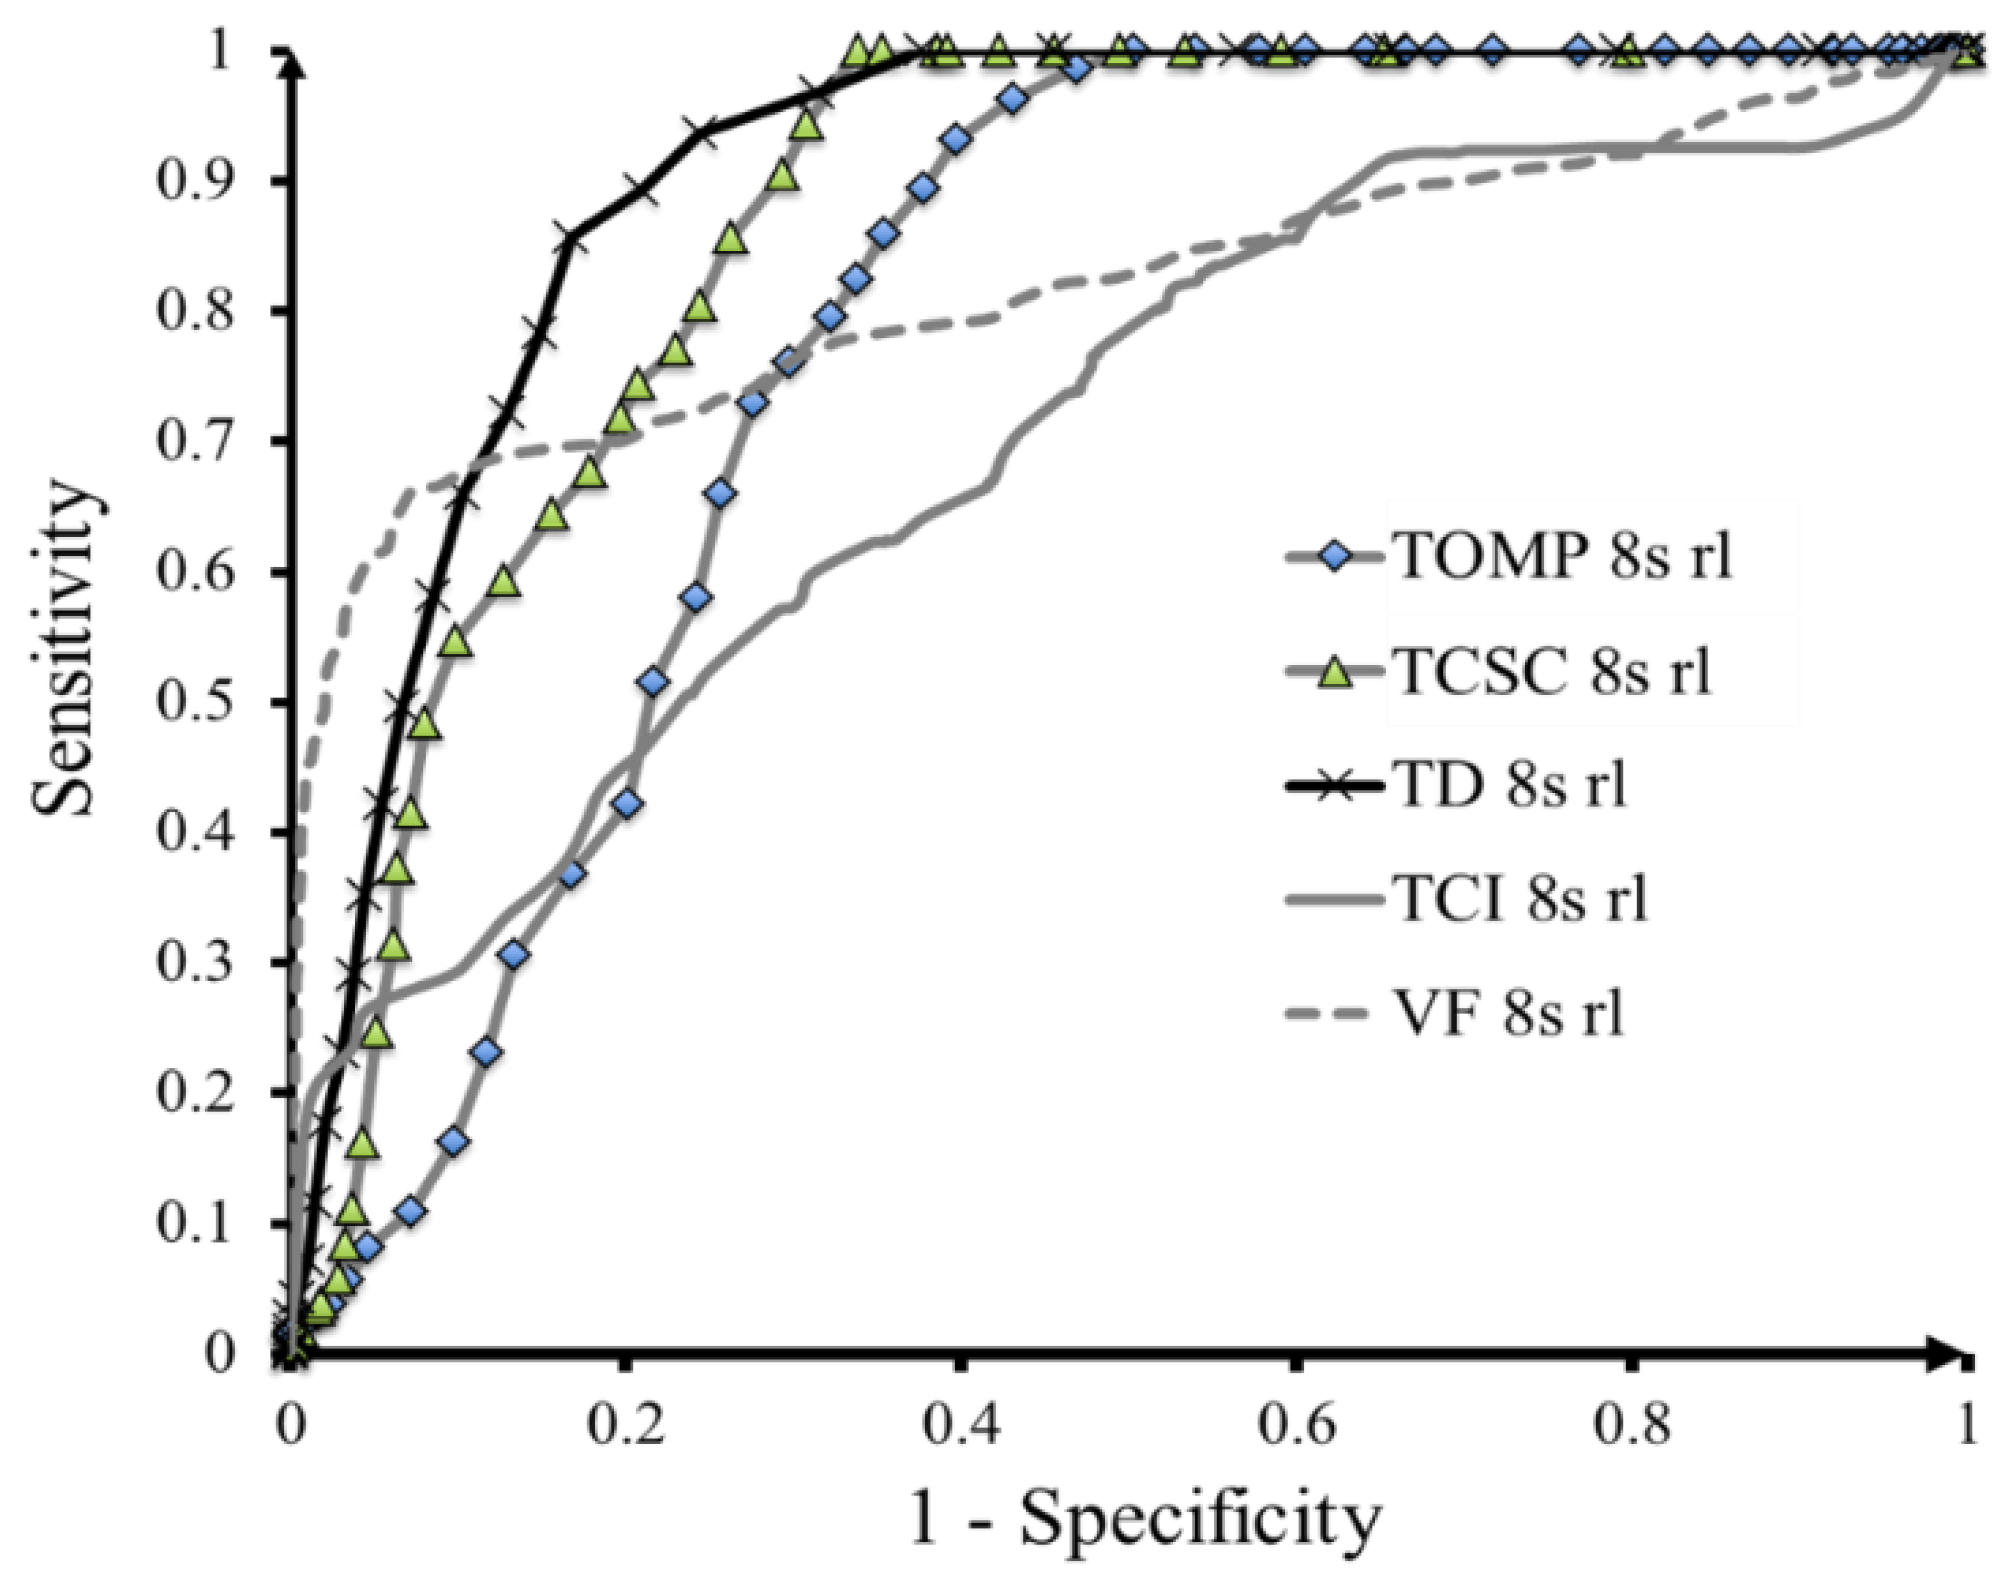
Figure 11 shows the results of ROC curve. In general, the closer the ROC curves to the left-upper point, the better the performance. As shown, the TD algorithm shows the best performance, followed by the TOMP and TCSC algorithms. Both VFF and TCI show some degree of low sensitivity, which indicates that they have difficulty of detecting QRS signals. Although TD has the best performance according to ROC curve, it is still not that close to the left-upper point, which indicates that there are potentials for further improvement.
5.3. Efficiency and Power Saving
To assess computational time and energy consumption, we compute the relative value (in %) as relative to the lowest value:
Relative Value = Its Value/Lowest Value,
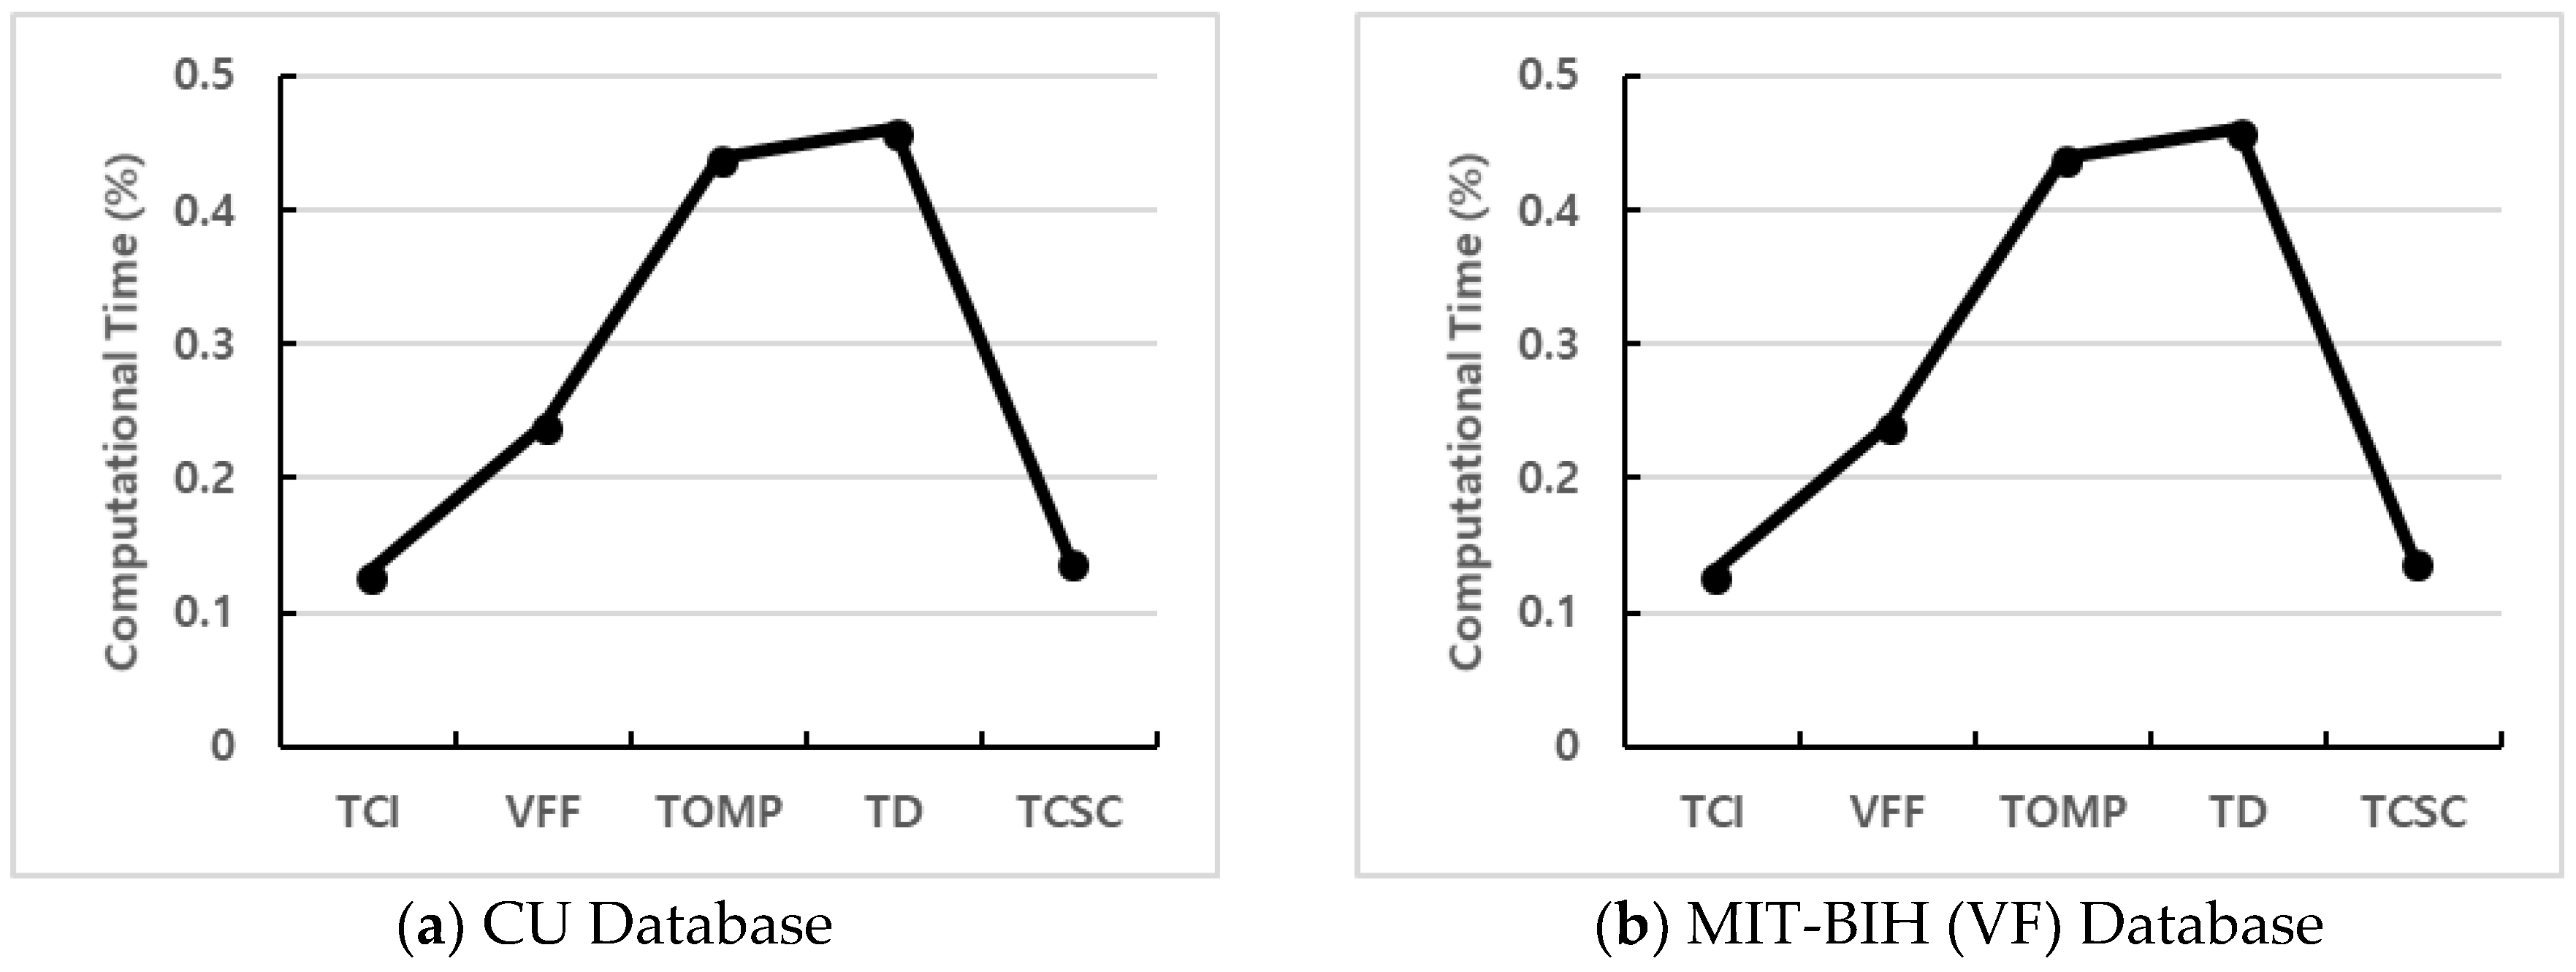
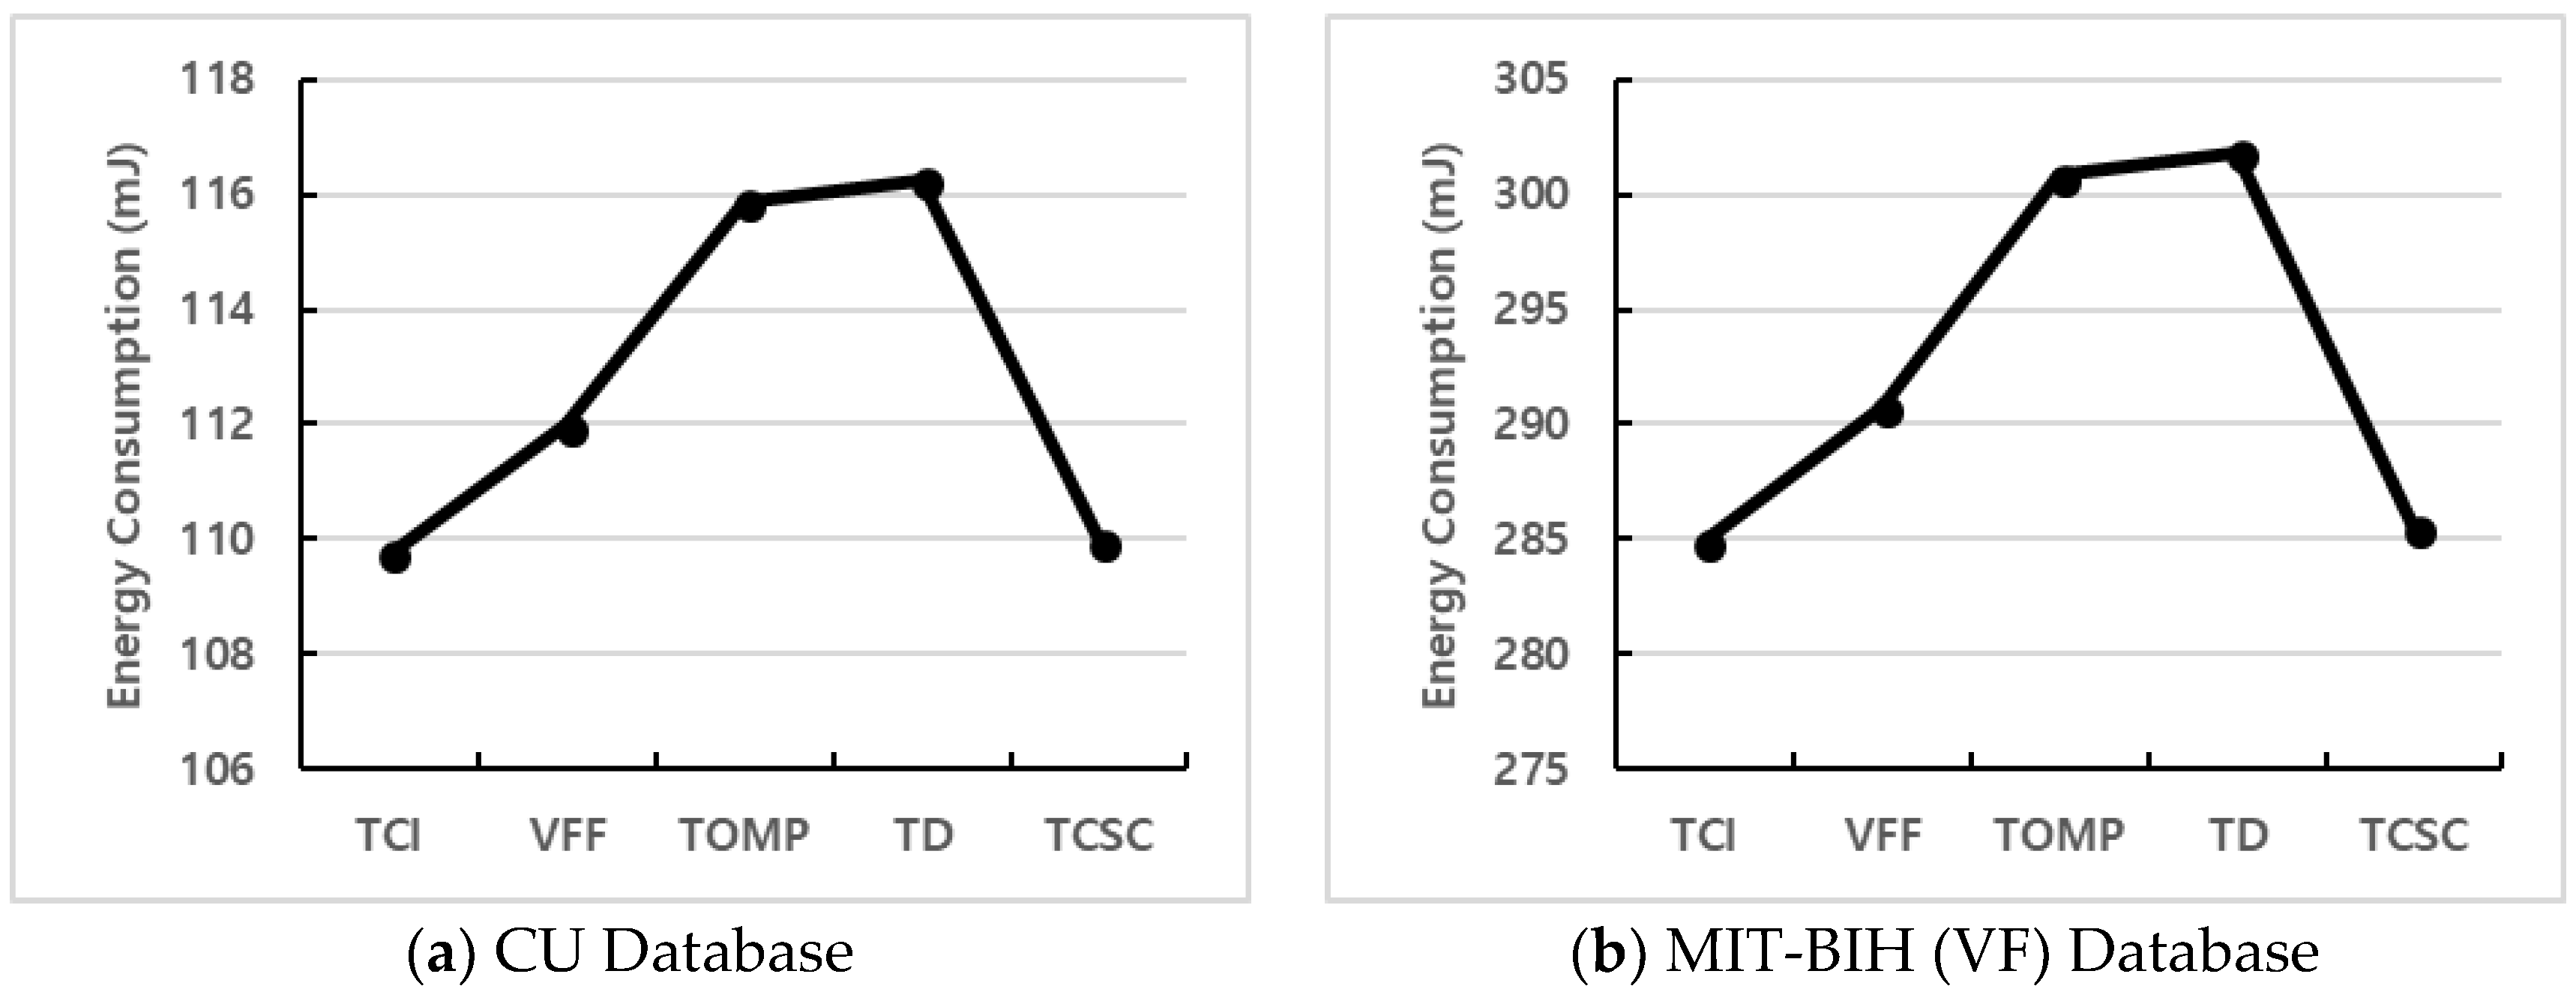
The lower value means more computational time or a lower energy consumption rate. As shown in Table 3, we can conclude that TCI is the most efficient method for both databases, followed by TCSC. TOMP and TD often took a longer time to obtain results. For easy comparison, we further plot the computational time results and energy consumption in graphs. Figure 12 and Figure 13 show the computational time and energy consumption plots respectively for different VF detection algorithms running in a microcontroller. As shown, TCI consumes less time and battery power than other methods in both databases, followed by TCSC and VF. For both databases, the TD algorithm does consume the most time and energy as shown in the figures. This is because TD algorithm uses 1600 boxes that need to store information in the memory with loop functions for detecting a VF event.
6. Discussion
Designing wearable systems for real-time health monitoring have to consider many technical, wearable, and medical requirements. For instance, power consumption, mobility, reliability, real-time response, multi-function integration, detection accuracy, wearability, usability, data security and privacy, and clinical validation are important issues to be considered [5,6,9,20]. In addition, we should also consider the resource constraints and computational capability of microcontroller as we use microcontroller for real-time data capturing, filtering, and VF detection. We discuss some specific issues related to microcontroller in more details below.
The first issue, which relates to signal extraction, is the window size to segment the data. In this study, we choose the 5 s window segmentation for data extraction on a microcontroller. If we use more than 5 s as window for segmentation, the memory of the microcontroller is not enough to support the window size. Using 5 s window segment, processing time and detection results are faster than 8 s. However, power consumption is increased because the VF detection algorithm is applied more frequently. Extracting signals every 5 s means that about 312 sampling ECG data (62.5 Hz sampling frequency) are saved in the memory for extracting the features of VF detection. If we use high sampling frequency (250 Hz), the power and processing time for extraction are increased about four times.
The second issue that is critical to quality performance is the determination of prescribed threshold values for different detection algorithms. TCI uses basically a 3 s segment to detect VF events. TOMP, TD, and TCSC count the number of detected events in the window. If accurate thresholds for the changed window size are determined, results similar to the 8 s window can be achieved in the 5 s window size. Although it is possible to use a microcontroller with larger memory to increase the length of window segmentation and thus, it might (or might not) slightly increase the detection accuracy, it will shorten the battery life significantly and result in a longer time to process and detect a VF abnormality. Since our goal is to detect VF in real time, we need to consider the trade-off among duration to detect, battery life, and accuracy.
Thirdly, we face the dilemma of selecting the best algorithm. Theoretically, the best algorithm is the one that provides 100% (or near) results on all quality measures or at least for both sensitivity and specificity measures and yet computationally efficient and less power consumption. However, due to data imbalance problem (that is, most databases consist of a majority of SR signal and very small portion of VF events), it is hard to find a method performed well on all measures. For instance, VFF has good performance in Sp, Pp, and Ac, but it has the worst performance in Sn. According to our tests, TD has good performance in all four quality measures, but it is also more computational intensive and consumes more energy. Considering the need of accurate and robust detection for VF, we would recommend TD for adoption consideration.
Fourthly, It is very important that the trade-off between specificity and sensitivity in safety critical systems such as VF detection. High sensitivity is important issue because missed events will likely lead to death whereas specificity might be also very important if the algorithm is to control the automatic external defibrillator (AED). High specificity is able to prevent the unnecessary shocks from the AED. Thus, selecting the right threshold to more specificity is important in VF detection.
7. Conclusions
This paper proposes an energy efficient real time VF detection methodology with the integration of filtering processes, data extraction and VF detection algorithms in an embedded microcontroller. The results show that real time VF detection using an embedded microcontroller is about five times more efficient than the continuous transmission of ECG signals via wireless communications. Among the selected VF detection algorithms, overall, the TD and TCSC have a relatively high performance considering all the quality parameters. The proposed integrated hardware and software module (ECG device plus microcontroller) can be implemented as an efficient and practical detection system to correctly detect VF abnormality, especially on a real time basis.
To the best of our knowledge, this is one of the first studies that attempts to detect VF in a microcontroller with sophisticated detection algorithms. The main advantages are to save battery power consumption and shorten response time when an emergency occurs. We suggest a revision in the filtering process and some detection algorithms and use a 5-s window segment to ensure that we meet memory requirements. For future studies, first, the impact of different filtering processes needs to be explored in order to select the best filtering method. Secondly, how to reduce window length in a microcontroller needs to be explored. Thirdly, in order to achieve more efficient energy consumption, the hardware implementation of the filtering processes on-chip may need to be considered. Fourthly, to avoid the misdetection of heart activity, processing with multi-sensors such as accelerometers and body temperature sensors need to be examined. Finally, the proposed methodology (The embedded module and integrated testing prototype) can be extended to other applications related to diverse physiological data analysis.
Author Contributions
J.K. and C.-H.C. designed the algorithm and the experiments. S.K. and J.K. implemented the algorithm, analyzed the data and wrote the article. C.-H.C. reviewed the paper and contributed to analysis of the data.
Acknowledgments
This work was supported by a 2016 research grant from Youngsan University, Republic of Korea.
Conflicts of Interest
The authors declare no conflict of interest.
References
- World Health Organization. Available online: http://www.who.int/mediacentre/factsheets/fs317/en/index.html (accessed on 1 May 2018).
- Weaver, W.D.; Cobb, L.A.; Hallstrom, A.P.; Copass, M.K.; Ray, R.; Emery, M.; Fahrenbruch, C. Considerations for Improving Survival from Out-of-Hospital Cardiac Arrest. Ann. Emerg. Med. 1986, 15, 1181–1186. [Google Scholar] [CrossRef]
- Leijdekkers, P.; Gay, V. A Self-test to Detect a Heart Attack Using a Mobile Phone and Wearable Sensors. In Proceedings of the 2008 21st IEEE International Symposium on Computer-Based Medical Systems, University of Jyväskylä, Jyvaskyla, Finland, 17–19 June 2008; pp. 93–98. [Google Scholar]
- Pantelopoulos, A.; Bourbakis, N.G. A Survey on Wearable Sensor-Based Systems for Health Monitoring and Prognosis. IEEE Trans. Syst. Man Cybern. C Appl. Rev. 2010, 40, 1–12. [Google Scholar] [CrossRef] [Green Version]
- Flores-Mangas, F.; Oliver, N. Healthgear: A Real-Time Wearable System for Monitoring and Analyzing Physiological Signals. In Proceedings of the International Workshop on Wearable and Implantable Body Sensor Networks (BSN’06), Cambridge, MA, USA, 3–5 April 2006. [Google Scholar]
- Kim, J.; Chu, C.H. Analysis and Modeling of Selected Energy Consumption Factors for Embedded ECG Devices. IEEE Sens. J. 2015, 16, 1795–1805. [Google Scholar] [CrossRef]
- Filtering.m. Available online: https://homepages.fhv.at/ku/karl/VF/filtering.m (accessed on 1 May 2018).
- Dağtaş, S.; Pekhteryev, G.; Şahinoğlu, Z.; Çam, H.; Challa, N. Real-Time and Secure Wireless Health Monitoring. Int. J. Telemed. Appl. 2008, 2008, 1–10. [Google Scholar] [CrossRef] [PubMed] [Green Version]
- Khan, J.M.; Katz, R.H.; Pister, K.S.J. Emerging Challenges: Mobile Networking for Smart Dust. J. Commun. Netw. 2000, 2, 188–196. [Google Scholar] [CrossRef]
- Goldberger, A.L.; Amaral, L.A.; Glass, L.; Hausdorff, J.M.; Ivanov, P.C.; Mark, R.G.; Mietus, J.E.; Moody, G.B.; Peng, C.K.; Stanley, H.E. PhysioBank, PhysioToolkit, and PhysioNet: Components of a New Research Resource for Complex Physiologic Signals. Circulation 2000, 101, E215–E220. [Google Scholar] [CrossRef] [PubMed]
- Jekova, I.; Krasteva, V. Real Time Detection of Ventricular Fibrillation and Tachycardia. Physiol. Meas. 2004, 25, 1167–1178. [Google Scholar] [CrossRef] [PubMed]
- Amann, A.; Tratnig, R.; Unterkofler, K. Reliability of Old and New Ventricular Fibrillation Detection Algorithms for Automated External Defibrillators. BioMed. Eng. OnLine 2005, 4, 60. [Google Scholar] [CrossRef] [PubMed]
- Amann, A.; Tratniq, R.; Unterkofler, K. A New Ventricular Fibrillation Detection Algorithm for Automated External Defibrillators. In Proceedings of the Computers in Cardiology, Lyon, France, 25–28 September 2005; pp. 559–562. [Google Scholar]
- Ismail, A.H.; Fries, M.; Rossaint, R.; Leonhardt, S. Validating the Reliability of Five Ventricular Fibrillation Detecting Algorithms. In Proceedings of the 4th European Conference of the International Federation for Medical and Biological Engineering, Antwerp, Belgium, 23–27 November 2008; pp. 26–29. [Google Scholar]
- Abu, E.M.A.; Lee, S.Y.; Hasan, M.K. Sequential Algorithm for Life Threatening Cardiac Pathologies Detection based on Mean Signal Strength and EMD Functions. BioMed. Eng. OnLine 2010, 9, 43. [Google Scholar]
- Arafat, M.A.; Chowdhury, A.W.; Hasan, M.K. A Simple Time Domain Algorithm for the Detection of Ventricular Fibrillation in Electrocardiogram. Signal Image Video Process. 2011, 5, 1–10. [Google Scholar] [CrossRef]
- Fokhenrood, S.; Leijdekkers, P.; Gay, V. Ventricular Tachycardia/Fibrillation Detection Algorithm for 24/7 Personal Wireless Heart Monitoring. In Proceedings of the 5th International Conference on Smart Homes and Health Telematics, Nara, Japan, 21–23 June 2007; pp. 110–120. [Google Scholar]
- Zhang, Z.X.; Tian, X.W.; Lim, J.S. Real-Time Algorithms for a Mobile Cardiac Monitoring System to Detect Life-Threatening Arrhythmias. In Proceedings of the 2nd International Conference on Computer and Automation Engineering, Singapore, 26–28 February 2010; pp. 232–236. [Google Scholar]
- Rospierski, M.; Segura, M.; Guzzo, M.; Zavalla, E.; Sisterna, C.; Laciar, E. Ventricular Fibrillation Detection Algorithm Implemented in a Cell-Phone Platform. In Proceedings of the Congreso Argentino de Sistemas Embebidos 2011, Buenos Aires, Argentina, 2–4 March 2011; pp. 168–173. [Google Scholar]
- Choudhary, D.; Kumar, R.; Gupta, N. Real-Time Health Monitoring System on Wireless Sensor Network. Int. J. Adv. Innov. Thoughts Ideas 2012, 1, 37–43. [Google Scholar]
- Yadav, D.; Agrawal, M.; Bhatnagar, U.; Gupta, S. Real Time Health Monitoring Using GPRS Technology. Int. J. Recent Innov. Trends Comput. Commun. 2013, 1, 368–372. [Google Scholar]
- Amann, A.; Tratniq, R.; Unterkofler, K. Detecting Ventricular Fibrillation by Time-Delay Methods. IEEE Trans. Biomed. Eng. 2007, 54, 174–177. [Google Scholar] [CrossRef] [PubMed]
- Thakor, N.V.; Pan, K. Ventricular Tachycardia and Fibrillation Detection by a Sequential Hyphesis testing algorithm. IEEE Trans. Biomed. Eng. 1990, 37, 837–843. [Google Scholar] [CrossRef] [PubMed]
- Kuo, S.; Dillman, R. Computer Detection of Ventricular Fibrillation. In Proceedings of the Computers in Cardiology, Los Alamitos, CA, USA, 12–14 September 1978; pp. 347–349. [Google Scholar]
- Pan, J.; Tompkins, W. A real-time QRS detection algorithm. IEEE Trans. Biomed. Eng. 1985, 32, 230–236. [Google Scholar] [CrossRef] [PubMed]
- Zhang, X.; Jiang, H.; Zhang, L.; Zhang, C.; Wang, Z.; Chen, X. An Energy-Efficient ASIC for Wireless Body Sensor Networks in Medical Applications. IEEE Trans. Biomed. Circuits Syst. 2010, 4, 11–18. [Google Scholar] [CrossRef] [PubMed]
- Simon, D. Kalman Filtering. Embed. Syst. Program. 2001, 14, 72–79. [Google Scholar]
- Texas Instrument. ez430-2500 Development Tool—User’s Guide, Literature Number: SLAU227E; Texas Instrument: Dallas, TX, USA, 2009. [Google Scholar]
- Thakor, N.V. From Holter Monitors to Automatic Defibrillators: Developments in Ambulatory Arrhythmia Monitoring. IEEE Trans. Biomed. Eng. 1984, 31, 770–778. [Google Scholar] [CrossRef] [PubMed]
- Bradley, A.P. The Use of the Area under the ROC Curve in the Evaluation of Machine Learning Algorithms. Pattern Recognit. 1997, 30, 1145–1159. [Google Scholar] [CrossRef]
Figure 1.
Flow chart of the proposed VF detection methodology.
Figure 2.
Voltage differences in the proposed VF detection methodology.
Figure 3.
An example of the scaling process.
Figure 4.
Effects of cosine window process in TCSC.
Figure 5.
The turning point between a sinus rhythm and the VF event.
Figure 6.
Different types of sinuous rhythms from CU database (62.5 Hz).

Figure 7.
Conceptual framework of the testing environment.
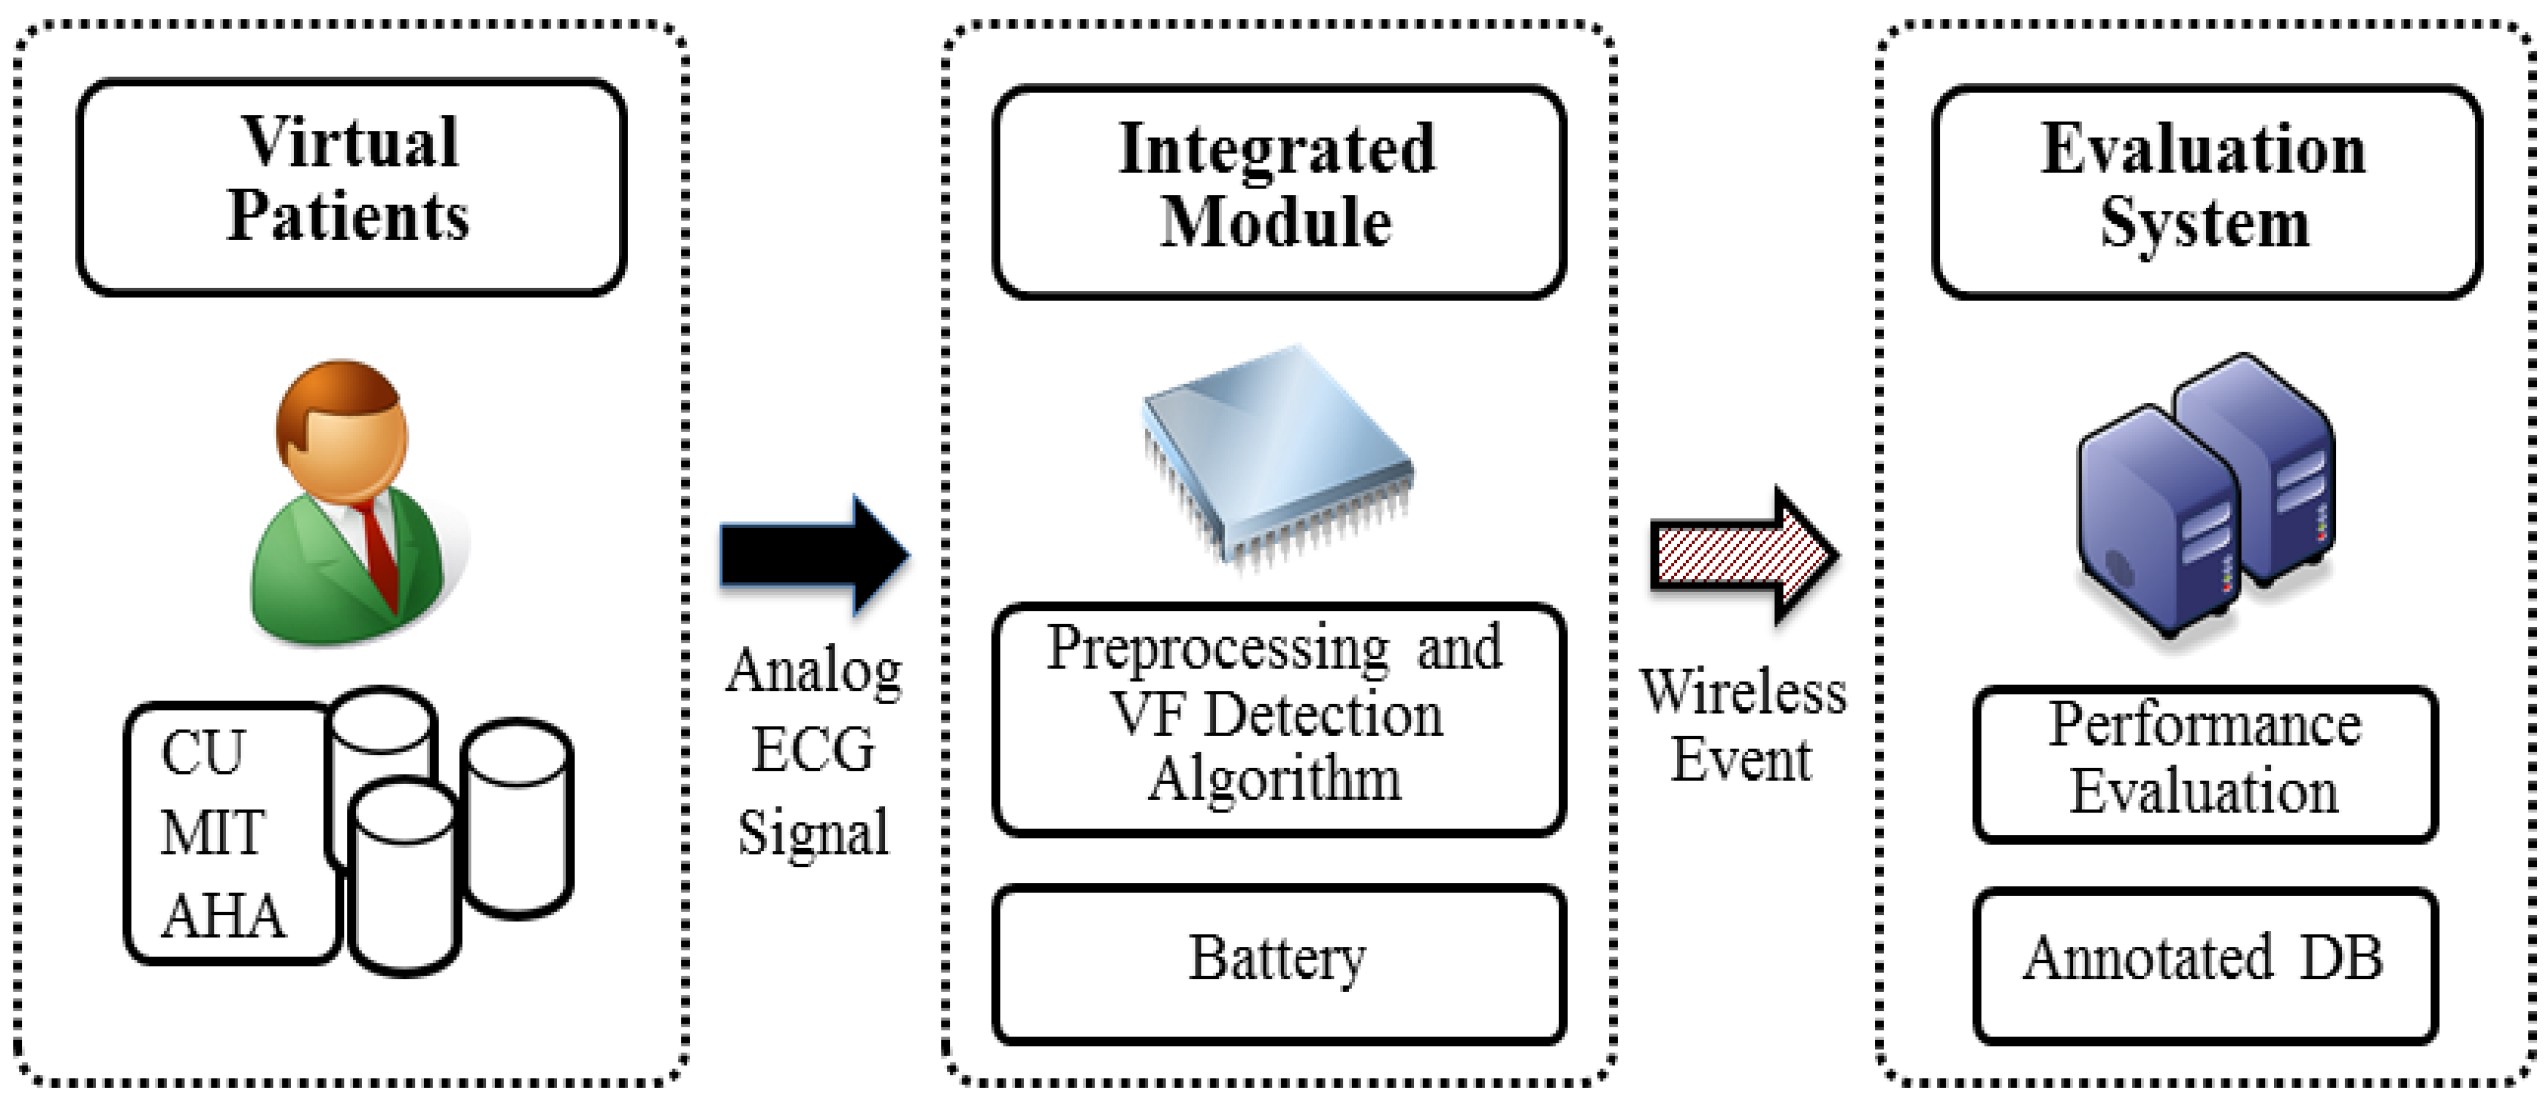
Figure 8.
Block diagram of the testing environment.
Figure 9.
Final optimal prototype of the ECG embedded module.
Figure 10.
Probability histogram for deciding the parameter of TD within CU database.

Figure 11.
ROC curves for five VF detection algorithms (rl: real-time filter).
Figure 12.
Relative calculation time.
Figure 13.
Relative energy consumption.


Table 1.
Summary of alternative VF detection approaches.
| Tasks/Performance | Traditional Approach | Smartphone-Based | Proposed Approach |
|---|---|---|---|
| Data Capture | EM | EM | EM |
| Data Transmitted | Raw data | Raw data | Detected events |
| Transmission Method | SP | SP | SP |
| Data Filtering and Scale | CCS | SP | EM |
| Data Analysis | CCS | SP | EM |
| Event Detection | CCS | SP | EM |
| Service Request | SP | SP | SP |
| Response time (delay) | Long | Some | Little |
| Energy Consumption | High | High | Low |
| Accuracy | Same | Same | Same |
| Network Traffic | High | Some | Low |
Table 2.
Summary of performance for VF detection algorithms.
| Features | MIT-BIH (VF) Database | CU Database | ||
|---|---|---|---|---|
| Original | Modified | Original | Modified | |
| Sampling frequency | 250 Hz | 62.5 Hz | 250 Hz | 62.5 Hz |
| Channel | 2 | 1 | 1 | 1 |
| ADC Resolution | 12 bits | 8 bits | 12 bits | 8 bits |
| Number of patients | 22 | 22 | 35 | 35 |
| Record length | 35 min | 35 min | 508 s | 508 s |
| Gain (adu/Mv) | 200 | 200 | 200 | 200 |
Table 3.
Summary of performance for VF detection algorithms.
| (a) CU Database | ||||||
| Algorithm | Reference | Sn (%) | Sp (%) | Pp (%) | Ac (%) | Ct (Second) * |
| TCI | [11] | 71.00 | 70.50 | 38.90 | 70.60 | 2.1 |
| [15] | 90.15 | 55.12 | 35.70 | 62.71 | - | |
| [13] | 67.89 | 75.45 | - | - | - | |
| This Study | 69.74 | 62.39 | 38.31 | 64.21 | 22.40 | |
| VFF | [11] | 30.80 | 99.50 | 94.50 | 85.20 | 1.9 |
| [13] | 71.41 | 79.88 | - | - | - | |
| This Study | 36.23 | 99.67 | 97.16 | 84.44 | 42.67 | |
| TOMP | [11] | 71.30 | 48.40 | 26.70 | 53.20 | 0.8 |
| This Study | 73.5 | 54.85 | 34.63 | 59.43 | 78.23 | |
| TD | [21] | 70.20 | 89.30 | 65.00 | 85.10 | 1.7 |
| [15] | 75.35 | 91.46 | 70.92 | 87.97 | - | |
| [13] | 72.51 | 88.08 | - | - | - | |
| This Study | 69.6 | 88.26 | 65.48 | 83.73 | 81.79 | |
| TCSC | [15] | 79.74 | 88.14 | 65.02 | 86.32 | - |
| This Study | 63.24 | 81.29 | 51.90 | 76.92 | 24.18 | |
| (b) MIT-BIH (VF) Database | ||||||
| Algorithm | References | Sn (%) | Sp (%) | Pp (%) | Ac (%) | Ct (Second) * |
| TCI | [11] | 74.50 | 83.90 | 0.80 | 83.90 | - |
| [15] | 100 | 56.82 | 0.37 | 56.89 | - | |
| This Study | 68.39 | 58.87 | 38.64 | 61.48 | 58.21 | |
| VFF | [11] | 29.40 | 100.0 | 82.40 | 99.90 | - |
| This Study | 59.81 | 96.73 | 87.06 | 86.81 | 110.88 | |
| TOMP | [11] | 68.50 | 40.60 | 0.20 | 40.60 | - |
| This Study | 88.95 | 84.97 | 69.86 | 86.09 | 203.28 | |
| TD | [21] | 74.80 | 99.20 | 13.40 | 99.20 | - |
| [15] | 95.32 | 99.04 | 13.83 | 99.04 | - | |
| This Study | 94.01 | 84.15 | 70.01 | 86.94 | 212.52 | |
| TCSC | [15] | 97.48 | 99.33 | 18.98 | 99.33 | - |
| This Study | 76.51 | 72.91 | 51.77 | 73.90 | 62.83 | |
* The comparison of Ct may not be meaningful because different computers and operating systems are used. Also, previous studies did not include the time for the filtering process used. The boldface values indicate the two best results and the values in italic style or in red color are the two worst results.
Table 4.
Summary of performance for different VF detection algorithms running in a microcontroller.
| (a) CU Database (508 s/each patient data) | ||||||
| Algorithm | Sn (%) | Sp (%) | Pp (%) | Ac (%) | Ct (%) | E508-S (mJ) |
| TCI | 71.63 | 61.75 | 48.58 | 63.65 | 0.13 | 109.77 |
| VFF | 38.01 | 99.70 | 80.11 | 84.61 | 0.24 | 111.99 |
| TOMP | 77.60 | 55.62 | 45.85 | 59.63 | 0.44 | 115.88 |
| TD | 70.88 | 88.12 | 72.75 | 84.01 | 0.46 | 116.27 |
| TCSC | 62.87 | 80.87 | 64.33 | 77.50 | 0.14 | 109.97 |
| (b) MIT-BIH (VF) Database (35 s/each patient data) | ||||||
| Algorithm | Sn (%) | Sp (%) | Pp (%) | Ac (%) | Ct (%) | E35-M (mJ) |
| TCI | 60.66 | 64.90 | 38.86 | 63.76 | 60.66 | 284.97 |
| VFF | 59.94 | 96.78 | 87.09 | 86.97 | 0.24 | 290.72 |
| TOMP | 71.66 | 95.61 | 85.70 | 89.17 | 0.44 | 300.82 |
| TD | 96.56 | 81.53 | 66.74 | 85.70 | 0.46 | 301.83 |
| TCSC | 72.76 | 72.47 | 49.41 | 72.55 | 0.14 | 285.47 |
The boldface values indicate the two best results and the values in italic style or in red color are the two worst results.
© 2018 by the authors. Licensee MDPI, Basel, Switzerland. This article is an open access article distributed under the terms and conditions of the Creative Commons Attribution (CC BY) license (http://creativecommons.org/licenses/by/4.0/).
Share and Cite
MDPI and ACS Style
Kwon, S.; Kim, J.; Chu, C.-H. Real-Time Ventricular Fibrillation Detection Using an Embedded Microcontroller in a Pervasive Environment. Electronics 2018, 7, 88. https://doi.org/10.3390/electronics7060088
AMA Style
Kwon S, Kim J, Chu C-H. Real-Time Ventricular Fibrillation Detection Using an Embedded Microcontroller in a Pervasive Environment. Electronics. 2018; 7(6):88. https://doi.org/10.3390/electronics7060088
Chicago/Turabian StyleKwon, Sundeok, Jungyoon Kim, and Chao-Hsien Chu. 2018. "Real-Time Ventricular Fibrillation Detection Using an Embedded Microcontroller in a Pervasive Environment" Electronics 7, no. 6: 88. https://doi.org/10.3390/electronics7060088
Note that from the first issue of 2016, this journal uses article numbers instead of page numbers. See further details here.