An Optimized Algorithm and Test Bed for Improvement of Efficiency of ESS and Energy Use


1
Department of Computer Science Education, Korea University, Seongbuk-gu, Seoul 02841, Korea
2
Department of Software, Catholic University of Pusan, Geumjeong-gu, 57 Oryundae-ro, Busan 46252, Korea
*
Author to whom correspondence should be addressed.
Electronics 2018, 7(12), 388; https://doi.org/10.3390/electronics7120388
Submission received: 1 November 2018
/
Revised: 23 November 2018
/
Accepted: 24 November 2018
/
Published: 4 December 2018
(This article belongs to the Special Issue Challenges and Opportunities of Artificial Intelligence for Electronic Design: Theory and Applications)
Abstract
:The Republic of Korea (ROK) has four distinct seasons. Such an environment provides many benefits, but also brings some major problems when using new and renewable energies. The rainy season or typhoons in summer become the main causes of inconsistent production rates of these energies, and this would become a fatal weakness in supplying stable power to the industries running continuously, such as the aquaculture industry. This study proposed an improvement plan for the efficiency of Energy Storage System (ESS) and energy use. Use of sodium-ion batteries is suggested to overcome the disadvantages of lithium-ion batteries, which are dominant in the current market; a greedy algorithm and the Floyd–Warshall algorithm were also proposed as a method of scheduling energy use considering the elements that could affect communication output and energy use. Some significant correlations between communication output and energy efficiency have been identified through the OPNET-based simulations. The simulation results showed that the greedy algorithm was more efficient. This algorithm was then implemented with C-language to apply it to the Test Bed developed in the previous study. The results of the Test Bed experiment supported the proposals.
1. Introduction
Although the use of nuclear-powered energy may lead to cost reduction, it is actually not an inexpensive energy considering the cost of managing nuclear wastes and the future risk that mankind has to bear. The energy sources that could replace nuclear power are largely divided into the existing limited energies and renewable energies [1,2,3]. However, that the supply of the former is not stable due to their unequal geographic distributions that put countries such as the ROK which have few fossil energy sources in a weak position in the energy market [4,5,6]. Alternative energy sources include renewable energies generated by the limitless supply of sunlight, wind, etc. The geographical variations of these energy sources are relatively small, and they cannot be dominated by the energy-strong [7]. Moreover, they can be eco-friendly if used properly, and the risks are much lower than the fossil energies [8,9]. However, that renewable energies also have a major disadvantage, i.e., being unable to sustain an adequate level of supply against demand. For instance, the rate of power generation will vary on rainy or foggy days. As human consumption of power cannot be changed according to the environment, a method of storing and using power when necessary with energy-efficient batteries or storages can be an alternative solution.
However, that most of the Energy Storage Systems (ESSs) being used at these aquafarms were installed in 2010; they used lithium batteries, and their efficiency was not good. Thus, an efficient algorithm for the sodium-ion battery-based energy storage system which can address the demerits of the lithium-ion batteries dominantly used in the current market was proposed in this study. At the same time, a greedy algorithm and the Floyd–Warshall algorithm were proposed as a method of scheduling energy use considering the elements that could affect communication output and energy use. Some significant correlations between communication output and energy efficiency have been identified through the OPNET-based simulations.
The scheduling for an ESS is an essential task for the efficient use of energy. For this, the exchange of information based on each party’s requirements should be achieved smoothly. However, in an Internet of Things (IoT) environment where the presence of many nodes is expected, it is difficult to achieve such a goal as each node acts as an obstacle to each other while they are attempting to establish their own communications [10,11,12]. In most cases, there are some alternatives when communication fails. Once it has been determined that the communication was unsuccessful, the message can be transmitted again or a request can be made by the receiver to send the same message again after notifying the sender that it has not been received.
In the average household, the drawbacks of renewable energies do not have much influence as the power usage itself is small and the residents usually do not stay at home all the time. This makes it possible for the family to have a power supply system with a simple-structured ESS and they would perceive that it to be satisfactory even if it is not that efficient. It is also possible for them to find the problems in the system intuitively as well. However, for the sites where a large volume of power is required with a sizable ESS (e.g., aquafarms, etc.), the power usages largely vary depending on the season or the environment so that if power is not supplied adequately, there will be serious economic losses or ethical problems. Such a case is a good example of intuitively understanding the necessity of assuring a stable supply of power when using renewable energies.
About 87% of global aquatic resources has been used completely or in a depleted state. At the present rate of progress, it would be impossible to recover these resources naturally. 18 major countries are producing about 76% current marine products through their fishing industries and 25% of 10 major fish species are being overfished by them. Aquaculture could be an alternative. The global marine products production has reached up to 130 billion US dollars in 2014 and is increasing at the rate of 7.2% per year on average.
However, in terms of energy use, the electricity cost in the flatfish farms accounts for an average of 60% of the total maintenance cost and the power required for pumping in the water occupies about 67.9% to 85.2% of total power use. Especially, the average monthly cost of electricity at an aquafarm with the size of approximately 19,834 m2 rises to the level of 60 million won, showing that the inland aquafarms are using power excessively and thereby reducing their reducing their profitability [3,4,5].
The recirculating aquafarm as the focus of this study adopts a system wherein Jeju Island seawater with constant temperature is drawn directly from a depth of 200 m; as long as the power system is maintained in good condition, the farm can be run economically. To prepare against power interruptions due to typhoons, however, the owner has to maintain at all times part-timer(s) to run the emergency generator, which is quite inconvenient and costly for him/her. For this reason, some of the aquafarms near the Jeju Smart Grid Test Bed [4,5] have installed a photovoltaic power generator at the rooftop or near the aquafarm for use in case of emergencies or on a regular basis.
However, the necessary energy should be accurately supplied in the right place at the right time at the aquafarms as it is used to form an environment suitable for survival of aquatic lives. If the energy is not available this way, the environment cannot be maintained and it would inevitably lead to serious economic and material damages to the farms. The Smart Grid using an ESS in the aquafarm has a tendency of not easily changing its composition after once it has been installed. Therefore, for a Smart Grid composed of many nodes, a program which can act as a basis for increasing the communication success rate by adjusting the transmission output has been proposed in this study along with the two ESS scheduling schemes based on the inputs deadline and bonus to deal with the negative situations where there are many obstacles (nodes) are present and disrupting the communications.
The existing tool described here explains a dynamic a dynamic programming (i.e., computational procedure approach) which derives an optimal or an approximate optimal solution to solve the two problems involved in the existing aquafarms by considering the communication efficiency, the energy efficiency affected by this communication efficiency as well as financial aspects based on a number of information pertaining to the importance of the ever-changing relative nodes in the communication process between ESS along with actual of implementation method for the greedy algorithm and its expected effects.
2. Related Research
The ESS focused on by this study is a storage device (battery) that stores the surplus electricity generated by solar rays to supply it when power is required, thereby increasing the efficiency of power use. The ESSs prevent power shortage at peak times and play a key role in the commercialization of new and renewable energies such as solar and wind-powered energies. Especially, since the power output rates of solar and wind-powered energies fluctuate heavily depending on the natural conditions, continuous supply cannot be expected. Another problem is the time gap between the point of energy production and point of demand, so stability in energy supply cannot be guaranteed; thus making it harder to popularize [13,14,15]. Moreover, there are some negative elements in the seasonal characteristics of the Korean peninsula when using new and renewable energies. For one point, the four seasons in the Korean peninsula are distinct, so changes in each season are clear. For instance, some serious yellow dust can be observed in spring, whereas a long rainy season is a typical phenomenon in summer, followed by crystalline skies in autumn and biting cold in winter [14,15,16,17]. Among these, a long rainy season can be a serious problem for the solar-powered ESS. A typical example of such negative impact due to the characteristics of Korean seasons can be found in Korean aquafarms.
For the Korean aquafarms using new and renewable energies, they require using energies to create a suitable environment for the survival of the fishes. The survival conditions in these aquafarms used to depend on manpower; these days, however, most of the labor power is being replaced with automatic functions [14,18]. This is to transform social information into mechanical information to solve the problems efficiently, guiding mankind in a feasible direction. If the automation depends on new and renewable energies, however, the seasonal factors of the Korean weather would not allow consistent generation of power. In summer, the long rainy season and typhoons will be the obstacles to generating enough power, and this leads to devastating effects on the aquafarms. An alternative is the ESS through which farm owners will be able to prepare against power shortages or interruptions by storing the surplus energy in advance [19,20,21,22,23]. Currently, pumped storage power, Uninterruptible Power Supply (UPS), and other various types of power storage technologies are being developed, validated, or commercialized. Nevertheless, the need to develop a high-capacity, low-cost ESS is growing rapidly in response to the unexpected large-scale power blackouts or peak hours of power consumption during summer or winter. Especially, lithium-ion batteries contributed to the successful commercialization of medium- to large-size electric vehicles and household/industrial-use power storages, and their global market is growing rapidly.
As a strong networking and simulation tool developed by MIT in 1984, OPNET simulation supports C and C++ language as well as equipment. OPNET is useful in understanding changes in the network environment in line with the changes in a certain network variable value. We will have several difficulties if we demonstrate the changes in the manipulating variables and resulting values using the program for example, by implementing actual hardware instead of using OPNET. First, it is quite difficult to control variables other than manipulating variables, because it is very hard to run a test in an actual environment under the same condition. When we look at it intuitively, ambient temperature and humidity change quite continually. It is very difficult to demonstrate correlation between the manipulating variables and results in simulation, after excluding all other environments. OPNET makes it possible, however. Second, OPNET enables us to disregard an unimportant issue. Compared with the implementation of an actual hardware environment, the detailed settings of each vendor’s equipment should be taken into account, products should be purchased and checked for every possible malfunction, and efforts should be exerted to control conditions other than the relationship between variables and results.
In general, the improvement in energy use can be viewed from two aspects. The first is the hardware-oriented improvement and the second is the software-oriented improvement. For the former, use of the Li-ion batteries improved in many ways for the existing ESS has been proposed and for the latter, a method of maximizing efficiency by removing the elements which cause undesirable waste of energy to save it and prevent or reduce inefficiency in energy use by completing the nodes’ tasks by priority.
This is not a critical issue in this paper, which aims to discuss how to improve energy efficiency based on ESS; detailed equipment setting and specific equipment purchase are matters of little import and is subject to change as the occasion demands depending on the needs of end-users.
The distributed control of an energy system has been quite a popular subject. Also, using the approach such as a greedy algorithm or dynamic programming is not new. However, the approach which modifies them to be adequate for the specific environment (aquafarm) based on the outputs and attempts to improve the communication efficiency and success rate in a positive direction by controlling the communication output has been effective. Also, their attempt to not only simply improve software but also focusing on the hardware to minimize system inefficiency based on ESS’s efficiency and advantages is still a worthwhile cause.
3. Research Motivation
Lithium-ion batteries are dominant in the current power storage market [4]. However, that some of their energy density has reached the cellular level due to the continuous increase, and it is expected to reach the limit in the near future [24,25,26]. Moreover, they are required to maintain more than 30% of charge for them to be used adequately, and they could cause short circuit or fire during transportation. Although this may not be a fatal problem for ESS, it is a major negative element. The condition of reserving more than 30% of full charge can also be unfavorable for the efficient use of energy [4,5]. The aquafarms mentioned above can consider using ESSs to overcome the seasonal demerits when using new and renewable energies, but such limitation can wield a negative impact on energy use and composition during the long rainy season and typhoons in summer; hence the difficulty in optimizing the utilization of ESSs and applying them where stored energy is required. There are two approaches that will be able to address such problem [3,4,5]. First is improving the main raw material with another available chemical. Sodium-ion can be one of the alternatives as a charge carrier. Sodium is much less expensive than lithium since it is abundantly found throughout the world; even if the charged energy of a sodium-ion battery is completely depleted, there will be no considerable damage to its chemical compositions. It is also safe during transportation. This research was conducted using sodium-ion batteries; since it is quite difficult to overcome the technological limits of these batteries by simply modifying the physical structure only, an attempt was made to explore the possibility of improvement through the improvement of efficiency. However, that the development speed of battery technology is considerably slower than the technologies associated with electronics or electricity, which require advanced battery technology. Such slow advancement hinders the others from developing further. Thus, as a second approach, the improvement of efficiency in energy use can be considered in relation to the first law of thermodynamics. Considering the energy stored in a battery as the total amount of energy as described in the first law, it should be constant; thus, based on the second law, this energy should be used efficiently. These two approaches are separate matters since they are not supplementary; when they are achieved together, however, a synergy effect will be created.
The Li-ion battery degrading starts immediately after its manufacturing, aging over time regardless of its use or not. Normally, their battery life is approximately two to three years.
The Li-ion batteries are temperature-sensitive. Higher the temperature, faster the degrading. Their capacity reduces by approximately 6%, 20%, and 35% per year at 0 °C, 25 °C, and 40 °C, respectively. Some serious safety issues will arise if the Li-ion batteries are not treated correctly. Keeping them at a high temperature or under the direct sunlight will cause them to explode, as lithium has a characteristic of igniting at a high temperature or when contacted with air, it basically has the possibility of exploding or causing a fire. A strong external impact or pressure causes both poles to fuse and if it is heated, the internal temperature and pressure will increase rapidly. In these situations, the outer metal packing containing the lithium inflates and explode without enduring the pressure, allowing lithium to expose to air and then cause a fire. It is especially essential to keep the electrolyte from flowing out under any circumstance.
The Li-ion batteries should be handled carefully when charging or discharging them as they require a high voltage of about 4.2 V for charging and when they are over-charged, the remaining energy will be released following the laws of thermodynamics, a potential for battery explosion. Also, when they are over-discharged and the voltage remains below 2.8 V, the copper on the surface of cathode current collector will start to corroding and largely lower the battery performance and damage the battery itself. The Li-ion batteries use carbon as a (+) pole and LiCoO2 (Lithium cobalt) as a (−) pole. The reaction in time of charging or discharging is as in the following:
Li1-xCoO2 + LixC6 <===> C6 + LiCoO2
The key point to remember here is that lithium itself is not oxidized but it just moves back an forth between both poles. meanwhile, cobalt comes in when oxidation-reduction is taking place. Co3+ (Co4+) will be transformed to Co4+ (Co3+) when discharging (charging) the battery. Thus, on the premise that the sodium-ion battery will be used (first approach), the second approach that focuses on the efficient use of energy is studied.
4. OPNET Simulation on the Improvement of Energy Efficiency
Zigbee is a communication technology based on the IEEE 802.15 standard, which is small and light; it boasts of long battery life and high energy efficiency thanks to low power consumption and low cost. Using the mesh network, Zigbee provides the advantage of one node being able to establish communication with the remaining nodes freely. Considering the fact that these characteristics are suitable for improving communication efficiency, ESS had adopted Zigbee as a communication technology to improve energy efficiency.
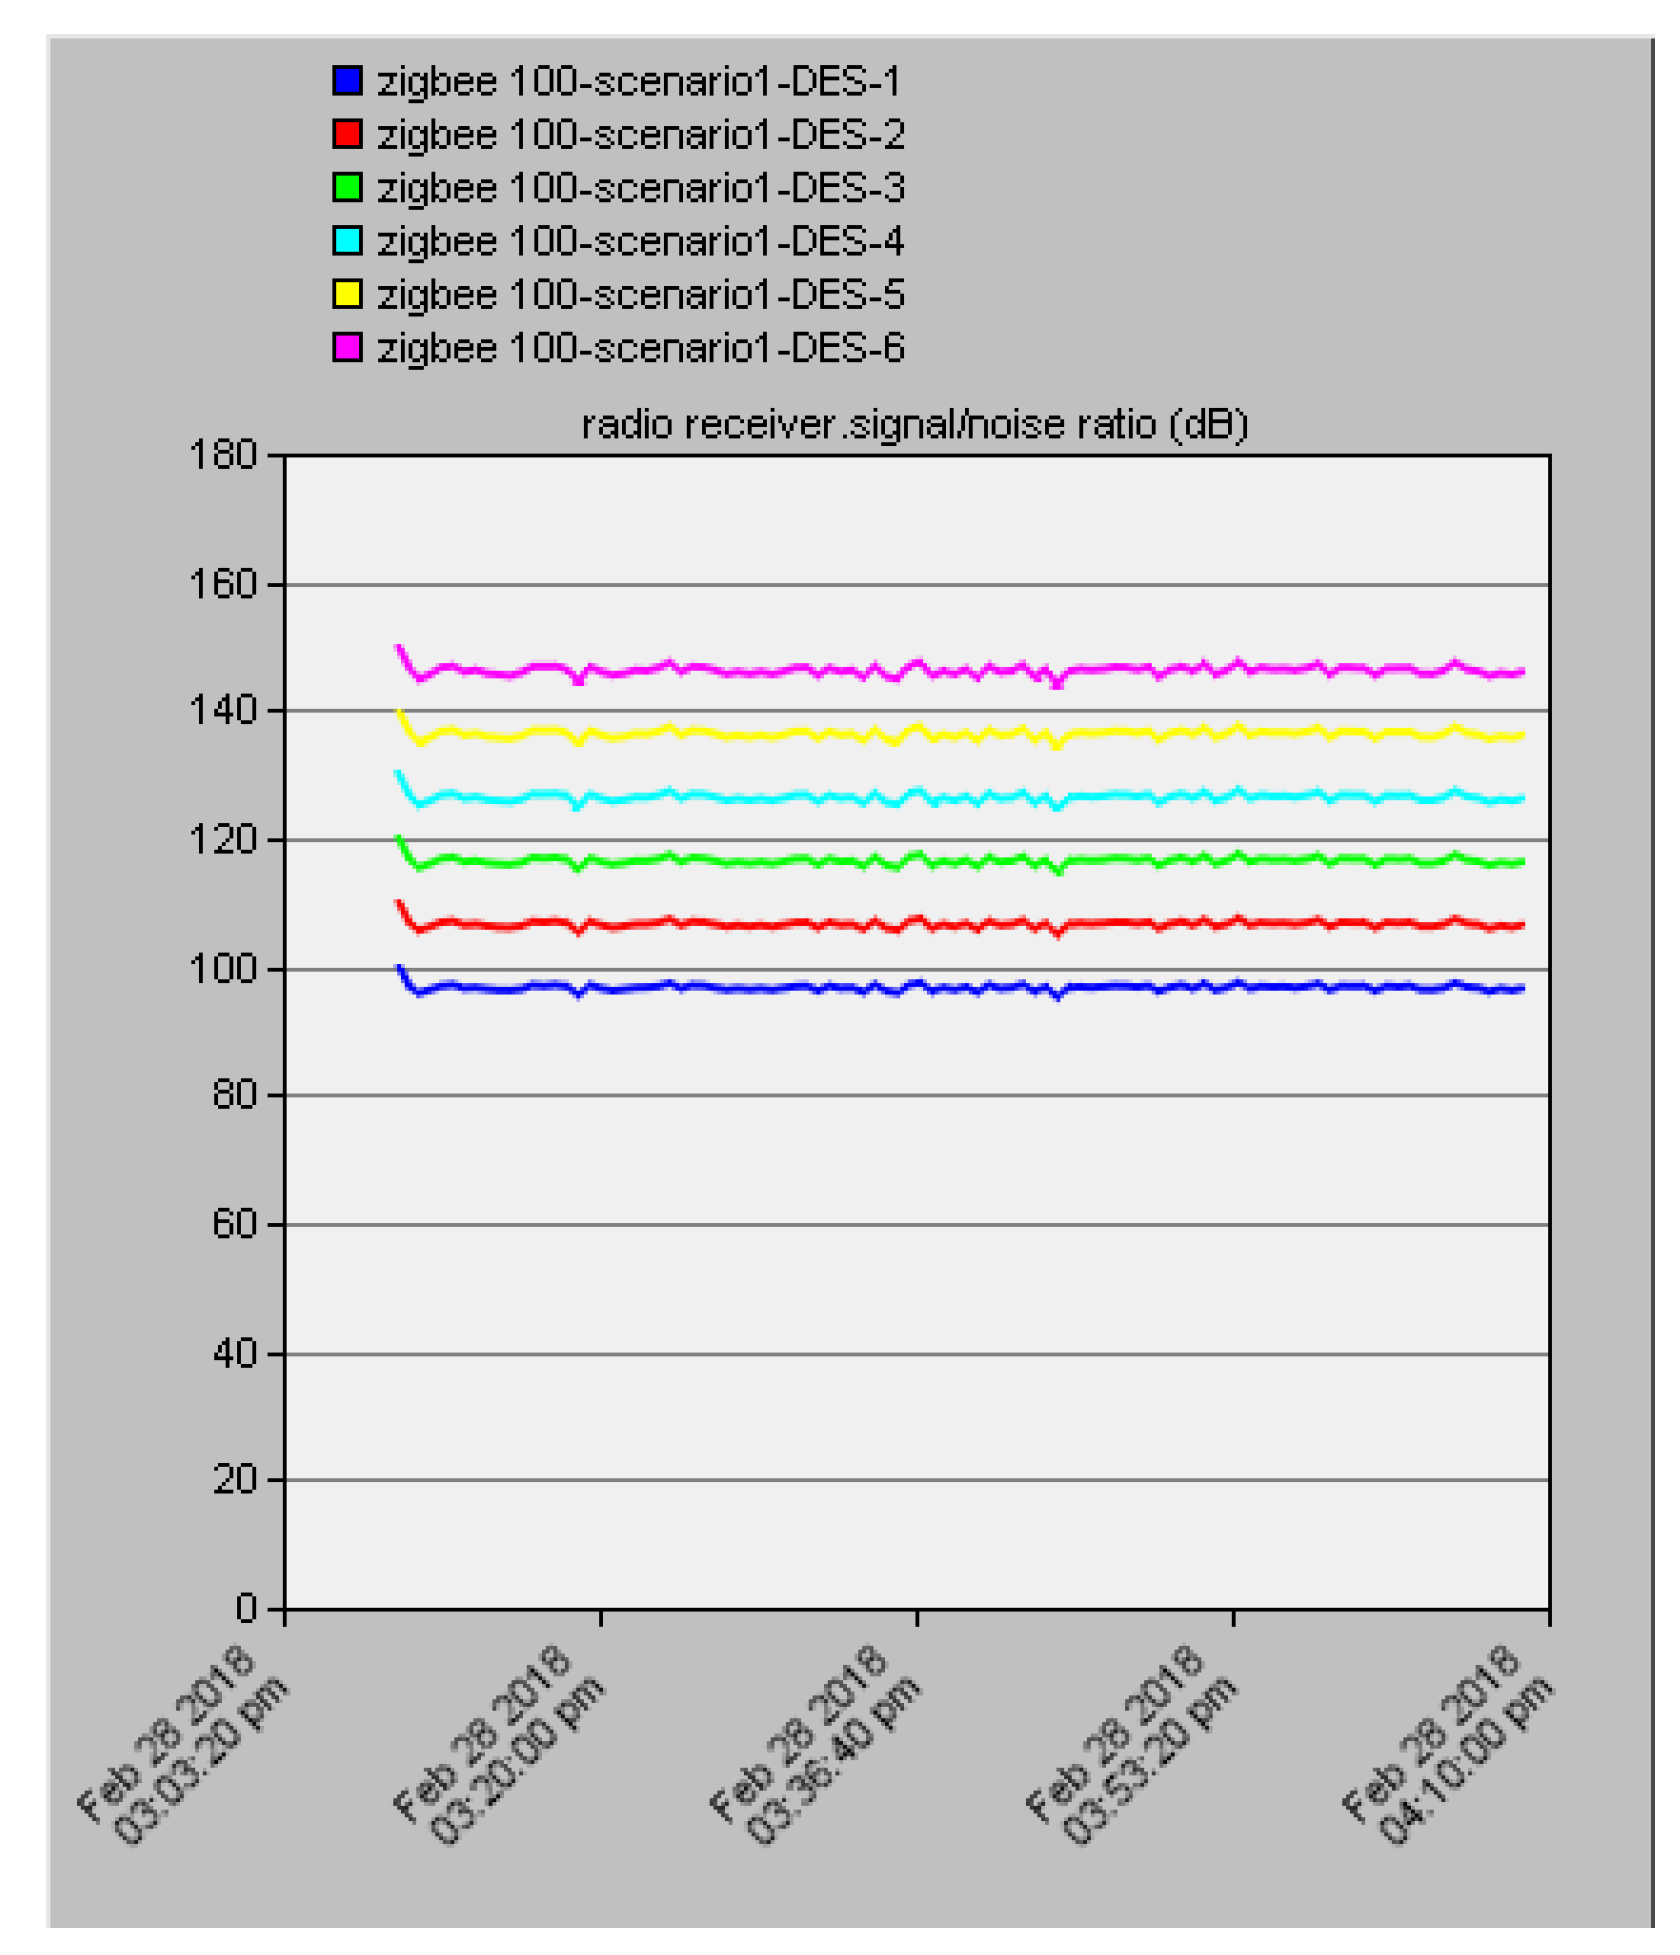
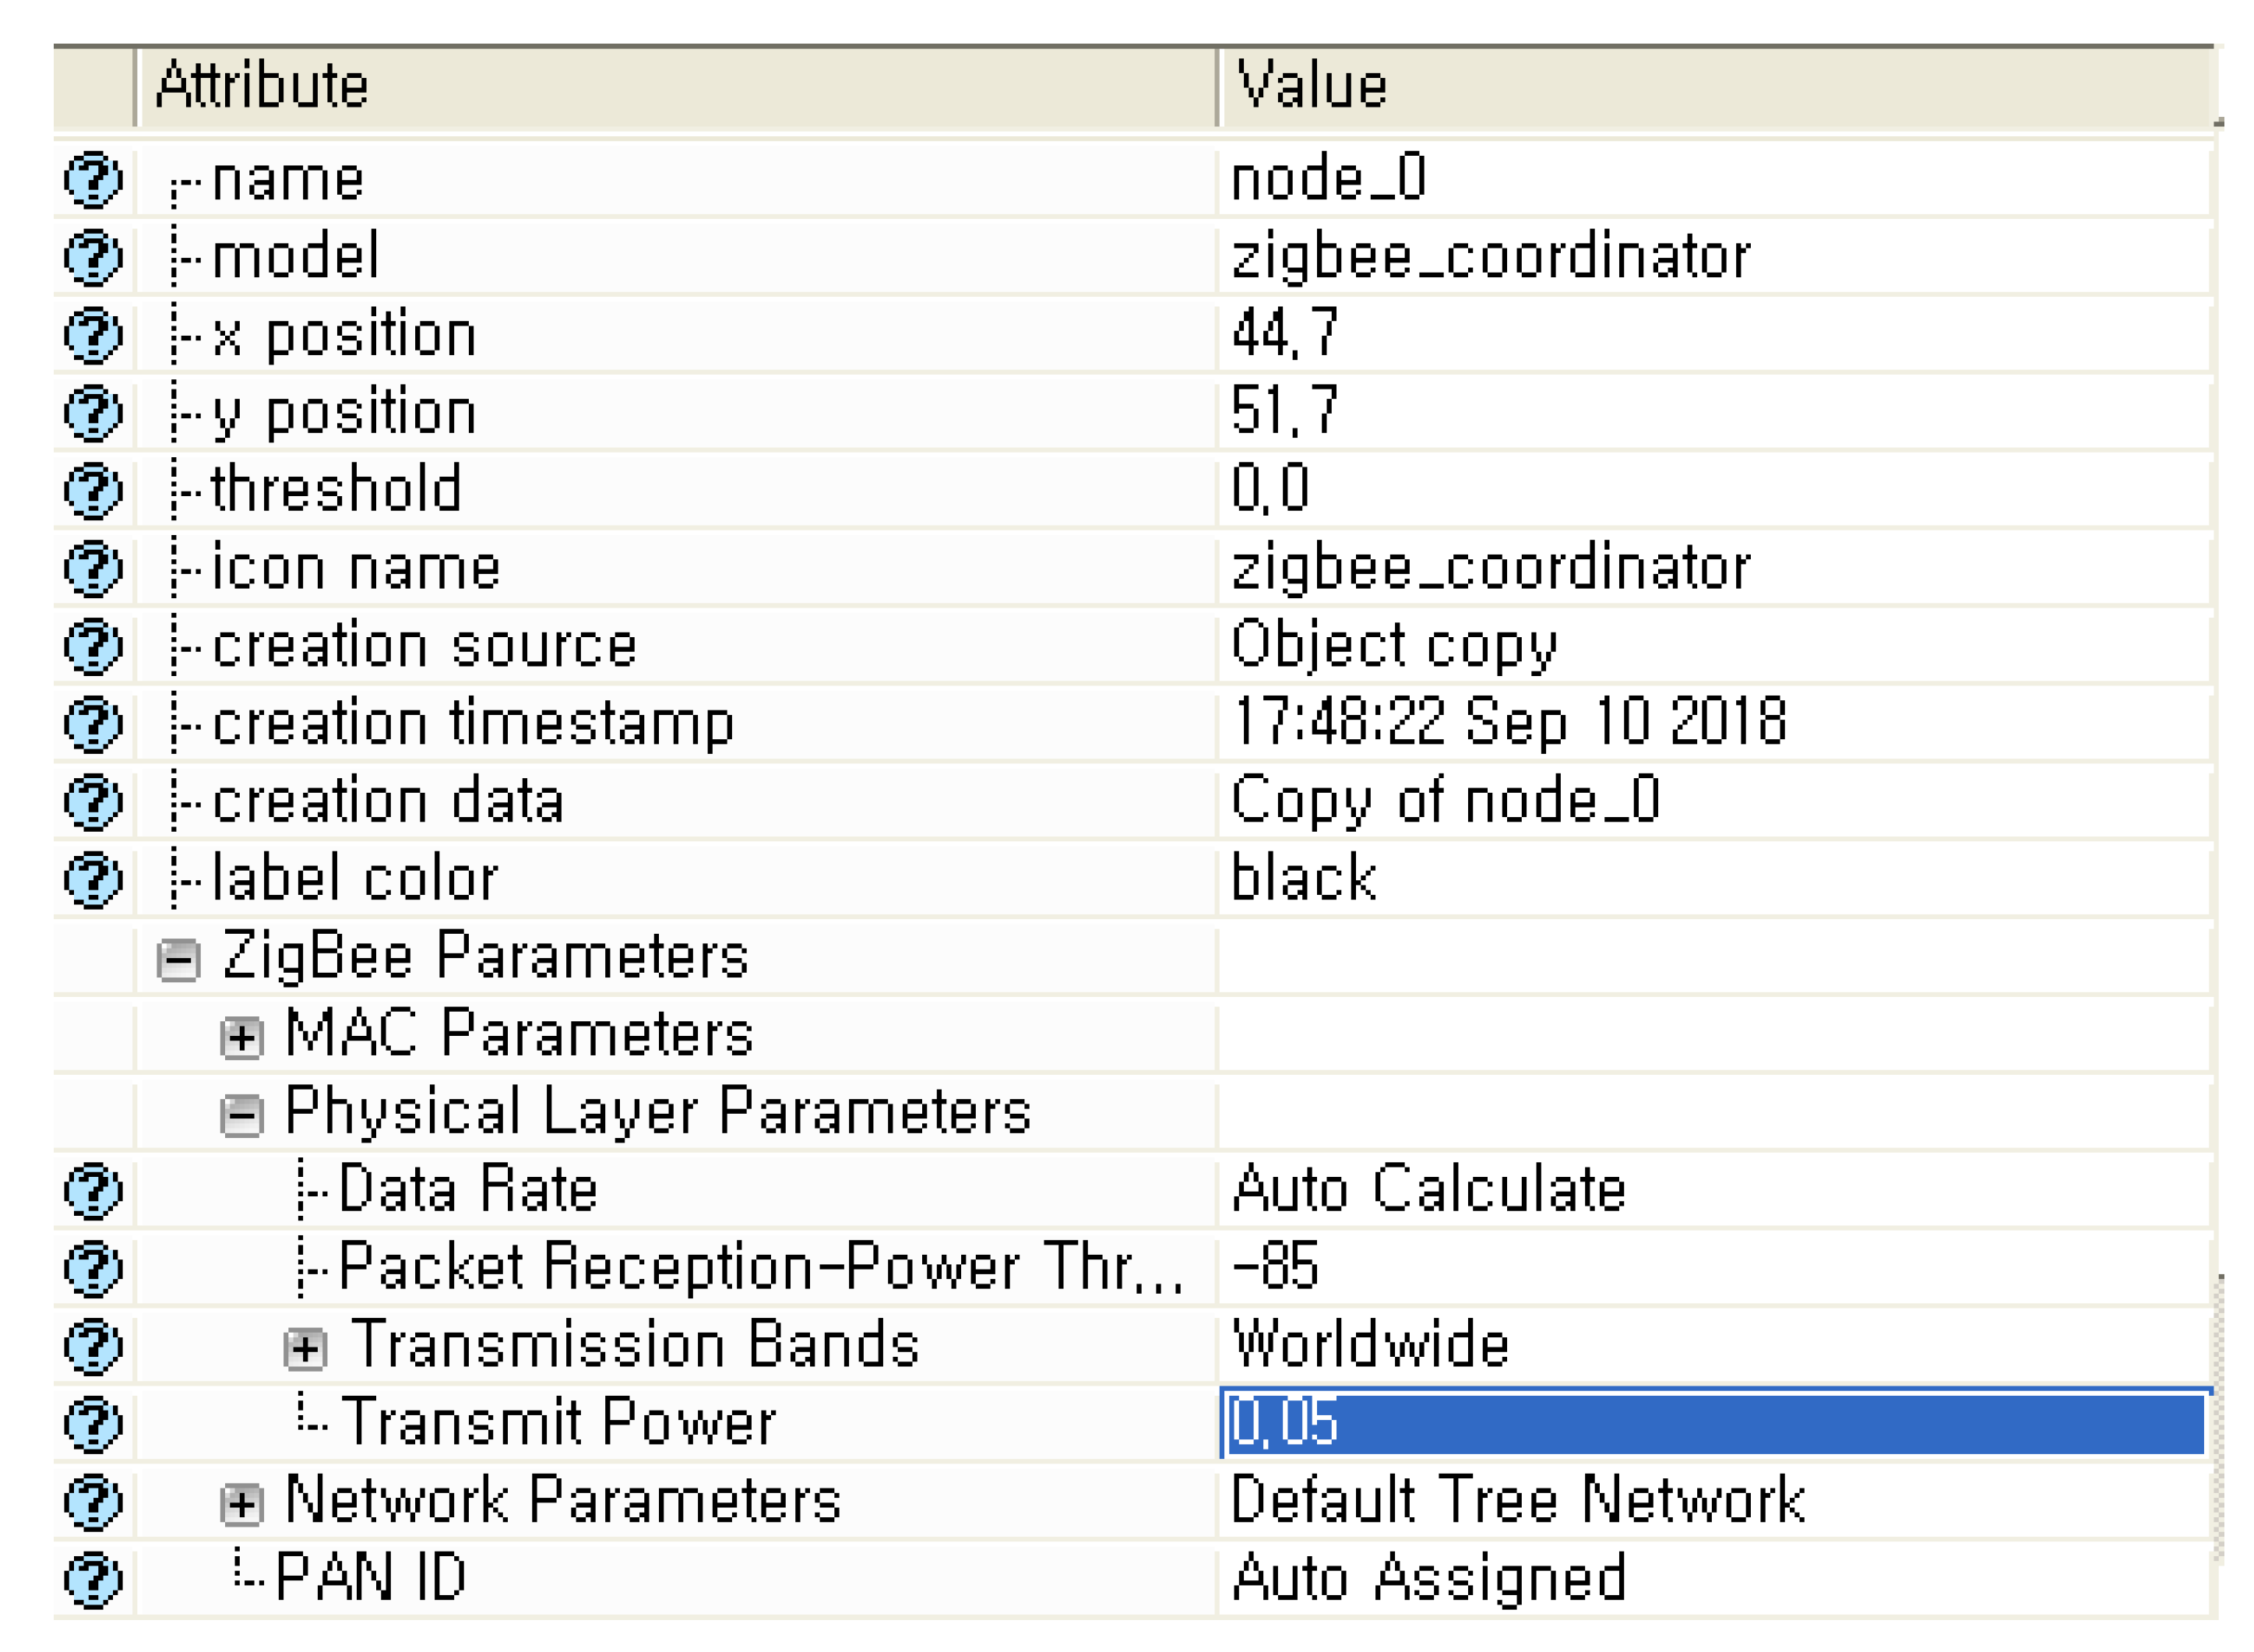
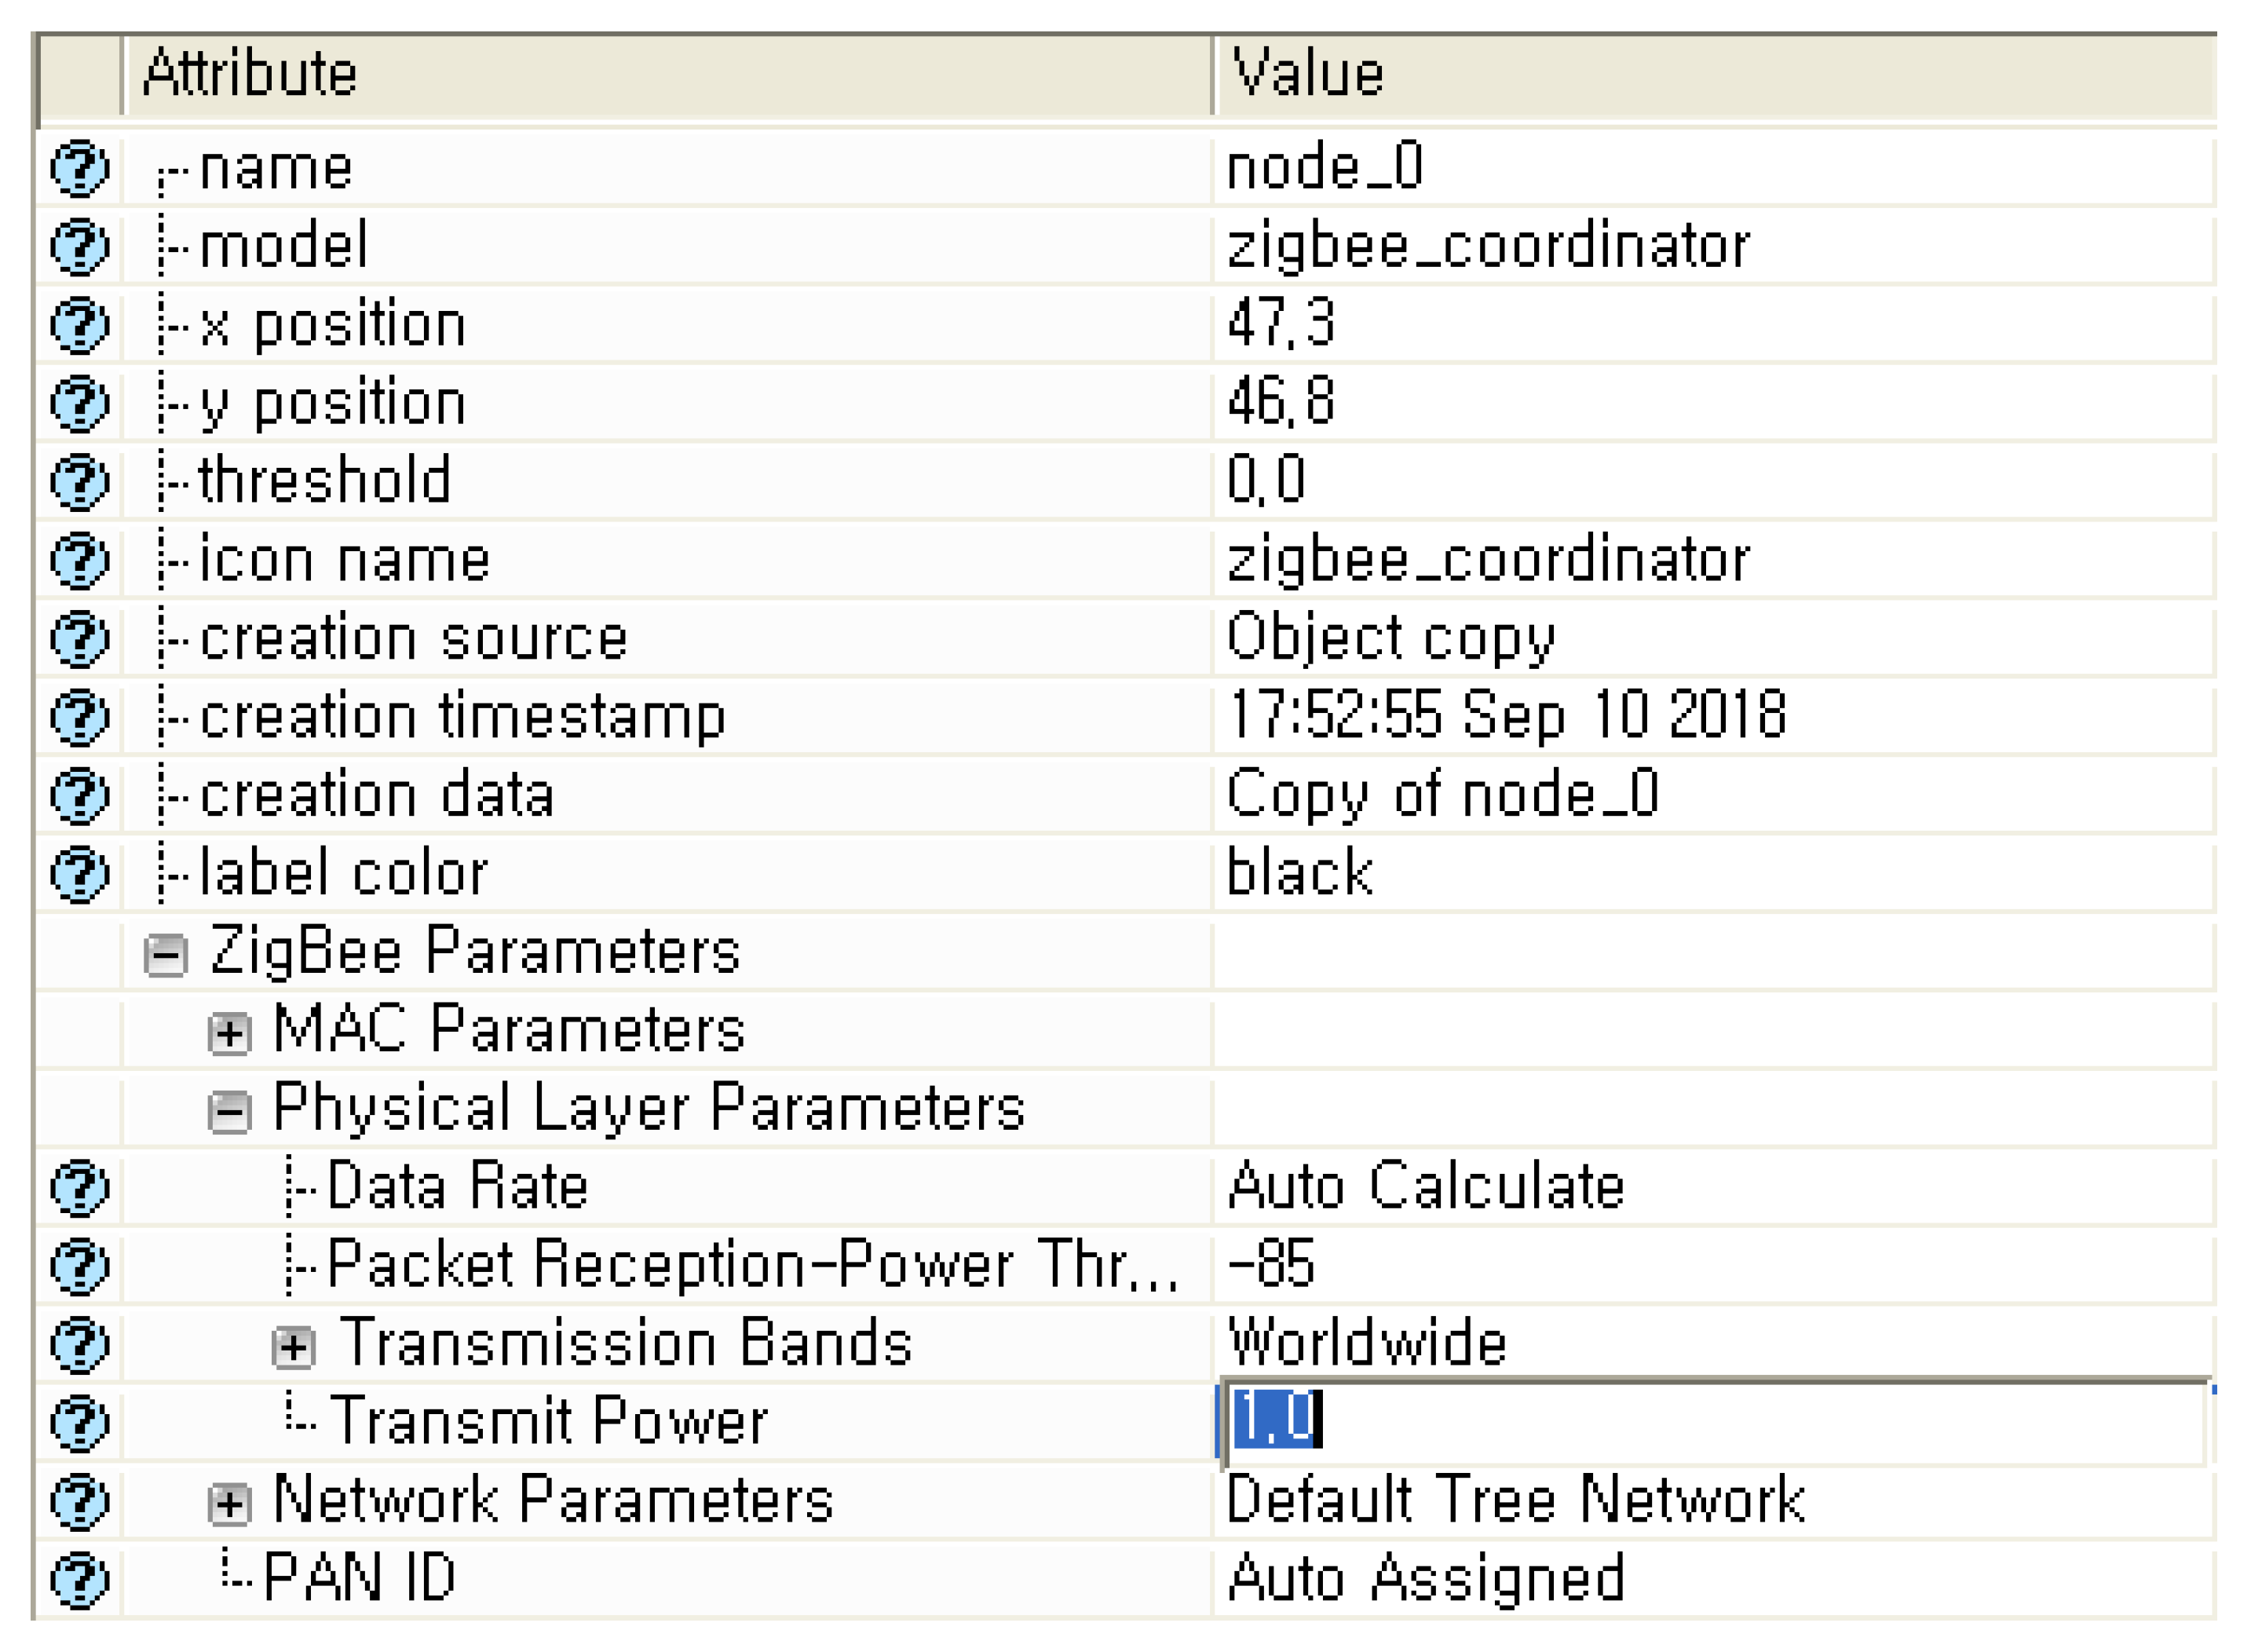
The environment for the OPNET simulations is as follows: Zigbee Coordinator transmits traffic to all the nodes while nodes 1, 2, & 3 send data to the Coordinator; the transmitted power has been allocated as shown below, and the range of values is from 0.1 to 10,000, having bound of 0.2 each. Considering the values as variables, a comparison was made between Signal–Noise Ratio and Received Power. Figure 1 shows the fluctuations in signal–noise ratio according to the changes in transmitted power.
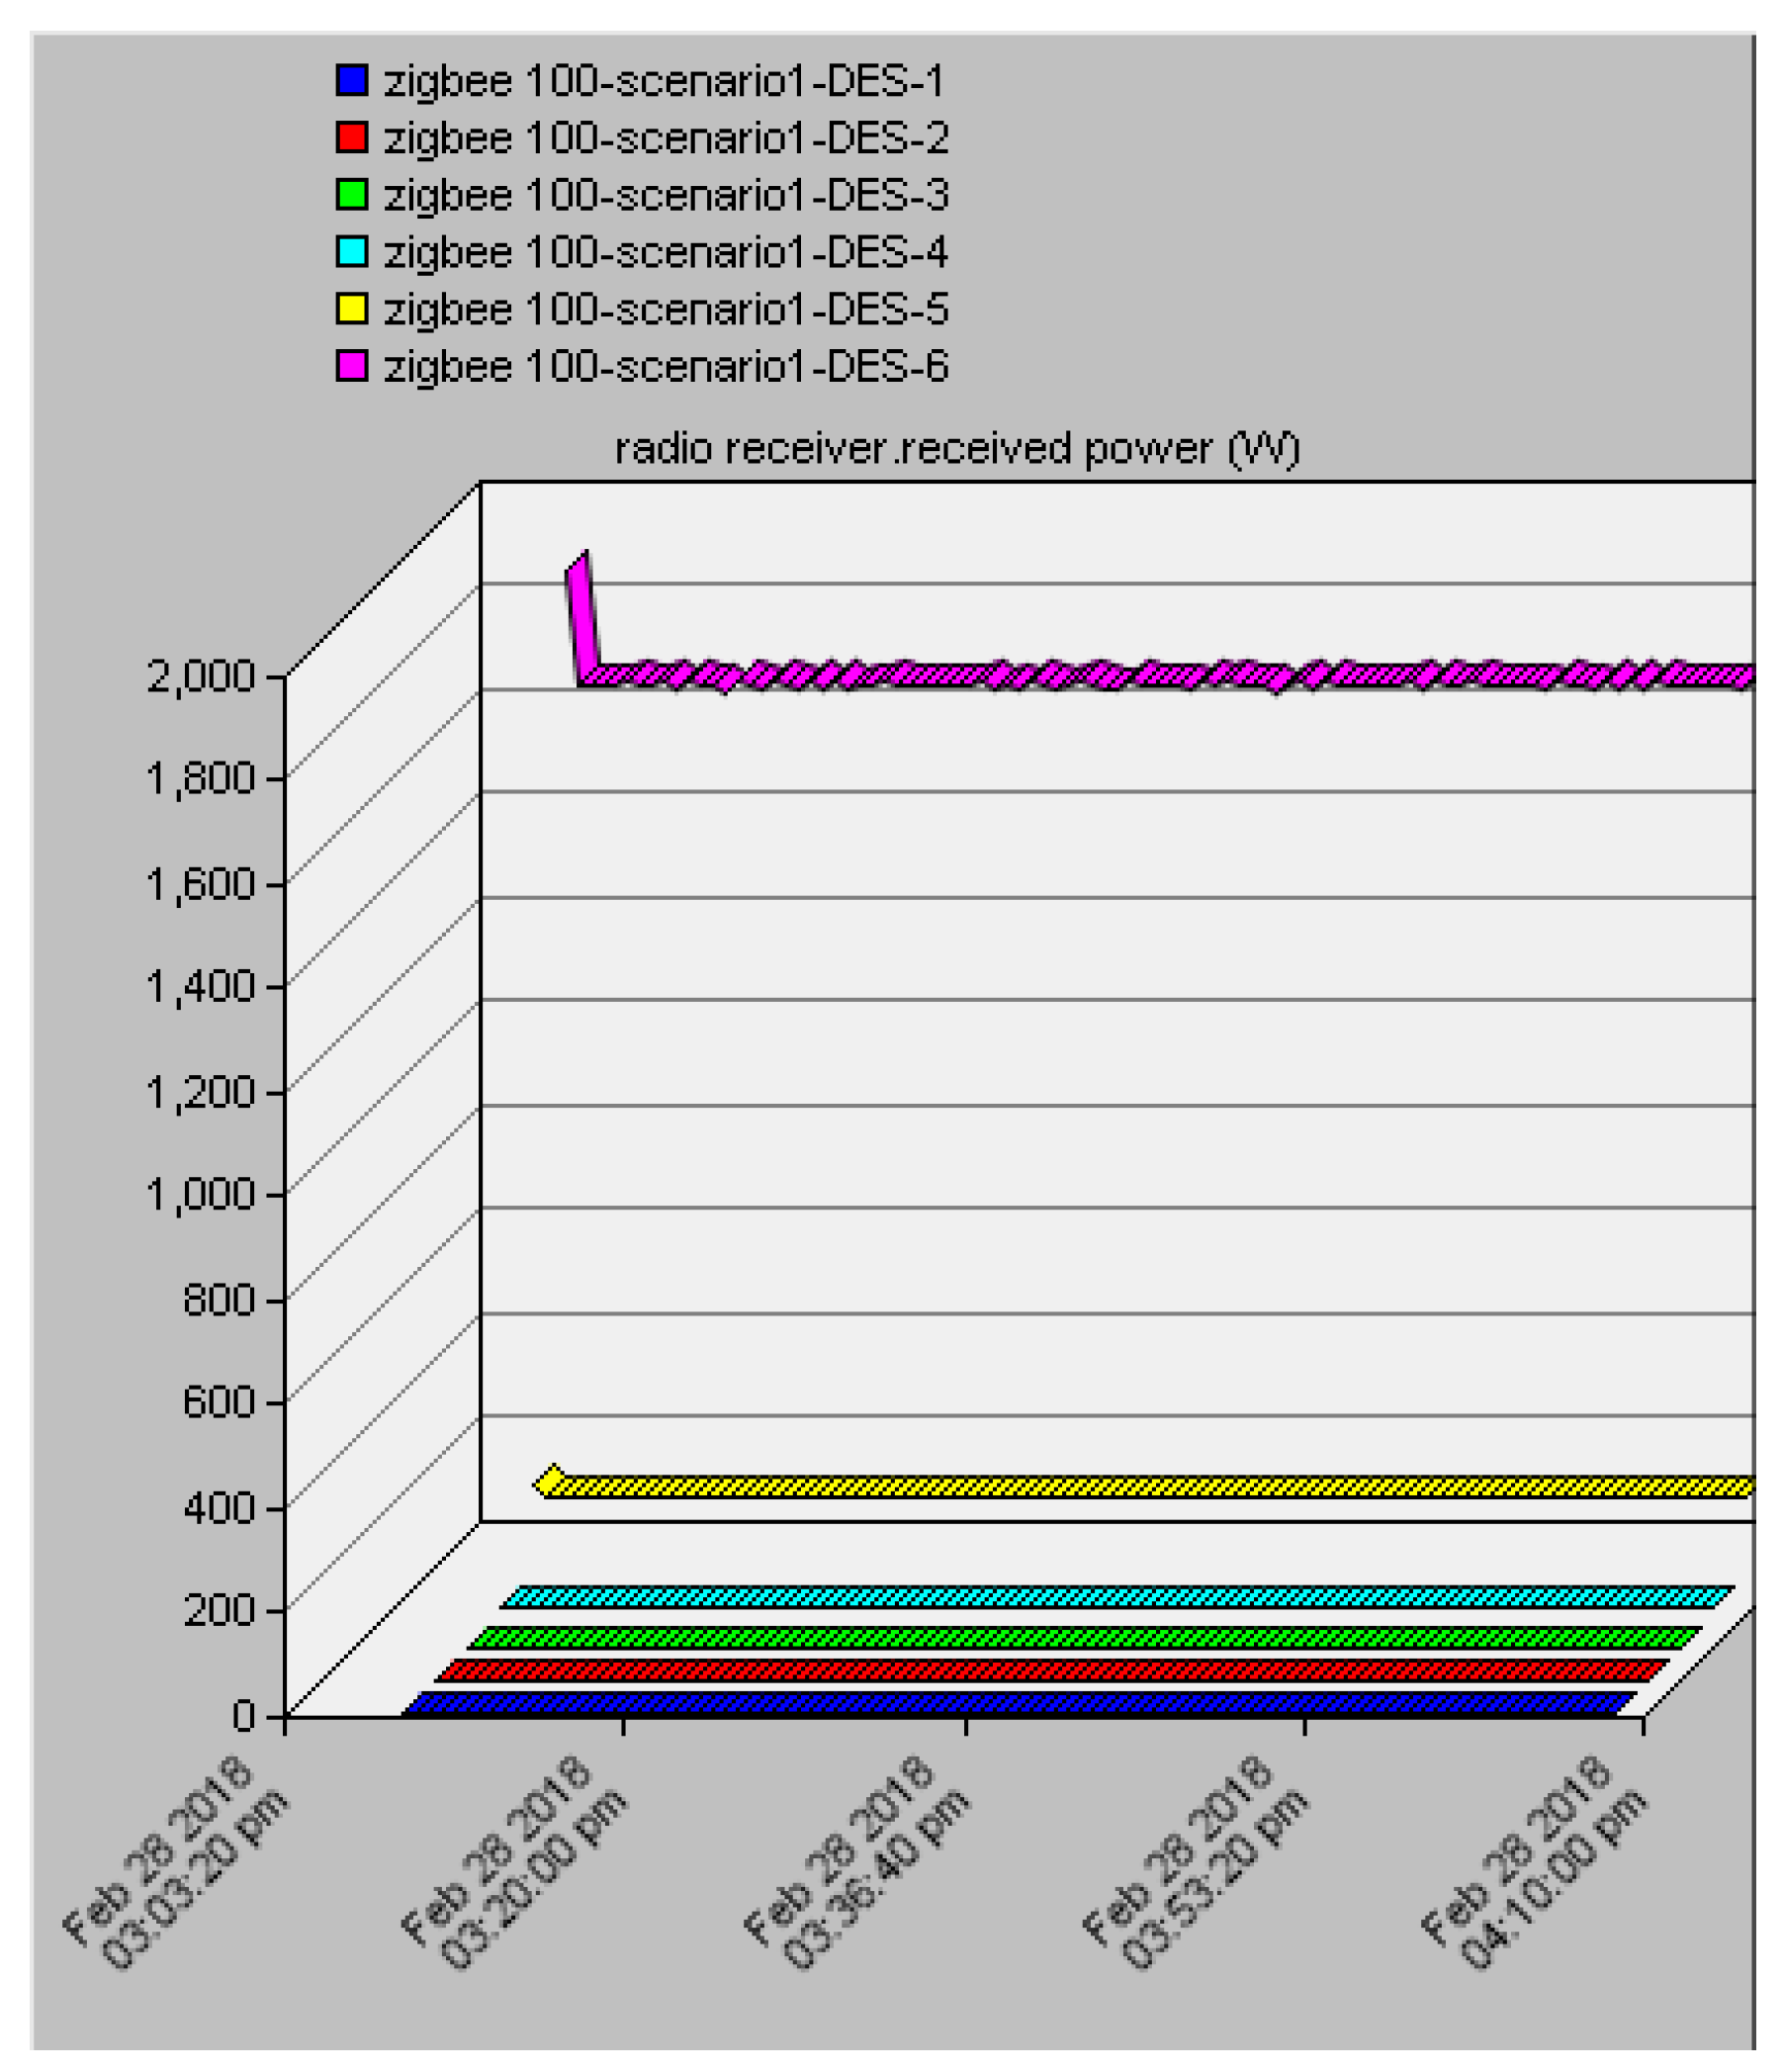
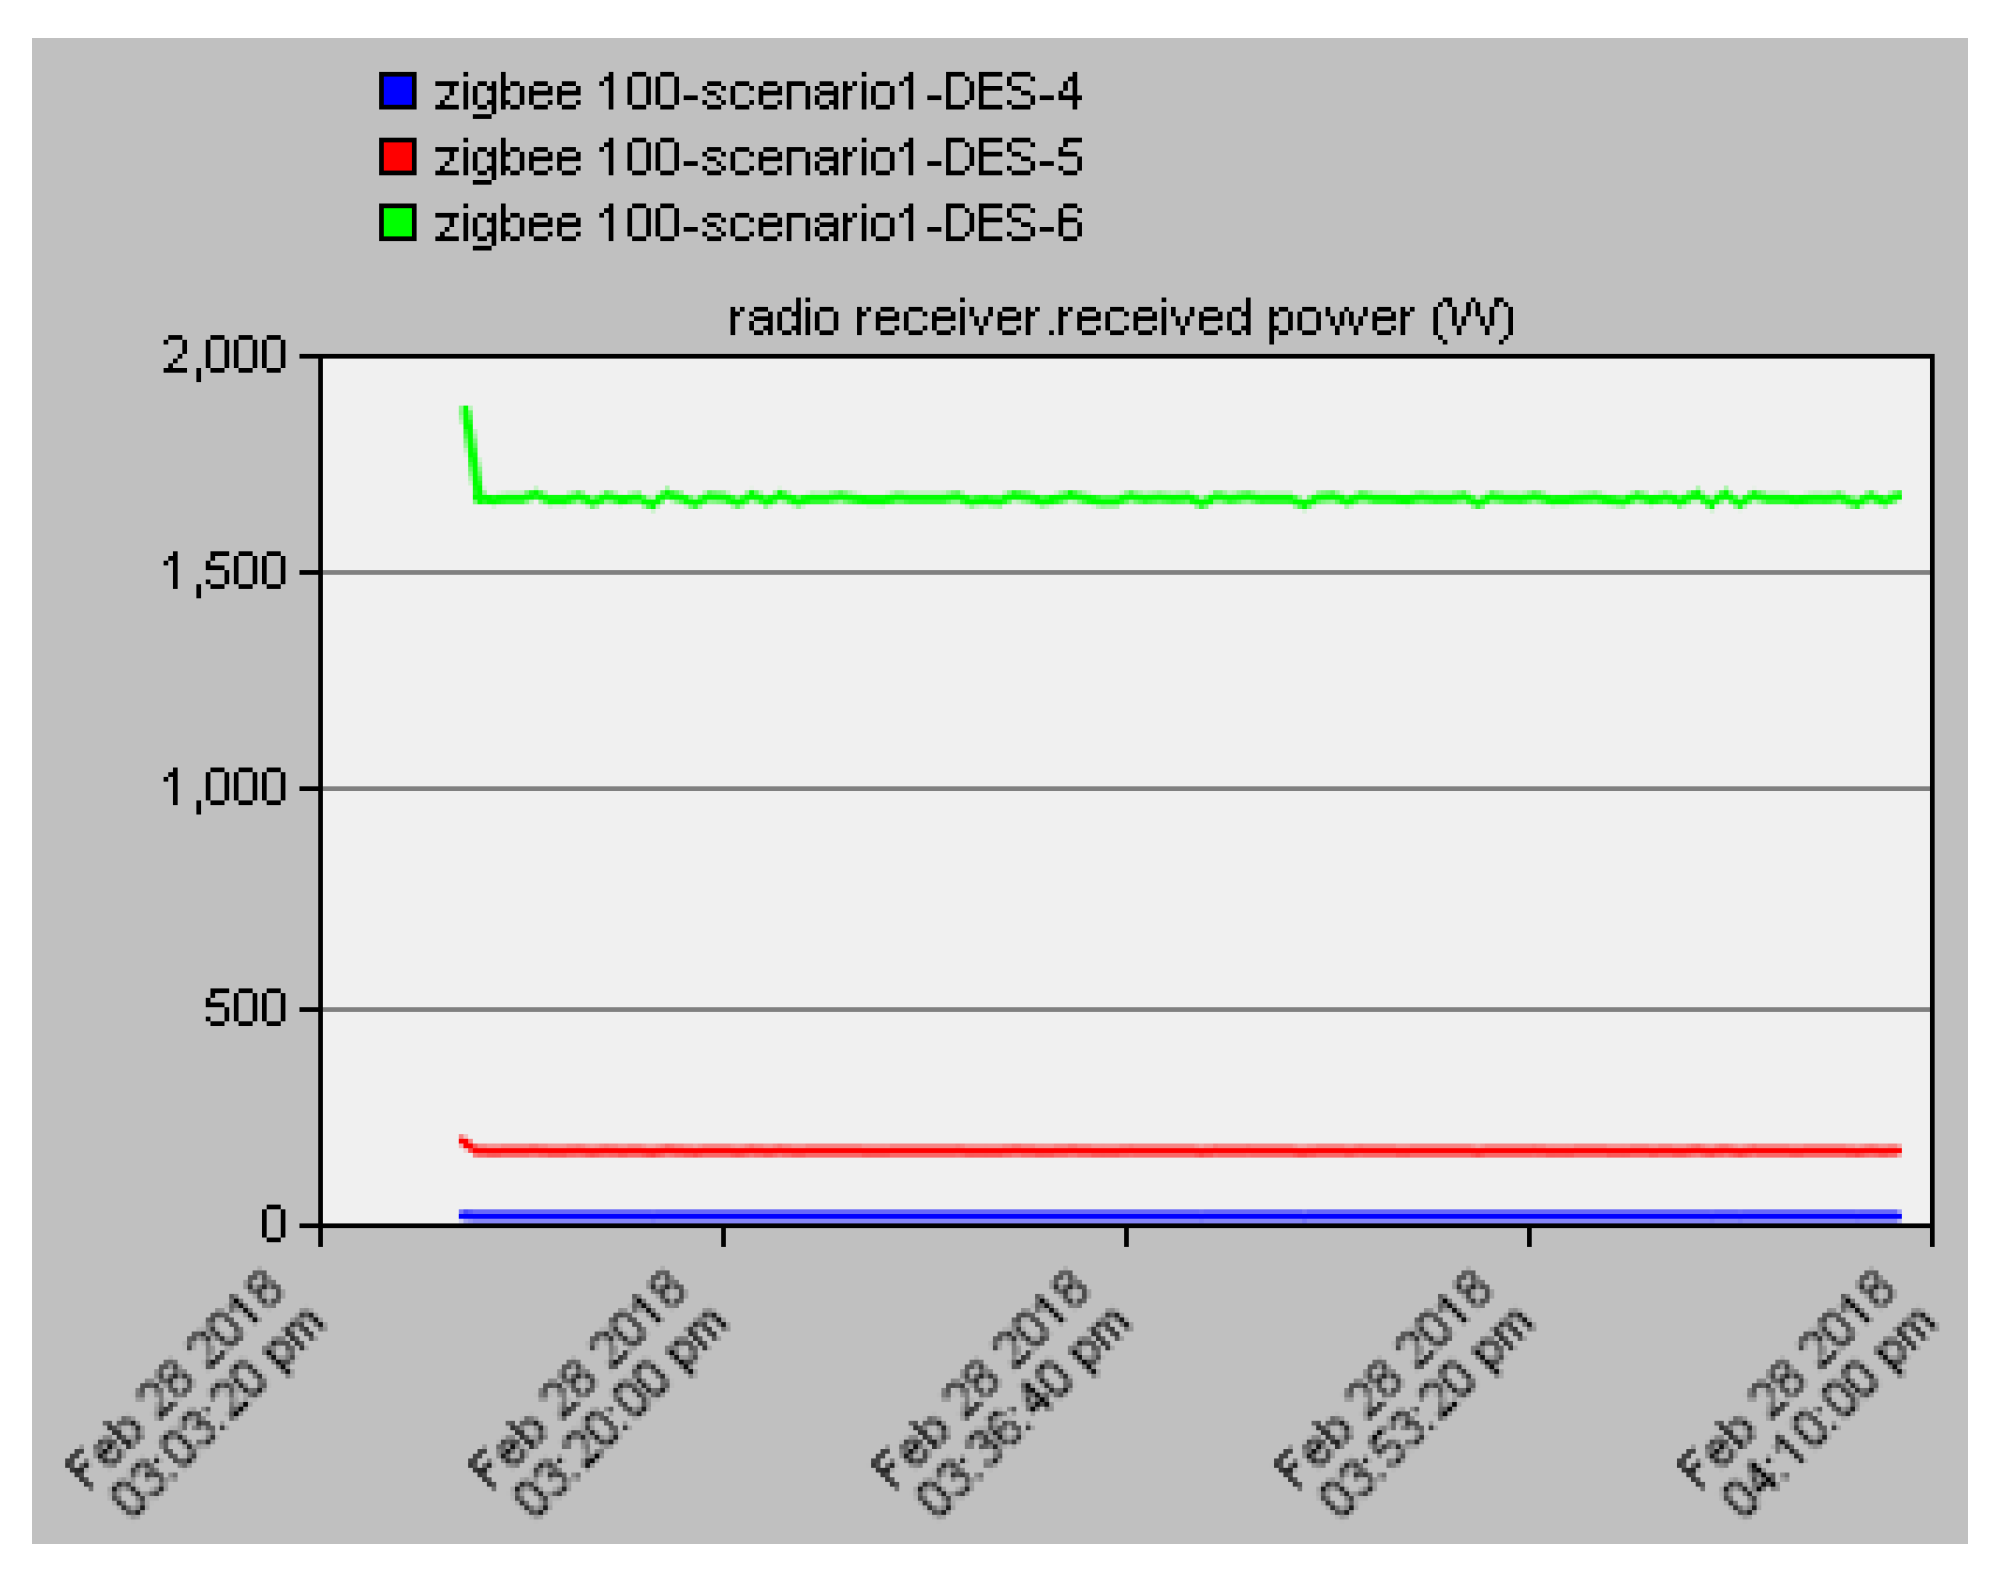
The Signal–Noise Ratio is a ratio between the signal strength and the undesirable background noise signal and can be expressed as SNR = P(Signal)/P(Noise), where P denotes the average power. Here, both signal and noise should be measured at the same location and band. If the SNR value exceeds 1, the signal strength is considered stronger than the noise strength. In the graph above, the value of SNR increases following the increase in power. Accordingly, the increase in power means an increase in battery use, so this defeats the purpose of a Zigbee system featuring low-power performance. As shown in Figure 2, the transmitted power has been changed from 0.1, 1, 10, 100, and 1000 to 10,000 to show the correlation with the received power; since the differences in these scales are relatively large, however, it is not easy to determine the correlation with the graph. Thus, the graphs were drawn again by separating the value groups one graph for a group of values 0.1, 1, & 10 and another for 100, 1000, & 10,000.
The result of a comparative analysis between Figure 3 and Figure 4 confirmed that the received power had significantly increased following the increase in transmitted power. Moreover, while the transmitted power increased geometrically according to the received power, the signal–noise ratio increased arithmetically. Therefore, based on the game theory, it is possible to determine from the simulations that improvement can be achieved by increasing efficiency in communications through control of signal output to reduce battery run-down.
According to the result of the previous OPNET simulation, communication becomes smoother if radio wave output is increased. Smooth telecommunication means smooth communication between two persons in terms of concept. If two persons cannot communicate smoothly, we can say that energy is wasted due to message distortion. For example, a person asking for directions is advised to turn right but goes left or straight due to a misunderstanding. If the person did not hear well, he/she needs to ask the speaker to repeat what the speaker has said. Then, the speaker should repeat the same message again upon receiving the request. Message transfer consumes energy. In the previous example of a dialog between two persons, we can say that energy was wasted, which could have been avoided had communication been successfully established at once, because energy should be used for the internal mechanism again (e.g., muscle movement) to generate sound waves. For communication between two nodes, energy is required to generate communication signals. Therefore, if communication signals are not transmitted properly, energy is wasted since communication signals need to be sent again. As such, the second method (approach as an improvement scheme of energy use) can check the possibility of efficiency improvement using OPNET simulation, and it is needed to make communication smoother by increasing radio wave output depending on the previous simulation result of OPNET. Its importance grows more when applied to ESS control, which saves energy and redistributes it among the necessary areas. When it comes to the aquafarm described by the pertinent paper, the survival of living organisms inside the aquafarm depends on the smooth flow of energy; failure in communication needed to control ESS threatens their survival. Worse, many living organisms can be sacrificed unnecessarily, contrary to the emotions of love possessed by humans. Since tremendous threats to life translate into huge threats to property, both materialistic view and idealistic view show the need to avoid such situation. However, that increasing the radio wave output gives rise to two problems. First, noise also increases when the number of nodes increases due to the communication output increase of each node. Second, high radio wave output requires a large quantity of energy. For these reasons, it is inefficient to adopt an approach that makes communication smooth by increasing radio wave output indiscriminately.
This problem can be solved using two types of approaches manual and automatic. The manual type literally means that a proper value can be found through the control of individuals. However, that it requires significant effort and time as well as individual efforts and certain level of training. The second approach is to change it to information that can be understood by the machine and obtain the result using the algorithm. This paper discusses the second approach.
The second approach can be easily understood when explained after abstracting in the form of a function. Let us talk about function y = F(x). y means the resulting value desired by people. F(x) can be understood as an algorithm to process x, which is input information. In summary, the problem in question needs to be defined from three aspects (Y, F(x), and X) to approach using the second method, which will be described below.
However, that this paper calculates the Y value by assigning the X input value (the third among three aspects) randomly [4] because the X input value can vary depending on the environment where ESS will be operated and value prioritized by the user (for example, the aquafarm owner may want to keep his fish alive even though some amount of damage is sustained or to maximize economic gains).
OPNET 14.5 PL8, the Zigbee module used in the pertinent paper, has limits since it is the lower version. Among the four Zigbee layers, physical layer and Mac layer development is supported, but not that of the remaining two layers (network layer and application layer). It causes no serious problem in simulating Zigbee communication. However, that it can be a problem for the simulation that requires the modification of two unsupported layers. Implementation from three aspects (Y, F(x), and X), which is required by the pertinent paper, is not supported. The important thing is the conceptual definition of the approach. Applying to OPNET or hardware such as Arduino and Raspberry Pi is not that difficult. Therefore, Visual Studio was used to define the approach.
The energy flow is usually controlled by communications so that successful communications allow its smooth flow whereas poor communications disrupts the flow.
Meanwhile, an efficient use of energies means achieving the same effects with less of them. When the energy flow is smooth, it means that the energy can be used at an appropriate time or place but if it does not, the energy will be used in the situation where the energy is not being used in the right place at the right time, leading to an inefficient use of energy.
Therefore, increasing the success rate of communications leads to a smooth energy flow and the increased rate affects the energy output so that the success rate of communications can be improved by increasing the communication power output. However, an opposite effect can be produced if the presence of many nodes is considered and it is possible to confirm this from the following OPNET simulation results.
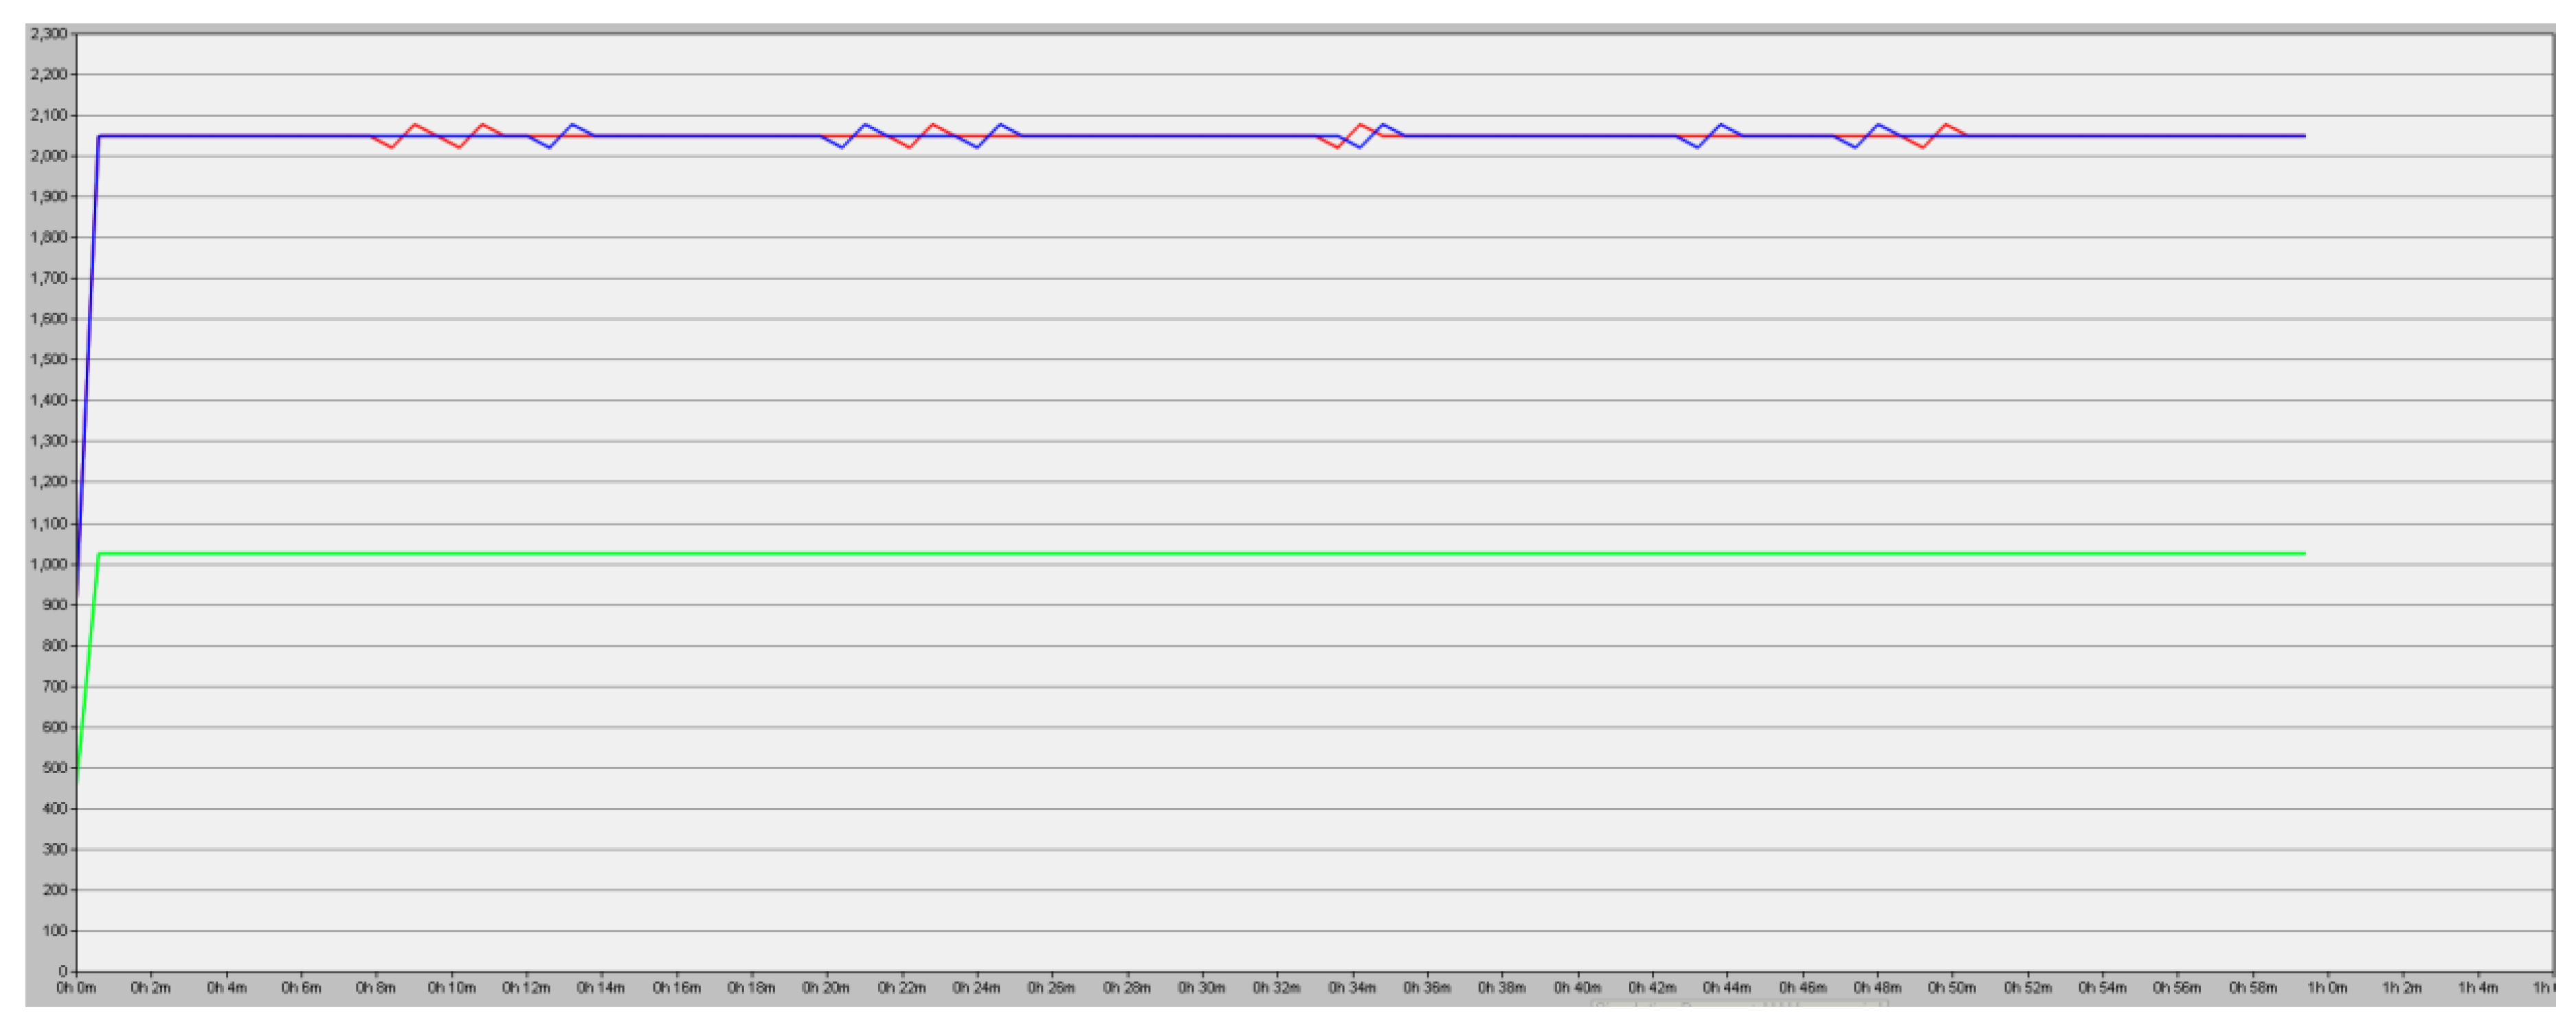
Observing the OPNET simulation results shown in Figure 5 and Figure 6, it is clear that the communications are be smoother when all the transmit powers are 1.0 instead of 0.05.
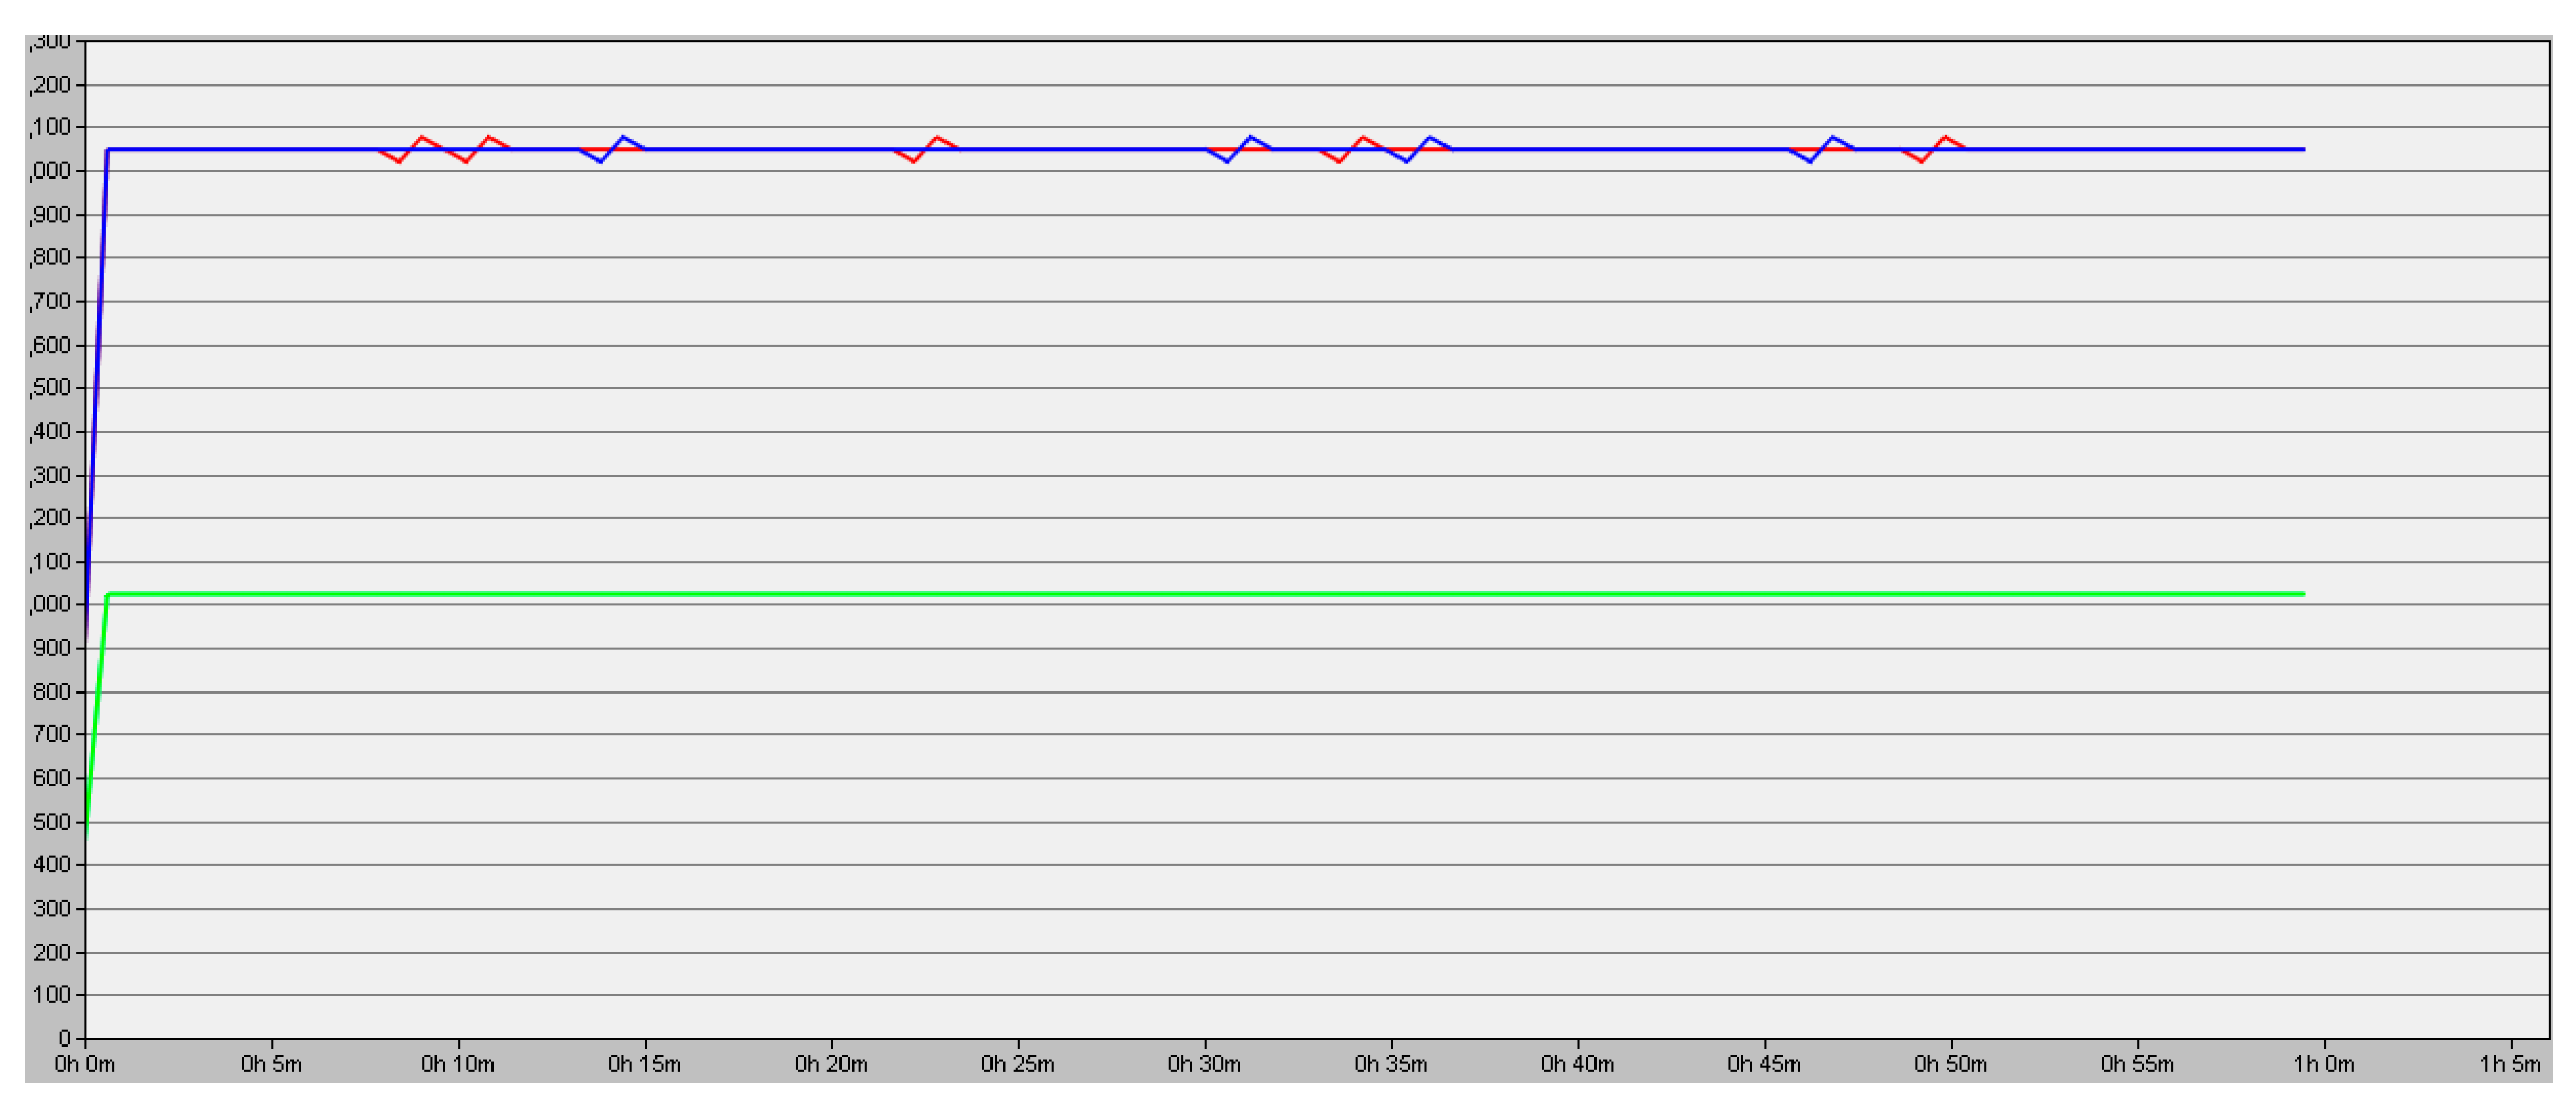
However, the number of transmission problems (curved sections) on the blue line was six when all the transmission power outputs were 0.05 whereas, on the red line, it was five when the powers were 0.1. This was the result of the nodes attempting their own communications and thereby disrupting each other. In a limited environment, the increased transmission power for the nodes can be an obstacle for successful communications but when the power has been reduced, the success rate will be also reduced as the communication distance of each node becomes shorter. Therefore, finding an optimal power output value or increasing the output only for those who are required to establish communication improves the success rate, which will lead to a smooth energy flow eventually. When the power output was adjusted for the nodes who have a higher status in communication, the following results were obtained. Figure 7 shows improvement of Energy Efficiency (1).
The number of transmission problems (curved sections) on the blue line was four when all the transmission power outputs were 0.05 whereas the number was five when the powers were 0.1.
If the necessary communications fail due to increased or decreased outputs, the energy will be wasted so that its timely supply to the place in need will become impossible as well. In the worst case, an interruption to the energy supply can lead to the disruptions in the operation of EES and/or all sorts of facilities, fatally affecting the aquatic lives in aquafarms. Figure 8. shows improvement of Energy Efficiency (2).
One of the key requirements of these two algorithms (i.e., Floyd–Warshall and greedy algorithms) is to have some well-defined inputs e.g., id, deadline, and bonus) to return a schedule having the maximum bonus. It is difficult to say which algorithm is superior but the greedy algorithm can be more efficient when the data takes a Metroid structure or has many nodes, or otherwise, the Floyd–Warshall algorithm is likely to be more efficient.
This study attempts to improve energy efficiency through both hardware and software-oriented approaches. The hardware-oriented approach in Section 3 has shown that the Na-ion batteries are more efficient than the Li-ion batteries dominant in the existing market in terms of method of storing energy. Section 4 discusses the software-oriented improvement of energy efficiency focusing on the demands from the nodes which require energy when it is stored by using a Na-ion battery.
ESS is a system where each node demands necessary energy and ESS responds to it. Assuming that Zigbee is selected for the information exchange for such a demand and response because of its several advantages described in this study, the values obtainable from ‘the relatively lower communication success rate than the wire communication’ are inversely proportional to the number of nodes and this has been confirmed by finding some significant correlations with OPNET. In Section 5, the communication output has been defined as a variable which can be controlled to improve the efficiency in a scheduling algorithm. In conclusion, Section 4 explains the part related to communications between the node and the scheduler, as one of several small networks consisting of an ESS which is also considered as a set of small multiple subnetworks. To surmount the physical limitations of Zigbee by controlling the scheduler, OPNET was used to confirm the variables (communication output) significantly related to the communication success rate and to provide the grounds for using them in the subsequent chapter.
5. Implementation of Unit-Task Problem Based on the Game Theory
The ESS’s in aquafarms are operated based on the communications between different types of equipment, through which energy is supplied to the spots in need to create a decent environment for the aquatic lives. The communications carried out through many nodes sometimes show a low success rate which often causes some problems in the operation of ESS and these problems disrupt a stable energy supply which in turn could lead to a mass mortality in the aquafarms in the worst case. Therefore, it is essential for the aquafarms to avoid such an economic disaster by organizing preventive measures involving the energy supply at their farms.
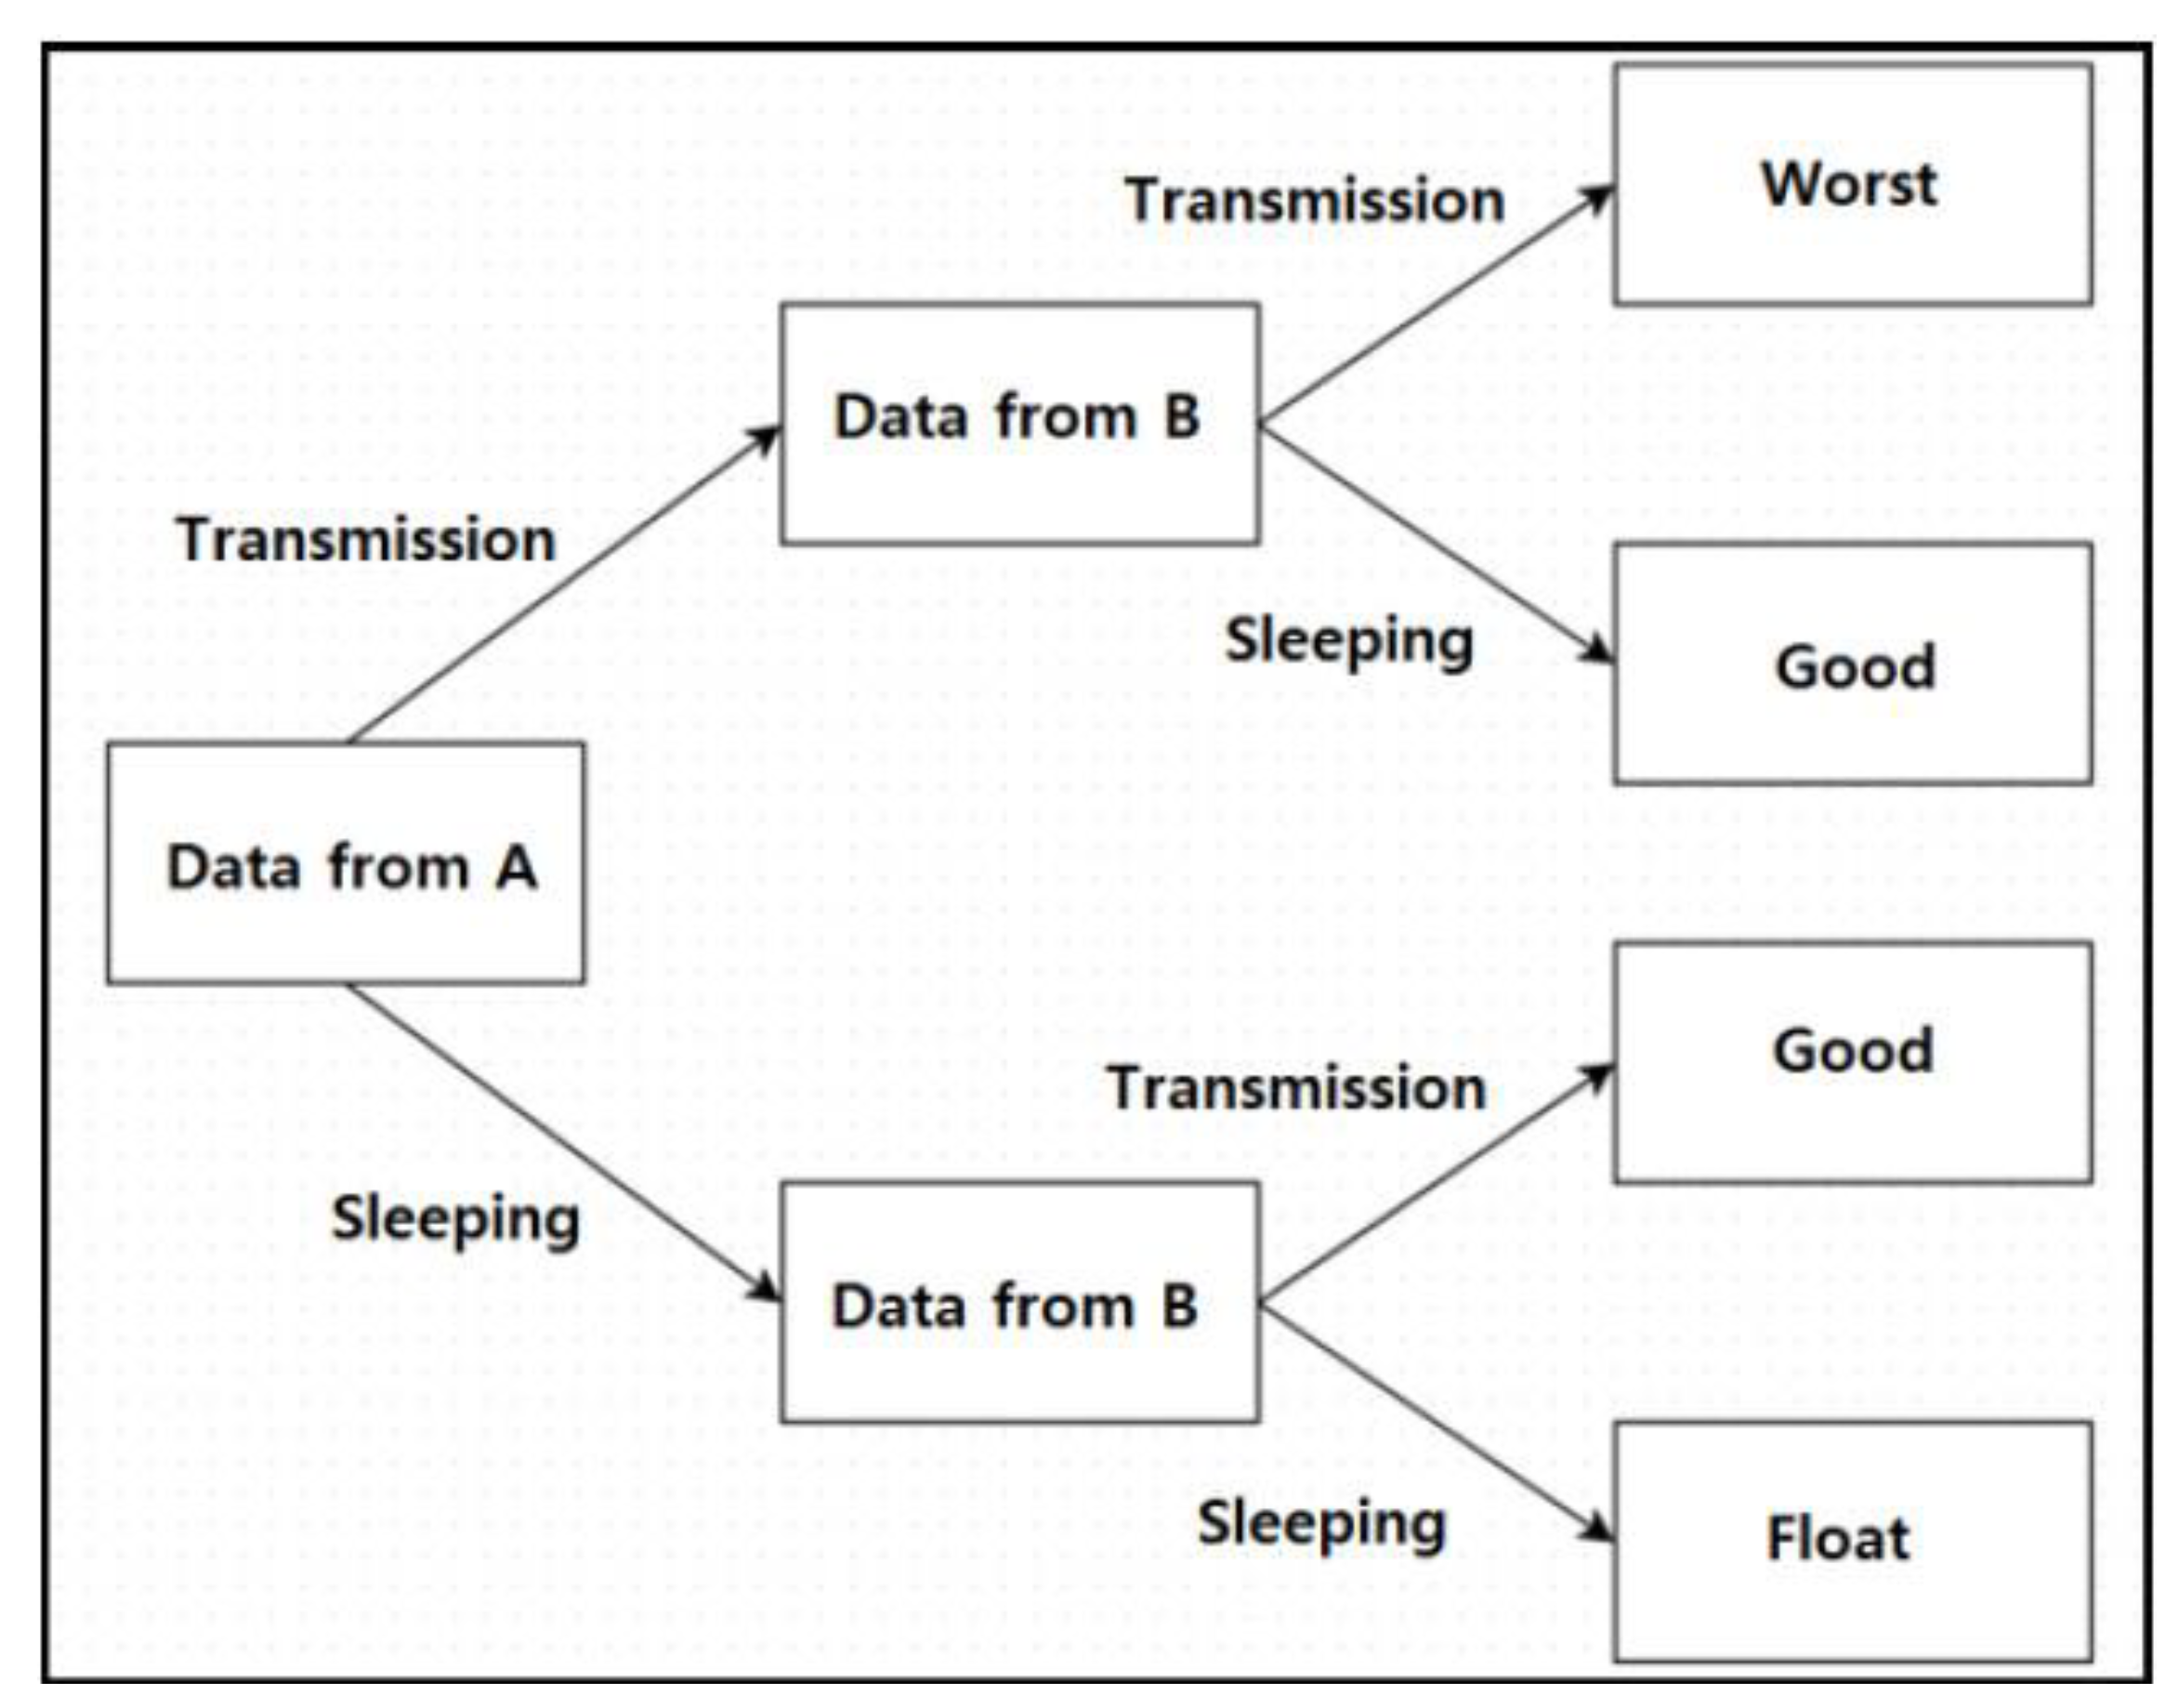
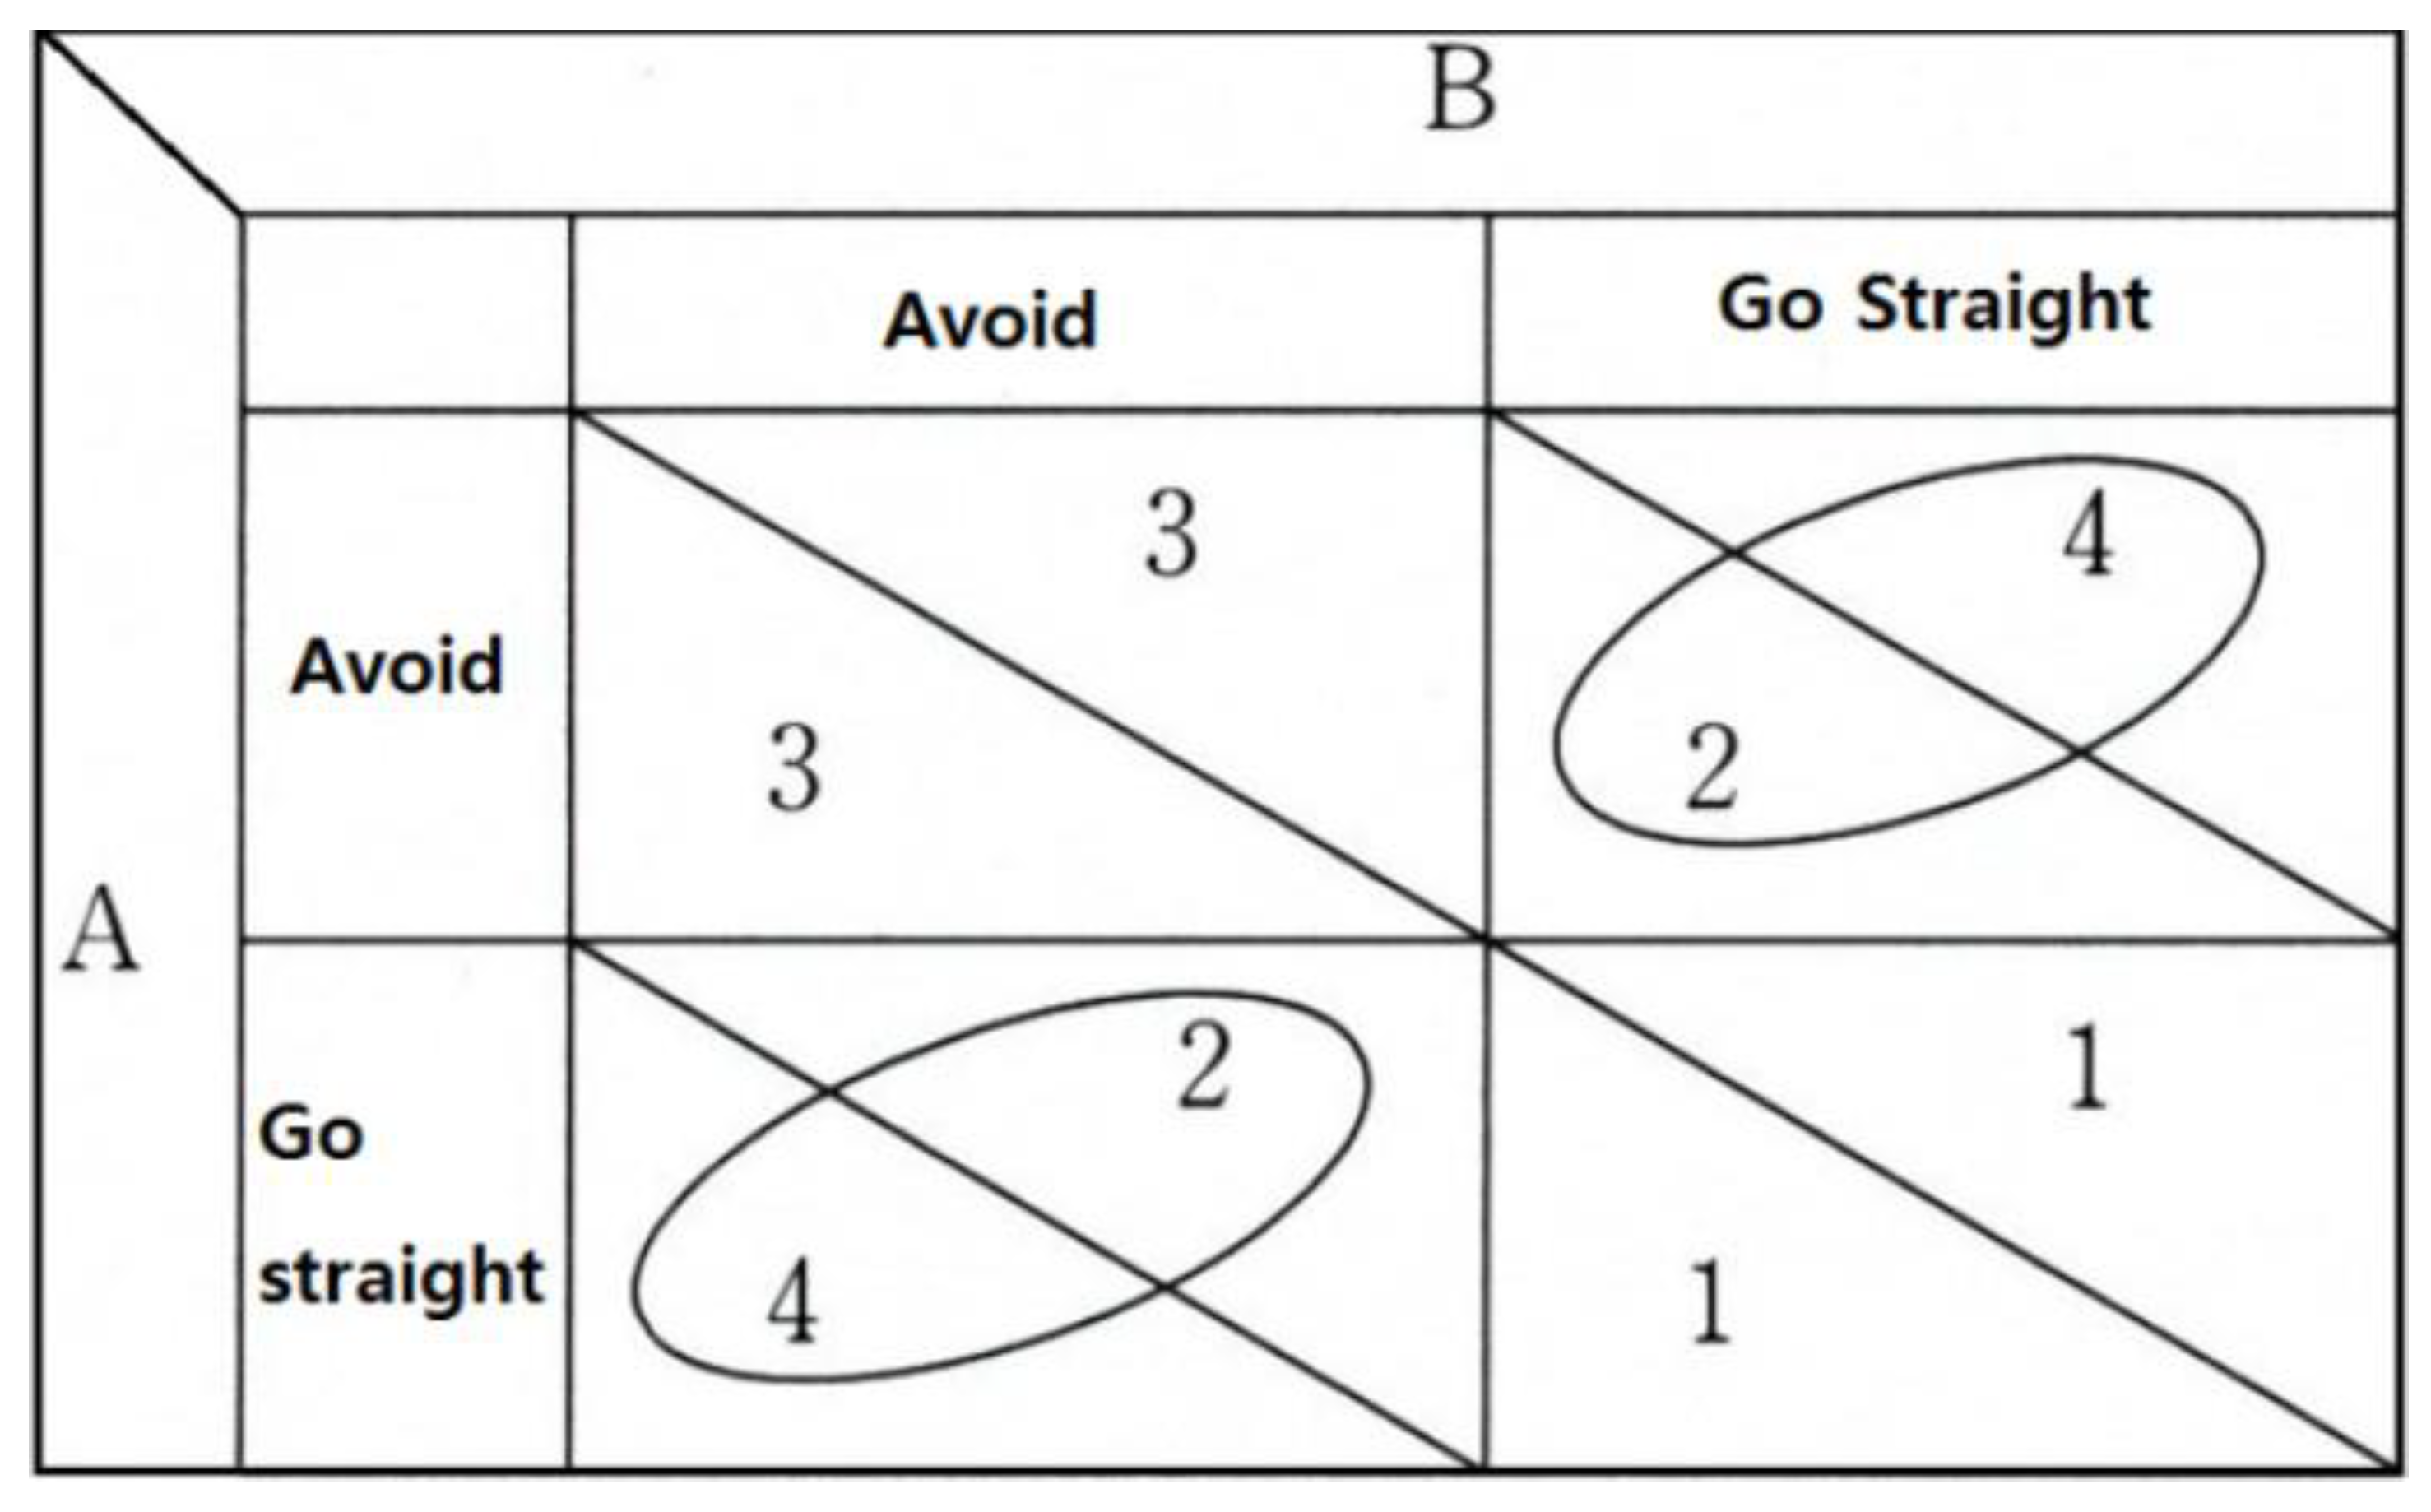
The communications between two Zigbee nodes are comparable to the communications between two people. Suppose there are two persons, Person A and Person B; include them in the situation in Figure 9 wherein A is trying to say “a” to B but B also wants to convey a word—“b”—to A. The communication will not be successful if these two try to say them simultaneously. This corresponds to the two “Go Straight,” and the payoff is 1,1 in a normal-form game or the worst situation in an extensive-form game. In contrast, if they both wait till the other speaks, it will not be much of a communication at all. This corresponds to the two Avoid cases, and the payoff is 3,3. Since this situation offers a quiet environment, a third person would be able to take advantage of the situation, but it is still not a good situation. If one of them speaks first, and the other speaks later, communication can be expected to be a smooth one, which corresponds to a Nash equilibrium solution in a normal-form game.
To configure a network with such Nash equilibrium solution, one could use a method of establishing a solution that allows avoiding the situations involving Avoid or the worst situation by acquiring information as to when the other will start communicating (Figure 10), getting out of Avoid state by demanding to communicate with one node, or granting priority to a single node in the worst situation.
Configuring a Zigbee-based network in an aquafarm to monitor various events and control the responses in a strategic/competitive environment in conformity to the Nash equilibrium solution can improve efficiency in terms of energy use. However, that configuring the individual network manually can be a waste of manpower, and such network would not be able to respond actively to the changing environments. For this reason, the network configuration should be automated; to achieve such goal, this study proposed a greedy algorithm and the Floyd–Warshall algorithm and compared their merits and demerits.
In the Y = F(x) structure above, what people want—which is Y—is defined using the game theory. Y is a Nash equilibrium solution in communication among nodes.
5.1. Greedy Algorithm
The greedy algorithm and Floyd–Warshall algorithm correspond to F(x) in the Y = F(x) structure. F(x) is an algorithm that processes x, which outputs Y using the X input value. The two algorithms (greedy algorithm and Floyd–Warshall algorithm) were used to find Y, a Nash equilibrium solution.
A Greedy algorithm is one that finds an optimal answer in each given stage based only on evidence that can be judged instantly. In this regard, the solution produced by a greedy algorithm is a collection of selections determined in each stage. The answer determined in each stage neither changes later nor affects the previously selected answer. Since the greedy algorithm performs rapid calculations with low accuracy and shortsighted decision making, it is more efficient for problems for which obtaining an optimal solution is not easy [27,28,29,30,31].
When there are several nodes, the execution sequence of nodes can be determined based on the individual graded weights measured considering the respective communication efficiency or signal output as well as their correlations with battery efficiency. All of these contribute to the improvement of efficiency in the tasks involved and energy saving.
5.2. Structure of Matroid
The current wide use of ESS (Energy Storage System) for the various types of power systems is mainly due to the issue of intermittency or uncertainty of renewable energy sources which is yet to be solved. Backing up the power grids largely depending on these energy sources to cope with issues is essential for the operation and management of these grids.
The study [32] aims to check the economic feasibility of the distributed generation (DG) using Li-ion battery. The total cost of ownership (TCO) is calculated for individual cases and the method used for the assessment involves a sensitivity analysis for the output values often performed to determine the effects of the parameter variability. Meanwhile, the study [33] considers a virtual power plant (VPP) architecture conceptually to perform an optimal management of distributed energy resource (DER) of the prosumer involved in a demand-side management (DSM) program.
Next, to characterize a distributed energy storage system (DESS) with a RES generator, a testing facility has been developed and set up at the eLUX lab., University of Brescia (Bristol, UK). The DESS was of a 25 kWh for the 64 kWp photovoltaic power generation system and the testing facility included a supervisory system for the remote monitoring and control of its components.
The major problem of the power generation using renewable energy sources has been unstable of intermittent production of power and it can lead to some serious operational problems in the power grid [34]. The battery energy storage system (BESS) is being considered as a promising technology which would provide a solution for such an issue and it is expected that with BESS, the design and operation of a renewable energy-based power grid will be much more efficient and effective, making the power generation more reliable by improving the host capacity of RES and customer’s self-consumption level. Despite such merits, this kind of grid also has its own problems. First, its maintenance has to be carried thoroughly until its due service life and it will be not easy to recycle all the components so that the reprocessing and decommissioning costs account a large part of the entire costs involved in running the grid to the end.
This study presents a Life Cycle Cost (LCC) model as a holistic model to discuss these elements in the long-term operation of such power grids [35].
A problem with a certain particular structure can always be solved by a greedy algorithm, and such structure is called Matroid. Although Matroid does not appear in all the problems, it can be found in various places, and the greedy algorithm can be utilized extensively [36,37,38,39].
Regarding the structure of a Matroid, when M is defined as the ordered pairs sorted and structured in a way that satisfies the conditions below, the calculation formula of M becomes M = (S,I), where S is a finite set wherein the minimum of one element is included and I is a subset of S wherein at least one element is included.
In this case, a null set can be included in I. A more formal expression will be if B ∈ I and A ⊆ B, then A ∈ I. Likewise, if A ∈ I, B ∈ I, and element x ∈ B − A when |A| < |B|, it is a structure that satisfies the condition A ∪ {x} z I [4].
This means that, under the Matroid structure, the optimal solution of the universal set in a greedy algorithm is also the optimal solution for the subset. Additionally, if the prior selection does not affect the latter selection, the optimal solution can be found with the greedy algorithm used. As the key concept in the previous game theory, the communications will be inefficient if two entities attempt communications simultaneously. In a unit task problem, only one operation can be performed in each fixed period; since it involves the question of how the operations should be carried out, this study attempts to improve communication efficiency by solving the problem with a greedy algorithm.
5.2.1. Output of Resulting Values after Processing Inputs: Greedy Algorithm
Greedy algorithm(x) = Y is a function which receives Number of job, MAX (Unit Time), and Task[k] as inputs and returns an execution order for the maximum Bonus value and Task after processing the inputs with a pseudocode. (Number of job, Unit Time, k, temp, and Bonus assume positive integers whereas temp ID, id of Task[j], Scheduling [i] take the string that can uniquely distinguish Task[k] as their values). A minimum Bonus value should be entered into temp and a Bonus of Task[j] value larger or equal to temp needs to be entered into temp Bonus. Finally, for temp ID, the value of id of Task[j] in this scenario.
The process is performed at the second ‘for’ statement where the id of Task and the Bonus showing the highest efficiency among the Task values (smaller or equal to Deadline resulting from the ‘for’ statement) will be obtained. These results are then recorded and the process repeats sequentially from the first ‘for’ statement. The first ‘for’ statement plays the role of a round girl who announces the beginning of each round in a boxing match and stores the optimal Bonus and Scheduling[i] values obtained in each Unit Time in which a task has been performed. Such a process continues until it reaches all MAX (Unit Time) to obtain the optimal approximate Bonus and Scheduling[i] values. However, if the Task[k] set used as an input assumes a matroid structure (i.e., the optimal solution of the subset Task[k] is also the optimal solution of Task[k]), the optimal solution will be obtained instead of the optimal solution.
          GreedyAlgorithm(Number of job, MAX(Unit Time), Task[k])
          {
          Bonus, temp <- 0

             for i <- 1 to MAX(Unit Time)
              {
                    for j<- 1 to k
                     {
                     if ( Task[j].Deadline <= I )
                           { if (Task[j].Bonus >= temp)
                            { temp Bonus <- Bonus of Task[j]
                            temp ID <- id of Task[j] }
                           }
                     }
              Bonus < - Bonus + temp Bonus
              Scheduling [i] <- temp ID }

          temp Bonus <- reset
          temp ID <- reset
      }
5.2.2. Output of Resulting Values after Processing Inputs: Floyd–Warshall Algorithm
The Floyd–WarshallAlgorithm(x) = Y is also a function which receives Number of job, MAX(Unit Time), and Task[k] as inputs and returns an execution order for the maximum Bonus value and Task after processing the inputs with a pseudocode. In this function, Number of job, Unit Time, k, temp, and Bonus assume positive integers whereas id of Task[n] and Scheduling [i] take the string that can uniquely distinguish Task[k] as their values. A Bonus value of 0 has been entered into temp for initialization. In the previous case involving the greedy algorithm, an optimal option was selected in each Unit time round and the process went on to the next round without changing the option but in this case, the result is outputted after finding the optimal solution in all the combinations obtained from all possible scenarios. Thus, this algorithm is one that can always find the optimal solution but its downside is that it requires much calculation as it attempts to find an optimal solution for all the possible cases.
     Floyd–Warshall Algorithm (Number of job, MAX(Unit Time), Task[k])
          {
          N <- Number of job
          temp <- 0
          for (int m = 0; m < N; ++m) {
          for (int i = 0; i < N; ++i) {
          for (int j = 0; j < N; ++j) {
          if (Bonus of Task[i] + Bonus of Task[j] + Bonus of Task[m] > temp ) {
          temp = Bonus of Task[i] + Bonus of Task[j] + Bonus of Task[m]
          Scheduling [i] = id of Task[i] + id of Task[j] + id of Task[m]
          }
          }
          }
     }
5.3. Scenario Setup
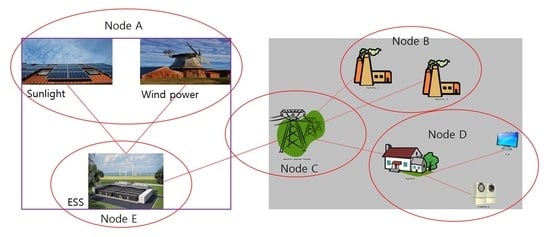
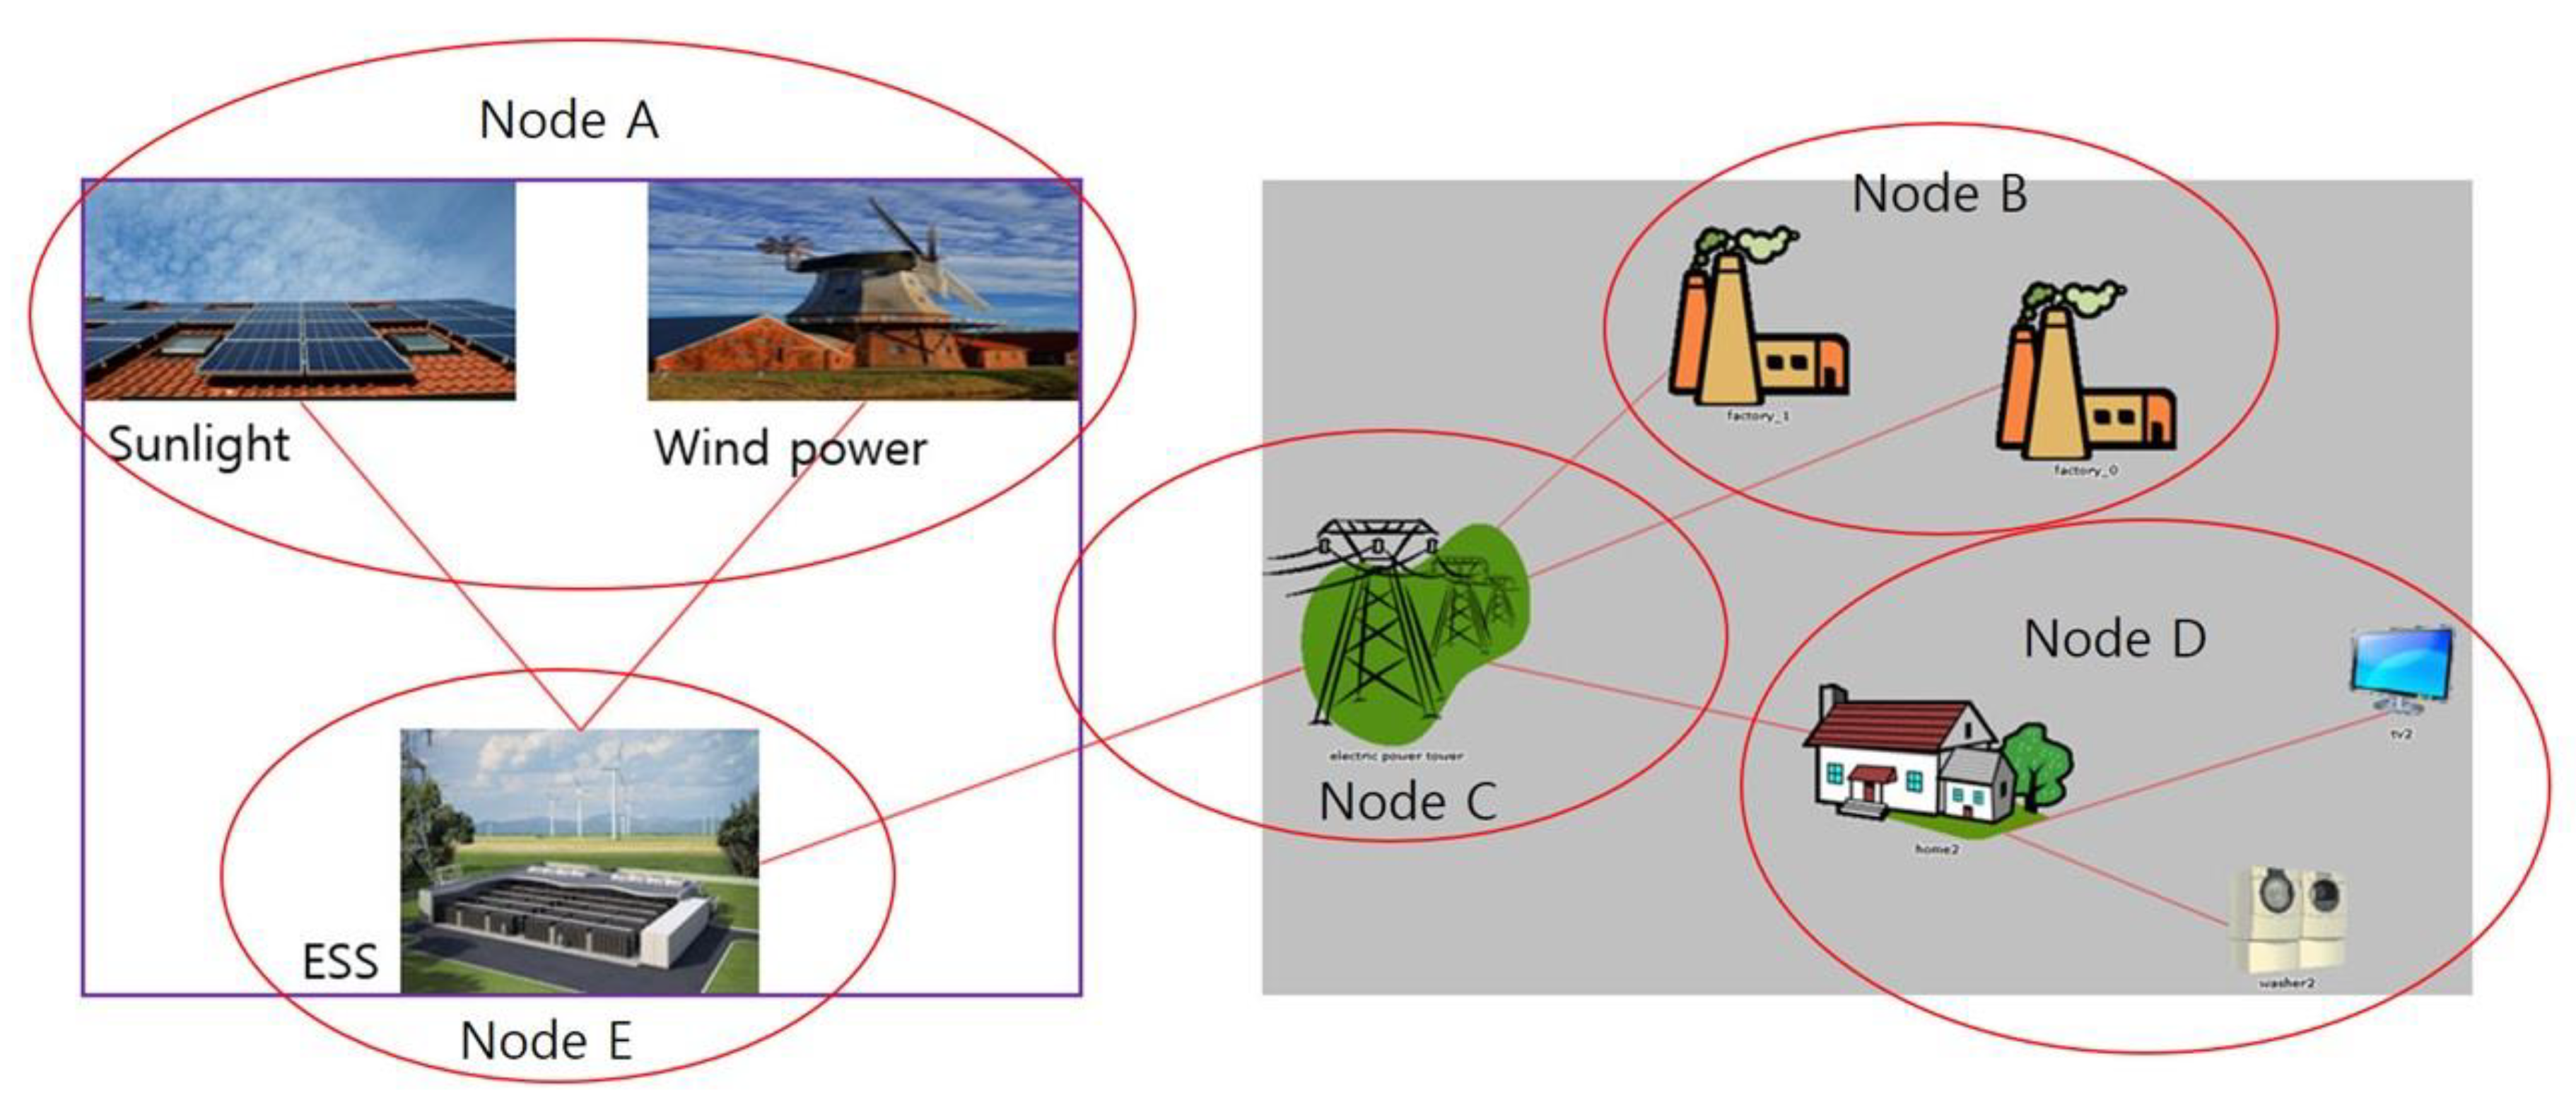
To set up a scenario, a network was configured by sorting the nodes by function (Figure 11). Node A plays the role of producing energy, and Node B represents the industrial settings. Meanwhile, Nodes D and E represent the Home Network and ESS, respectively. The communications between Nodes B, D, and E will be assumed by Node C. A brief description is given below.
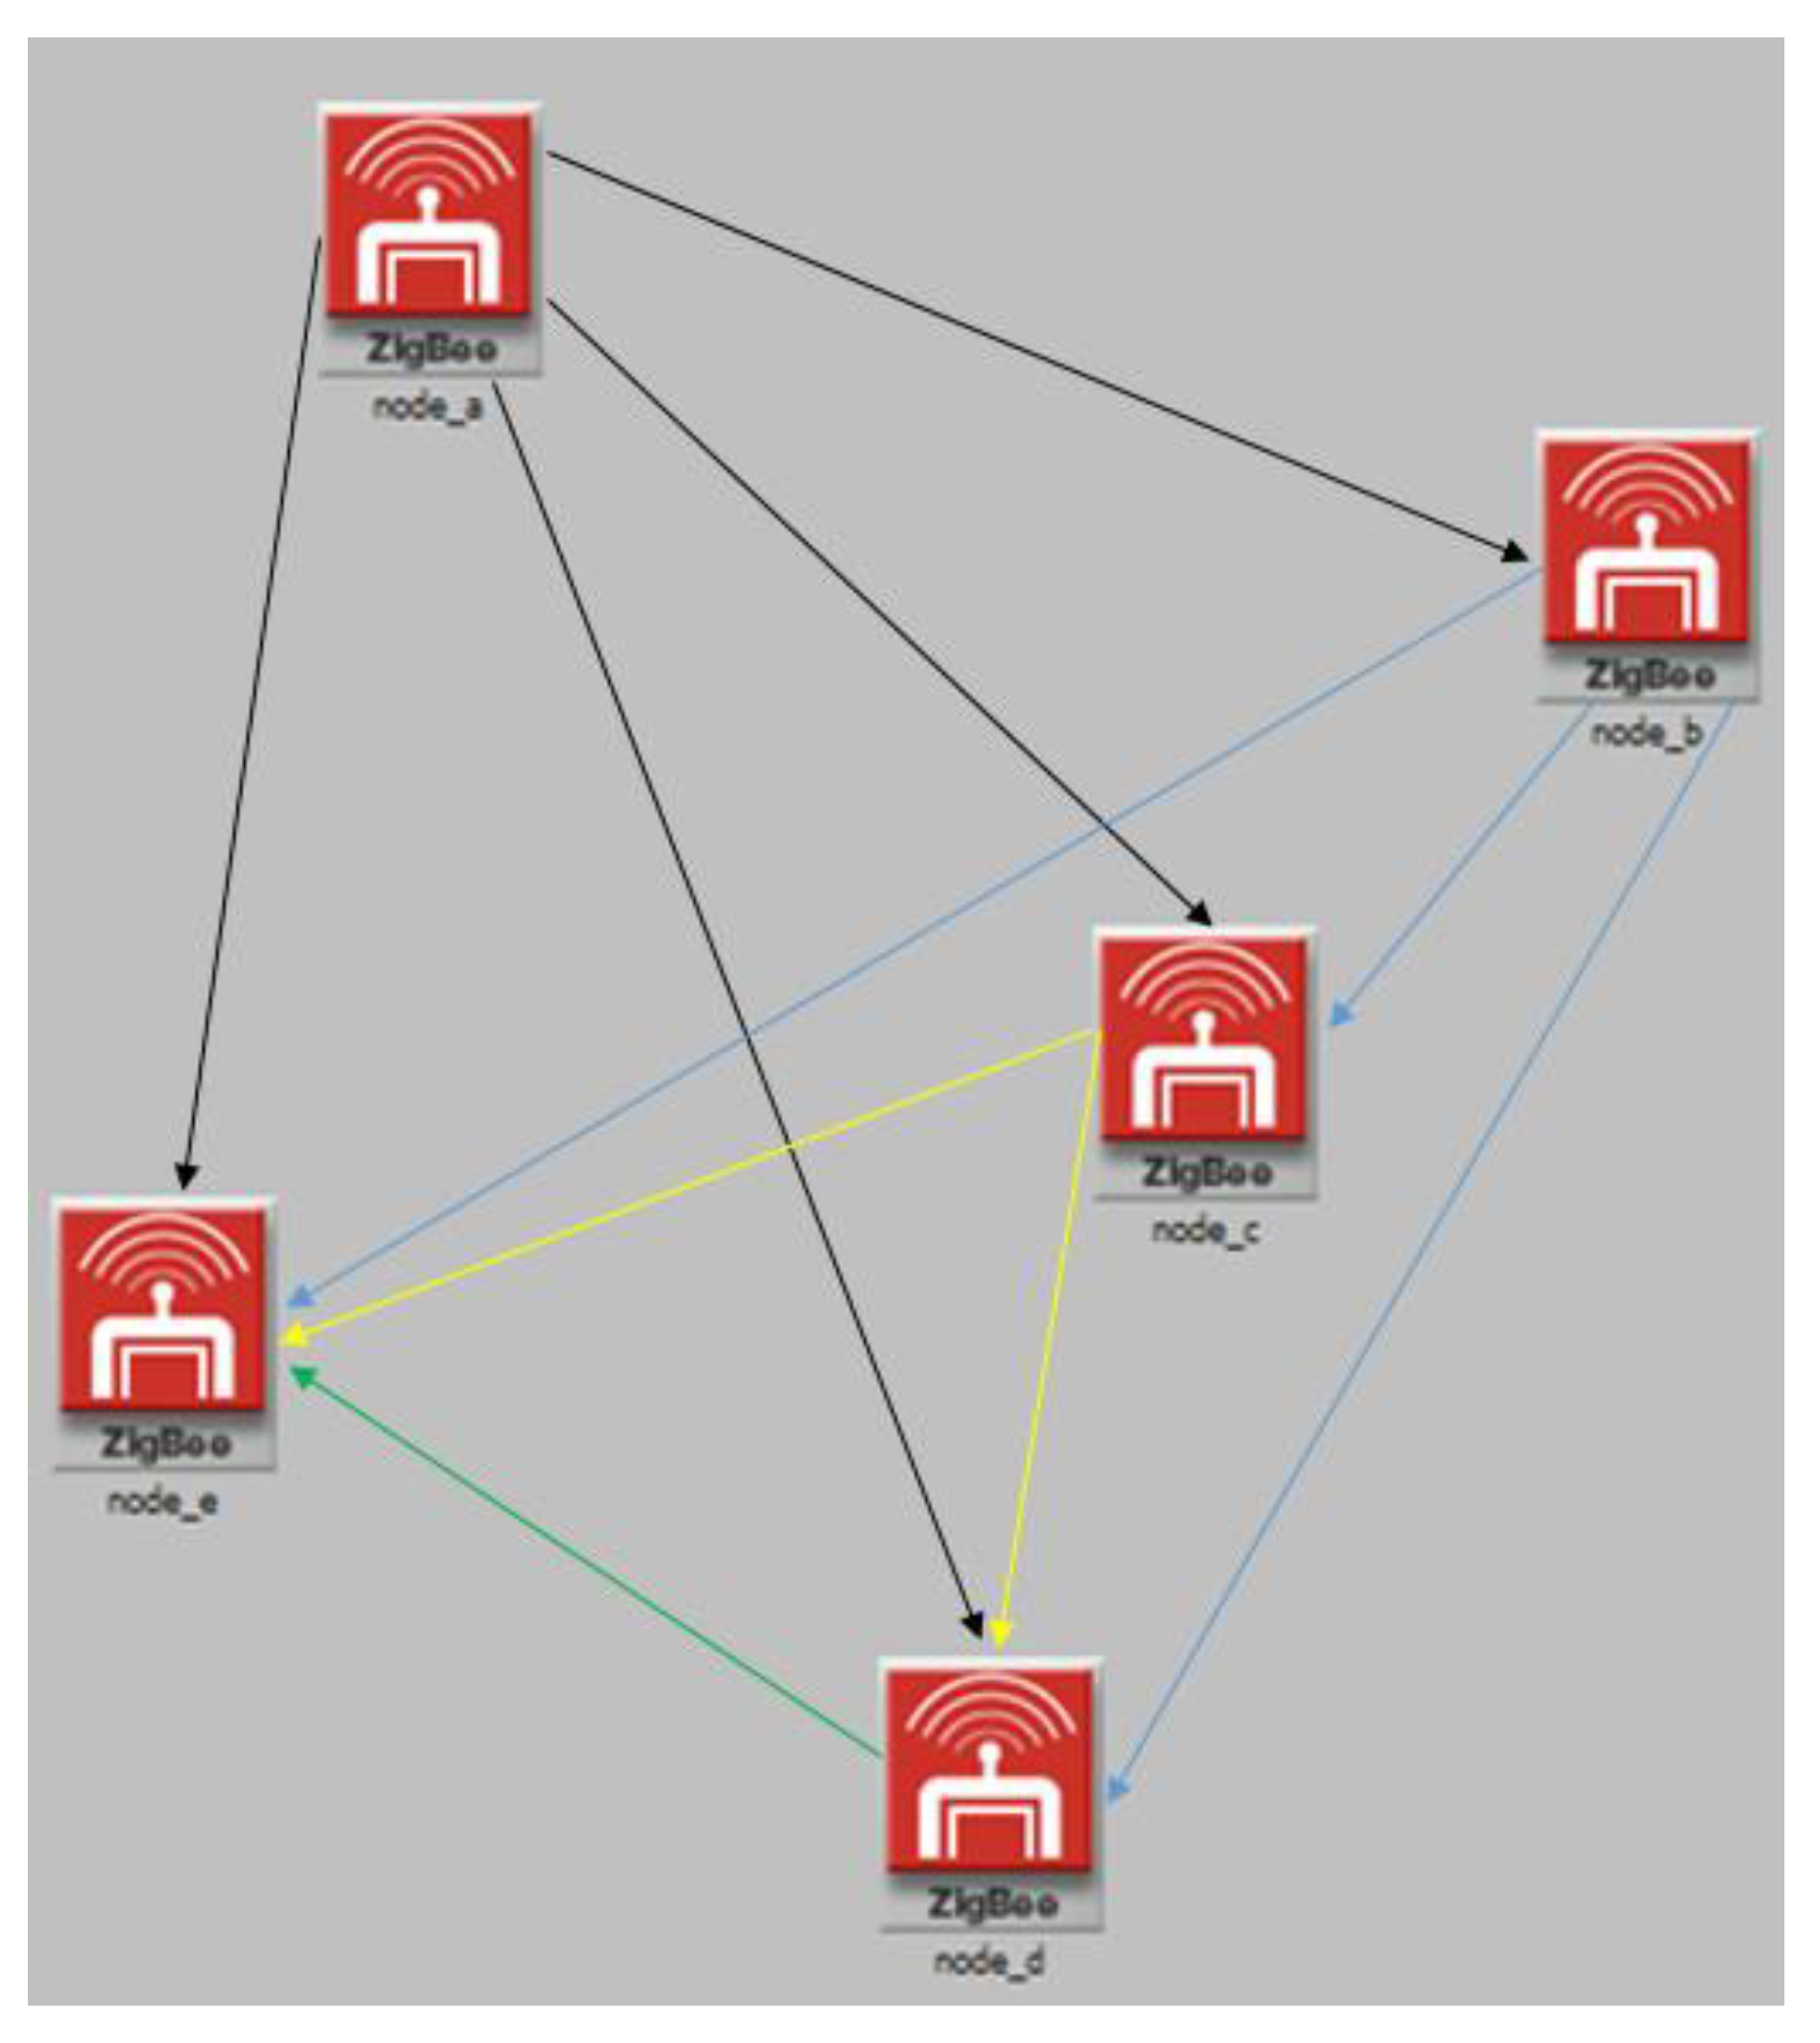
The connections in Figure 12 have the following limitations: First, there are no self-connections. That is, the number of tasks of Node A is just one and it is a unique one. Second, although arrows were used for intuitive understanding, each connection actually does not have any directionality. This was to reduce the computation load and there are no limitations according to the sequence. For instance, the results of the tasks performed by Node a-b and Node b-a are the same. Third, if the benefit gainable from Node a-b-c is larger than that of Node a-c, the benefit gained from Node a-b-c-d will be larger than Node a-c-d, provided that the minimum benefit a node can have is 0 and the value cannot be a negative one.
Assuming that a single operation takes up 1 unit time, profits can be gained when the tasks are performed for 3 unit times (1, 2 & 3 in the scenario) (Table 1). For the scheduling of these tasks, the operations that can derive profit are operations b and d in 1 unit time; when calculating the respective profits, it is better to perform b. Accordingly, in 2 unit times, a should be selected between a and c. The same goes for 3 unit times where e is the profitable operation. Therefore, the total profit expected to be gained from the operation sequence of b-a-e is 134. However, that operation c could be more profitable instead of b when it is performed in 1 unit time, so the revised order of the optimal solution becomes a-c-e, deriving profit of 142. The difference has arisen since this scenario did not conform to the Matroid structure.
The correlations between signal output, communication efficiency, and battery consumption were examined through the OPNET simulations. It is possible to schedule the tasks by setting the order of operations to be performed optimally or at least approximately with a greedy algorithm; if the schedule has been set up in a way to find a Nash equilibrium solution, energy can be saved by improving the communication efficiency and battery consumption rate by organically controlling the signal output based on the information pertaining to the correlations.
Defining A as the increase in entropy during communication and its efficiency as “A”, the following algorithm will provide efficiency A’’. The comparison result will show A’ < A“. This could be a valuable method of overcoming the limits of sodium-ion battery’s efficiency and the physical characteristics.
In C language, a function qsort() that offers quick sorting is provided as a basic library. Function qsort() sorts the received elements according to their sizes. To use this function, a header file stdlib.h should be included in advance.
qsort(&Tasks [1], TotalTasks, sizeof(struct Home), Compare); the input parameter &Tasks [1] is a starting address of the sequence, whereas TotalTasks indicates the number of elements included in the sequence. In addition, sizeof(struct Homework) is the size of a single element stored in TotalTasks, and Compare is a function pointer that performs actual comparative calculations.
Function Compare () receives the pointers const void *_a, const void *_b of the two elements for which a comparative calculation will be performed. The source code was developed to sort the deadlines in ascending order while sorting bonuses in descending order. The execution result is shown in Table 2.
The input values of the source code below are total jobs, deadline, profit gained from task completion within the deadline, and name of each node. The resulting value of the pertinent source code is a set of ordered pairs wherein the quantity of gains reaches the maximum value when execution finishes within the deadline. In other words, “improvements to increase communication efficiency by adjusting radio wave output systematically and to reduce battery consumption” which is the result of the previous OPNET simulation is a unit-task problem, a limited environment wherein one job is performed in unit time. It can be redefined for convenience of calculation. If radio wave output is adjusted by establishing communication according to the execution order of each unit task, we can conclude that communication efficiency can be improved and energy can be saved. However, that the constraint condition of the unit task is not absolute. It is also possible to consider a situation wherein more than two jobs are performed in unit time and the corresponding algorithm. Nonetheless, the time and energy required for calculation are expected to increase geometrically, and we can give up the unit-task constraint condition if there is good reason to do so.
The two methods used for measuring an accurate runtime are one that uses a clock function or a QueryPerformanceCounter function. It is possible to measure the runtime by calling a function associated with the time measuring.
However, important thing is that as the QueryPerformanceCounter function is dependent on CPU’s so that when its threads are distributed by several CPU’s in a program using multithreads, different values can result even if each thread reads the value by using the QueryPerformanceCounter function at the same point.
Also, although it is true that the smallest time unit for the measurement depends on the system, it is not determined by the speed of a CPU. According to ‘Help’ of API, even the level of CPU clock can be checked depending on the systems.
Meanwhile, there is a thing called a Clock Tick on the computer whereas the OS has a clock () function that informs which process has started for how long. That is, it is possible to know for how long the current process has been running in clock tick unit base with the ‘clock_t current_tick = clock();’ code. If one wants to know it in time basis, it can be converted into time by using the code ‘double current_sec = current_tick / CLOCKS_PER_SEC;’. In this case, CLOCKS_PER_SEC is a constant defined in ‘time.h’ file.
When the greedy algorithm was used, the runtimes were 0.001 s. and 0.0004680 s. when the clock function and the QueryPerformanceCounter function had been used, respectively.
The first line in Table 3 indicates the total jobs. The pertinent paper used five jobs. The second to the sixth lines indicate the deadline, profit gained from task completion within the deadline, and name of each node, which corresponds to the input value X in the Y = F(x) structure. In the pertinent paper, random deadline, profit gained from task completion within the deadline, and name of each node were given to aid in understanding the source code. The algorithm in question finds a Nash equilibrium solution using the given value X. The seventh and eighth lines show the approximate optimal execution order of unit-task and the sum of profit gained from task completion within the deadline, respectively.
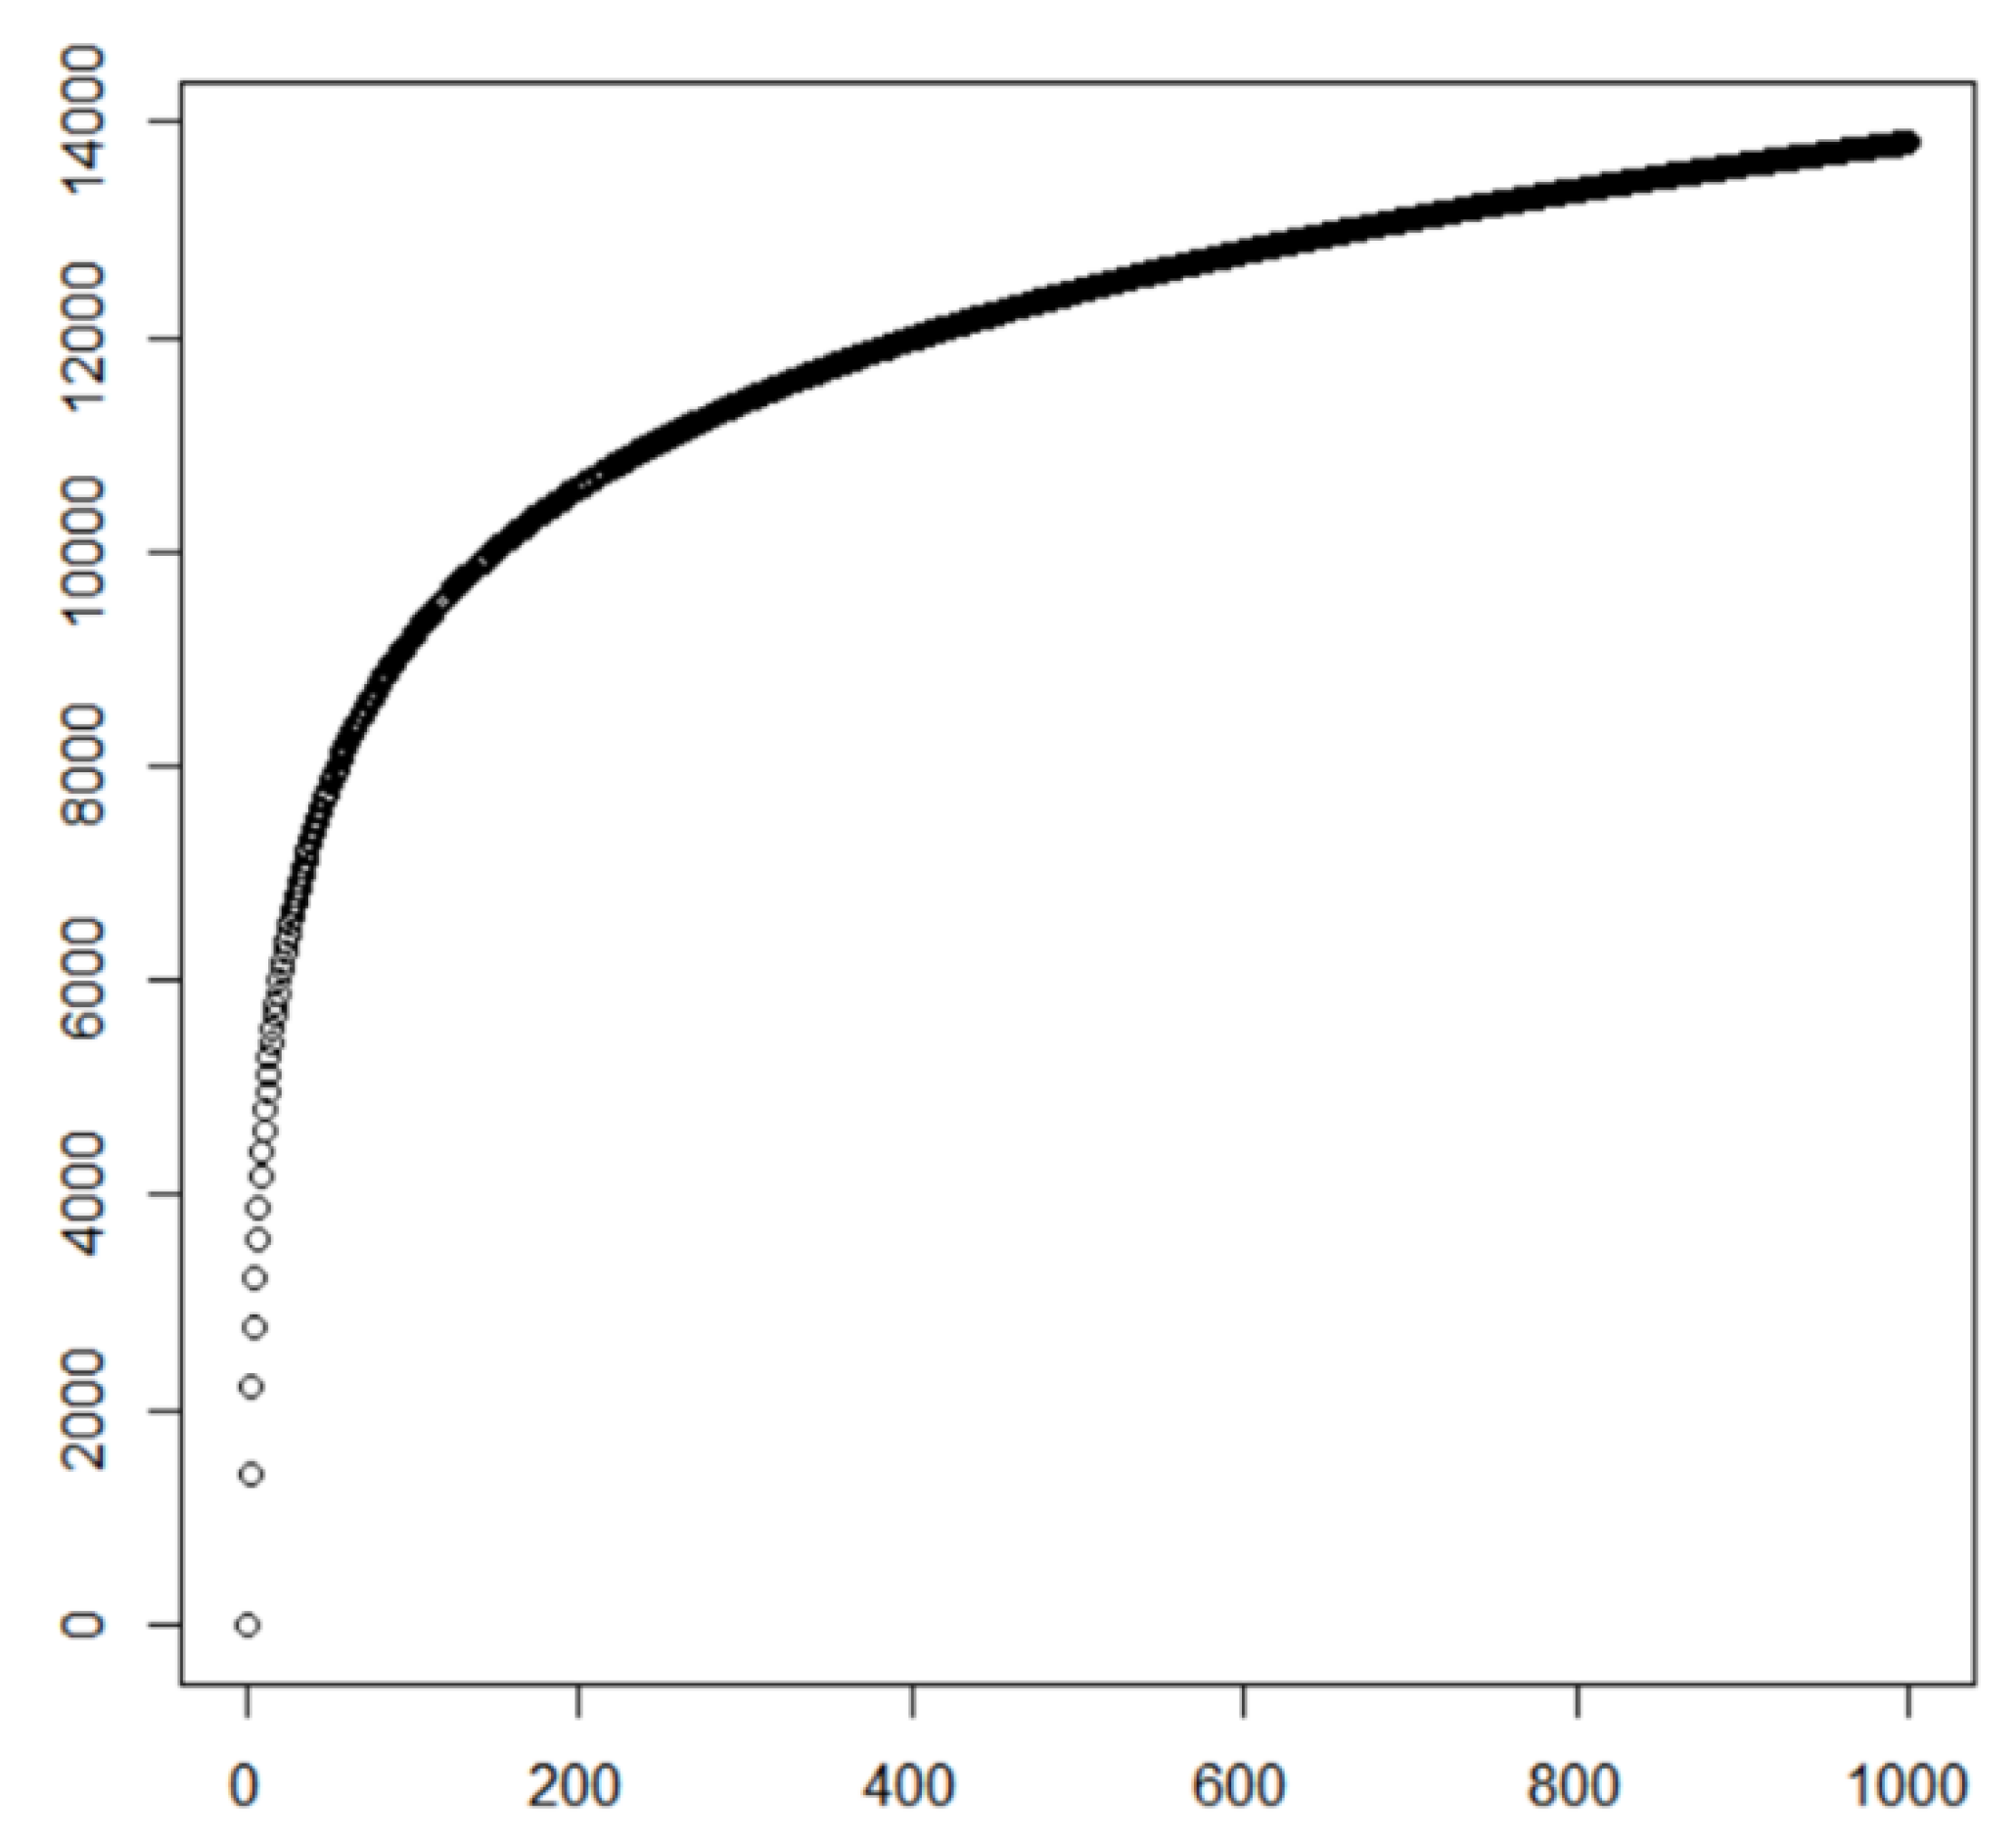
Figure 13 shows a representation of the source code’s time complexity using R Studio. Q sort is used here for sorting, and the time complexity of qsort becomes “n * log n” when it is the best or “n^2” if it is the worst.
Here, the X-axis means the number of nodes in the pertinent paper, and the Y-axis means the amount of calculation needed to schedule jobs in the pertinent paper. It has the same concept of calculating every possible case of ordered pairs {(A, A) (A, B) (B, A) (B, B)} and selecting one value among them when A and B choice alternatives are given two times. Simply put, calculating one ordered pair occurs in unit time, and four unit times are required if there are two choice alternatives. In other words, calculating every possible ordered pair when there are two choice alternatives has the same unit time value required to find a solution with N^2 time complexity when there are two nodes.
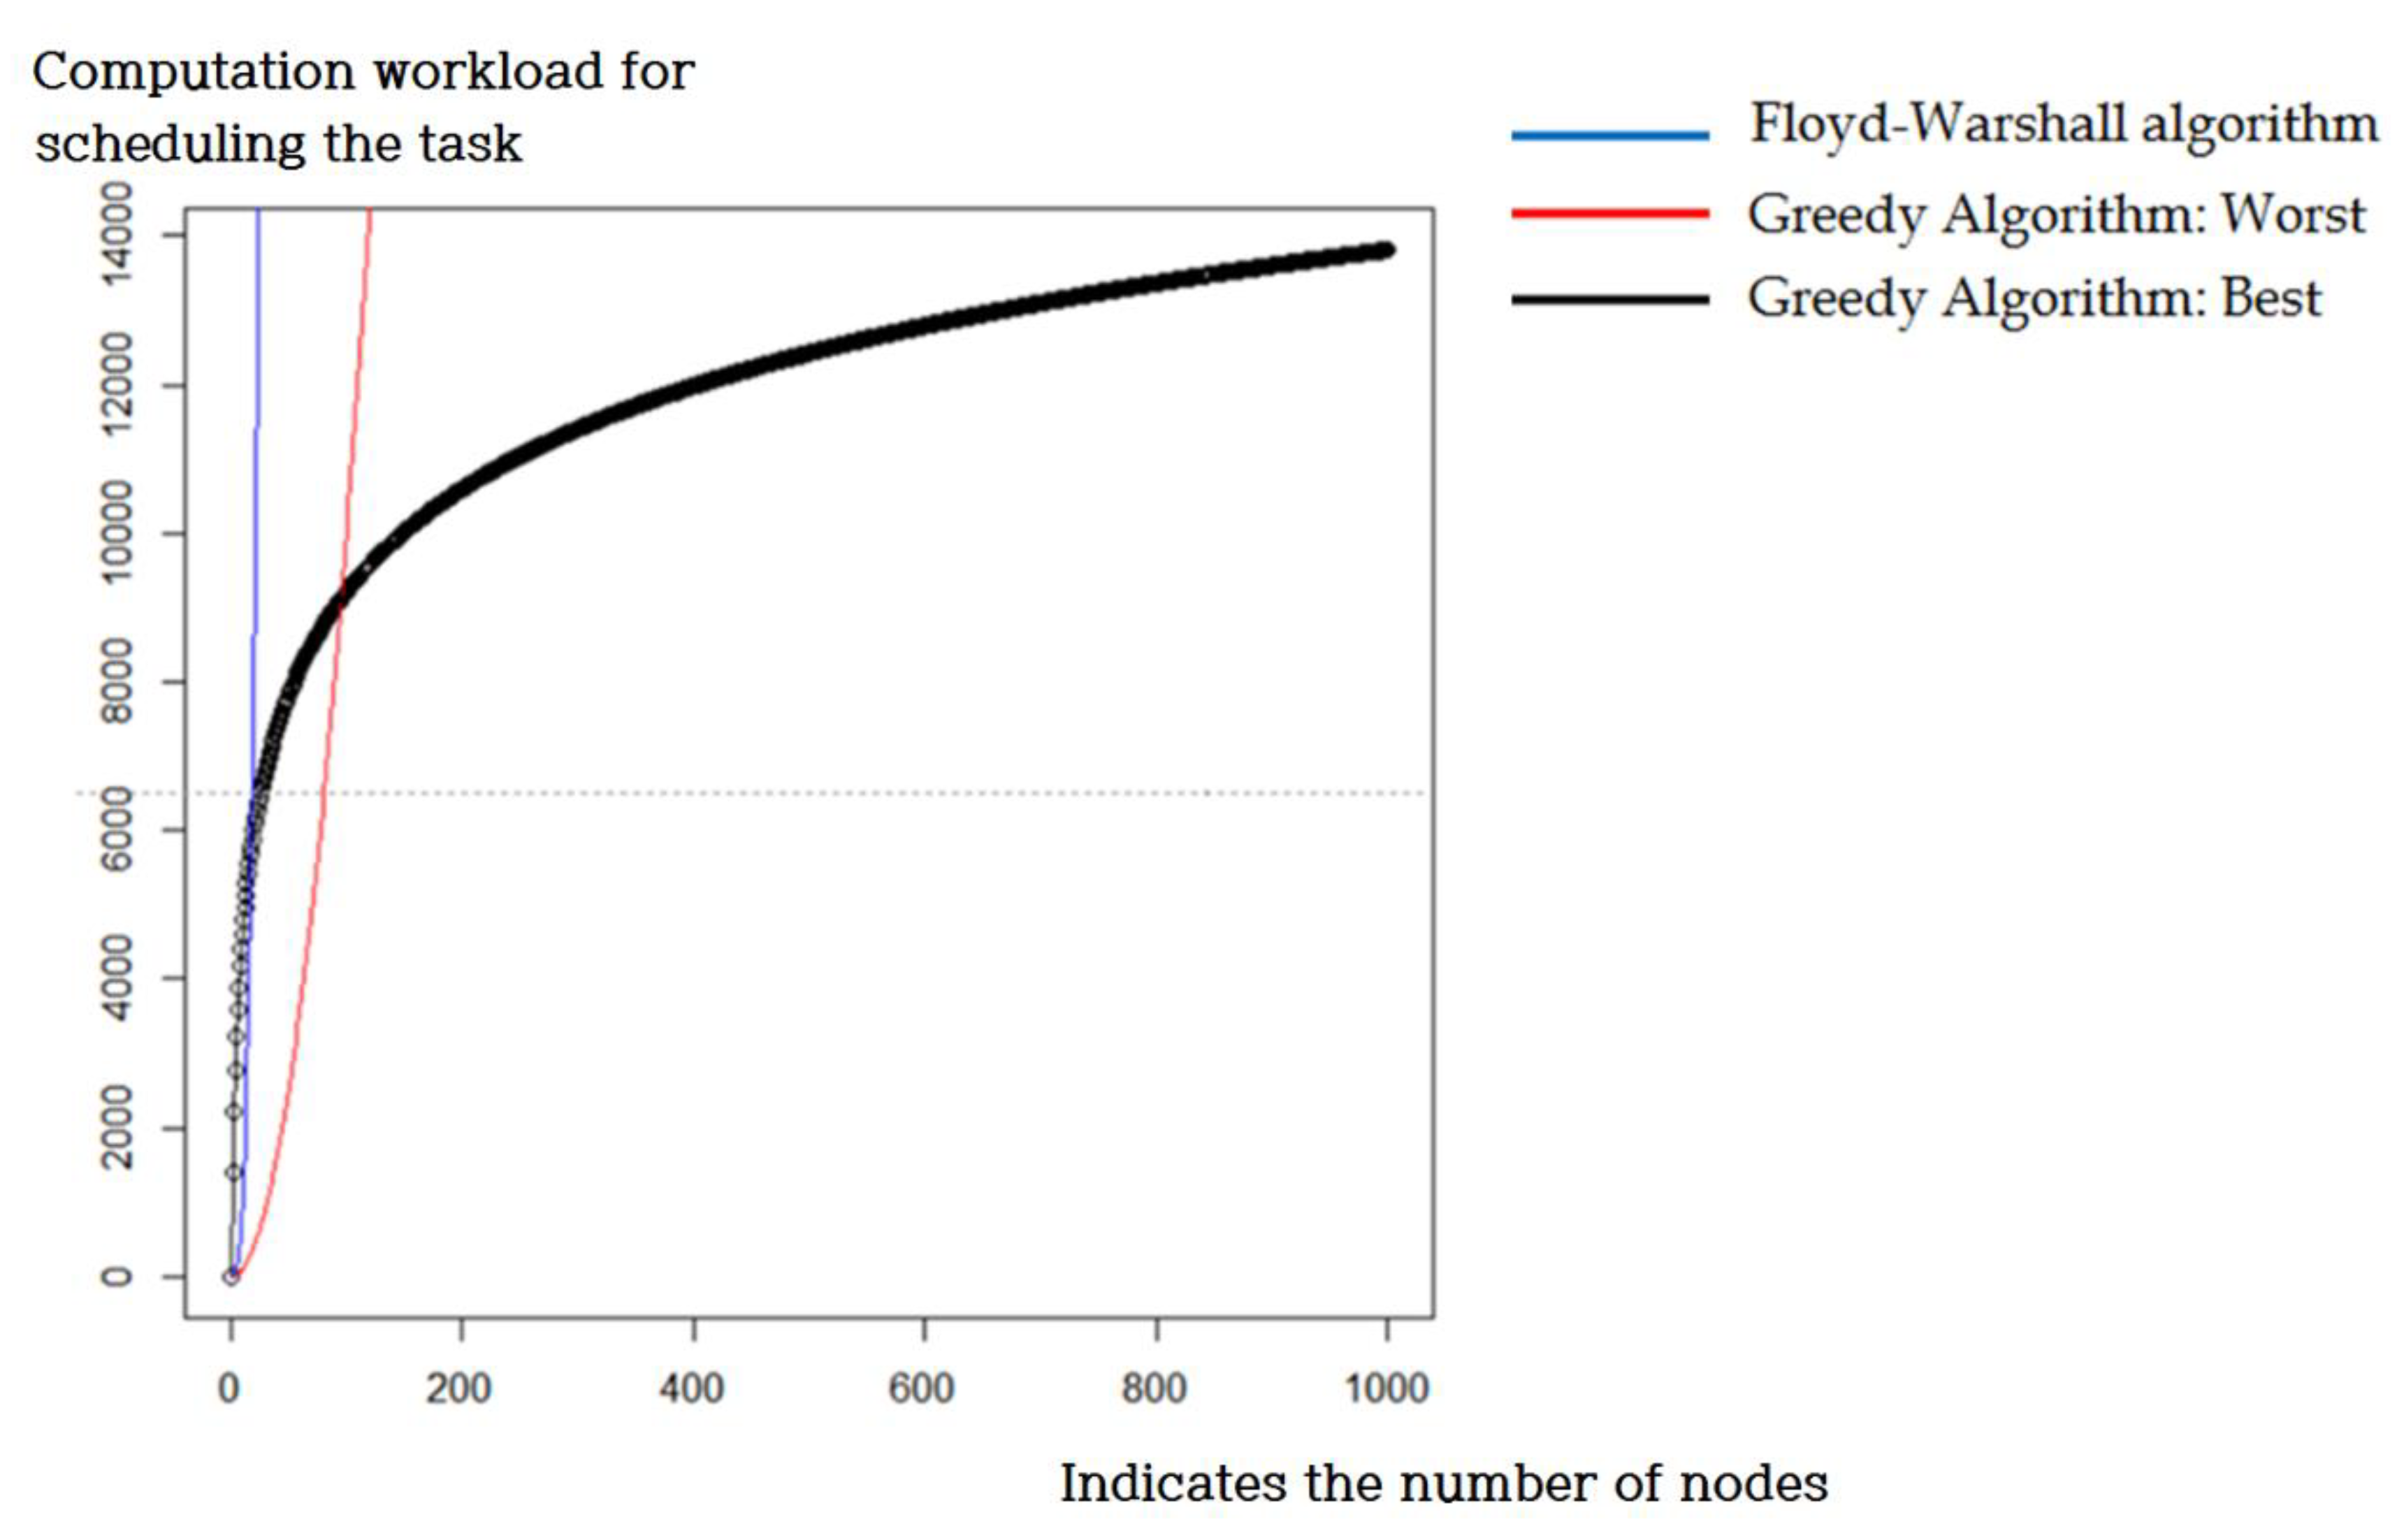
Assuming that a unit task performing a single task in unit time is being performed, the best case for the 1000 tasks shows time complexity of 14,000.
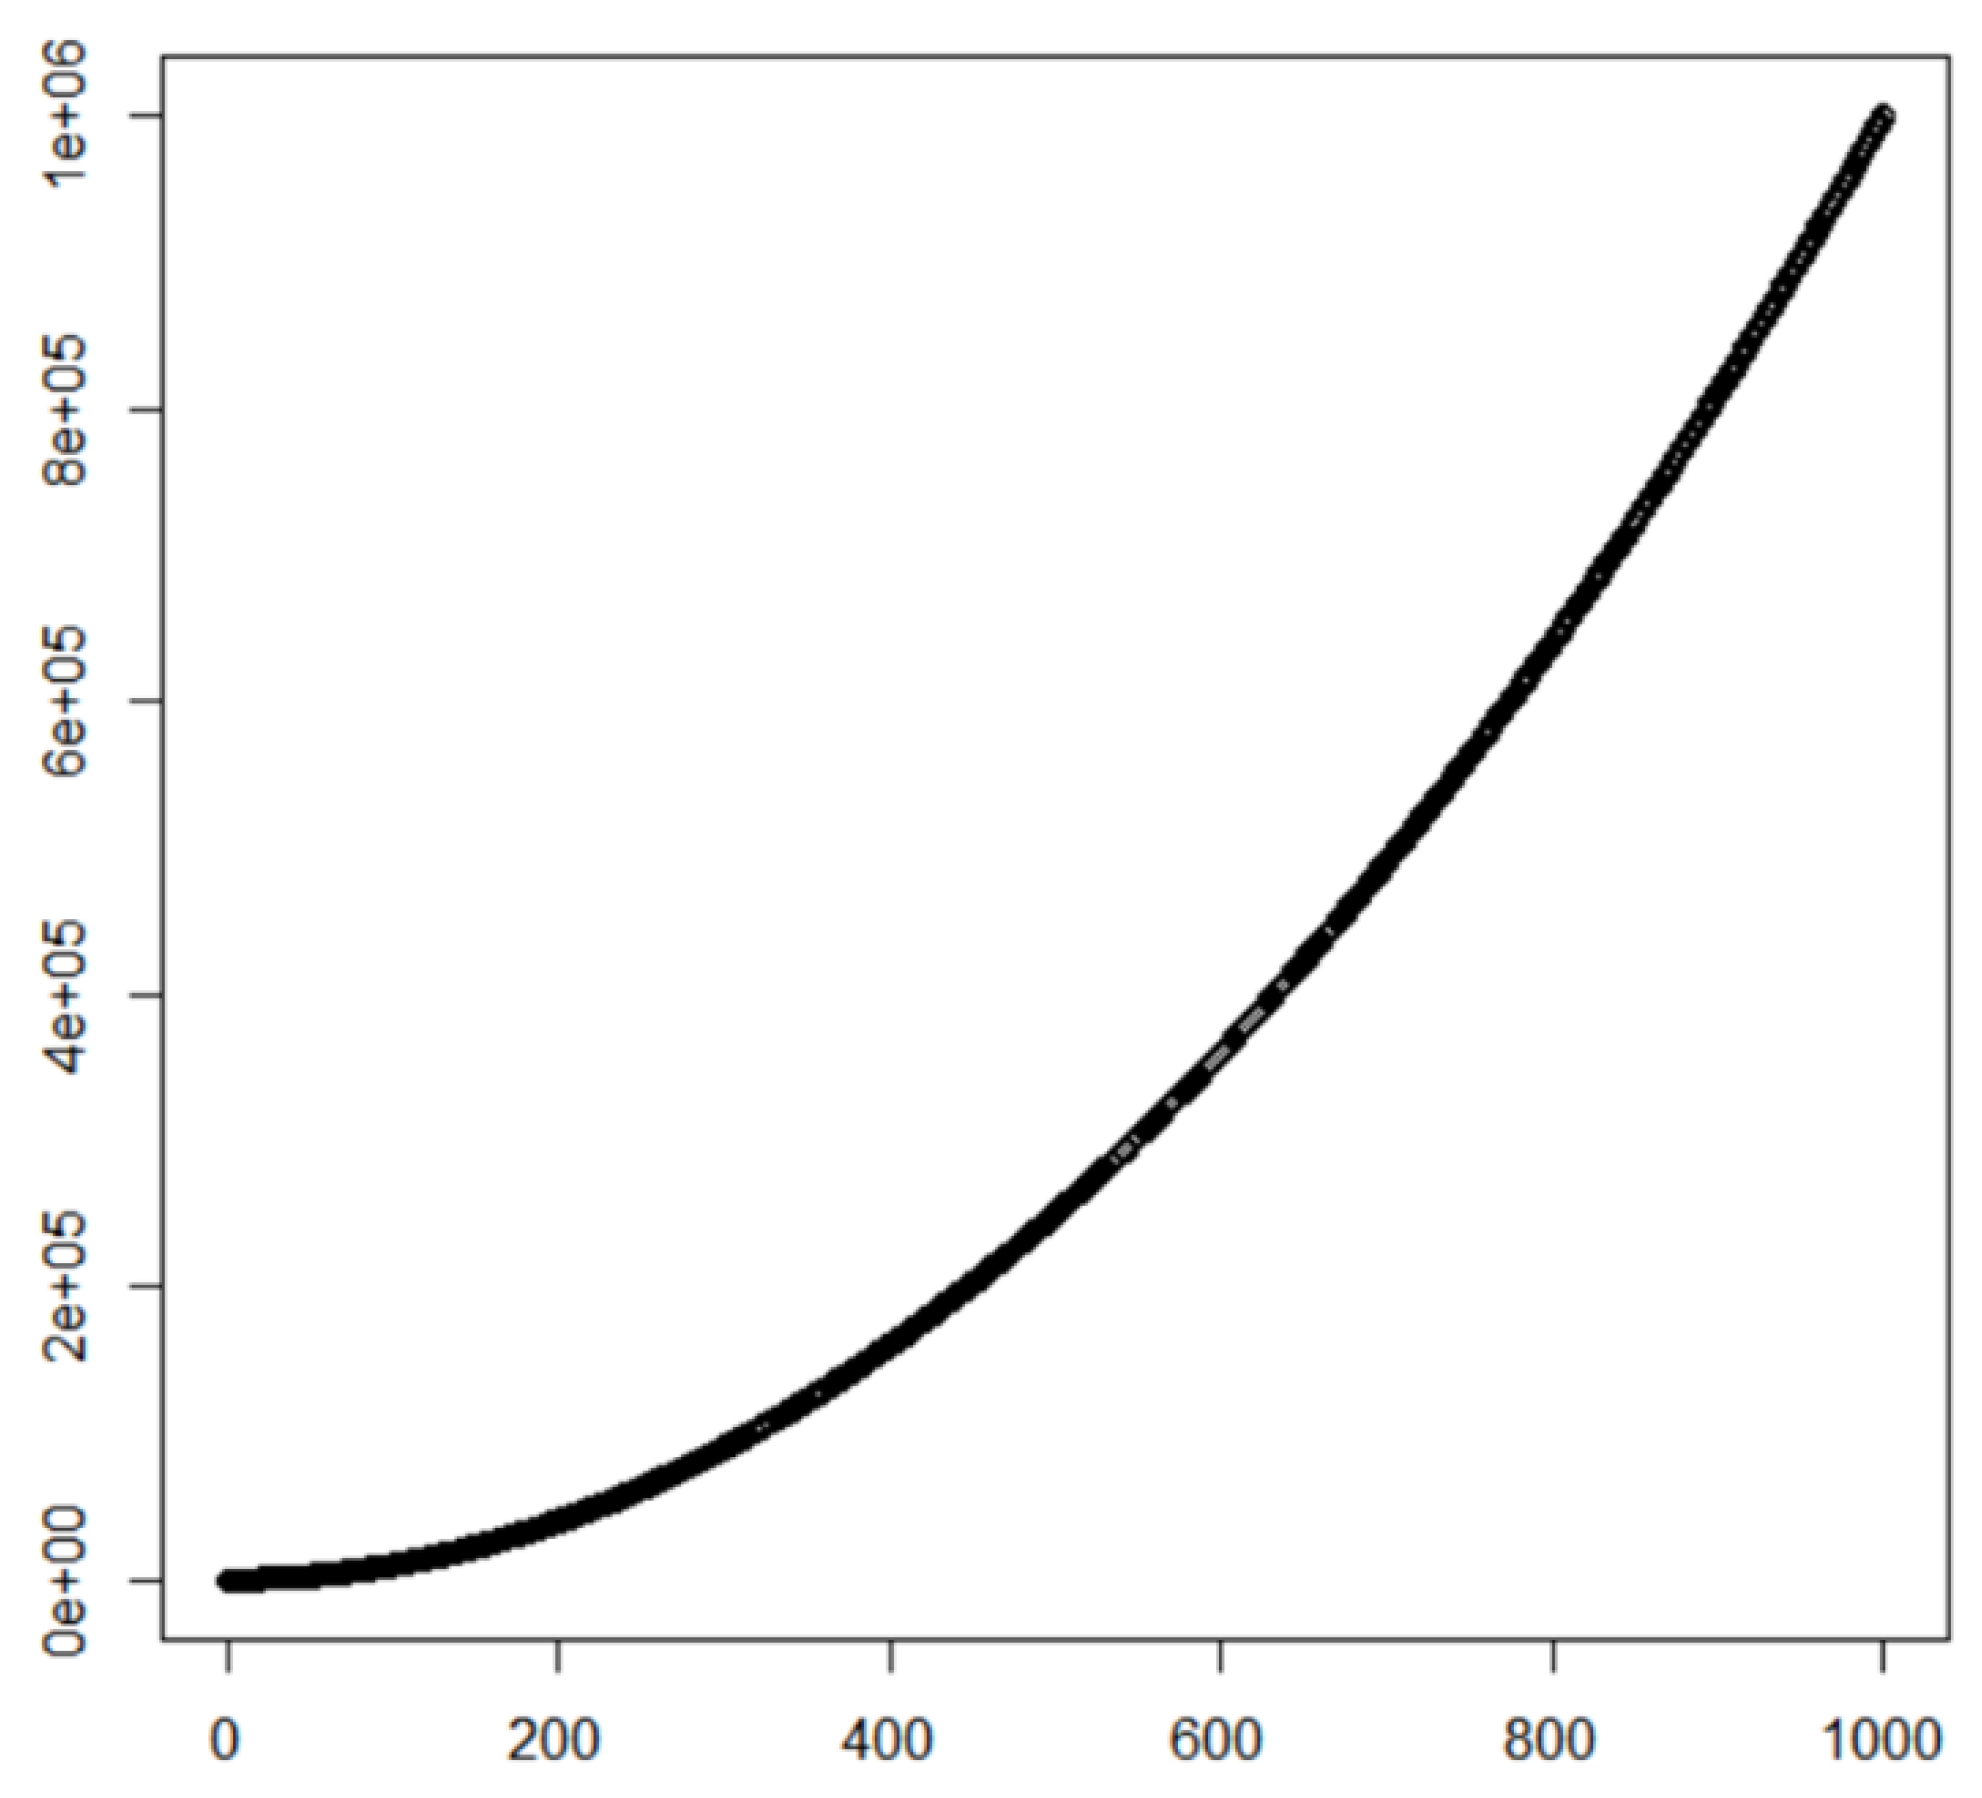
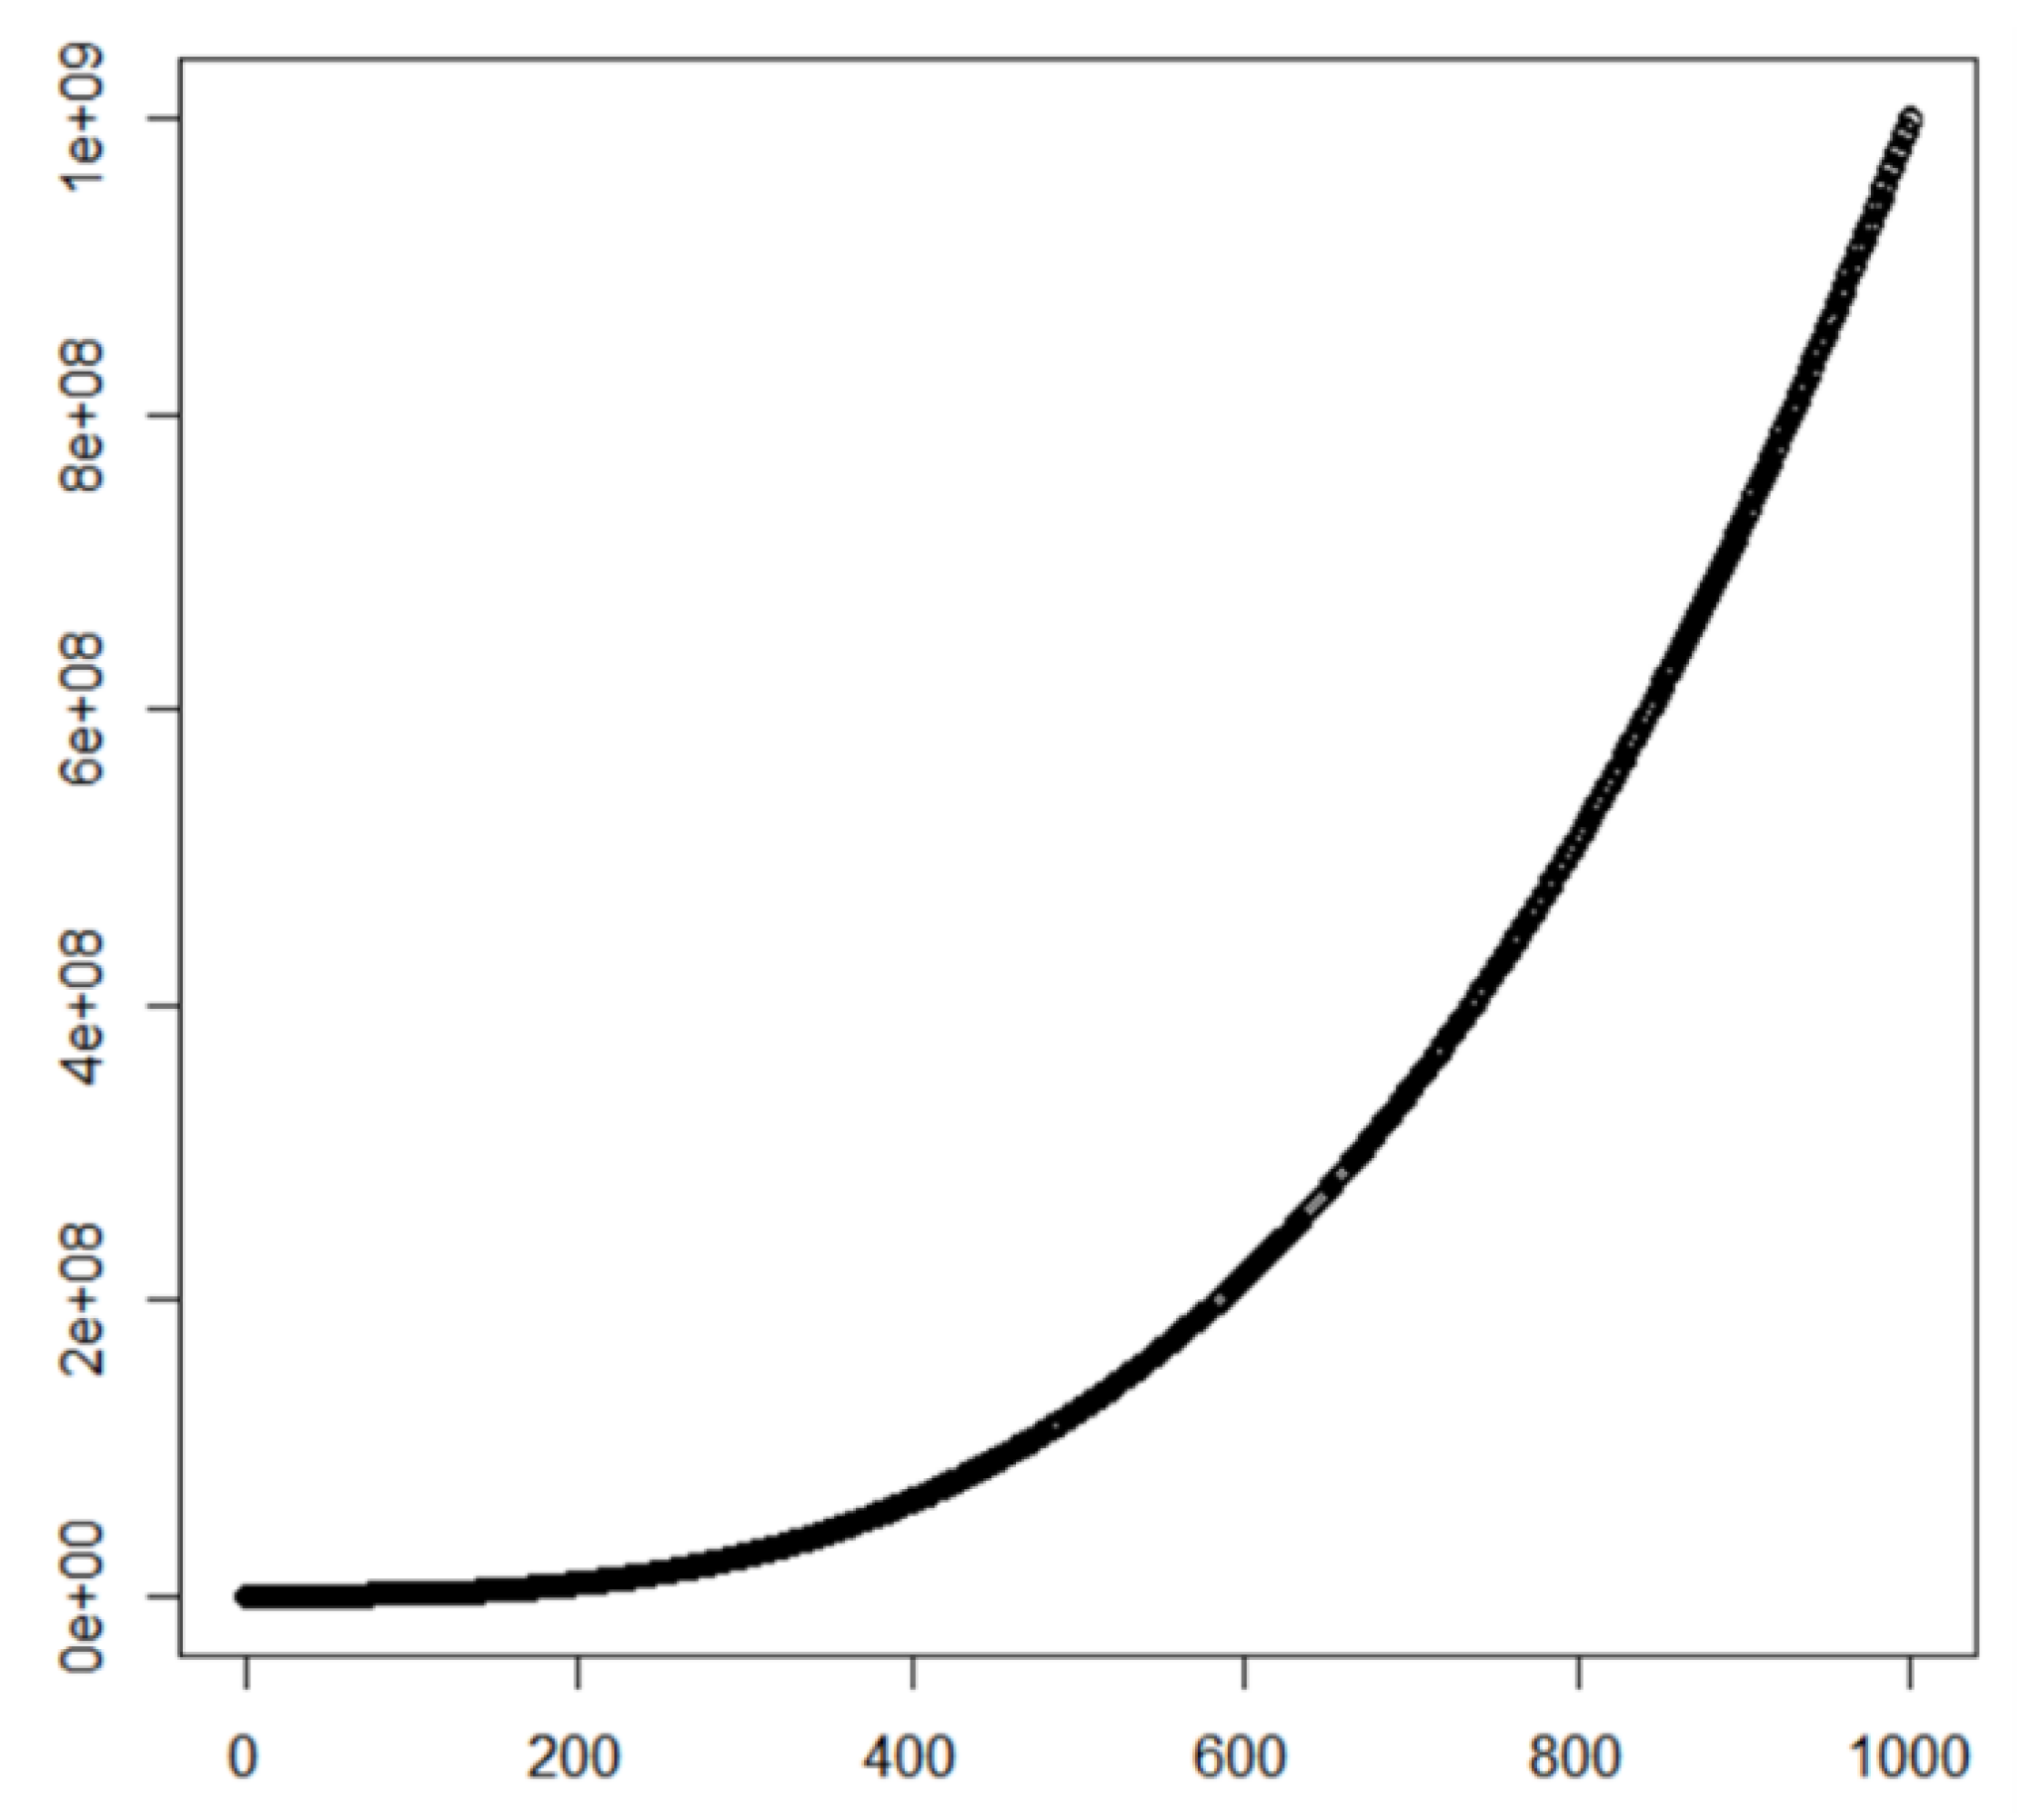
Figure 14 shows a graph of the worst case that could be generated when the greedy algorithm has been executed. The time complexity becomes n^2 in this case.
The X-axis means the number of nodes in the pertinent paper, and the Y-axis means the amount of calculation needed to schedule jobs in the pertinent paper. Figure 14 depicts this in a way that enables understanding intuitively. Since the Y-axis is expressed in exponential notation, it shows that there is a big difference from the optimal situation in Figure 13.
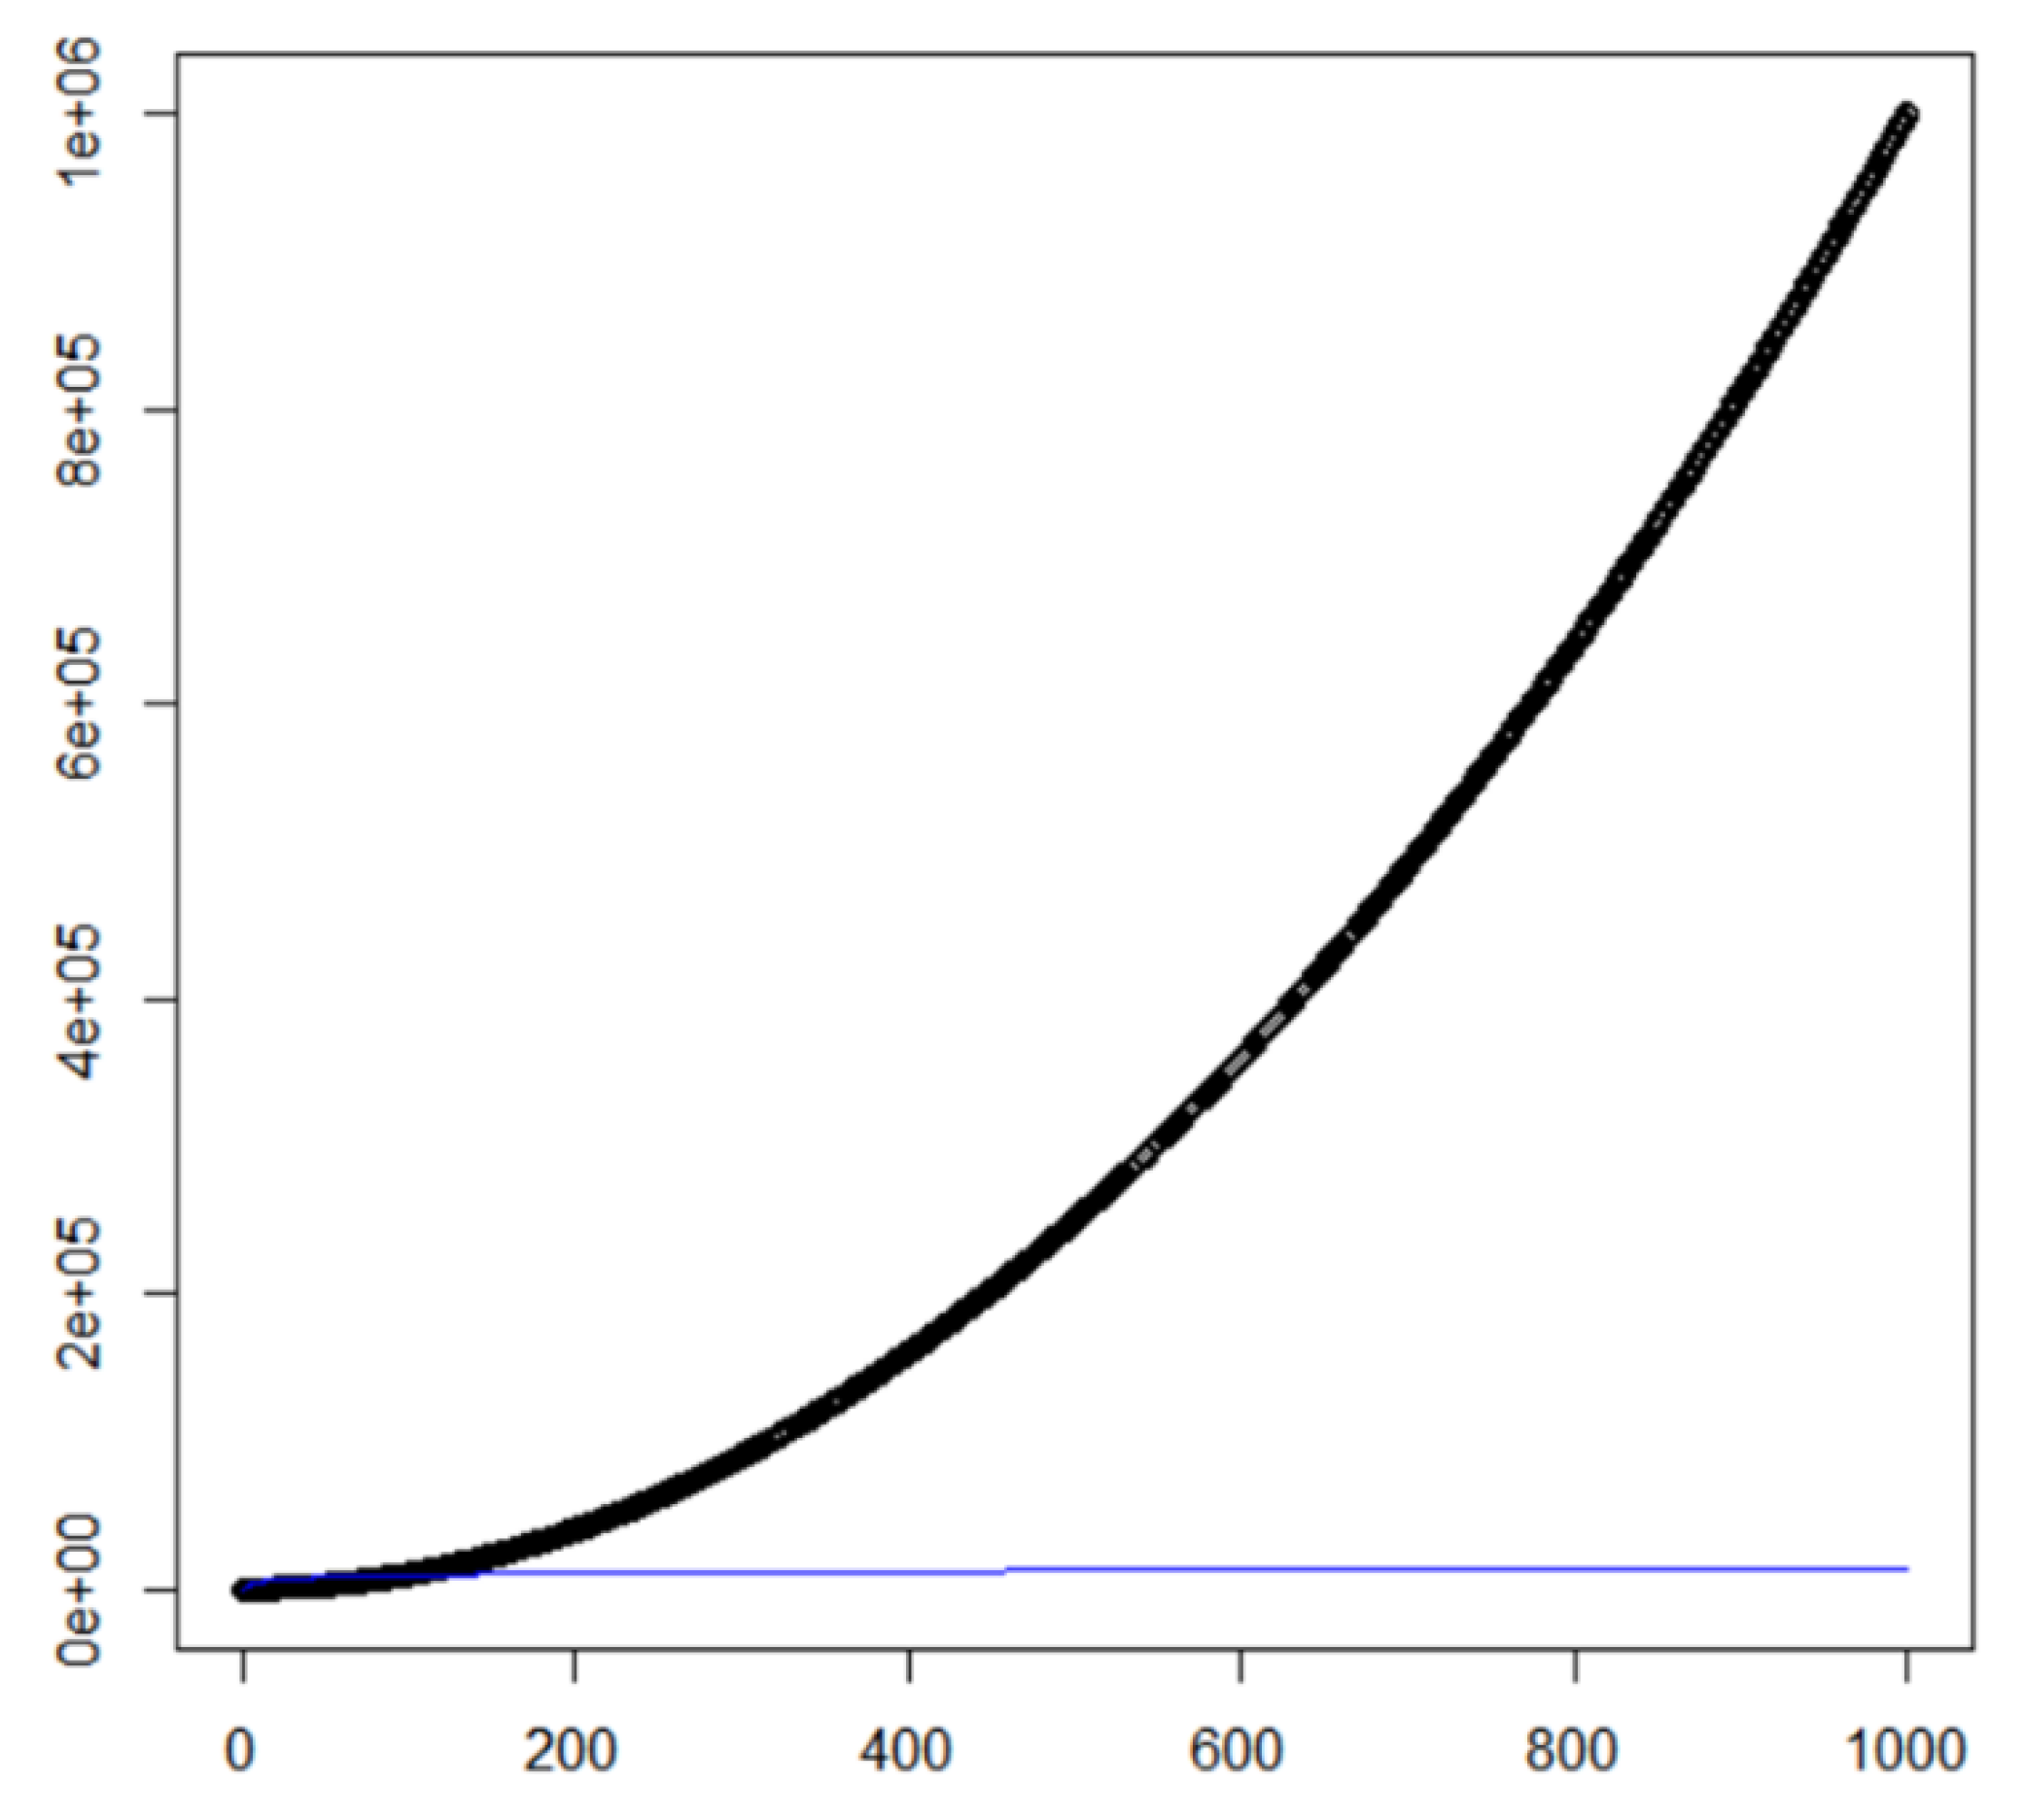
Figure 15 compares the best and worst situations. In the best case, the graph shows a distinct curve; in the worst case, however, an almost flat curve is close to the X-axis due to the difference between the scales of time complexity, clearly distinguishing it with the best case.
The X-axis means the number of nodes in the pertinent paper and the Y-axis means the amount of calculation needed to schedule jobs in the pertinent paper.
6. Dynamic Programming: Comparison between the Floyd–Warshall Algorithm and Greedy Algorithm
Dynamic programming is a method that divides the problem into small sub-problems to solve them individually. The respective solutions can be used later to streamline the calculation process when necessary. The Floyd–Warshall algorithm is an example of dynamic programming and is used for scheduling using the weight assigned to line E crossing peak point V. This method is used to find transitive closure in the graph, and it takes the following approach: First, assuming that an attempt is being made to cross from Node A to Node B, such approach is searched; the same approach will then be taken for the section from Node B to Node C and so on to find transitive closure. This method enables finding the best solution considering subsequent choices that have never been considered in the greedy algorithm. The best solution can always be found regardless of structures with this method, but it is not suitable for problems having many nodes due to its time complexity of n^3.
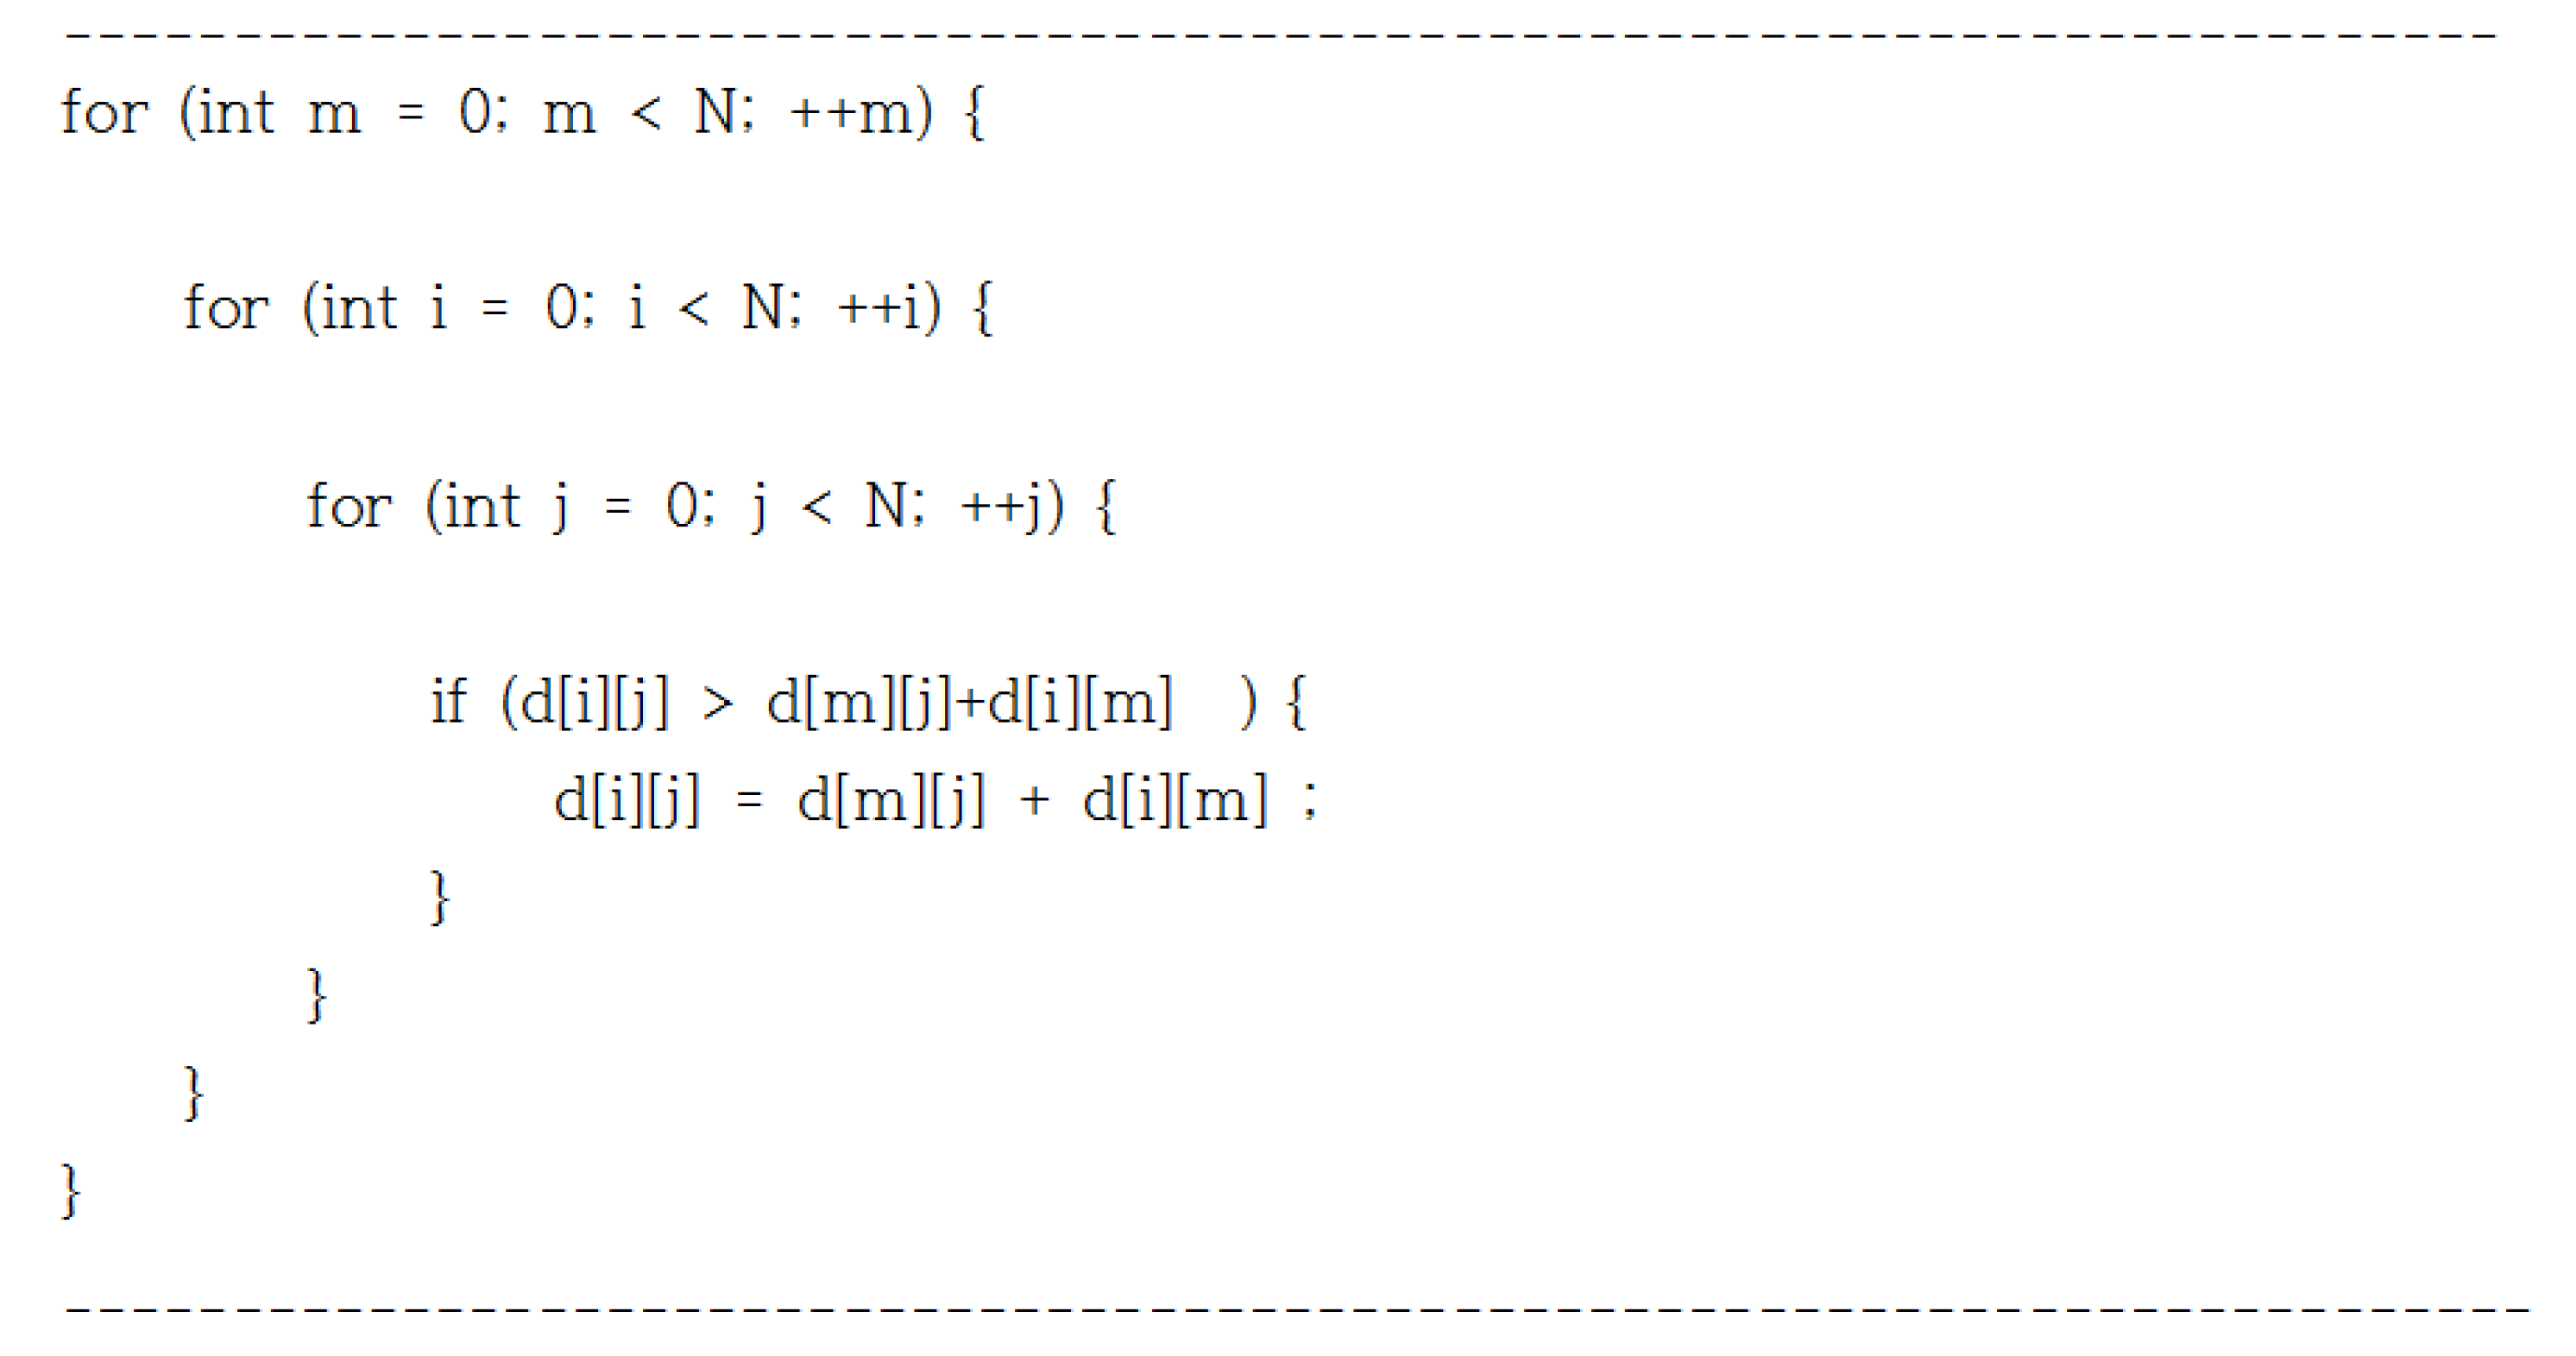
Although the Floyd–Warshall algorithm has the merit of being able to find an optimal solution at all times, it also has the demerit of requiring much more time when the number of tasks increases. Figure 16 shows the Floyd–Warshall algorithm with three sentences that include “for,” and its time complexity becomes N^3.
The objective of using the Floyd–Warshall algorithm is to find the shortest path for the [1,2,3…N] nodes to reach each other. The scenario in this study is about finding the case of the maximized the benefit when each node performs its task so that in a broad view, it coincides with the aim of the Floyd–Warshall algorithm. In this regard, it was possible to find the maximum-benefit scheduling methods for individual nodes for 3-unit times by implementing the Floyd–Warshall algorithm.
Table 3 shows the result of scheduling and runtime obtained by executing the source implemented based on the Floyd–Warshall algorithm (a dynamic programming). When the Floyd–Warshall algorithm was used, the runtimes were 0.002 s and 0.0005440 s when the clock function and the QueryPerformanceCounter function had been used, respectively.
The graphical representation is shown in Figure 17. The time complexity compared with the greedy algorithm is described in Figure 18. The blue line represents the time complexity (N^3) of the Floyd–Warshall algorithm and the largest increase following the increase in the number of tasks. This means that the more tasks there are, the larger the calculation workload. In contrast, the best greedy algorithm follows the N * log n graph, and the calculation workload decreases as the number of tasks increases; in the worst case, the workload can be much less than that of the Floyd–Warshall algorithm.
At this time, the X-axis indicates the number of nodes used in this study whereas the Y-axis shows the computation workload for scheduling the task described in this study. On such basis, it is much more efficient to perform calculation to improve the communication and energy efficiencies based on the optimal solution derived from the greedy algorithm when processing the information necessary for energy management on an IoT-new and renewable energy-integrated platform considering the large number of nodes involved and to respond rapidly to the practical demands of users.
The runtime of the greedy algorithm actually implemented does not exceed the runtime O(N^2) in the worst cases and the runtime measured with Query PerformanceCounter() when there were five node was 0.0004680. Whereas the measurement taken by the Floyd–Warshall algorithm under the same condition was 0.0005440. The time actually measured can vary depending on the factors such as the performance of hardware or the input sequence.
A software-oriented method of increasing efficiency by controlling the communication output based on the scheduling information is proposed in this study. OPNET was used to confirm the proportional relation between communication output and communication success rate and the optimal or approximate execution sequence was obtained with the two algorithms presented in the study based on the inputs such as the number of nodes, their deadlines and the expected benefits of successful performance within the deadlines, all of which were then used sequence the tasks to gain benefits and adjust the output of each node according to the execution sequence. Such a method was proposed to improve efficiency by reducing the possibility of communication errors.
7. Conclusions
This study has discussed some of the potential approaches to improving the efficiency of energy use with regard to new and renewable energies. The idea of using sodium-ion batteries for ESSs to address the demerits of these energies was proposed to improve their irregular production rate. To accomplish such goal, the communication efficiency and energy efficiency were examined by comparing the greedy algorithm and the Floyd–Warshall algorithm to determine which of them should be used for the improvement. Considering the physical (material) aspect of sodium-ion battery and the effective use of new and renewable energies, they need not be dealt with separately. Sodium-ion batteries allow all the charged energy to be discharged completely, so it is possible to construct an ESS with fewer batteries than lithium-ion batteries; thus enabling supplying its energy wherever necessary without wasting any energy due to its physical characteristics. Based on such improvement, more energy can be saved by improving battery consumption and communication efficiency through the organic control of signal outputs. The theoretical backgrounds for this study are introduced in previous studies associated with the method of improving network efficiency based on the game theory.
The communication failures mean that the energy cannot be supplied to where it is required and such a failure eventually leads to a fatal blow in the situation where the energy is being used to maintain the living environment of the aquatic lives. The contribution of the study is that it has presented a viable method of increasing the success rate of communications by adjusting the transmission output at the ESS according to the importance levels of communications; increasing the efficiency of energy use by applying a prioritized energy distribution system for the ESS scheduling; and proposing a solution which will be able to minimize the negative effects which could be generated from insufficient supply of energy based on the utilization of the chemical properties of Na-ion batteries.
This study proposes a method that can enhance present energy efficiency through software and hardware-oriented approaches. The software-oriented approach involves a scheme which improves the efficiency of energy use by determining the order of energy consumptions in a way that the benefits in energy use can be maximized and another scheme which increases the efficiency of energy use by controlling the communication output based on the benefits. As for the hardware-oriented approach, use of a Na-ion battery has been proposed. For the grounds for the software-oriented improvement, a significant proportional relation between success rates and communication outputs was proven by using OPNET whereas a comparison was made to understand how the runtime in relation to the Big-O notation of each algorithm had changed depending on the number of nodes. On this basis, it is possible to assume that the software-oriented improvement will lead to a significant improvement in energy efficiency. Also, the same can be achieved by using the ESS consisting of Na-ion batteries when operating the aquafarm. A comparative analysis between physical characteristics of Na-ion battery and Li-ion battery supports this assumption. However, although it is clear that both approaches will affect energy efficiency positively by creating a synergy effect, they have not been actually implemented in this study and the task of quantifying the results is planned for the future research.
The innate limits of irregular energy production of new and renewable energies can be overcome with ESS, including the problems associated with the distinct seasonal characteristics of ROK. The greedy algorithm can find an optimal solution only for the matroids, and only the approximate optimal solutions can be found for the others. In contrast, the Floyd–Warshall algorithm can always find an optimal solution. However, that the Zigbee-based network configuration in the 4th Industrial Revolution requires many Zigbee nodes to be used to bring out the best of the low-power, low-cost features of Zigbee when implementing an IoT. As the increase in the number of nodes leads to increased calculation workload, the greedy algorithm may show time complexity of N^2 in worst cases, whereas the Floyd–Warshall algorithm will show a time complexity of N^3. Again, the greedy algorithm guarantees the approximate optimal solution only for the matroids, but its relative efficiency in the calculation process is more suitable for the scheduling of massive and frequent communications between nodes than the other algorithms used to find an optimal solution. This is the main reason for the proposal made in this study.
Author Contributions
Conceptualization, S.-M.J.; Data curation, S.-M.J.; Formal analysis, S.-M.J. and J.-H.H.; Funding acquisition, S.-M.J. and J.-H.H.; Investigation, S.-M.J. and J.-H.H.; Methodology, S.-M.J. and J.-H.H.; Project administration, J.-H.H.; Resources, J.-H.H.; Software, S.-M.J. and J.-H.H.; Supervision, J.-H.H.; Validation, J.-H.H.; Visualization, J.-H.H.; Writing—original draft, S.-M.J. and J.-H.H.; Writing—review and editing, J.-H.H.
Funding
This work was supported by the National Research Foundation of Korea (NRF) grant funded by the Korea government (MSIT) (No. 2017R1C1B5077157).
Conflicts of Interest
The authors declare no conflict of interest.
References
- Bahramirad, S.; Reder, W.; Khodaei, A. Reliability-constrained optimal sizing of energy storage system in a microgrid. IEEE Trans. Smart Grid 2012, 3, 2056–2062. Available online: https://ieeexplore.ieee.org/document/6377246/ (accessed on 24 September 2018). [CrossRef]
- Ramakrishnan, K. Delay-Dependent Stability of Networked Generator-Excitation Control Systems: An LMI based Approach. IFAC 2016, 49, 431–436. [Google Scholar] [CrossRef]
- Lee, H.-G.; Huh, J.-H. A Cost-Effective Redundant Digital Excitation Control System and Test Bed Experiment for Safe Power Supply for Process Industry 4.0. Processes 2018, 6, 85. [Google Scholar] [CrossRef]
- Huh, J.-H. Design and android application for monitoring system using PLC for ICT-Integrated Fish Farm. Advanced Multimedia and Ubiquitous Engineering. In Advanced Multimedia and Ubiquitous Engineering: FutureTech & MUE; Springer: Berlin, Germany, 2016; pp. 617–625. [Google Scholar]
- Huh, J.-H. PLC-based design of monitoring system for ICT-integrated vertical fish farm. Hum.-Centric Comput. Inf. Sci. 2017, 7, 1–19. [Google Scholar] [CrossRef]
- Liu, Z.; Yao, W.; Wen, J. Enhancement of Power System Stability Using a Novel Power System Stabilizer with Large Critical Gain. Energies 2017, 10, 449. [Google Scholar] [CrossRef]
- Schimpe, M.; Piesch, C.; Hesse, H.C.; Paß, J.; Ritter, S.; Jossen, A. Power Flow Distribution Strategy for Improved Power Electronics Energy Efficiency in Battery Storage Systems: Development and Implementation in a Utility-Scale System. Energies 2018, 11, 533. [Google Scholar] [CrossRef]
- Liu, J.; Miura, Y.; Bevrani, H.; Ise, T. Enhanced Virtual Synchronous Generator Control for Parallel Inverters in Microgrids. IEEE Trans. Smart Grid 2107, 8, 2268–2277. Available online: https://ieeexplore.ieee.org/abstract/document/7401122/ (accessed on 24 September 2018). [CrossRef]
- Yang, L.; Wang, J.; Ma, Y.; Wang, J.; Zhang, X.; Tolbert, L.M.; Wang, F.; Tomsovic, K. Three-Phase Power Converter-based Real-Time Synchronous Generator Emulation. IEEE Trans. Smart Grid 2107, 32, 1651–1665. Available online: https://ieeexplore.ieee.org/abstract/document/7451263/ (accessed on 24 September 2018). [CrossRef]
- Wei, Z.; Meng, S.; Xiong, B.; Ji, D.; Tseng, K.J. Enhanced online model identification and state of charge estimation for lithium-ion battery with a FBCRLS based observer. Appl. Energy 2016, 181, 332–341. [Google Scholar] [CrossRef]
- Wei, Z.; Zhao, J.; Ji, D.; Tseng, K.J. A multi-timescale estimator for battery state of charge and capacity dual estimation based on an online identified model. Appl. Energy 2017, 204, 1264–1274. [Google Scholar] [CrossRef]
- Wei, Z.; Tseng, K.J.; Wai, N.; Lim, T.M.; Skyllas-Kazacos, M. Adaptive estimation of state of charge and capacity with online identified battery model for vanadium redox flow battery. J. Power Sources 2016, 332, 389–398. [Google Scholar] [CrossRef]
- Jing, S.; Tang, Y.; Xia, Y.; Ren, L.; Li, J. SMES Based Excitation System for Doubly-Fed Induction Generator in Wind Power Application. IEEE Trans. Appl. Supercond. 2011, 21, 1105–1108. Available online: https://ieeexplore.ieee.org/abstract/document/5715903/ (accessed on 24 September 2018).
- Livieratos, S.; Vogiatzaki, V.-E.; Cottis, P.G. A Generic Framework for the evaluation of the benefits expected from the smart grid. Energies 2013, 6, 988–1008. [Google Scholar] [CrossRef]
- Olivares, D.E.; Cañizares, C.A.; Kazerani, M. A centralized optimal energy management system for microgrids. In Proceedings of the 2011 IEEE Power and Energy Society General Meeting, Detroit, MI, USA, 24–28 July 2011; Available online: http://citeseerx.ist.psu.edu/viewdoc/download?doi=10.1.1.204.8316&rep=rep1&type=pdf (accessed on 24 September 2018).
- Chen, C.; Duan, S.; Cai, T.; Liu, B.; Hu, G. Smart energy management system for optimal microgrid economic operation. IET Renew. Power Gener. 2011, 5, 258–267. Available online: http://digital-library.theiet.org/content/journals/10.1049/iet-rpg.2010.0052 (accessed on 24 September 2018). [CrossRef]
- Palizban, O.; Kauhaniemi, K.; Guerrero, J.M. Microgrids in active network management—Part I: Hierarchical control, energy storage, virtual power plants, and market participation. Renew. Sustain. Energy Rev. 2014, 36, 428–439. [Google Scholar] [CrossRef] [Green Version]
- Chen, C.; Duan, S.; Cai, T.; Liu, B.; Hu, G. Optimal allocation and economic analysis of energy storage system in microgrids. IEEE Trans. Power Electron. 2011, 26, 2762–2773. Available online: https://ieeexplore.ieee.org/abstract/document/5715890/ (accessed on 24 September 2018). [CrossRef]
- Einan, M.; Torkaman, H.; Pourgholi, M. Optimized Fuzzy-Cuckoo Controller for Active Power Control of Battery Energy Storage System, Photovoltaic, Fuel Cell and Wind Turbine in an Isolated Micro-Grid. Batteries 2017, 3, 23. [Google Scholar] [CrossRef]
- Pilz, M.; Al-Fagih, L.; Pfluegel, E. Energy Storage Scheduling with an Advanced Battery Model: A Game–Theoretic Approach. Inventions 2017, 2, 30. [Google Scholar] [CrossRef]
- Kulish, V.V.; Koch, D.; Manzhos, S. Insertion of Mono- vs. Bi- vs. Trivalent Atoms in Prospective Active Electrode Materials for Electrochemical Batteries: An ab Initio Perspective. Energies 2017, 10, 2061. [Google Scholar] [CrossRef]
- Peters, J.F.; Weil, M. A Critical Assessment of the Resource Depletion Potential of Current and Future Lithium-Ion Batteries. Resources 2016, 5, 46. [Google Scholar] [CrossRef]
- Zidan, A.; Gabbar, H.A. DG Mix and Energy Storage Units for Optimal Planning of Self-Sufficient Micro Energy Grids. Energies 2016, 9, 616. [Google Scholar] [CrossRef]
- Tang, X.; Hu, X.; Li, N.; Deng, W.; Zhang, G. A novel frequency and voltage control method for islanded microgrid based on multienergy storages. IEEE Trans. Smart Grid 2016, 7, 410–419. Available online: https://ieeexplore.ieee.org/abstract/document/6999960/ (accessed on 24 September 2018). [CrossRef]
- Kim, S.-K.; Huh, J.-H. A Study on the Improvement of Smart Grid Security Performance and Blockchain Smart Grid Perspective. Energies 2018, 11, 1973. [Google Scholar] [CrossRef]
- Olivares, D.E.; Mehrizi-Sani, A.; Etemadi, A.H.; Cañizares, C.A.; Iravani, R.; Kazerani, M.; Hajimiragha, A.H.; Gomis-Bellmunt, O.; Saeedifard, M.; Palma-Behnke, R.; et al. Trends in microgrid control. IEEE Trans. Smart Grid 2014, 5, 1905–1919. Available online: https://ieeexplore.ieee.org/abstract/document/6818494/ (accessed on 24 September 2018). [CrossRef]
- Vosoughi, S.; Roy, D.; Aral, S. The spread of true and false news online. Science 2018, 359, 1146–1151. Available online: http://science.sciencemag.org/content/359/6380/1146 (accessed on 24 September 2018). [CrossRef] [PubMed] [Green Version]
- Jordan, M.I.; Mitchell, T.M. Machine learning: Trends, perspectives, and prospects. Science 2015, 263, 255–260. Available online: http://science.sciencemag.org/content/349/6245/255 (accessed on 24 September 2018). [CrossRef]
- Le Cun, Y.; Bengio, Y.; Hinton, G. Deep learning. Nature 2015, 521, 436–444. Available online: https://www.nature.com/articles/nature14539 (accessed on 24 September 2018). [CrossRef]
- Huh, J.-H. Big Data Analysis for Personalized Health Activities: Machine Learning Processing for Automatic Keyword Extraction Approach. Symmetry 2018, 10, 93. [Google Scholar] [CrossRef]
- Ming, M.; Wang, R.; Zha, Y.; Zhang, T. Multi-Objective Optimization of Hybrid Renewable Energy System Using an Enhanced Multi-Objective Evolutionary Algorithm. Energies 2017, 10, 674. [Google Scholar] [CrossRef]
- Marchi, B.; Zanoni, S.; Pasetti, M. A techno-economic analysis of Li-ion battery energy storage systems in support of PV distributed generation. In Proceedings of the XXI Summer School Francesco Turco, Naples, Italy, 13–15 September 2016; pp. 13–15. Available online: https://www.researchgate.net/profile/Marco_Pasetti/publication/311949095_A_techno-economic_analysis_of_Li-ion_battery_energy_storage_systems_in_support_of_PV_distributed_generation/links/5864f22b08ae6eb871adad66/A-techno-economic-analysis-of-Li-ion-battery-energy-storage-systems-in-support-of-PV-distributed-generation.pdf (accessed on 22 November 2018).
- Pasetti, M.; Rinaldi, S.; Manerba, D. A Virtual Power Plant Architecture for the Demand-Side Management of Smart Prosumers. Appl. Sci. 2018, 8, 432. [Google Scholar] [CrossRef]
- Rinaldi, S.; Pasetti, M.; Flammini, A.; De Simone, F. Characterization of Energy Storage Sytems for Renewable Generators: An Experimental Testbed. In Proceedings of the 2018 IEEE 9th International Workshop on Applied Measurements for Power Systems (AMPS), Bologna, Italy, 26–28 September 2018; pp. 1–6. Available online: https://ieeexplore.ieee.org/abstract/document/8494878 (accessed on 22 November 2018).
- Marchi, B.; Pasetti, M.; Zanoni, S. Life cycle cost analysis for BESS optimal sizing. Energy Procedia 2017, 113, 127–134. Available online: https://www.sciencedirect.com/science/article/pii/S1876610217321574 (accessed on 22 November 2018). [CrossRef]
- Han, X.; Chen, F.; Cui, X.; Li, Y.; Li, X. A Power Smoothing Control Strategy and Optimized Allocation of Battery Capacity Based on Hybrid Storage Energy Technology. Energies 2012, 5, 1593–1612. [Google Scholar] [CrossRef] [Green Version]
- Berube, G.R.; Hajagos, L.M.; Beaulieu, R.E. A Utility Perspective on Under-Excitation Limiters. IEEE Trans. Energy Convers. 1995, 10, 532–537. Available online: https://kestrelpower.com/Docs/UELPAPER_R4.pdf (accessed on 24 September 2018). [CrossRef]
- Freitas, W.; Vieira, J.C.; Morelato, A.; Xu, W. Influence of Excitation System Control Modes on the Allowable Penetration Level of Distributed Synchronous Generators. IEEE Trans. Energy Convers. 2005, 20, 474–480. Available online: https://ieeexplore.ieee.org/abstract/document/1432863/ (accessed on 24 September 2018). [CrossRef]
- Hurley, J.D.; Bize, L.N.; Mummert, C.R. The Adverse Effects of Excitation System Var and Power Factor Coontrollers. IEEE Trans. Energy Convers. 1999, 14, 1636–1645. Available online: https://ieeexplore.ieee.org/abstract/document/815117/ (accessed on 24 September 2018). [CrossRef]
Figure 1.
Fluctuations in Signal–Noise Ratio according to the changes in Transmitted Power. (X axis: Time, Y axis: Signal–Noise Ratio and Received Power).
Figure 1.
Fluctuations in Signal–Noise Ratio according to the changes in Transmitted Power. (X axis: Time, Y axis: Signal–Noise Ratio and Received Power).

Figure 2.
Fluctuations in Received Power according to the changes in Transmitted Power. (X axis: Time, Y axis: Transmitted power).
Figure 2.
Fluctuations in Received Power according to the changes in Transmitted Power. (X axis: Time, Y axis: Transmitted power).

Figure 3.
Fluctuations in Received Power for the first Value Group. (X axis: Time, Y axis: Received power).
Figure 3.
Fluctuations in Received Power for the first Value Group. (X axis: Time, Y axis: Received power).

Figure 4.
Fluctuations in Received Power for the second Value Group. (X axis: Time, Y axis: Received power).
Figure 4.
Fluctuations in Received Power for the second Value Group. (X axis: Time, Y axis: Received power).

Figure 5.
The Blue Line (all the transmission power outputs were set at 0.05).

Figure 6.
The Red Line (all the transmission power outputs were set at 0.1).

Figure 7.
Improvement of Energy Efficiency (1). (X axis: Time, Y axis: Energy efficiency).

Figure 8.
Improvement of Energy Efficiency (2). (X axis: Time, Y axis: Energy efficiency).

Figure 9.
Representation of Zigbee-based communication as an Extensive-form Game.

Figure 10.
Representation of Zigbee-based communication as a Normal-form Game and Expression of an Elliptic part by the Nash Equilibrium solution.
Figure 10.
Representation of Zigbee-based communication as a Normal-form Game and Expression of an Elliptic part by the Nash Equilibrium solution.

Figure 11.
Test Bed Scenario Setup.

Figure 12.
All the Nodes being Connected in the Network.

Figure 13.
Greedy algorithm: Best’ graph using R Studio. (X axis: Number of nodes, Y axis: Amount of calculation).
Figure 13.
Greedy algorithm: Best’ graph using R Studio. (X axis: Number of nodes, Y axis: Amount of calculation).

Figure 14.
Greedy algorithm: Worst’ graph Using R Studio. (X axis: Number of nodes, Y axis: Amount of calculation).
Figure 14.
Greedy algorithm: Worst’ graph Using R Studio. (X axis: Number of nodes, Y axis: Amount of calculation).

Figure 15.
Comparison of ‘Greedy algorithm: Best/Worst’ Using R Studio. (X axis: Number of nodes, Y axis: Amount of calculation).
Figure 15.
Comparison of ‘Greedy algorithm: Best/Worst’ Using R Studio. (X axis: Number of nodes, Y axis: Amount of calculation).

Figure 16.
Floyd–Warshall algorithm.

Figure 17.
Time complexity of the Floyd–Warshall algorithm using R Studio. (X axis: Number of nodes, Y axis: Amount of calculation).
Figure 17.
Time complexity of the Floyd–Warshall algorithm using R Studio. (X axis: Number of nodes, Y axis: Amount of calculation).

Figure 18.
Comparison of time complexities between the Greedy algorithm and the Floyd–Warshall algorithm using R Studio. (X axis: Number of nodes, Y axis: Amount of calculation).
Figure 18.
Comparison of time complexities between the Greedy algorithm and the Floyd–Warshall algorithm using R Studio. (X axis: Number of nodes, Y axis: Amount of calculation).


Table 1.
Organization of Zigbee Nodes and Mechanism.
 |
Table 2.
Execution Result. (The result of scheduling task using a greedy algorithm and the runtime).
Table 2.
Execution Result. (The result of scheduling task using a greedy algorithm and the runtime).
| Input 1: Number of Scheduling jobs | 5 | ||
| Input 2: Number of Scheduling Unit Time | 3 | ||
| ID | Deadline | Bonus | |
| Task 1 | A | 2 | 100 |
| Task 2 | B | 1 | 19 |
| Task 3 | C | 2 | 27 |
| Task 4 | D | 1 | 2 |
| Task 5 | E | 3 | 15 |
| TotalBonus | 134 | ||
| Scheduling | B – A – E | ||
| QueryPerformanceCounter() | 0.0004680 (Second) | ||
| Clock() | 0.0010000 (Second) | ||
Table 3.
The Result of Scheduling and Runtime Obtained by Executing the Source Implemented based on the Floy-Warshall algorithm (a Dynamic Programming).
Table 3.
The Result of Scheduling and Runtime Obtained by Executing the Source Implemented based on the Floy-Warshall algorithm (a Dynamic Programming).
| Number of Scheduling jobs | 5 | ||
| Number of Scheduling Unit Time | 3 | ||
| ID | Deadline | Bonus | |
| Task 1 | A | 2 | 100 |
| Task 2 | B | 1 | 19 |
| Task 3 | C | 2 | 27 |
| Task 4 | D | 1 | 2 |
| Task 5 | E | 3 | 15 |
| Total Bonus | 146 | ||
| Scheduling | B – A – C | ||
| QueryPerformanceCounter() | 0.0005440 (Second) | ||
| Clock() | 0.0020000 (Second) | ||
© 2018 by the authors. Licensee MDPI, Basel, Switzerland. This article is an open access article distributed under the terms and conditions of the Creative Commons Attribution (CC BY) license (http://creativecommons.org/licenses/by/4.0/).
Share and Cite
MDPI and ACS Style
Je, S.-M.; Huh, J.-H. An Optimized Algorithm and Test Bed for Improvement of Efficiency of ESS and Energy Use. Electronics 2018, 7, 388. https://doi.org/10.3390/electronics7120388
AMA Style
Je S-M, Huh J-H. An Optimized Algorithm and Test Bed for Improvement of Efficiency of ESS and Energy Use. Electronics. 2018; 7(12):388. https://doi.org/10.3390/electronics7120388
Chicago/Turabian StyleJe, Seung-Mo, and Jun-Ho Huh. 2018. "An Optimized Algorithm and Test Bed for Improvement of Efficiency of ESS and Energy Use" Electronics 7, no. 12: 388. https://doi.org/10.3390/electronics7120388
Note that from the first issue of 2016, this journal uses article numbers instead of page numbers. See further details here.