Electrochemical Sensor-Based Devices for Assessing Bioactive Compounds in Olive Oils: A Brief Review


 ,
,  and
and 
Abstract
1. Introduction
- (i)
- (ii)
- Monitoring the quality and oxidative resistance of olive oils during storage [76,77], as well as the evaluation of their shelf life [78,79], which is of utmost importance for olive oil producers and consumers, allowing to include a possible “best consume until” information on the label, guaranteeing the olive oil quality during that time-period.
- (iii)
- Detecting olive oil adulterations with other vegetable oils or with low-quality olive oils. The detection of olive oil adulteration is still a challenge due to the diverse composition of cultivars and the drawbacks of existing detection methods [80,81]. The use of E-noses or E-tongues, for olive oil sensory evaluation or olive oil discrimination according to the olive cultivar or geographical origin, olive oil quality and authenticity has been recently reviewed [63,64]. In this context, E-noses [82,83,84] as well as voltammetric [85,86] and potentiometric [87] E-tongues approaches have been developed.
- (iv)
- Classifying the quality commercial grade of table olives considering the intensity of the sensory defect predominantly perceived (DPP), to quantify the DPP intensity as well as to evaluate table olives’ positive gustatory notes (acid, bitter and salty sensations) using a potentiometric E-tongue [88,89,90].
- (v)
2. Electrochemical Sensors
2.1. Electrochemical Apparatus
2.1.1. Electronic Tongue
2.1.2. E-nose
2.2. Electrochemical Principles
2.2.1. Potentiometric Sensors
2.2.2. Voltammetric Sensors
Cyclic Voltammetry
Square Wave Voltammetry
Differential Pulse Voltammetry
2.3. Data Processing–Chemometric Methods
3. Bioactive Compounds of VOO
3.1. Phenolic Compounds of VOO
3.2. Other Bioactive Compounds of VOO
4. Electrochemical Evaluation of Olive Oils Bioactive Compounds: Applications
5. Conclusions, Future Trends, and Perspectives
Author Contributions
Funding
Conflicts of Interest
References
- Soler-Rivas, C.; Epsin, J.C.; Wichers, H.J. Oleuropein and related compounds. J. Sci. Food Agric. 2000, 80, 1013–1023. [Google Scholar] [CrossRef]
- Knoops, K.T.; de Groot, L.C.; Kromhout, D. Mediteranean diet, lifestyle factors, and 10-year mortality in elderly European men and women. J. Am. Med. Assoc. 2004, 292, 1433–1439. [Google Scholar] [CrossRef] [PubMed]
- Trichopoulou, A.; Costacou, T.; Bamia, C.; Trichopoulos, D. Adherence to a mediterranean diet and survival in a Greek population. N. Engl. J. Med. 2003, 348, 2599–2608. [Google Scholar] [CrossRef] [PubMed]
- Giovannini, C.; Masella, R. Role of polyphenols in cell death control. Nutr. Neurosci. 2012, 15, 134–149. [Google Scholar] [CrossRef] [PubMed]
- Iriti, M.; Vitalini, S. Health-promoting effects of traditional Mediterranean diets—A review. Pol. J. Food Nutr. Sci. 2012, 62, 71–76. [Google Scholar] [CrossRef]
- Quiles, J.L.; Ramírez-Tortosa, M.C.; Yaqoob, P. (Eds.) Olive Oil and Health; CABI Publishing: Cambridge, MA, USA, 2006. [Google Scholar]
- Papadopoulos, G.; Boskou, D. Antioxidant effect of natural phenols on olive oil. J. Am. Oil Chem. Soc. 1991, 68, 669–671. [Google Scholar] [CrossRef]
- Visioli, F.; Bernardini, E. Extra virgin olive oil’s polyphenols: Biological activities. Curr. Pharm. Des. 2011, 17, 786–804. [Google Scholar] [CrossRef]
- Cheynier, V.; Sarni-Manchado, P.; Quideau, S. Extra-Virgin Olive Oil—Healthful Properties of Its Phenolic Constituents. In Recent Advances in Polyphenol Research; John Wiley & Sons, Ltd.: Hoboken, NJ, USA, 2012; Volume 3. [Google Scholar] [CrossRef]
- Carrasco-Pancorbo, A.; Cerretani, L.; Bendini, A.; Segura-Carretero, A.; Gallina-Toschi, T.; Fernández-Gutiérrez, A. Analytical determination of polyphenols in olive oils. J. Sep. Sci. 2005, 28, 837–858. [Google Scholar] [CrossRef]
- CODEX STAN 33-1981 in Codex Alimentarius. Available online: http://static.oliveoiltimes.com/library/codex-alimentarius-olive-oil-standard.pdfS (accessed on 20 September 2018).
- Hardin-Fanning, F. The effects of a Mediterranean-style dietary pattern on cardiovascular disease risk. Nurs. Clin. N. Am. 2008, 43, 105–115. [Google Scholar] [CrossRef]
- Ryan, D.; Robards, K. Phenolic compounds in olives. Analyst 1998, 123, 31–44. [Google Scholar] [CrossRef]
- Cicerale, S.; Lucas, L.; Keast, R. Biological Activities of Phenolic Compounds Present in Virgin Olive Oil. Int. J. Mol. Sci. 2010, 11, 458–479. [Google Scholar] [CrossRef] [PubMed]
- Arranz, S.; Silvan, J.M.; Saura-Calixto, F. Nonextractable polyphenols, usually ignored, are the major part of dietary polyphenols: A study on the Spanish diet. Mol. Nutr. Food Res. 2010, 54, 1646–1658. [Google Scholar] [CrossRef] [PubMed]
- Servili, M.; Montedoro, G.F. Contribution of phenolic compounds to virgin olive oil quality. Eur. J. Lipid Sci. Technol. 2002, 104, 602–613. [Google Scholar] [CrossRef]
- Gallina-Toschi, T.; Cerretani, L.; Bendini, A.; Bonoli-Carbognin, M.; Lercker, G. Oxidative stability and phenolic content of virgin olive oil: An analytical approach by traditional and high resolution techniques. J. Sep. Sci. 2005, 28, 859–870. [Google Scholar] [CrossRef] [PubMed]
- Landete, J.M. Dietary intake of natural antioxidants: Vitamins and polyphenols. Crit. Rev. Food Sci. Nutr. 2013, 53, 706–721. [Google Scholar] [CrossRef] [PubMed]
- Radtke, J.; Linseisen, J.; Wolfram, G. Phenols urezufuhr Erwachsener in einem bayerischen Teilkollektiv der Nationalen Verzehrsstudie. Phenolic acid intake of adults in a Bavarian subgroup of the national food consumption survey. Z. Ernahrungswiss. 1998, 37, 190–197. [Google Scholar]
- Romero, C.; Medina, E.; Vargas, J.; Brenes, M.; De Castro, A. In vitro activity of olive oil polyphenols against Helicobacter pylori. J. Agric. Food Chem. 2007, 55, 680–686. [Google Scholar] [CrossRef] [PubMed]
- Fini, L.; Hotchkiss, E.; Fogliano, V.; Graziani, G.; Romano, M.; De Vol, E.B.; Qin, H.; Selgrad, M.; Boland, C.R.; Ricciardiello, L. Chemopreventive properties of pinoresinol-rich olive oil involve a selective activation of the ATM-p53 cascade in colon cancer cell lines. Carcinogenesis 2008, 29, 139–146. [Google Scholar] [CrossRef]
- Dell’Agli, M.; Fagnani, R.; Galli, G.V.; Maschi, O.; Gilardi, F.; Bellosta, S.; Crestani, M.; Bosisio, E.; De Fabiani, E.; Caruso, D. Olive oil phenols modulate the expression of metalloproteinase 9 in THP-1 cells by acting on nuclear factor-kB signaling. J. Agric. Food Chem. 2010, 58, 2246–2252. [Google Scholar] [CrossRef]
- Khanal, P.; Oh, W.K.; Yun, H.J.; Namgoong, G.M.; Ahn, S.G.; Kwon, S.M.; Choi, H.K.; Choi, H.S. p-HPEA-EDA, a phenolic compound of virgin olive oil, activates AMP-activated protein kinase to inhibit carcinogenesis. Carcinogenesis 2011, 32, 545–553. [Google Scholar] [CrossRef]
- Sangiovanni, E.; Colombo, E.; Fumagalli, M.; Abbiati, F.; Caruso, D.; Dell’agli, M. Inhibition of NF- kB activity by minor polar components of extra-virgin olive oil at gastric level. Phytother. Res. 2012, 26, 1569–1571. [Google Scholar] [CrossRef] [PubMed]
- Vekiari, S.A.; Koutsaftakis, A. The effect of different processing stages of olive fruit on the extracted olive oil polyphenol content. Grasas y Aceites 2002, 53, 304–308. [Google Scholar] [CrossRef]
- Temime, S.B.; Wael, T.; Bechir, B.; Leila, A.; Douja, A.; Mokhtar, Z. Changes in olive oil quality of Chetoui variety according to origin of plantation. J. Food Lipids 2006, 13, 88–99. [Google Scholar] [CrossRef]
- Tura, D.; Failla, O.; Bassi, D.; Pedo, S.; Serraiocco, A. Cultivar influence on virgin olive (Olea europaea L.) oil flavor based on aromatic compounds and sensorial profile. Sci. Hortic. 2008, 118, 139–148. [Google Scholar] [CrossRef]
- Tura, D.; Gigliotti, C.; Pedo, S.; Failla, O. Influence of cultivar and site of cultivation on levels of lipophilic and hydrophilic antioxidants in virgin olive oils (Olea europaea L.) and correlations with oxidative stability. Sci. Hortic. 2007, 112, 108–119. [Google Scholar] [CrossRef]
- Rotondi, A.; Alfei, B.; Magli, M.; Pannelli, G. Influence of genetic matrix and crop year on chemical and sensory profiles of Italian monovarietal extra-virgin olive oils. J. Sci. Food Agric. 2010, 90, 2641–2648. [Google Scholar] [CrossRef] [PubMed]
- Dabbou, S.; Dabbou, S.; Selvaggini, R.; Urbani, S.; Taticchi, A.; Servili, M.; Hammami, M. Comparison of the chemical composition and the organoleptic profile of virgin olive oil from two wild and two cultivated Tunisian Olea Europaea. Chem. Biodiv. 2011, 8, 191–202. [Google Scholar] [CrossRef] [PubMed]
- El Riachy, M.; Priego-Capote, F.; Leon, L.; Rallo, L.; de Castro, M.D.L. Hydrophilic antioxidants of virgin olive oil. Part 2: Biosynthesis and biotransformation of phenolic compounds in virgin olive oil as affected by agronomic and processing factors. Eur. J. Lipid Sci. Technol. 2011, 113, 692–707. [Google Scholar] [CrossRef]
- Motilva, M.J.; Romero, M.P.; Alegre, S.; Girona, J. Effect of regulated deficit irrigation in olive oil production and quality. Acta Hortic. 1999, 474, 377–380. [Google Scholar] [CrossRef]
- Motilva, M.J.; Tovar, J.M.; Romero, P.M.; Alegre, S.; Girona, J. Influence of regulated deficit irrigation strategies applied to olive trees (Arbequina cultivar) on oil yield and oil composition during the fruit ripening period. J. Sci. Food Agric. 2000, 80, 2037–2043. [Google Scholar] [CrossRef]
- Tovar, M.J.; Motilva, M.J.; Romero, M.P. Changes in the phenolic composition of virgin olive oil from young trees (Olea europaea L. cv. Arbequina) grown under linear irrigation strategies. J. Agric. Food Chem. 2011, 49, 5502–5508. [Google Scholar] [CrossRef]
- Patumi, M.; d’Andria, R.; Marsilio, G.; Fontanazza, G. Olive and olive oil quality after intensive monocone olive growing (Olea europaea L., cv. Kalamata) in different irrigation regimes. Food Chem. 2002, 77, 27–34. [Google Scholar] [CrossRef]
- Gomez-Rico, A.; Salvador, M.D.; Moriana, A.; Perez, D. Influence of different irrigation strategies in a traditional Cornicabra cv. olive orchard on virgin olive oil composition and quality. Food Chem. 2007, 100, 568–578. [Google Scholar] [CrossRef]
- Ahmed, C.B.; Rouina, B.B.; Sensoy, S.; Boukhriss, M. Saline water effects on fruit development, quality and phenolic composition of virgin olive oils cv. Chemlali. J. Agric. Food Chem. 2009, 57, 2803–2811. [Google Scholar] [CrossRef] [PubMed]
- Stefanoudaki, E.; Williams, M.; Chartzoulakis, K.; Harwood, J. Effect of irrigation on quality attributes of olive oil. J. Agric. Food Chem. 2009, 57, 7048–7055. [Google Scholar] [CrossRef] [PubMed]
- Bucelli, P.; Costantini, E.A.C.; Barbetti, R.; Franchini, E. Soil water availability in rain fed cultivation affects more than cultivar some nutraceutical components and the sensory profile of virgin olive oil. J. Agric. Food Chem. 2011, 59, 8304–8313. [Google Scholar] [CrossRef] [PubMed]
- Gomez-Caravaca, A.M.; Cerretani, L.; Bendini, A.; Segura-Carretero, A.; Fernandez-Gutierrez, A.; Del Carlo, M.; Compagnone, D.; Cichelli, A. Effects of fly attack (Bactrocera oleae) on the phenolic profile and selected chemical parameters of olive oil. J. Agric. Food Chem. 2008, 56, 4577–4583. [Google Scholar] [CrossRef]
- Tamendjari, A.; Angerosa, F.; Mettouchi, S.; Bellal, M.M. The effect of fly attack (Bactrocera oleae) on the quality and phenolic content of Chemlal olive oil. Grasas y Aceites 2009, 60, 507–513. [Google Scholar] [CrossRef]
- Youssef, N.B.; Zarrouk, W.; Carrasco-Pancorbo, A.; Ouni, Y.; Segura-Carretero, A.; Fernandez-Gutıerrez, A.; Daouda, D.; Zarrouk, M. Effect of olive ripeness on chemical properties and phenolic composition of chétoui virgin olive oil. J. Sci. Food Agric. 2010, 90, 199–204. [Google Scholar] [CrossRef]
- Anastasopoulos, E.; Kalogeropoulos, N.; Kaliora, A.C.; Kountouri, A.; Andrikopoulos, N.K. The influence of ripening and crop year on quality indices, polyphenols, terpenic acids, squalene, fatty acid profile, and sterols in virgin olive oil (Koroneiki cv.) produced by organic versus non-organic cultivation method. Int. J. Food Sci. Technol. 2011, 46, 170–178. [Google Scholar] [CrossRef]
- Lozano-Sanchez, J.; Cerretani, L.; Bendini, A.; Segura-Carretero, A.; Fernandez-Gutiarrez, A. Filtration process of extra virgin olive oil: Effect on minor components, oxidative stability and sensorial and physicochemical Characteristics. Trends Food Sci. Technol. 2010, 21, 201–211. [Google Scholar] [CrossRef]
- Servili, M.; Selvaggini, R.; Esposto, S.; Taticchi, A.; Montedoro, G.; Morozzi, G. Health and sensory properties of virgin olive oil hydrophilic phenols: Agronomic and technological aspects of production that affect their occurrence in the oil. J. Chromatogr. A 2004, 1054, 113–127. [Google Scholar] [CrossRef]
- Vichi, S.; Romero, A.; Tous, J.; Caixach, J. The activity of healthy olive microbiota during virgin olive oil extraction influences oil chemical composition. J. Agric. Food Chem. 2011, 59, 4705–4714. [Google Scholar] [CrossRef] [PubMed]
- Servili, M.; Selvaggini, R.; Taticchi, A.; Esposto, S.; Montedoro, G. Volatile compounds and phenolic composition of virgin olive oil: Optimization of temperature and time of exposure of olive pastes to air contact during the mechanical extraction process. J. Agric. Food Chem. 2003, 51, 7980–7988. [Google Scholar] [CrossRef] [PubMed]
- Servili, M.; Taticchi, A.; Esposito, S.; Urbani, S.; Selvaggini, R.; Montedoro, G. Influence of the decrease in oxygen during malaxation of olive paste on the composition of volatiles and phenolic compounds in virgin olive oil. J. Agric. Food Chem. 2008, 56, 10048–10055. [Google Scholar] [CrossRef] [PubMed]
- Mastralexi, A.; Nenadis, N.; Tsimidou, M. Addressing analytical requirements to support health claims on “olive oil polyphenols” (EC Regulation 432/2012). J. Agric. Food Chem. 2014, 62, 2459–2461. [Google Scholar] [CrossRef]
- Jha, P.; Flather, M.; Lonn, E.; Farkouh, M.; Yusuf, S. The antioxidant vitamins and cardiovascular disease: A critical review of epidemiologic and clinical trial data. Ann. Intern. Med. 1995, 12, 860–872. [Google Scholar] [CrossRef]
- Inarejos-García, A.M.; Androulaki, A.; Salvador, M.D.; Fregapane, G.; Tsimidou, M. Discussion on the objective evaluation of virgin olive oil bitterness. Food Res. Int. 2009, 42, 279–284. [Google Scholar] [CrossRef]
- Mateos, R.; Cert, A.; Pérez-Camino, M.C.; García, J.M. Evaluation of virgin olive oil bitterness by quantification of secoiridoid derivatives. J. Am. Oil Chem. Soc. 2004, 81, 71–75. [Google Scholar] [CrossRef]
- Andrewes, P.; Busch, J.L.H.C.; de Joode, T.; Groenewegen, A.; Alexandre, H. Sensory properties of virgin olive oil polyphenols: Identification of deacetoxy-ligstroside glycon as a key contributor to pungency. J. Agric. Food Chem. 2003, 51, 1415–1420. [Google Scholar] [CrossRef]
- León, L.; Beltrán, G.; Aguilera, M.P.; Rallo, L.; Barranco, D.; De la Rosa, R. Oil composition of advanced selections from an olive breeding program. Eur. J. Lipid Sci. Technol. 2011, 113, 870–875. [Google Scholar] [CrossRef]
- Herchi, W.; Sakouhi, F.; Arráez-Román, D.; Segura-Carretero, A.; Boukhchina, S.; Kallel, H.; Fernández-Gutierrez, A. Changes in the content of phenolic compounds in flaxseed oil during development. J. Am. Oil Chem. Soc. 2011, 88, 1135–1142. [Google Scholar] [CrossRef]
- Dierkes, G.; Krieger, S.; Dück, R.; Bongartz, A.; Schmitz, O.J.; Hayen, H. High-performance liquid chromatography–mass spectrometry profiling of phenolic compounds for evaluation of olive oil bitterness and pungency. J. Agric. Food Chem. 2012, 60, 7597–7606. [Google Scholar] [CrossRef] [PubMed]
- García-Villalba, R.; Carrasco-Pancorbo, A.; Oliveras-Ferraros, C.; Vázquez-Martín, A.; Menéndez, J.A.; Segura-Carretero, A.; Fernández-Gutiérrez, A. Characterization and quantification of phenolic compounds of extra-virgin olive oils with anticancer properties by a rapid and resolutive LC-ESI-TOF MS method. J. Pharm. Biomed. Anal. 2010, 51, 416–429. [Google Scholar] [CrossRef] [PubMed]
- Nunes, C.A. Vibrational spectroscopy and chemometrics to assess authenticity, adulteration and intrinsic quality parameters of edible oils and fats. Food Res. Int. 2014, 60, 255–261. [Google Scholar] [CrossRef]
- Valli, E.; Bendini, A.; Berardinelli, A.; Ragni, L.; Riccó, B.; Grossi, M.; Toschi, T.G. Rapid and innovative instrumental approaches for quality and authenticity of olive oils. Eur. J. Lipid Sci. Technol. 2016, 118, 1601–1619. [Google Scholar] [CrossRef]
- Peris, M.; Escuder-Gilabert, L. Electronic noses and tongues to assess food authenticity and adulteration. Trends Food Sci. Technol. 2016, 58, 40–54. [Google Scholar] [CrossRef]
- Toko, K. Electronic tongue. Biosens. Bioelectron. 1998, 13, 701–709. [Google Scholar] [CrossRef]
- Vlasov, Y.; Legin, A.; Rudnitskaya, A.; Di Natale, C.; D’Amico, A. Nonspecific sensor arrays (“electronic tongue”) for chemical analysis of liquids (IUPAC Technical Report). Pure Appl. Chem. 2005, 77, 1965–1983. [Google Scholar] [CrossRef]
- Gardner, J.W.; Bartlett, P.N. A brief history of electronic noses. Sens. Actuators B Chem. 1994, 18, 211–220. [Google Scholar] [CrossRef]
- Guadarrama, A.; Rodríguez-Méndez, M.L.; Sanz, C.; Rı́os, J.L.; Saja, J.A. Electronic nose based on conducting polymers for the quality control of the olive oil aroma discrimination of quality, variety of olive and geographic origin. Anal. Chim. Acta 2001, 432, 283–292. [Google Scholar] [CrossRef]
- Haddi, Z.; Amari, A.; Ould Ali, A.; El Bari, N.; Barhoumi, H.; Maaref, A.; Jaffrezic-Renault, N.; Bouchikhi, B. Discrimination and identification of geographical origin virgin olive oil by an e-nose based on MOS sensors and pattern recognition techniques. Procedia Eng. 2011, 25, 1137–1140. [Google Scholar] [CrossRef]
- Haddi, Z.; Alami, H.; El Bari, N.; Tounsi, M.; Maaref, A.; Jaffrezic-Renault, N.; Bouchikhi, B. Electronic nose and electronic tongue combination for improved classification of Moroccan virgin olive oil profiles. Food Res. Int. 2013, 54, 1488–1498. [Google Scholar] [CrossRef]
- Cosio, M.S.; Ballabio, D.; Benedetti, S.; Gigliotti, C. Geographical origin and authentication of extra virgin olive oils by an electronic nose in combination with artificial neural networks. Anal. Chim. Acta 2006, 567, 202–210. [Google Scholar] [CrossRef]
- Mabrouk, S.; Braham, Y.; Barhoumi, H.; Maaref, A. Characterization and classification of different tunisian geographical olive oils using voltammetric electronic tongue. J. Food Process. Technol. 2015, 7, 534. [Google Scholar]
- Dias, L.G.; Fernandes, A.; Veloso, A.C.A.; Machado, A.S.C.; Pereira, J.A.; Peres, A.M. Single-cultivar extra virgin olive oil classification using a potentiometric electronic tongue. Food Chem. 2014, 160, 321–329. [Google Scholar] [CrossRef] [PubMed]
- Dias, L.G.; Rodrigues, N.; Veloso, A.C.A.; Pereira, J.A.; Peres, A.M. Monovarietal extra-virgin olive oil classification: A fusion of human sensory attributes and an electronic tongue. Eur. Food Res. Technol. 2016, 242, 259–270. [Google Scholar] [CrossRef]
- Slim, S.; Rodrigues, N.; Dias, L.G.; Veloso, A.C.A.; Pereira, J.A.; Oueslati, S.; Peres, A.M. Application of an electronic tongue for Tunisian olive oils’ classification according to olive cultivar or physicochemical parameters. Eur. Food Res. Technol. 2017, 243, 1459–1470. [Google Scholar] [CrossRef]
- Souayah, F.; Rodrigues, N.; Veloso, A.C.A.; Dias, L.G.; Pereira, J.A.; Oueslati, S.; Peres, A.M. Discrimination of olive oil by cultivar, geographical origin and quality using potentiometric electronic tongue fingerprints. J. Am. Oil Chem. Soc. 2017, 94, 1417–1429. [Google Scholar] [CrossRef]
- Rodríguez-Méndez, M.L.; Apetrei, C.; Saja, J.A. Electronic tongues purposely designed for the organoleptic characterization of olive oils. In Olives and Olive Oil in Health and Disease Prevention; Preedy, V.R., Watson, R.R., Eds.; Academic Press: London, UK, 2010; pp. 525–532. [Google Scholar]
- Veloso, A.C.A.; Silva, L.M.; Rodrigues, N.; Rebello, L.P.G.; Dias, L.G.; Pereira, J.A.; Peres, A.M. Perception of olive oils sensory defects using a potentiometric taste device. Talanta 2018, 176, 610–618. [Google Scholar] [CrossRef]
- Veloso, A.C.A.; Dias, L.G.; Rodrigues, N.; Pereira, J.A.; Peres, A.M. Sensory intensity assessment of olive oils using an electronic tongue. Talanta 2016, 146, 585–593. [Google Scholar] [CrossRef] [PubMed]
- Cosio, M.S.; Ballabio, D.; Benedetti, S.; Gigliotti, C. Evaluation of different storage conditions of extra virgin olive oils with an innovative recognition tool built by means of electronic nose and electronic tongue. Food Chem. 2007, 101, 485–491. [Google Scholar] [CrossRef]
- Rodrigues, N.; Dias, L.G.; Veloso, A.C.A.; Pereira, J.A.; Peres, A.M. Monitoring olive oils quality and oxidative resistance during storage using an electronic tongue. LWT Food Sci. Technol. 2016, 73, 683–692. [Google Scholar] [CrossRef]
- Rodrigues, N.; Dias, L.G.; Veloso, A.C.A.; Pereira, J.A.; Peres, A.M. Evaluation of extra-virgin olive oils shelf life using an electronic tongue—Chemometric approach. Eur. Food Res. Technol. 2017, 243, 597–607. [Google Scholar] [CrossRef]
- Buratti, S.; Malegori, C.; Benedetti, S.; Oliveri, P.; Giovanelli, G. E-nose, e-tongue and e-eye for edible olive oil characterization and shelf life assessment: A powerful data fusion approach. Talanta 2018, 182, 131–141. [Google Scholar] [CrossRef] [PubMed]
- Ou, G.; Hu, R.; Zhang, L.; Li, P.; Luo, X.; Zhang, Z. Advanced detection methods for traceability of origin and authenticity of olive oils. Anal. Methods 2015, 7, 5731–5739. [Google Scholar] [CrossRef]
- Srigley, C.T.; Oles, C.J.; Kia, A.R.F.; Mossoba, M.M. Authenticity assessment of extra virgin olive oil: Evaluation of desmethylsterols and triterpene dialcohols. J. Am. Oil Chem. Soc. 2016, 93, 171–181. [Google Scholar] [CrossRef]
- Oliveros, M.C.C.; Pavón, J.L.P.; Pinto, C.G.; Laespada, M.E.F.; Cordero, B.M.; Forina, M. Electronic nose based on metal oxide semiconductor sensors as a fast alternative for the detection of adulteration of virgin olive oils. Anal. Chim. Acta 2002, 459, 219–228. [Google Scholar] [CrossRef]
- Mildner-Szkudlarz, S.; Jeleń, H.H. The potential of different techniques for volatile compounds analysis coupled with PCA for the detection of the adulteration of olive oil with hazelnut oil. Food Chem. 2008, 110, 751–761. [Google Scholar] [CrossRef]
- Mildner-Szkudlarz, S.; Jeleń, H.H. Detection of olive oil adulteration with rapeseed and sunflower oils using MOS electronic nose and SMPE-MS. J. Food Qual. 2010, 33, 21–41. [Google Scholar] [CrossRef]
- Santonico, M.; Grasso, S.; Genova, F.; Zompanti, A.; Parente, F.R.; Pennazza, G. Unmasking of olive oil adulteration via a multi-sensor platform. Sensors 2015, 15, 21660–21672. [Google Scholar] [CrossRef] [PubMed]
- Apetrei, I.M.; Apetrei, C. Detection of virgin olive oil adulteration using a voltammetric e-tongue. Comput. Electron. Agric. 2014, 108, 148–154. [Google Scholar] [CrossRef]
- Harzalli, U.; Rodrigues, N.; Veloso, A.C.A.; Dias, L.G.; Pereira, J.A.; Oueslati, S.; Peres, A.M. A taste sensor device for unmasking admixing of rancid or winey-vinegary olive oil to extra virgin olive oil. Comput. Electron. Agric. 2018, 144, 222–231. [Google Scholar] [CrossRef]
- Marx, Í.M.G.; Rodrigues, N.; Dias, L.G.; Veloso, A.C.A.; Pereira, J.A.; Drunkler, D.A.; Peres, A.M. Sensory classification of table olives using an electronic tongue: Analysis of aqueous pastes and brines. Talanta 2017, 162, 98–106. [Google Scholar] [CrossRef] [PubMed]
- Marx, Í.M.G.; Rodrigues, N.; Dias, L.G.; Veloso, A.C.A.; Pereira, J.A.; Drunkler, D.A.; Peres, A.M. Quantification of table olives’ acid, bitter and salty tastes using potentiometric electronic tongue fingerprints. LWT Food Sci. Technol. 2017, 79, 394–401. [Google Scholar] [CrossRef]
- Marx, Í.M.G.; Rodrigues, N.; Dias, L.G.; Veloso, A.C.A.; Pereira, J.A.; Drunkler, D.A.; Peres, A.M. Assessment of table olives’ organoleptic defects intensities based on the potentiometric fingerprint recorded by an electronic tongue. Food Bioprocess Technol. 2017, 10, 1310–1323. [Google Scholar] [CrossRef]
- Apetrei, I.M.; Apetrei, C. Voltammetric e-tongue for the quantification of total polyphenol content in olive oils. Food Res. Int. 2013, 54, 2075–2082. [Google Scholar] [CrossRef]
- Apetrei, C.; Apetrei, I.M.; Villanueva, S.; Saja, J.A.; Gutierrez-Rosales, F.; Rodríguez-Méndez, M.L. Combination of an e-nose, an e-tongue and an e-eye for the characterisation of olive oils with different degree of bitterness. Anal. Chim. Acta 2010, 663, 91–97. [Google Scholar] [CrossRef]
- Apetrei, C.; Ghasemi-Varnamkhasti, M.; Apetrei, I.M. Olive oil and combined electronic nose and tongue. In Electronic Noses and Tongues in Food Science; Rodríguez-Méndez, M.L., Ed.; Academic Press: London, UK, 2016; pp. 277–289. [Google Scholar]
- Rodríguez-Méndez, M.L.; Apetrei, C.; Saja, J.A. Evaluation of the polyphenolic content of extra virgin olive oils using an array of voltammetric sensors. Electrochim. Acta 2008, 53, 5867–5872. [Google Scholar] [CrossRef]
- Apetrei, C.; Gutierez, F.; Rodríguez-Méndez, M.L.; Saja, J.A. Novel method based on carbon paste electrodes for the evaluation of bitterness in extra virgin olive oils. Sens. Actuators B Chem. 2007, 121, 567–575. [Google Scholar] [CrossRef]
- Fernández, E.; Vidal, L.; Canals, A. Rapid determination of hydrophilic phenols in olive oil by vortex-assisted reversed-phase dispersive liquid-liquid microextraction and screen-printed carbon electrodes. Talanta 2018, 181, 44–51. [Google Scholar] [CrossRef] [PubMed]
- Enache, A.; Amine, A.; Brett, C.M.A.; Oliveira-Brett, A.M. Virgin olive oil ortho-phenols—Electroanalytical quantification. Talanta 2013, 105, 179–186. [Google Scholar] [CrossRef] [PubMed]
- Prata, R.; Pereira, J.A.; Rodrigues, N.; Dias, L.G.; Veloso, A.C.A.; Casal, S.; Peres, A.M. Olive Oil Total Phenolic Contents and Sensory Sensations Trends during Oven and Microwave Heating Processes and Their Discrimination Using an Electronic Tongue. J. Food Qual. 2018, 2018, 7826428. [Google Scholar] [CrossRef]
- Borges, T.H.; Peres, A.M.; Dias, L.G.; Seiquera, I.; Pereira, J.A. Application of a potentiometric electronic tongue for assessing phenolic and volatile profiles of Arbequina extra virgin olive oils. LWT Food Sci. Technol. 2018, 93, 150–157. [Google Scholar] [CrossRef]
- Morozova, K.; Aprea, E.; Cantini, C.; Migliorini, M.; Gasperi, F.; Scampicchio, M. Determination of Bitterness of Extra Virgin Olive Oils by Amperometric Detection. Electroanalysis 2016, 28, 2196–2204. [Google Scholar] [CrossRef]
- Benedetti, S.; Cosio, M.S.; Scampicchio, M.; Mannino, S. Nanoemulsions for the Determination of the Antioxidant Capacity of Oils by an Electrochemical Method. Electroanalysis 2012, 24, 1356–1361. [Google Scholar] [CrossRef]
- Vlasov, Y.; Legin, A. Non-selective chemical sensors in analytical chemistry: From “electronic nose” to “electronic tongue”. Fresenius J. Anal. Chem. 1998, 361, 255–260. [Google Scholar] [CrossRef]
- Ciosek, P.; Wróblewski, W. Sensor arrays for liquid sensing—Electronic tongue systems. Analyst 2007, 132, 963–978. [Google Scholar] [CrossRef]
- Legin, A.V.; Rudnitskaya, A.M.; Vlasov, Y.G.; Di Natale, C.; D’Amico, A. Features of the electronic tongue in comparison with the characteristics of the discrete ion-selective sensors. Sens. Actuators B Chem. 1999, 58, 464–468. [Google Scholar] [CrossRef]
- Vlasov, Y.G.; Legin, A.V.; Rudnitskaya, A.M.; DiNatale, C.; Damico, A. Multisensor system with an array of chemical sensors and artificial neural networks (electronic tongue) for quantitative analysis of multicomponent aqueous solutions. Russ. J. Appl. Chem. 1996, 69, 848–853. [Google Scholar]
- Lavigne, J.J.; Savoy, S.; Clevenger, M.B.; Ritchie, J.E.; McDoniel, B.; Yoo, S.-J.; Anslyn, E.V.; McDevitt, J.T.; Shear, J.B.; Neikirk, D. Solution-based analysis of multiple analytes by a sensor array: Toward the development of an “electronic tongue”. J. Am. Chem. Soc. 1998, 120, 6429–6430. [Google Scholar] [CrossRef]
- Toko, K. Taste sensor with global selectivity. Mater. Sci. Eng. C 1996, 4, 69–82. [Google Scholar] [CrossRef]
- Winquist, F.; Krantz-Rülcker, C.; Wide, P.; Lundström, I. Monitoring of freshness of milk by an electronic tongue on the basis of voltammetry. Meas. Sci. Technol. 1998, 9, 1937. [Google Scholar] [CrossRef]
- Banerjee, R.; Tudu, B.; Bandyopadhyay, R.; Bhattacharyya, N. A review on combined odor and taste sensor systems. J. Food Eng. 2016, 190, 10–21. [Google Scholar] [CrossRef]
- Bricker, O.P. Redox potential: Its measurements and importance in water systems. In Water Analysis. Inorganic Species; Minear, R.A., Keith, L.H., Eds.; Academic Press: Cambridge, MA, USA, 1982; Volume 1, pp. 55–83. [Google Scholar]
- Moschou, E.A.; Chaniotakis, N.A. Ion-partitioning membranes as electroactive elements for the development of a novel cation-selective CHEMFET sensor system. Membr. Sci. Technol. 2003, 8, 393–413. [Google Scholar]
- Wulff, G.; Sarhan, A. Über die Anwendung von Enzymanalog Gebauten Polymeren zur Racemattrennung. Angew. Chem. 1972, 84, 364–365. [Google Scholar] [CrossRef]
- Haupt, K.; Mosbach, K. Molecularly imprinted polymers and their use in biomimetic sensors. Chem. Rev. 2000, 100, 2495–2504. [Google Scholar] [CrossRef]
- Yan, H.; Row, K.H. Characteristic and synthetic approach of molecularly imprinted polymer. Int. J. Mol. Sci. 2006, 7, 155–178. [Google Scholar] [CrossRef]
- Bobacka, J.; Ivaska, A.; Lewenstam, A. Potentiometric Ion Sensors. Chem. Rev. 2008, 108, 329–351. [Google Scholar] [CrossRef]
- Vlasov, Y.G.; Bychkov, E.A. Ionic and electronic conductivity in the copper-silver-arsenic selenium glasses. Solid State Ion. 1984, 14, 329–335. [Google Scholar] [CrossRef]
- Buhlmann, P.; Pretsch, E.; Bakker, E. Carrier-based ion-selective electrodes and bulk optodes. 2. Ionophores for potentiometric and optical sensors. Chem. Rev. 1998, 98, 1593–1687. [Google Scholar] [CrossRef] [PubMed]
- Lange, U.; Roznyatovskaya, N.V.; Mirsky, V.M. Conducting polymers in chemical sensors and arrays. Anal. Chim. Acta 2008, 614, 1–26. [Google Scholar] [CrossRef] [PubMed]
- Janata, J. Potentiometric microsensors. Chem. Rev. 1990, 90, 691–703. [Google Scholar] [CrossRef]
- André, C.; Castanheira, I.; Cruz, J.M.; Paseiro, P.; Sanches-Silva, A. Analytical strategies to evaluate antioxidants in food: A review. Trends Food Sci. Technol. 2010, 21, 229–246. [Google Scholar] [CrossRef]
- Fojta, M.; Jelen, F.; Havran, L.; Palecek, E. Electrochemical stripping techniques in analysis of nucleic acids and their constituents. Curr. Anal. Chem. 2008, 4, 250–262. [Google Scholar] [CrossRef]
- Apetrei, C. Novel method based on polypyrrole-modified sensors and emulsions for the evaluation of bitterness in extra virgin olive oils. Food Res. Int. 2012, 48, 673–680. [Google Scholar] [CrossRef]
- Wang, J. Analytical Electrochemistry, 2nd ed.; Wiley VCH: Weinheim, Germany, 2001. [Google Scholar] [CrossRef]
- Osteryoung, J.G.; Osteryoung, R.A. Square wave voltammetry. Anal. Chem. 1985, 57, 101A–110A. [Google Scholar] [CrossRef]
- Sawyer, D.T.; Sobkowiak, A.; Roberts, J.L., Jr. Electrochemistry for Chemists, 2nd ed.; John Wiley & Sons Inc.: Hoboken, NJ, USA, 1995. [Google Scholar]
- Vasilescu, I.; Eremia, S.A.V.; Albu, C.; Antonio Radoi, A.; Litescu, S.; Radu, G. Determination of the antiradical properties of olive oils using an electrochemical method based on DPPH radical. Food Chem. 2015, 166, 324–329. [Google Scholar] [CrossRef] [PubMed]
- Wold, S. Splin-funktioner-ett nytt verktyg i dataanalysen. Kem. Tidskr. 1972, 84, 34–37. [Google Scholar]
- Massart, D.L.; Vandeginste, B.M.G.; Buydens, L.M.C.; De Jong, S.; Lewi, P.J.; Smeyers-Verbeke, J. Handling in Science and Technology. In Handbook of Chemometrics and Qualimetrics: Part A; Elsevier: Amsterdam, The Netherlands, 1997. [Google Scholar]
- Brereton, R.G. Applied Chemometrics for Scientists; John Wiley & Sons Ltd.: Hoboken, NJ, USA, 2007. [Google Scholar]
- Jurs, P.C.; Bakken, G.A.; McClelland, H.E. Computational methods for the analysis of chemical sensor array data from volatile analysis. Chem. Rev. 2000, 100, 2649–2678. [Google Scholar] [CrossRef] [PubMed]
- Izenman, A.J. Modern Multivariate Statistical Techniques: Regression, Classification, and Manifold Learning; Springer: New York, NY, USA, 2008; p. 733. [Google Scholar]
- Tahri, K.; Duarte, A.A.; Carvalho, G.; Ribeiro, P.A.; Silva, M.G.; Mendes, D. Distinguishment, identification and aroma compound quantification of Portuguese olive oils based on physicochemical attributes, HS-GC/MS analysis and voltammetric electronic tongue. J. Sci. Food Agric. 2018, 98, 681–690. [Google Scholar] [CrossRef] [PubMed]
- Semenova, V.; Volkov, S.; Khaydukova, M.; Fedorov, A.; Lisitsynab, I.; Kirsanov, D.; Legin, A.V. Determination of three quality parameters in vegetable oils using potentiometric e-tongue. J. Food Compos. Anal. 2019, 75, 75–80. [Google Scholar] [CrossRef]
- Gutiérrez, J.M.; Haddi, Z.; Amari, A.; Bouchikhi, B.; Mimendia, A.; Cetó, X.; del Valle, M. Hybrid electronic tongue based on multisensory data fusion for discrimination of beers. Sens. Actuator B Chem. 2013, 177, 989–996. [Google Scholar] [CrossRef]
- Diaz, T.G.; Espinosa-Mansilla, A.; Murillo, B.R.; Salinas, F. Voltammetric Behavior and Determination of Nordihydroguaiaretic Acid in Presence of Other Antioxidants Using PLS Calibration. Electroanalysis 2003, 15, 646–651. [Google Scholar] [CrossRef]
- Escrich, E.; Moral, R.; Grau, L.; Costa, I.; Solanas, M. Molecular mechanisms of the effects of olive oil and other dietary lipids on cancer. Mol. Nutr. Food Res. 2007, 51, 1279–1292. [Google Scholar] [CrossRef] [PubMed]
- Trichopoulou, A.; Dilis, V. Olive oil and longevity. Mol. Nutr. Food Res. 2007, 51, 1275–1278. [Google Scholar] [CrossRef]
- García-González, D.L.; Tena, N.; Aparicio, R. Quality characterization of the new virgin olive oil var. Sikitita by phenols and volatile compounds. J. Agric. Food Chem. 2010, 58, 8357–8364. [Google Scholar] [CrossRef]
- Covas, M.I.; Nyyssonen, K.; Poulsen, H.E.; Kaikkonen, J.; Zunft, H.J.; Kiesewetter, H.; Gaddi, A.; de la Torre, R.; Mursu, J.; Bäumler, H.; et al. The effect of polyphenols in olive oil on heart disease risk factors: A randomized trial. Ann. Intern. Med. 2006, 145, 333–341. [Google Scholar] [CrossRef]
- Covas, M.I.; Ruiz-Gutierrez, V.; de la Torre, R.; Kafatos, A.; Lamuela-Raventos, R.M.; Osada, J.; Owen, R.W.; Visioli, F. Minor components of olive oil: Evidence to date of health benefits in humans. Nutr. Rev. 2006, 64, S20–S30. [Google Scholar] [CrossRef]
- Covas, M.I. Olive oil and the cardiovascular system. Pharmacol. Res. 2007, 55, 175–186. [Google Scholar] [CrossRef] [PubMed]
- Covas, M.I. Bioactive effects of olive oil phenolic compounds in humans: Reduction of heart disease factors and oxidative damage. Inflammopharmacology 2008, 16, 216–218. [Google Scholar] [CrossRef] [PubMed]
- Fito, M.; de la Torre, R.; Covas, M.I. Olive oil and oxidative stress. Mol. Nutr. Food Res. 2007, 51, 1215–1224. [Google Scholar] [CrossRef] [PubMed]
- Covas, M.I.; Konstantinidou, V.; Fito, M. Olive oil and cardiovascular health. J. Cardiovasc. Pharmacol. 2009, 54, 477–482. [Google Scholar] [CrossRef] [PubMed]
- Corona, G.; Spencer, J.P.E.; Dessi, M.A. Extra virgin olive oil phenolics: Absorption, metabolism, and biological activities in the GI tract. Toxicol. Ind. Health 2009, 25, 285–293. [Google Scholar] [CrossRef] [PubMed]
- Cicerale, S.; Conlan, X.A.; Sinclair, A.J.; Keats, R.S.J. Chemistry of olive oil phenolics. Crit. Rev. Food Sci. Nutr. 2009, 49, 218–236. [Google Scholar] [CrossRef] [PubMed]
- Cicerale, S.; Lucas, L.; Keast, R. Antimicrobial, antioxidant and anti-inflammatory phenolic activities in extra virgin olive oil. Curr. Opin. Biotechnol. 2011, 23, 129–135. [Google Scholar] [CrossRef]
- Kiritsakis, A.; Markakis, P. Olive oil: A review. Adv. Food Res. 1988, 31, 453–482. [Google Scholar]
- Gutiérrez, F.; Jímenez, B.; Ruíz, A.; Albi, M.A. Effect of olive ripeness on the oxidative stability of virgin olive oil extracted from the varieties Picual and Hojiblanca and on the different components involved. J. Agric. Food Chem. 1999, 47, 121–127. [Google Scholar] [CrossRef]
- Psomiadou, E.; Tsimidou, M.; Boskou, D. α-Tocopherol content of Greek virgin olive oils. J. Agric. Food Chem. 2000, 48, 1770–1775. [Google Scholar] [CrossRef]
- Roca, M.; Gandul-Rojas, B.; Gallardo-Guerrero, L.; Mínguez-Mosquera, M.I. Pigment parameters determining spanish virgin olive oil authenticity: Stability during storage. J. Am. Oil Chem. Soc. 2003, 80, 1237–1240. [Google Scholar] [CrossRef]
- Aparicio-Ruiz, R.; Mínguez-Mosquera, M.I.; Gandul-Rojas, B. Thermal degradation kinetics of lutein, b-carotene and b-cryptoxanthin in virgin olive oils. J. Food Compos. Anal. 2011, 24, 811–820. [Google Scholar] [CrossRef]
- Serani, A.; Piacenti, D. Kinetics of pheophytin—A photodecomposition in extra virgin olive oil. J. Am. Oil Chem. Soc. 1992, 69, 469–470. [Google Scholar] [CrossRef]
- Usuki, R.; Endo, Y.; Kaneda, T. Residual amounts of chlorophylls and pheophytins in refined edible oils. J. Am. Oil Chem. Soc. 1984, 48, 991–994. [Google Scholar] [CrossRef]
- Endo, Y.; Usuki, R.; Kaneda, T. Antioxidant effects of chlorophyll and pheophytin on the autoxidation of oils in the dark. I. Comparison of the inhibitory effects. J. Am. Oil Chem. Soc. 1985, 62, 1375–1378. [Google Scholar] [CrossRef]
- Lamson, D.W.; Brignall, M.S. Antioxidants and Cancer III: Quercetin. Altern. Med. Rev. 2000, 5, 196–208. [Google Scholar]
- Del Carlo, M.; Amine, A.; Haddam, M.; della Pelle, F.; Fusella, G.C.; Compagnone, D. Selective Voltammetric Analysis of o-Diphenols from Olive Oil Using Na2MoO4 as Electrochemical Mediator. Electroanalysis 2012, 24, 889–896. [Google Scholar] [CrossRef]
- Santos, C.S.P.; Cruz, R.; Cunha, S.C.; Casal, S. Effect of cooking on olive oil quality attributes. Food Res. Int. 2014, 54, 2016–2024. [Google Scholar] [CrossRef]
- Chen, H.; Angiuli, M.; Ferrari, C.; Tombari, E.; Salvetti, G.; Bramanti, E. Tocopherol speciation as first screening for the assessment of extra virgin olive oil quality by reversed-phase high-performance liquid chromatography/fluorescence detector. Food Chem. 2011, 125, 1423–1429. [Google Scholar] [CrossRef]
- Brett, C.M.A.; Oliveira-Brett, A.M. Electrochemistry. Principles, Methods and Applications; Oxford University Press: Oxford, UK, 1993. [Google Scholar]
- Della Pelle, F.; Compagnone, D. Nanomaterial-Based Sensing and Biosensing of Phenolic Compounds and Related Antioxidant Capacity in Food. Sensors 2018, 18, 462. [Google Scholar] [CrossRef]
- Cheng, Z.; Ren, J.; Li, Y.; Chang, W.; Chen, Z. Phenolic antioxidants: Electrochemical behavior and the mechanistic elements underlying their anodic oxidation reaction. Redox Rep. 2002, 7, 395–402. [Google Scholar] [CrossRef] [PubMed]
- Arteafa, J.F.; Ruiz-Montoya, M.; Palma, A.; Alonso-Garrido, G.; Pintado, S.; Rodríguez-Mellado, J.M. Comparison of the Simple Cyclic Voltammetry (CV) and DPPH Assays for the Determination of Antioxidant Capacity of Active Principles. Molecules 2012, 17, 5126–5138. [Google Scholar] [CrossRef] [PubMed]
- Cosio, M.S.; Scampicchio, M.; Benedetti, S. Electronic Noses and Tongues. Yolanda Picó. In Chemical Analysis of Food: Techniques and Applications; Academic Press: Cambridge, MA, USA, 2012; Volume 8, pp. 219–247. ISBN 9780123848628. [Google Scholar]
- Bratov, A.; Abramova, N.; Ipatov, A. Recent trends in potentiometric sensor arrays—A review. Anal. Chim. Acta 2010, 678, 149–159. [Google Scholar] [CrossRef] [PubMed]
- Bougrini, M.; Tahri, K.; Saidi, T.; El Hassani, N.; El, A.; Bouchikhi, B.; El Bari, N. Classification of Honey According to Geographical and Botanical Origins and Detection of Its Adulteration Using Voltammetric Electronic Tongue. Food Anal. Methods 2016, 9, 2161–2173. [Google Scholar] [CrossRef]
- Sobrino-Gregorio, L.; Bataller, R.; Soto, J.; Escriche, I. Monitoring honey adulteration with sugar syrups using an automatic pulse voltammetric electronic tongue. Food Control 2018, 91, 254–260. [Google Scholar] [CrossRef]
- Panchuk, V.; Lvova, L.; Kirsanov, D.; Gonçalves, C.G.; Di Natale, C.; Paolesse, R.; Legin, A. Extending electronic tongue calibration lifetime through mathematical drift correction: Case study of microcystin toxicity analysis in waters. Sens. Actuators B Chem. 2016, 237, 962–968. [Google Scholar] [CrossRef]
- Holmin, S.; Krantz-Rülcker, C.; Lundström, I.; Winquist, F. Drift correction of electronic tongue responses. Meas. Sci. Technol. 2001, 12, 1348–1354. [Google Scholar] [CrossRef]
- Khaydukova, M.; Medina-Plaza, C.; Rodriguez-Mendez, M.L.; Panchuk, V.; Kirsanov, D.; Andrey Legin, A. Multivariate calibration transfer between two different types of multisensor systems. Sens. Actuators B Chem. 2017, 246, 994–1000. [Google Scholar] [CrossRef]
- Rudnitskaya, A. Calibration Update and Drift Correction for Electronic Noses and Tongues. Front. Chem. 2018, 6, 433. [Google Scholar] [CrossRef]
- Veloso, A.C.A.; Sousa, M.E.B.C.; Estevinho, L.; Dias, L.G.; Peres, A.M. Honey evaluation using electronic tongues: An overview. Chemosensors 2018, 6, 28. [Google Scholar] [CrossRef]


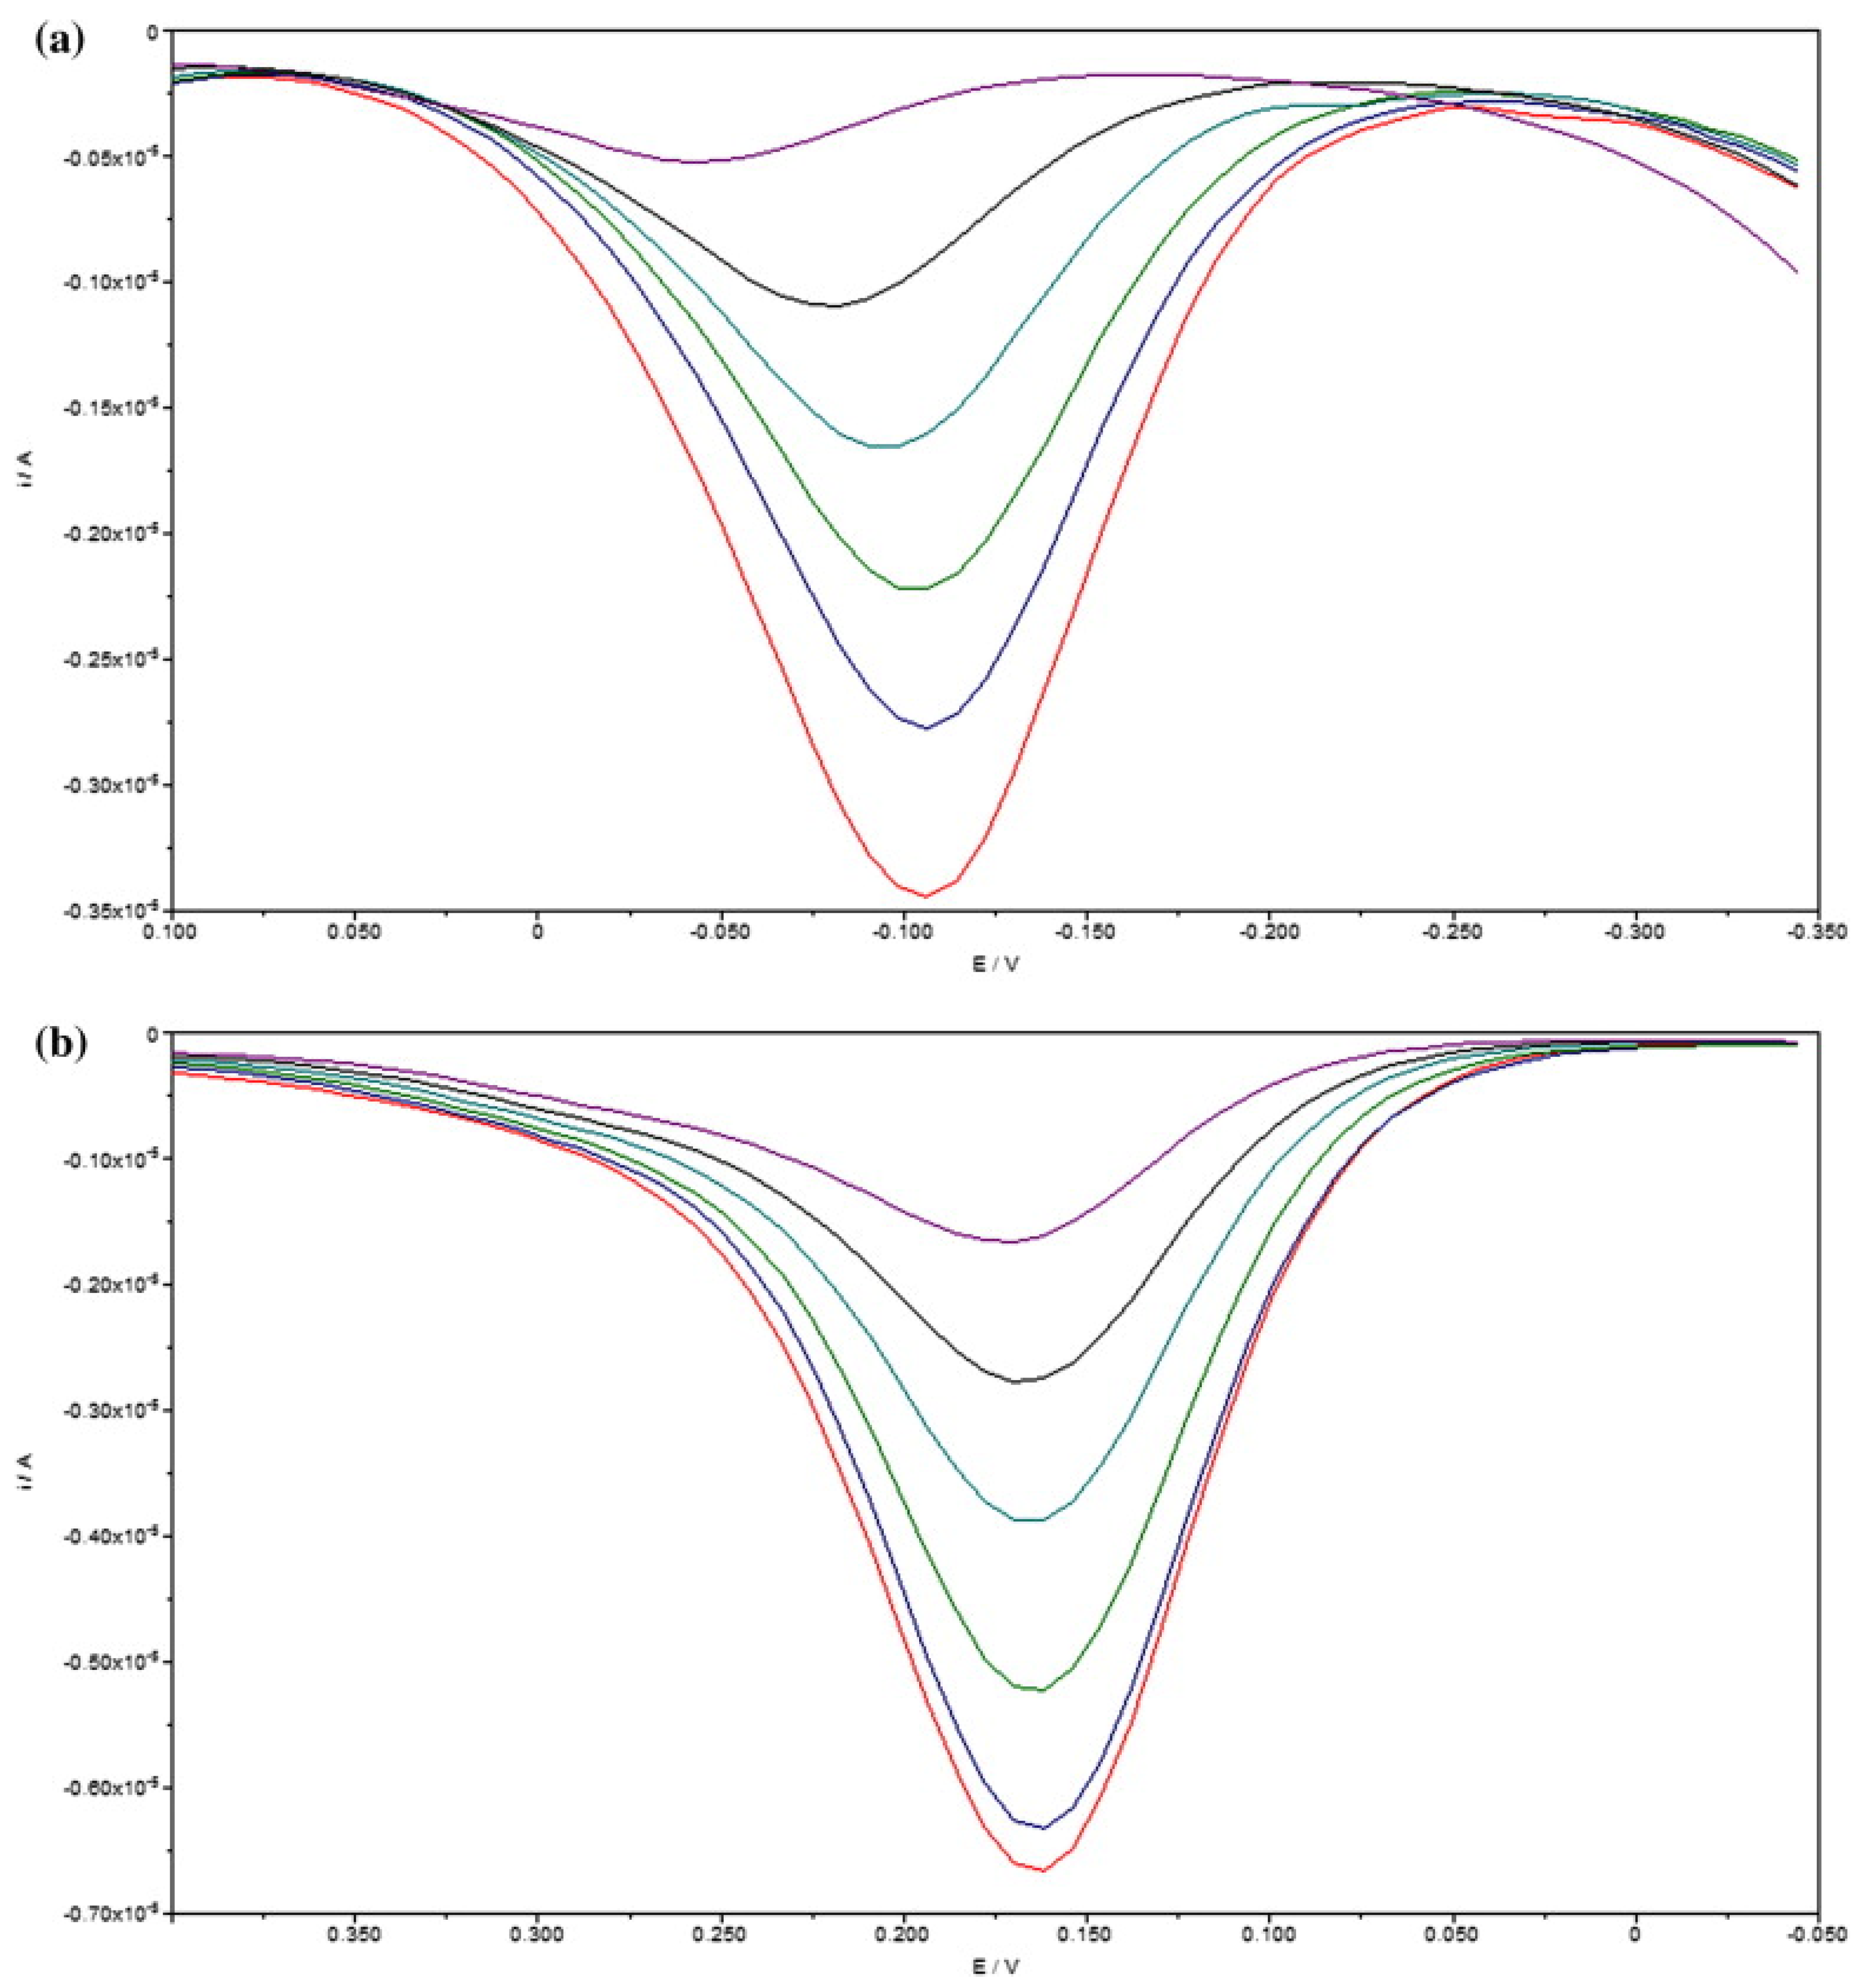
 ) solution in the presence of different concentrations of α-tocopherol, measured at Pt-SPE in (a) 0.1 mol L−1 TBATFB/Methanol and (b) 0.033 mol L−1 KCl/Methanol (reprinted with permission from [126] ©Elsevier, Amsterdam, The Netherlands, 2018).
) solution in the presence of different concentrations of α-tocopherol, measured at Pt-SPE in (a) 0.1 mol L−1 TBATFB/Methanol and (b) 0.033 mol L−1 KCl/Methanol (reprinted with permission from [126] ©Elsevier, Amsterdam, The Netherlands, 2018).
) solution in the presence of different concentrations of α-tocopherol, measured at Pt-SPE in (a) 0.1 mol L−1 TBATFB/Methanol and (b) 0.033 mol L−1 KCl/Methanol (reprinted with permission from [126] ©Elsevier, Amsterdam, The Netherlands, 2018).


| Electrochemical Methods | Apparatus | Techniques | Electrochemical Data Analysis | Application | Results | Reference |
|---|---|---|---|---|---|---|
| Amperometry | Electrochemical cell | Flow injection system | PLS | Evaluation of the bitter taste intensity of monovarietal EVOOs using amperometric detection at two fixed potentials (+0.4 and +0.9 V). | Amperometric signal at + 0.9 V was correlated with the total phenols contents of the samples (R2 = 0.810) Amperometric signal at + 0.4 V was correlated with oleuropein aglycone (3,4 DHPEA-EDA) contents (R2 = 0.790). | [100] |
| Potentiometry | E-tongue | Lipid polymeric membranes | PCA LDA-SA | Determination of olive oil total phenolic contents and sensory sensations trends during oven and microwave heating processes. | Bitter, pungent, fruity and green sensations intensities showed linear trends with the total phenolic contents (0.8075 ≤ R-Pearson ≤ 0.9694) LDA sensitivities of 94 ± 4%, for repeated K-fold cross-validation (internal-validation procedure). The total phenolic concentrations range from: 304 ± 83 to 581 ± 100 mg caffeic acid/kg olive oil. | [98] |
| Potentiometry | E-tongue | Lipid polymeric membranes | MLR-SA | Assessing phenolic and volatile compounds of Arbequina EVOO. | Satisfactory E-tongue-MLR-SA correlation coefficients for the phenolic contents of olive oils: R2 ≥ 0.914. | [99] |
| Potentiometry | E-tongue | Polymeric sensor membranes | PCA PLS | Simultaneous numerical assessment of peroxide values, anisidine index and lipophilic phenol contents. | Multivariate regression tools yielded RMSE for cross-validation of: 0.5 meq/kg for peroxide values (R2 = 0.890); 0.8 arbitrary units for anisidine index (R2 = 0.67); and, 10 mg/100 g for total tocopherols concentrations (R2 = 0.830). | [133] |
| Voltammetry | E-tongue | CV SWV | PCA PLS-DA | Evaluation of EVOO with different degree of bitterness | High correlation between the response of the sensors versus the values of bitterness intensity obtained by a trained sensory panel (R2 = 0.920). | [95] |
| Voltammetry | E-tongue | CV SWV | PCA PLS-DA | Discrimination of olive oils bitterness using an array of voltammetric sensors, which allowed analyzing the polyphenolic fraction extracted from the oils. | Linear correlation between:
| [94] |
| Voltammetry | E-tongue | CV | PCA PLS-DA | Discrimination of EVOO with different bitterness degrees. | Quantitative performance of the voltammetric tool:
| [122] |
| Voltammetry | Electrochemical cell | CV SWV | LR | Electroanalytical method for the determination of VOO oxidation of ortho-phenols and mono-phenols. | Hydroxytyrosol contents determined: 3 mg/kg for 2-year-old VOO; 6–7 mg/kg for 1-year-old VOO; and 30 mg/kg for fresh VOO. Recoveries: 78–93% for samples spiked with hydroxytyrosol standard. | [97] |
| Voltammetry | Electrochemical cell | CV | LDA | Evaluation of the hydrophilic phenolic fraction in olive oils. | Working ranges and quantitative performance achieved with the voltammetry device, Caffeic acid: linearity between 0.075 and 2.5 mg L−1 (R = 0.998, N = 7) Tyrosol: linearity between 0.075 and 3 mg L−1 (R = 0.999, N = 8). | [96] |
| Voltammetry | Electrochemical cell | CV | PCA PLS-DA | Qualitative and quantitative determination of phenolic compounds found in extra virgin olive oils. | Results of the voltammetric approach obtained for the training and test datasets compared to those obtained by conventional analytical methods: R2calibration = 0.9976 R2prediction = 0.9884. | [91] |
| Voltammetry | Electronic panel system: E-tongue E-nose E-eye | SWV | PCA PLS-DA | Evaluation of different olive cultivars and different degrees of bitterness. | Quantification of polyphenolic contents determined by HPLC, using the proposed voltammetric tool: R2 ≥ 0.900 | [92] |
| Voltammetry | Glassy carbon electrode | CV DPV | PLS | Determination of nordihydroguaiaretic acid (synthetic antioxidant) in olive oil due to the migration from the package material, in presence of other natural antioxidants. | Recovery values in the analysis: 97.2 to 106.7%. | [135] |
| Voltammetry | E-tongue | CV | PCA LDA PLS | Quantification of Free Fatty Acid, chlorophyll and carotenoid content in Portuguese olive oils. | The best models established with the voltammetric data allowed a satisfactory quantification of the chemical parameters, Free Fatty Acid content: R = 0.962 Carotenoids contents: R = 0.923 Chlorophyll contents: R = 0.810 | [132] |
| Voltammetry | Screen-printed electrode | CV DPV | LR | Determination of the antiradical vitamin E properties of commercial olive oils, being the antiradical activity correlated with the lipophilic phenol contents. | Quantitative performance of the voltammetric analytical proposed approach. Concentration range (µmol L−1): α-Tocopherol: 1.00–100.00; R² = 0.995 δ-Tocopherol: 5.00–150.00; R² = 0.998 λ-Tocopherol: 5.50–125.00; R² = 0.989 | [126] |
| Voltammetry/Amperometry | Graphite screen-printed and carbon paste electrodes | CV Flow injection analysis | LR | Detection of o-diphenolic content of phenolic extracts obtained from olive oil samples. | Quantitative performance of the voltammetric procedure developed for catechol: R2 = 0.999. Calibration using the amperometric system for assessing catechol: R2 = 0.998. | [157] |
© 2018 by the authors. Licensee MDPI, Basel, Switzerland. This article is an open access article distributed under the terms and conditions of the Creative Commons Attribution (CC BY) license (http://creativecommons.org/licenses/by/4.0/).
Share and Cite
Marx, Í.M.G.; Veloso, A.C.A.; Dias, L.G.; Casal, S.; Pereira, J.A.; Peres, A.M. Electrochemical Sensor-Based Devices for Assessing Bioactive Compounds in Olive Oils: A Brief Review. Electronics 2018, 7, 387. https://doi.org/10.3390/electronics7120387
Marx ÍMG, Veloso ACA, Dias LG, Casal S, Pereira JA, Peres AM. Electrochemical Sensor-Based Devices for Assessing Bioactive Compounds in Olive Oils: A Brief Review. Electronics. 2018; 7(12):387. https://doi.org/10.3390/electronics7120387
Chicago/Turabian StyleMarx, Ítala M. G., Ana C. A. Veloso, Luís G. Dias, Susana Casal, José A. Pereira, and António M. Peres. 2018. "Electrochemical Sensor-Based Devices for Assessing Bioactive Compounds in Olive Oils: A Brief Review" Electronics 7, no. 12: 387. https://doi.org/10.3390/electronics7120387
APA StyleMarx, Í. M. G., Veloso, A. C. A., Dias, L. G., Casal, S., Pereira, J. A., & Peres, A. M. (2018). Electrochemical Sensor-Based Devices for Assessing Bioactive Compounds in Olive Oils: A Brief Review. Electronics, 7(12), 387. https://doi.org/10.3390/electronics7120387