1. Introduction
The management of production in a greenhouse presents two major challenges, the meeting of which depends on good development, maintenance, production, and profitability. The first is the optimal use of soil, and the second is the efficient use of water and electricity resources. Generally, optimization of the growth conditions of crops, the cultivation period, and control of the indoor environment require the implementation of systems that are adaptive to changing climatic conditions. Therefore, there is a need to implement high-tech greenhouses focused on creating appropriate climate conditions that enhance plant growth and reduce production costs and energy consumption [
1].
Implementing a control system in a greenhouse is a complex process due to the number of variables involved and the dependence between them. To meet these requirements, different intelligent control strategies such as fuzzy logic have been discussed, and achievements have been made in the remote control of climatic variables [
2,
3,
4]. In addition, research has been conducted using different versions of fuzzy controllers such as traditional [
5], inverted [
6], adaptive [
7], and improved via particle swarm optimization [
8]. It also highlights the growing use of neural networks for smart frost control [
9], the dynamic modeling of temperature and relative humidity [
10], and climate control and energy saving in different types of greenhouses [
11].
Recently, the use of open source hardware for remote control systems for low-cost greenhouses [
12,
13] and for the monitoring of environmental parameters in precision agriculture [
14] has become popular. Furthermore, wireless sensor networks are now used for irrigation control and monitoring in different sectors of agriculture [
15,
16]. Strategies that have been used include wireless sensor networks for precision agriculture [
17], the control of a greenhouse ventilation system with a field gate programmable array [
18], a hybrid controller predictive of nocturnal greenhouse temperatures [
19], the optimal control of climatic conditions in a greenhouse using minimal energy and grower defined bounds [
20], and an irrigation remote monitoring system based on ZigBee [
21].
Here, a fully automated system for monitoring and control of climate variables of a greenhouse is proposed. For this purpose, a fuzzy controller was implemented in the Arduino open source platform, which offers the possibility of sharing, modifying, and studying the source code of a computer system [
22]. Arduino has been the core of numerous projects under the philosophy of rapid prototyping; allowing students and advanced programmers to design applications in robotics, education, the Internet of Things, precision agriculture, and the construction of low-cost scientific instruments [
23]. The main reasons why Arduino technology was selected consist in its low cost, its cross-platform compatibility, and its easy-to-use development environment with free and extensible software through C libraries.
The main novelty of this paper is the development of a user-friendly web interface that works in conjunction with low-cost Arduino tools to allow any user to manually or automatically control environmental variables of a greenhouse. In addition, the main motivation of this project is to replicate the results obtained with the prototype of the greenhouse on the experimental farm of the Universidad del Magdalena, so that the consumption of water and electricity in different types of crops can be optimized.
This paper is structured as follows:
Section 2 presents the hardware design in each stage of the greenhouse.
Section 3 describes the design and implementation of the fuzzy controller.
Section 4 presents the web interface for remote communication with the control system.
Section 5 shows the results obtained with the control system for the environmental variables of the relative humidity, temperature, and soil moisture of a gable roof greenhouse. Finally,
Section 6 presents a discussion of the results, which are contrasted with the results of other investigations. In addition, we present improvements that can be made in future work.
2. Hardware Design
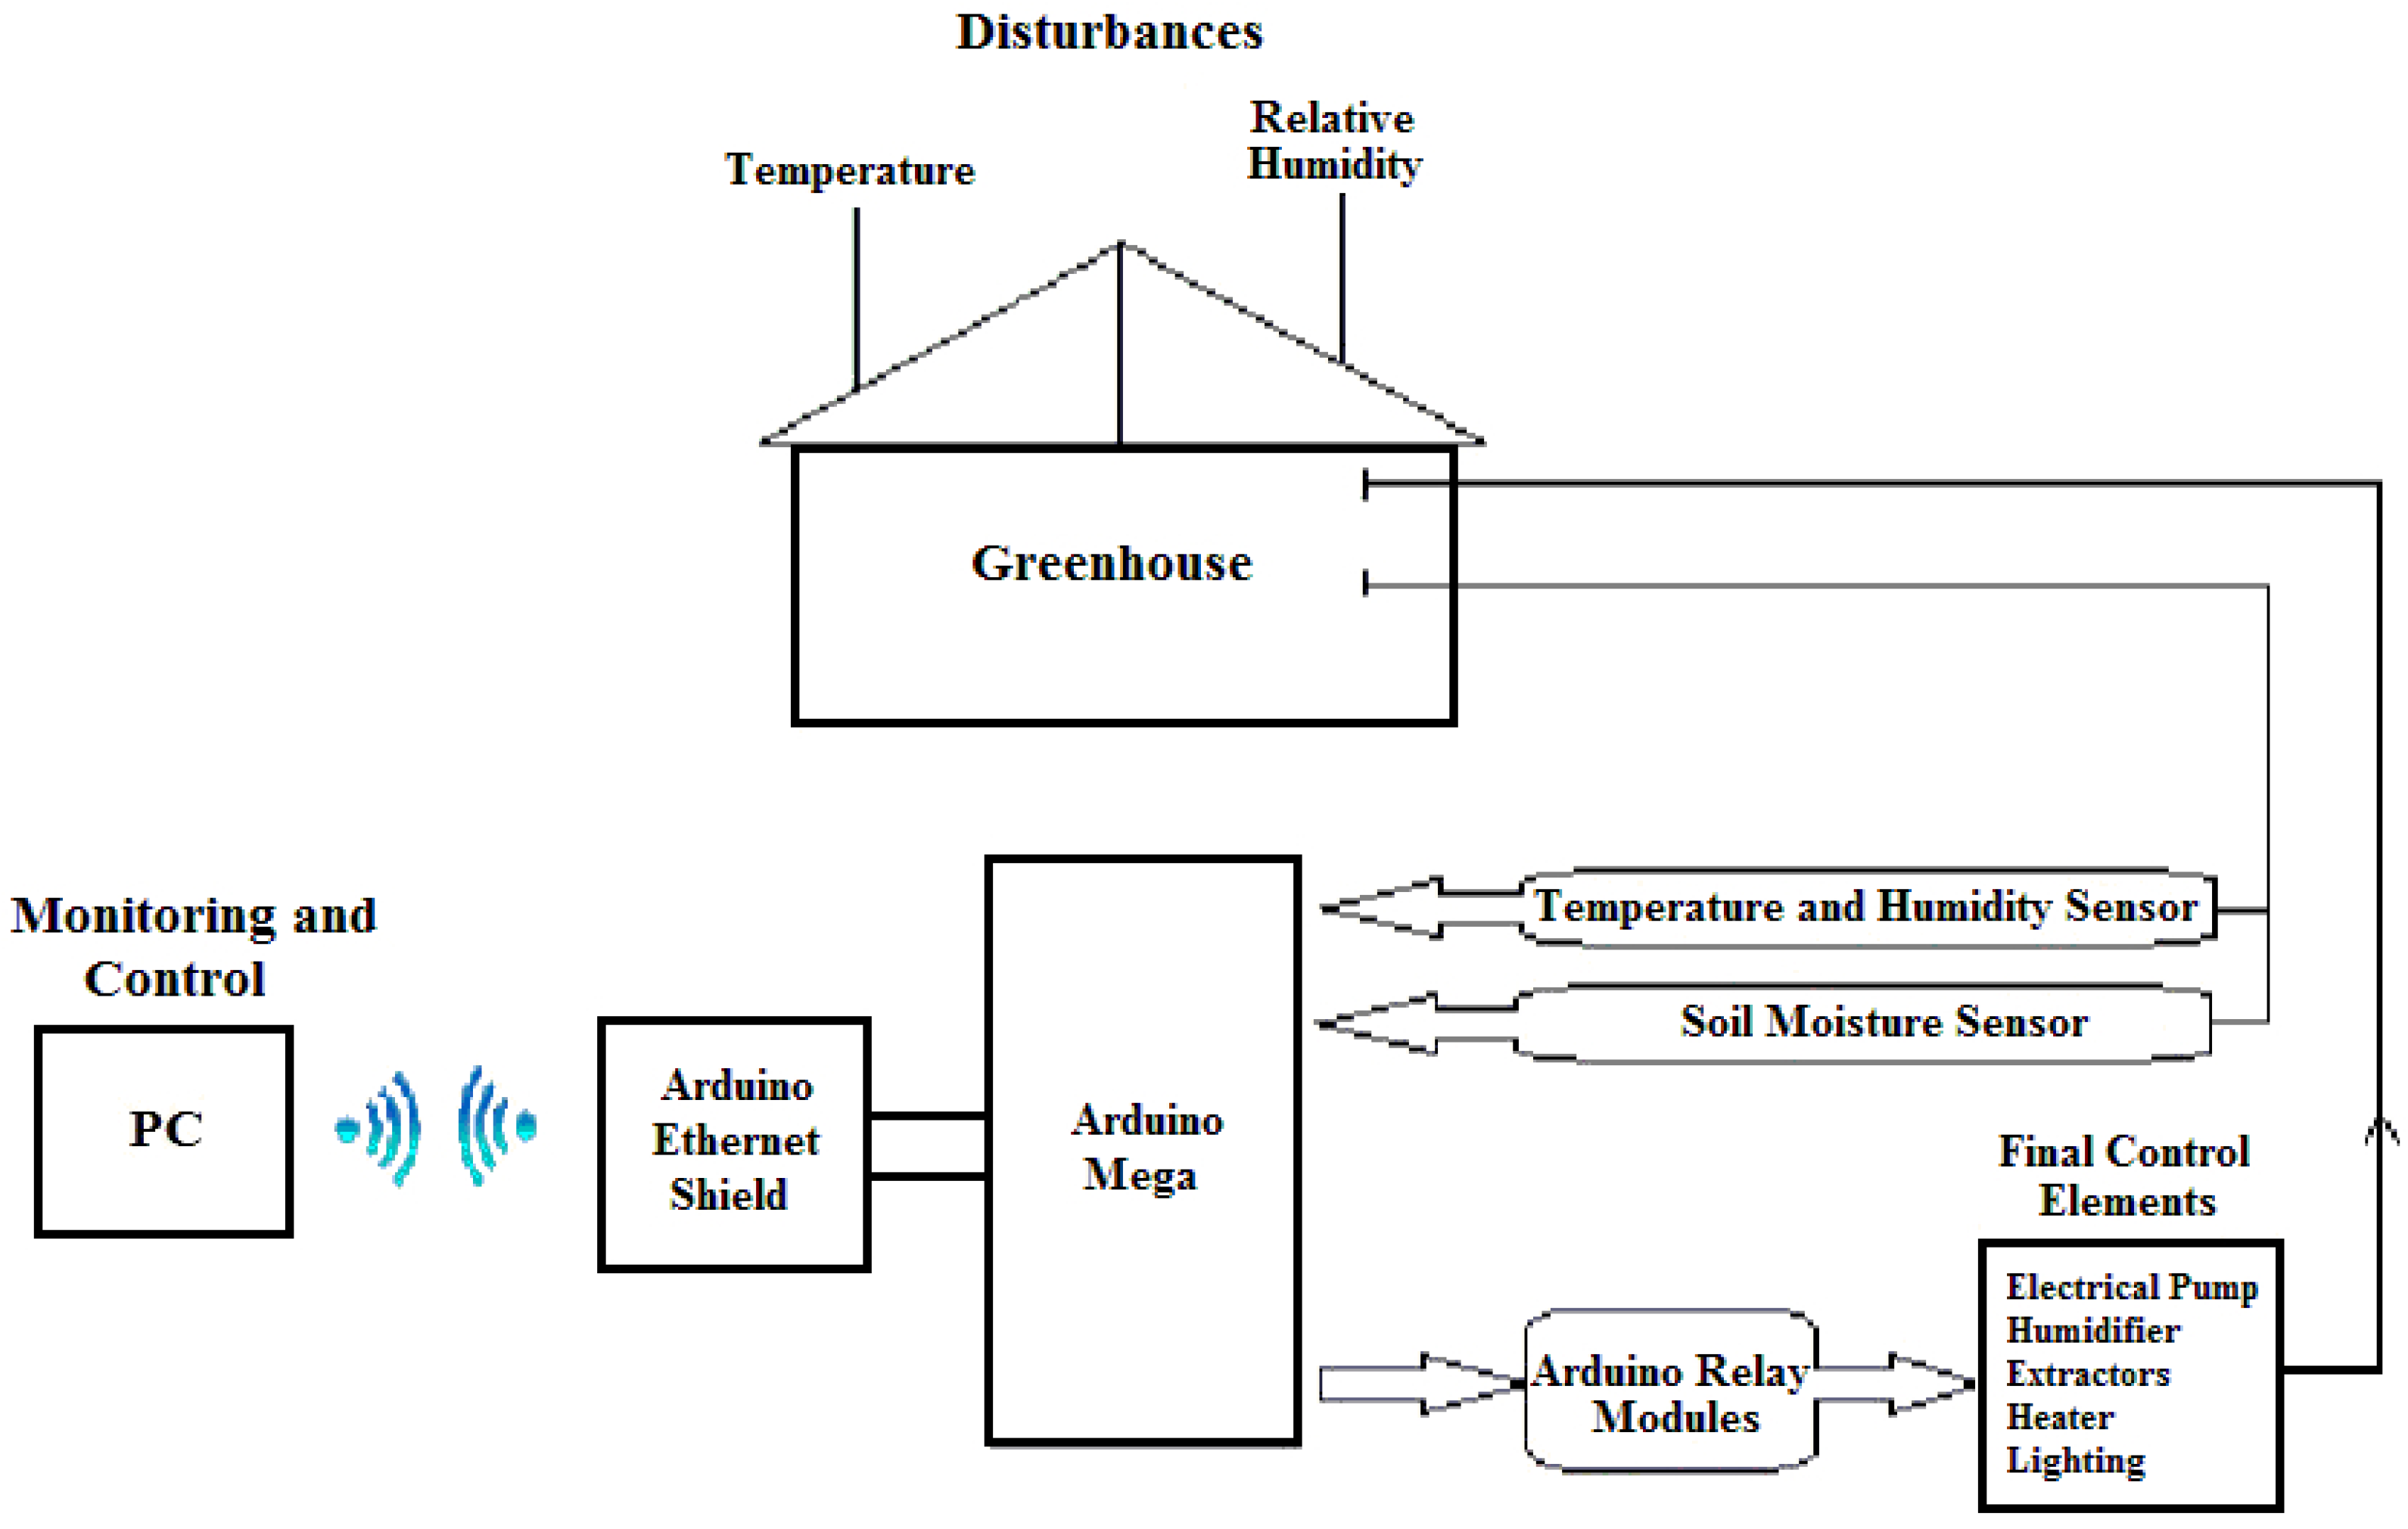
Figure 1 is the block diagram of the system that was implemented to control the temperature, relative humidity, and soil moisture in the greenhouse.
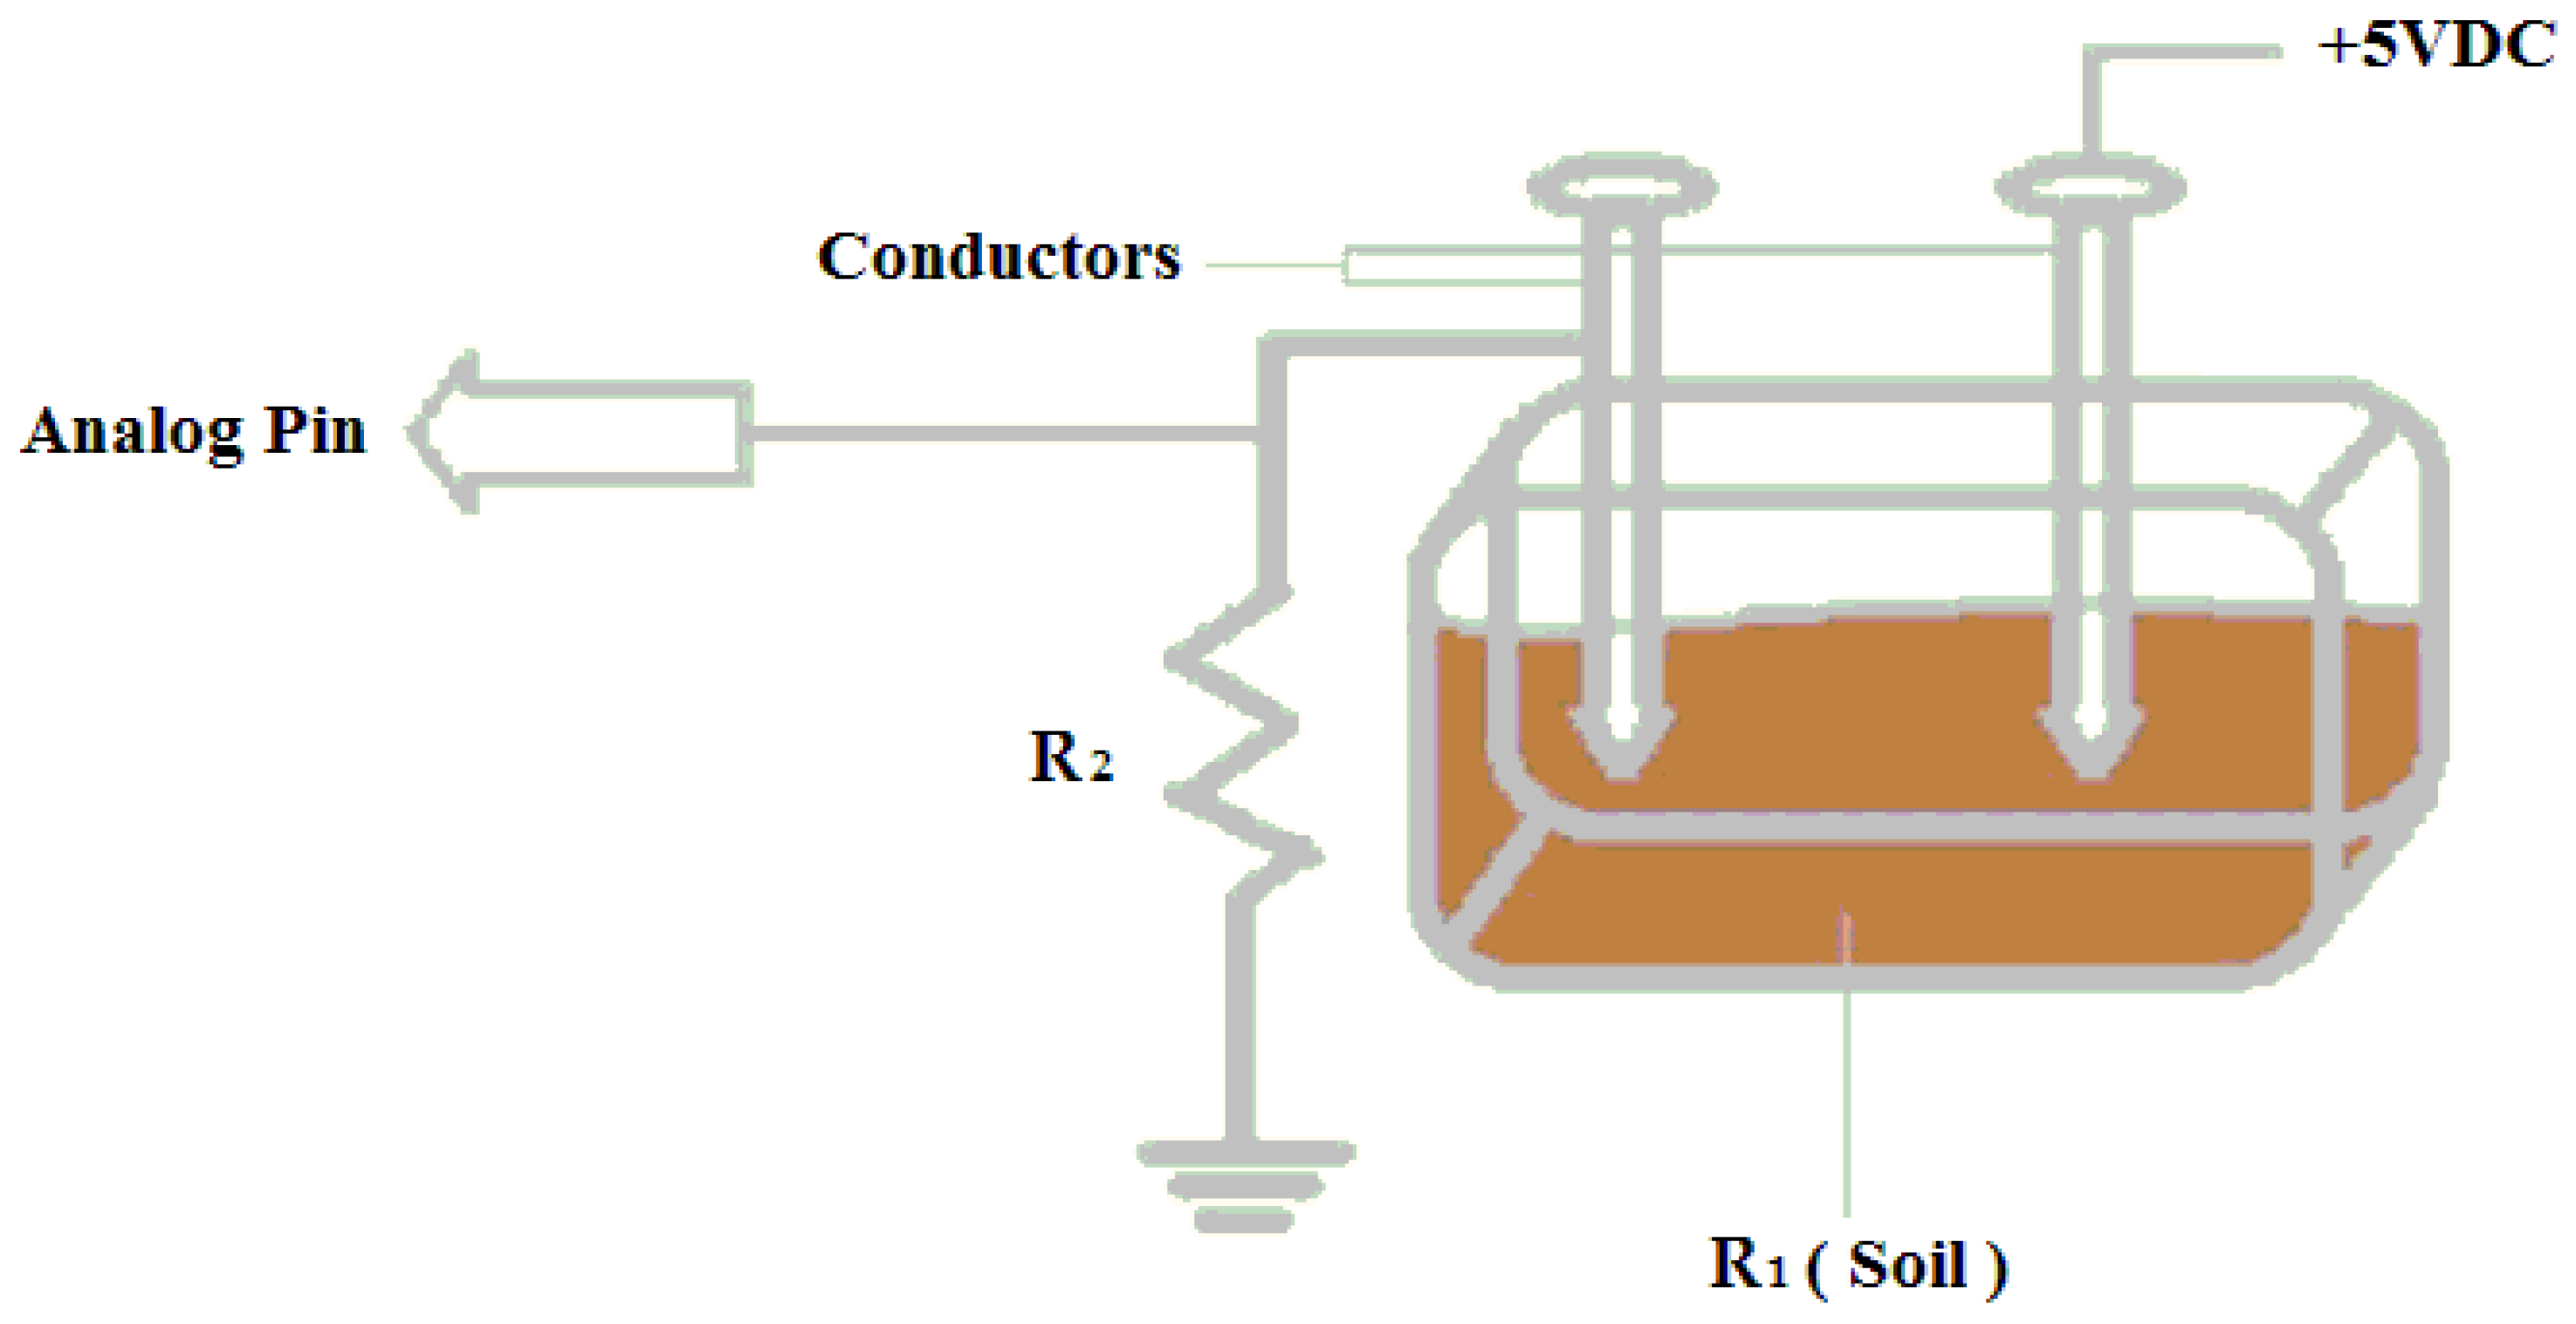
2.1. Soil Moisture Sensor
To measure this variable, a sensor based on resistive properties of the soil and a voltage divider was designed using two conductors to monitor the area under study (
Figure 2). Through the configuration presented, it was possible to obtain an analog reception depending on the soil moisture, as shown in Equation (1).
When the soil is moist, resistor R1 decreases, so the output voltage increases; on the contrary, if the soil is dry, R1 increases, resulting in a lower output voltage. It is noteworthy that the sensor was calibrated using experimental tests.
2.2. Temperature and Humidity Sensor
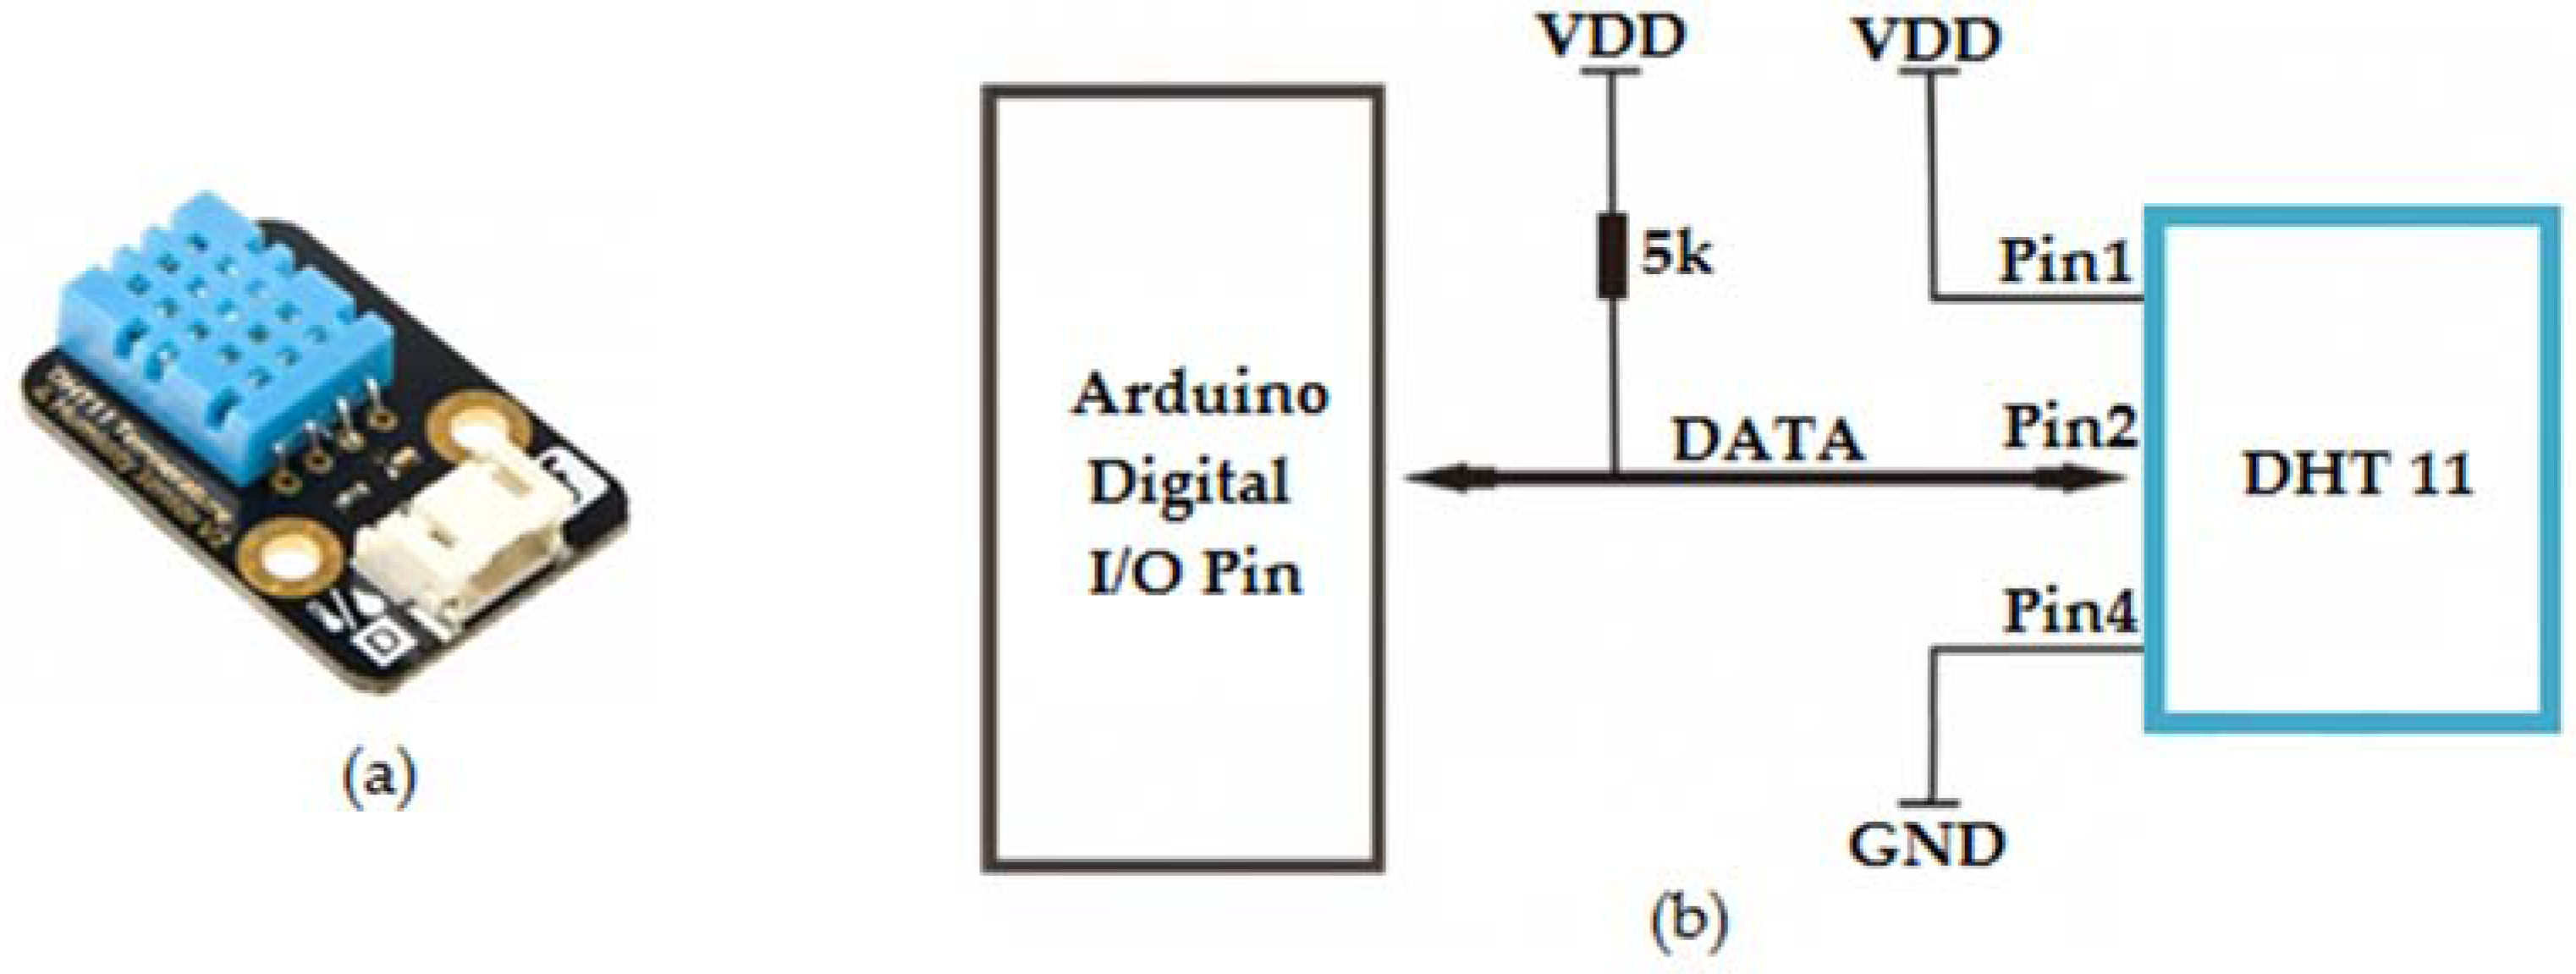
A DHT11 sensor (Adafruit, New York City, USA), which delivers a digital output dependent on temperature and relative humidity, was used, ensuring high reliability and excellent long-term stability. A single-wire protocol was implemented to transmit data in packets of 8 bits with a time of initial communication of 4 ms.
Figure 3 shows the DHT11 sensor and the connection to the Arduino.
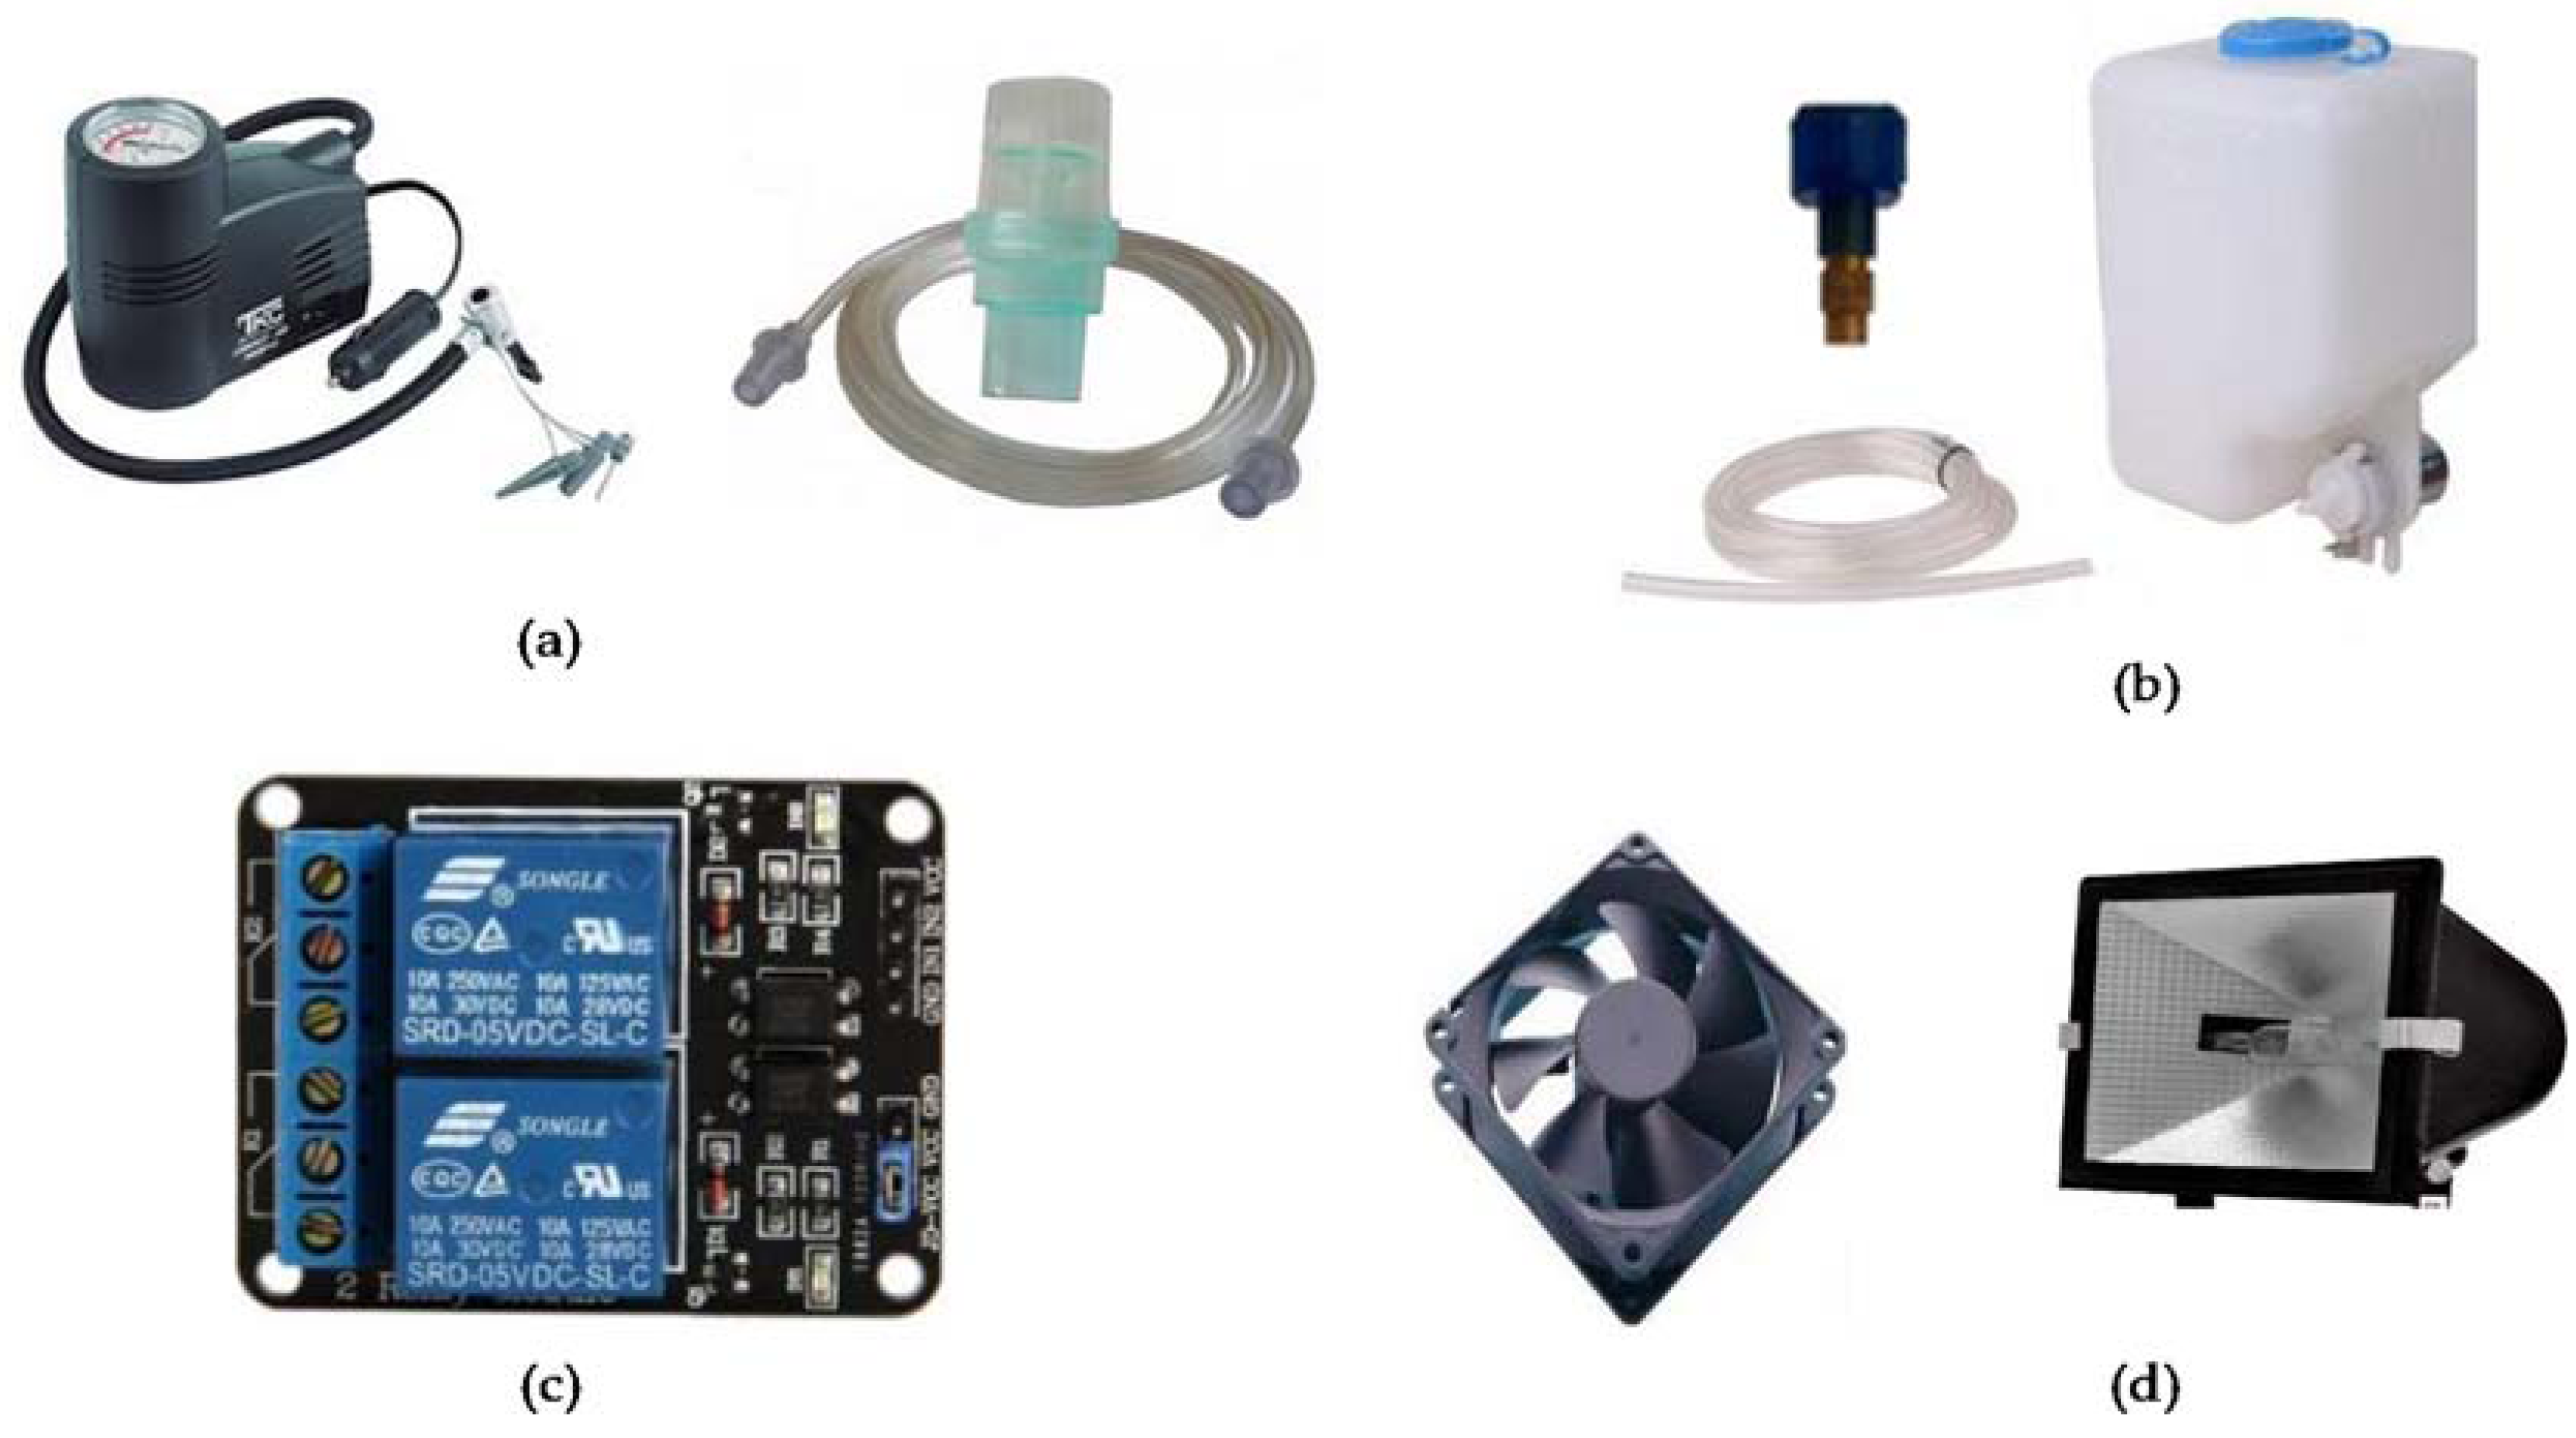
2.3. Forced Ventilation System
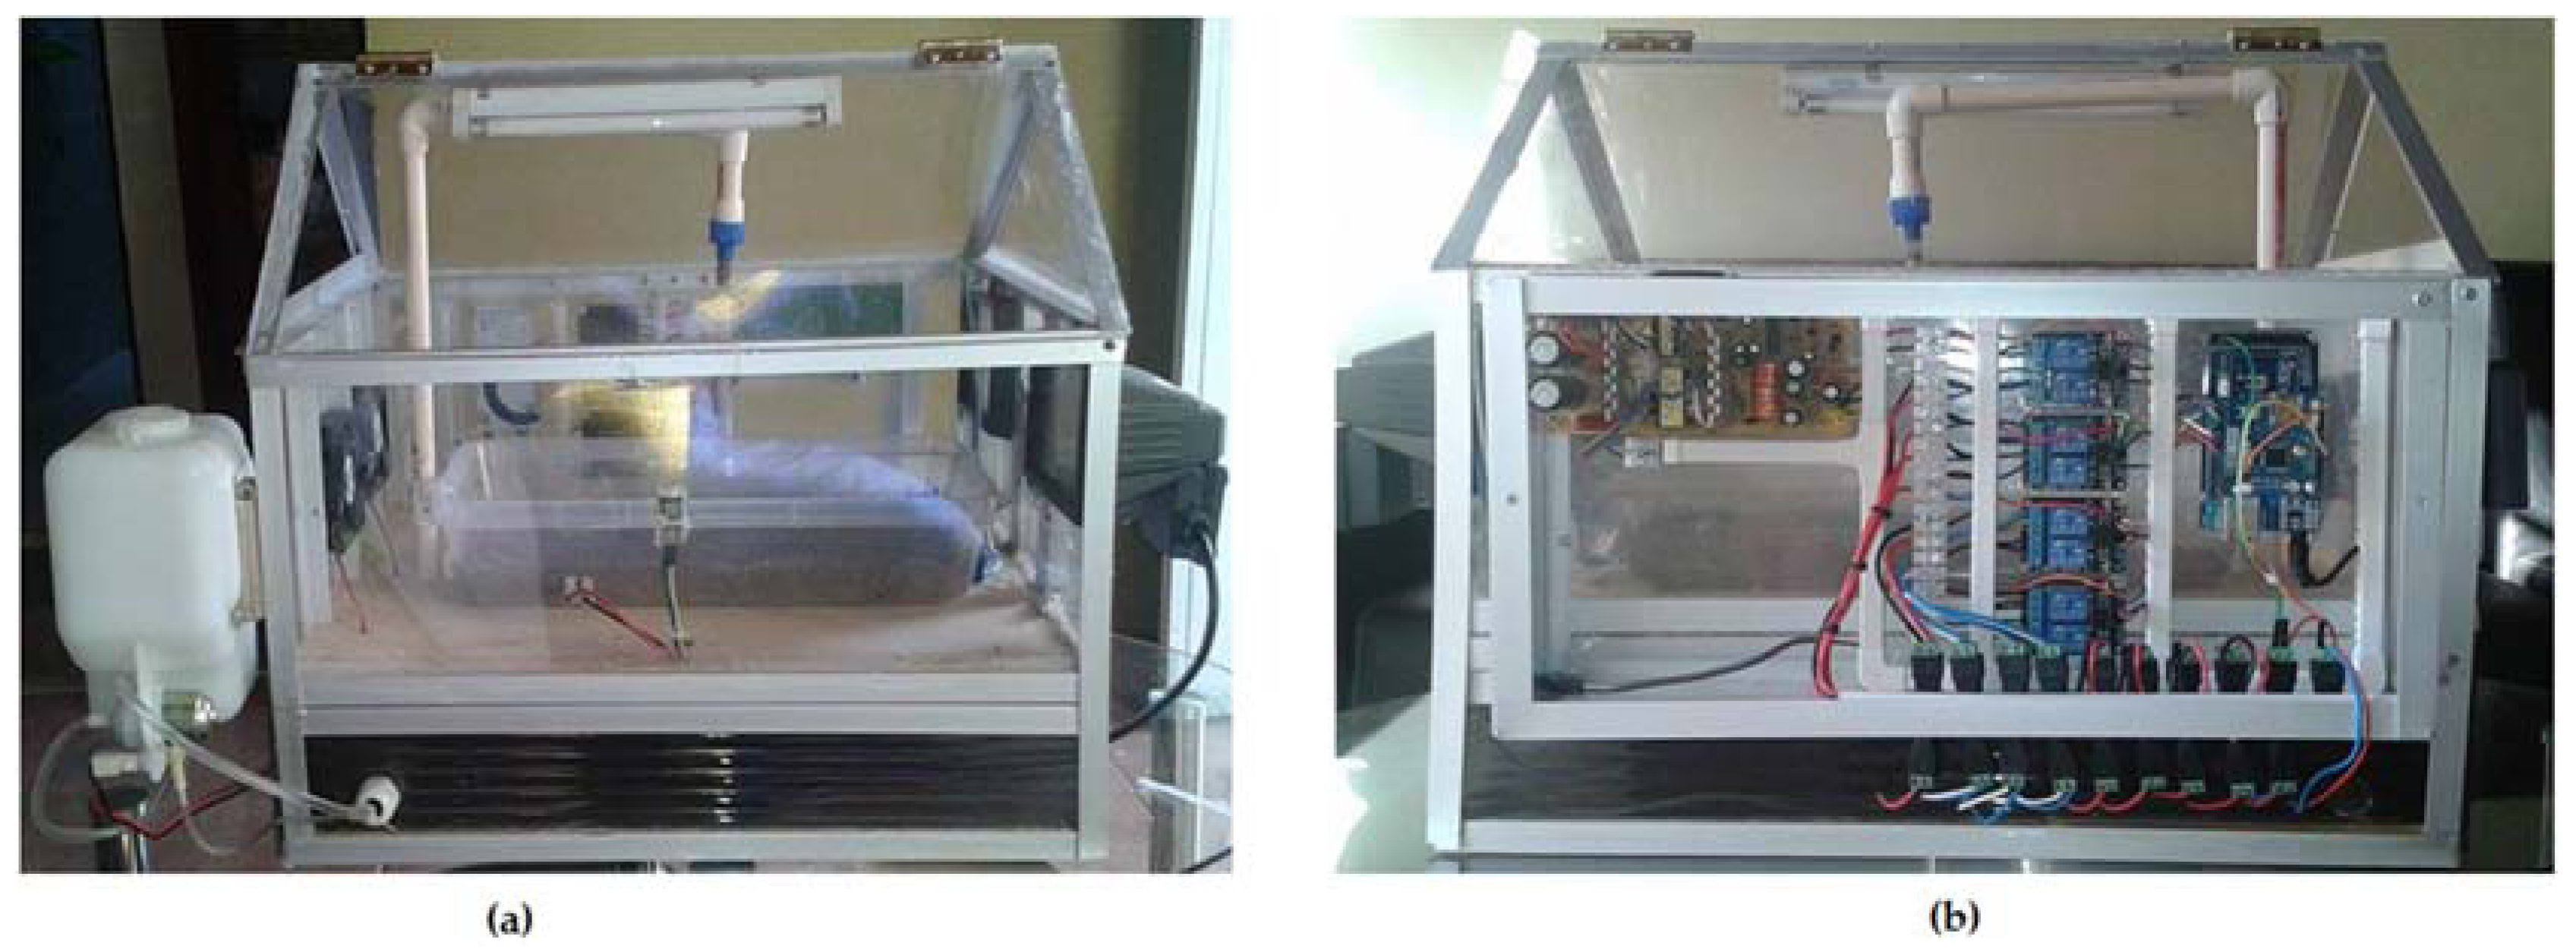
This final control system consists of two DC fans responsible for generating an airflow that enters the greenhouse. Furthermore, an additional extractor whose function is to extract hot air from the prototype was implemented. With these extractors, air renewal takes place inside the greenhouse, contributing to the decrease in temperature. The DC fans have the following specifications: (voltage: 12 V; current: 290 mA; power: 3.48 W; speed: 2200 rpm; dimensions: 120 mm × 120 mm × 25 mm).
2.4. Nebulization and Dehumidification System
A humidification system consisting of an air compressor of 2068.4 kN/m2 to 12 V DC and a medical nebulization kit was implemented. This system introduces air forcedly into the metering chamber, which has an outlet orifice through which the pressurized air is released, keeping spraying water to a minimum. The system consists of two nebulizers nozzles connected in parallel to the air outlet compressor.
To decrease the relative humidity, a system of forced ventilation and halogen lamps were used, generating a decrease in relative humidity by raising the temperature and exchanging the air inside the greenhouse.
2.5. Irrigation System
A sprinkler irrigation system with a water storage tank, an electric pump 12 V DC, a hose, and a sprayer nozzle was implemented. The flow delivered by the irrigation system was 4 cm3 of water per unit of time in seconds. This amount is sufficient for optimum wetting according to the volume of soil used.
For the final control elements, the Arduino two-channel relay module with optically isolated inputs with respect to the digital outputs of the microcontroller was implemented. To raise the temperature of the greenhouse, a pair of halogen lamps located in the rear of the prototype was used. Similarly, a fluorescent lamp of 6 W at 110 V AC was used for the lighting mechanism.
Figure 4 shows the components used for the irrigation system.
3. Fuzzy Logic Controller Design
3.1. Programming Arduino Mega Board
The entire programming prototype was implemented on the development board Arduino Mega because of its low cost, its small size, its simple programming environment, its variety of libraries, and its memory capacity [
24,
25]. Furthermore, Arduino is an open source platform, which means that any additional costs for the payment of licenses are avoided.
Table 1 shows some of the Arduino Mega technical specifications.
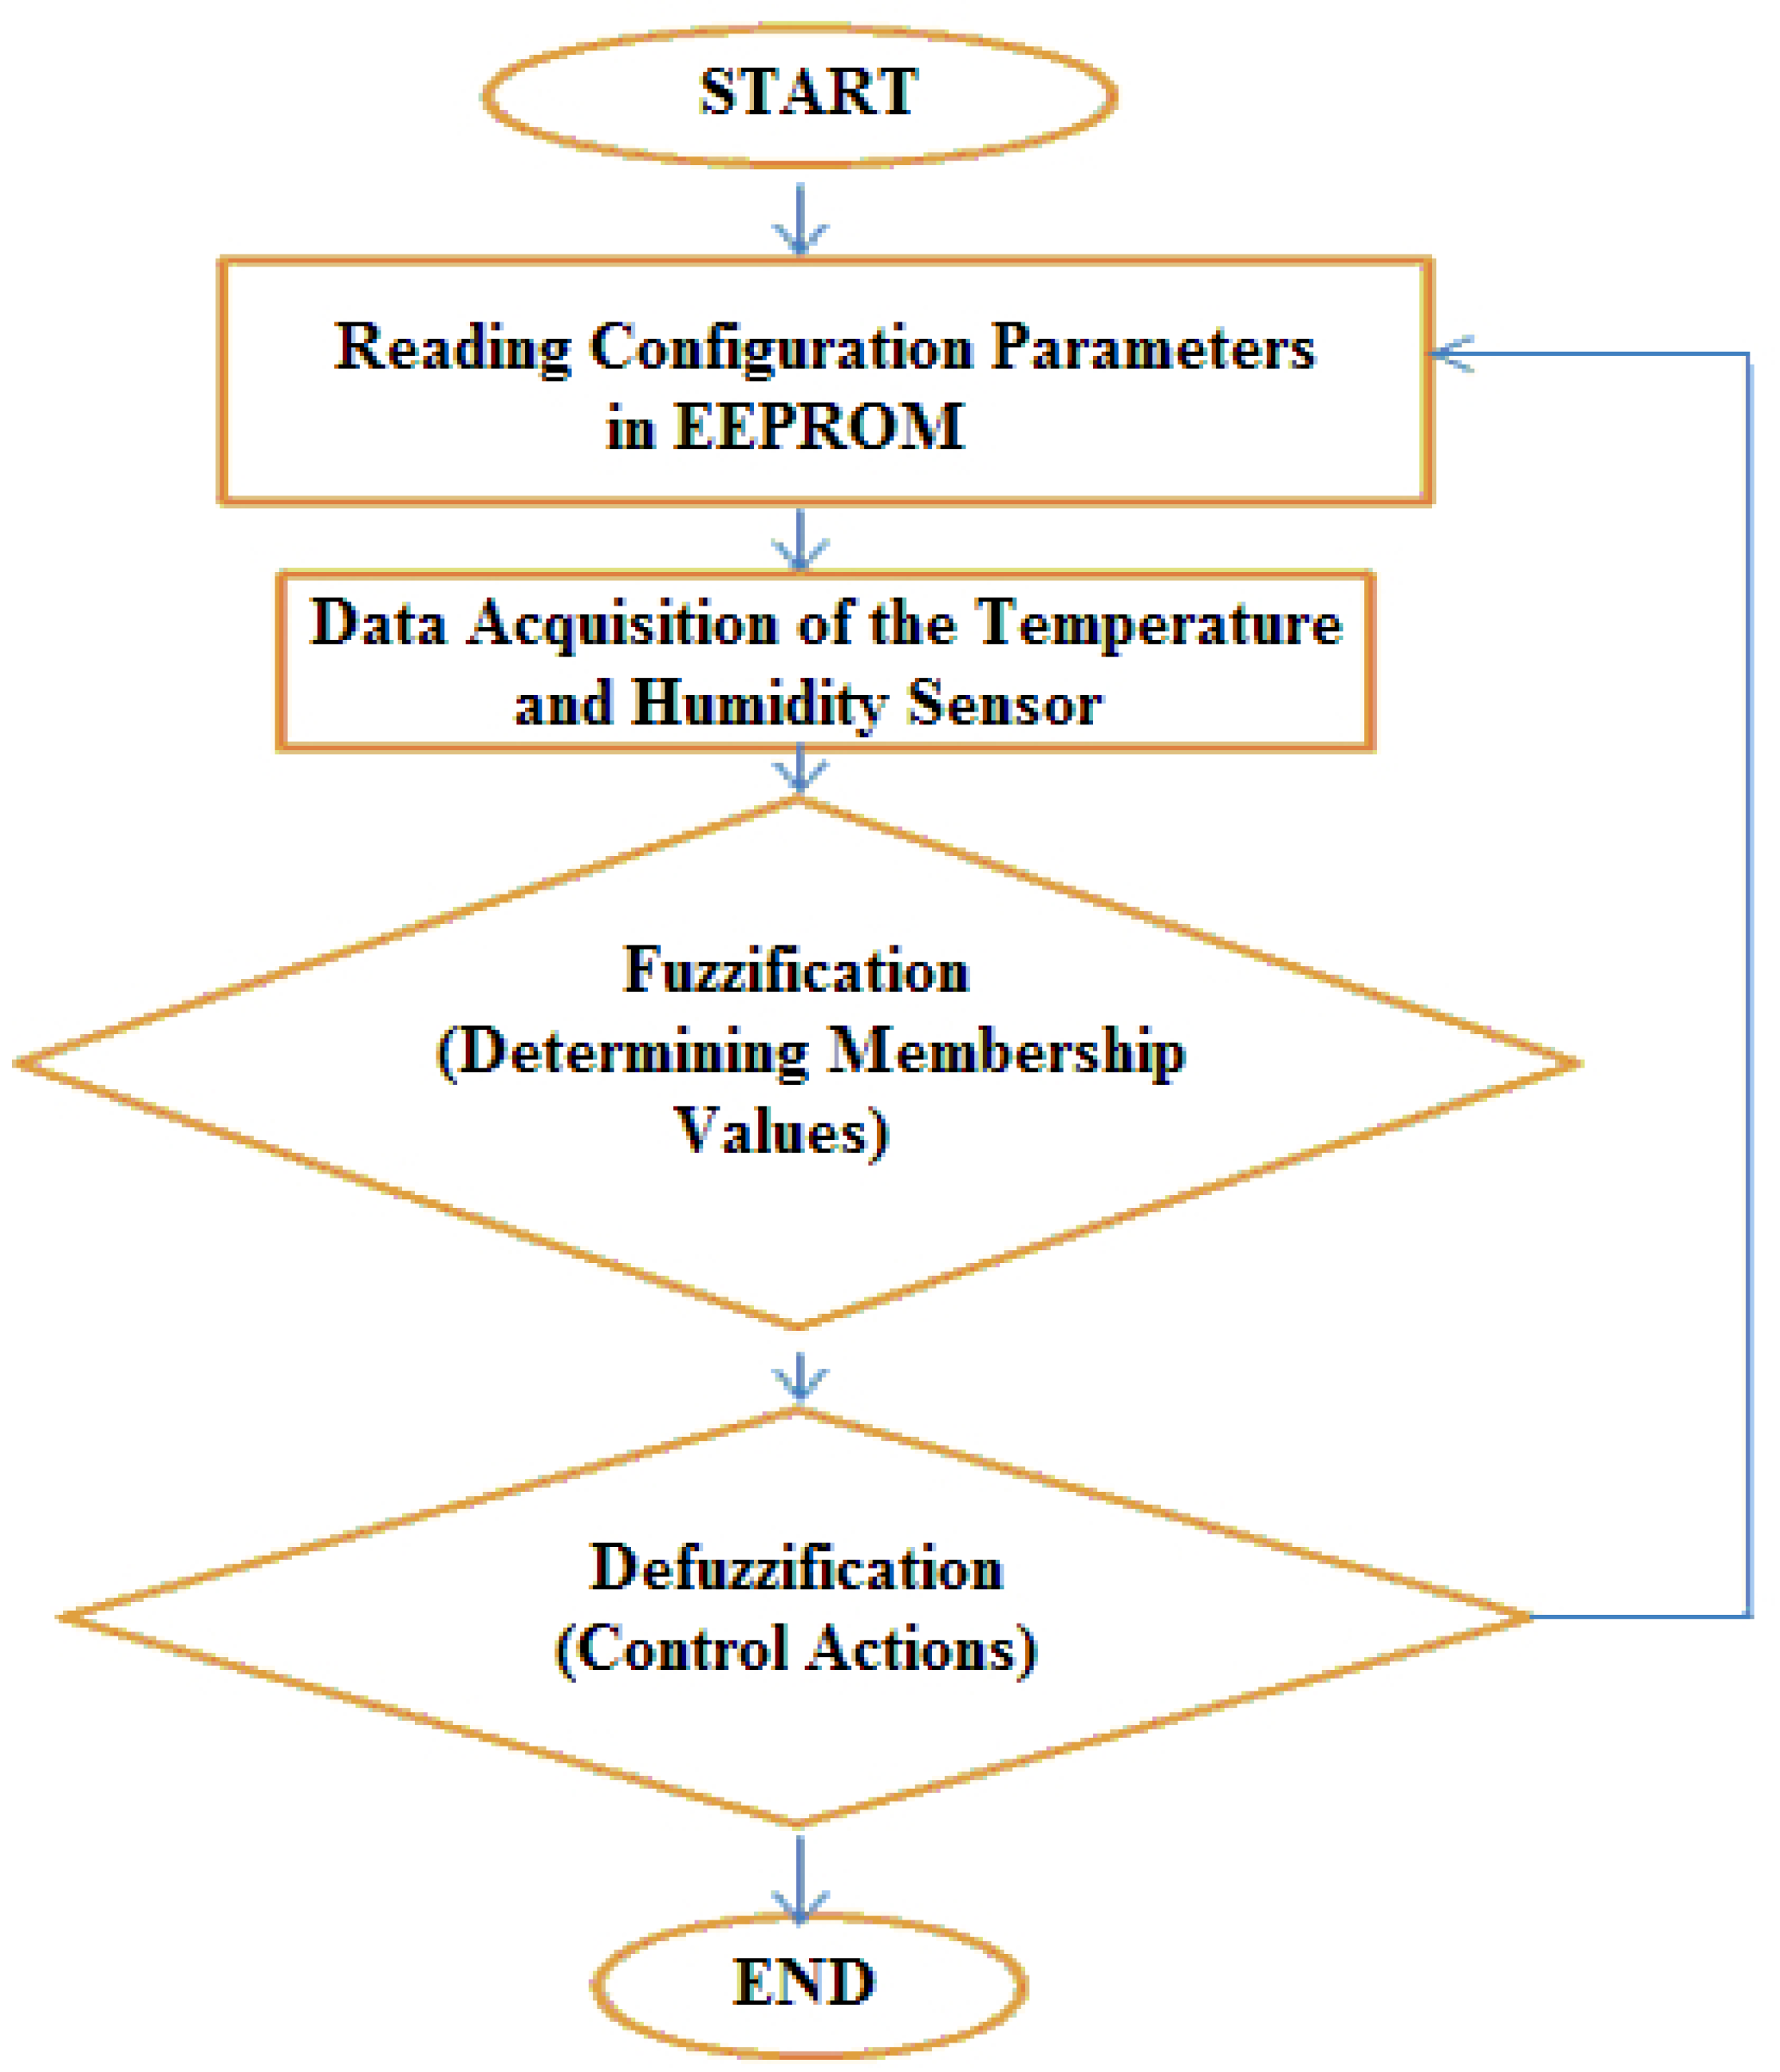
Figure 5 shows the flowchart of the fuzzification and defuzzification processes for temperature and relative humidity. For the irrigation and lighting stages a similar process was used.
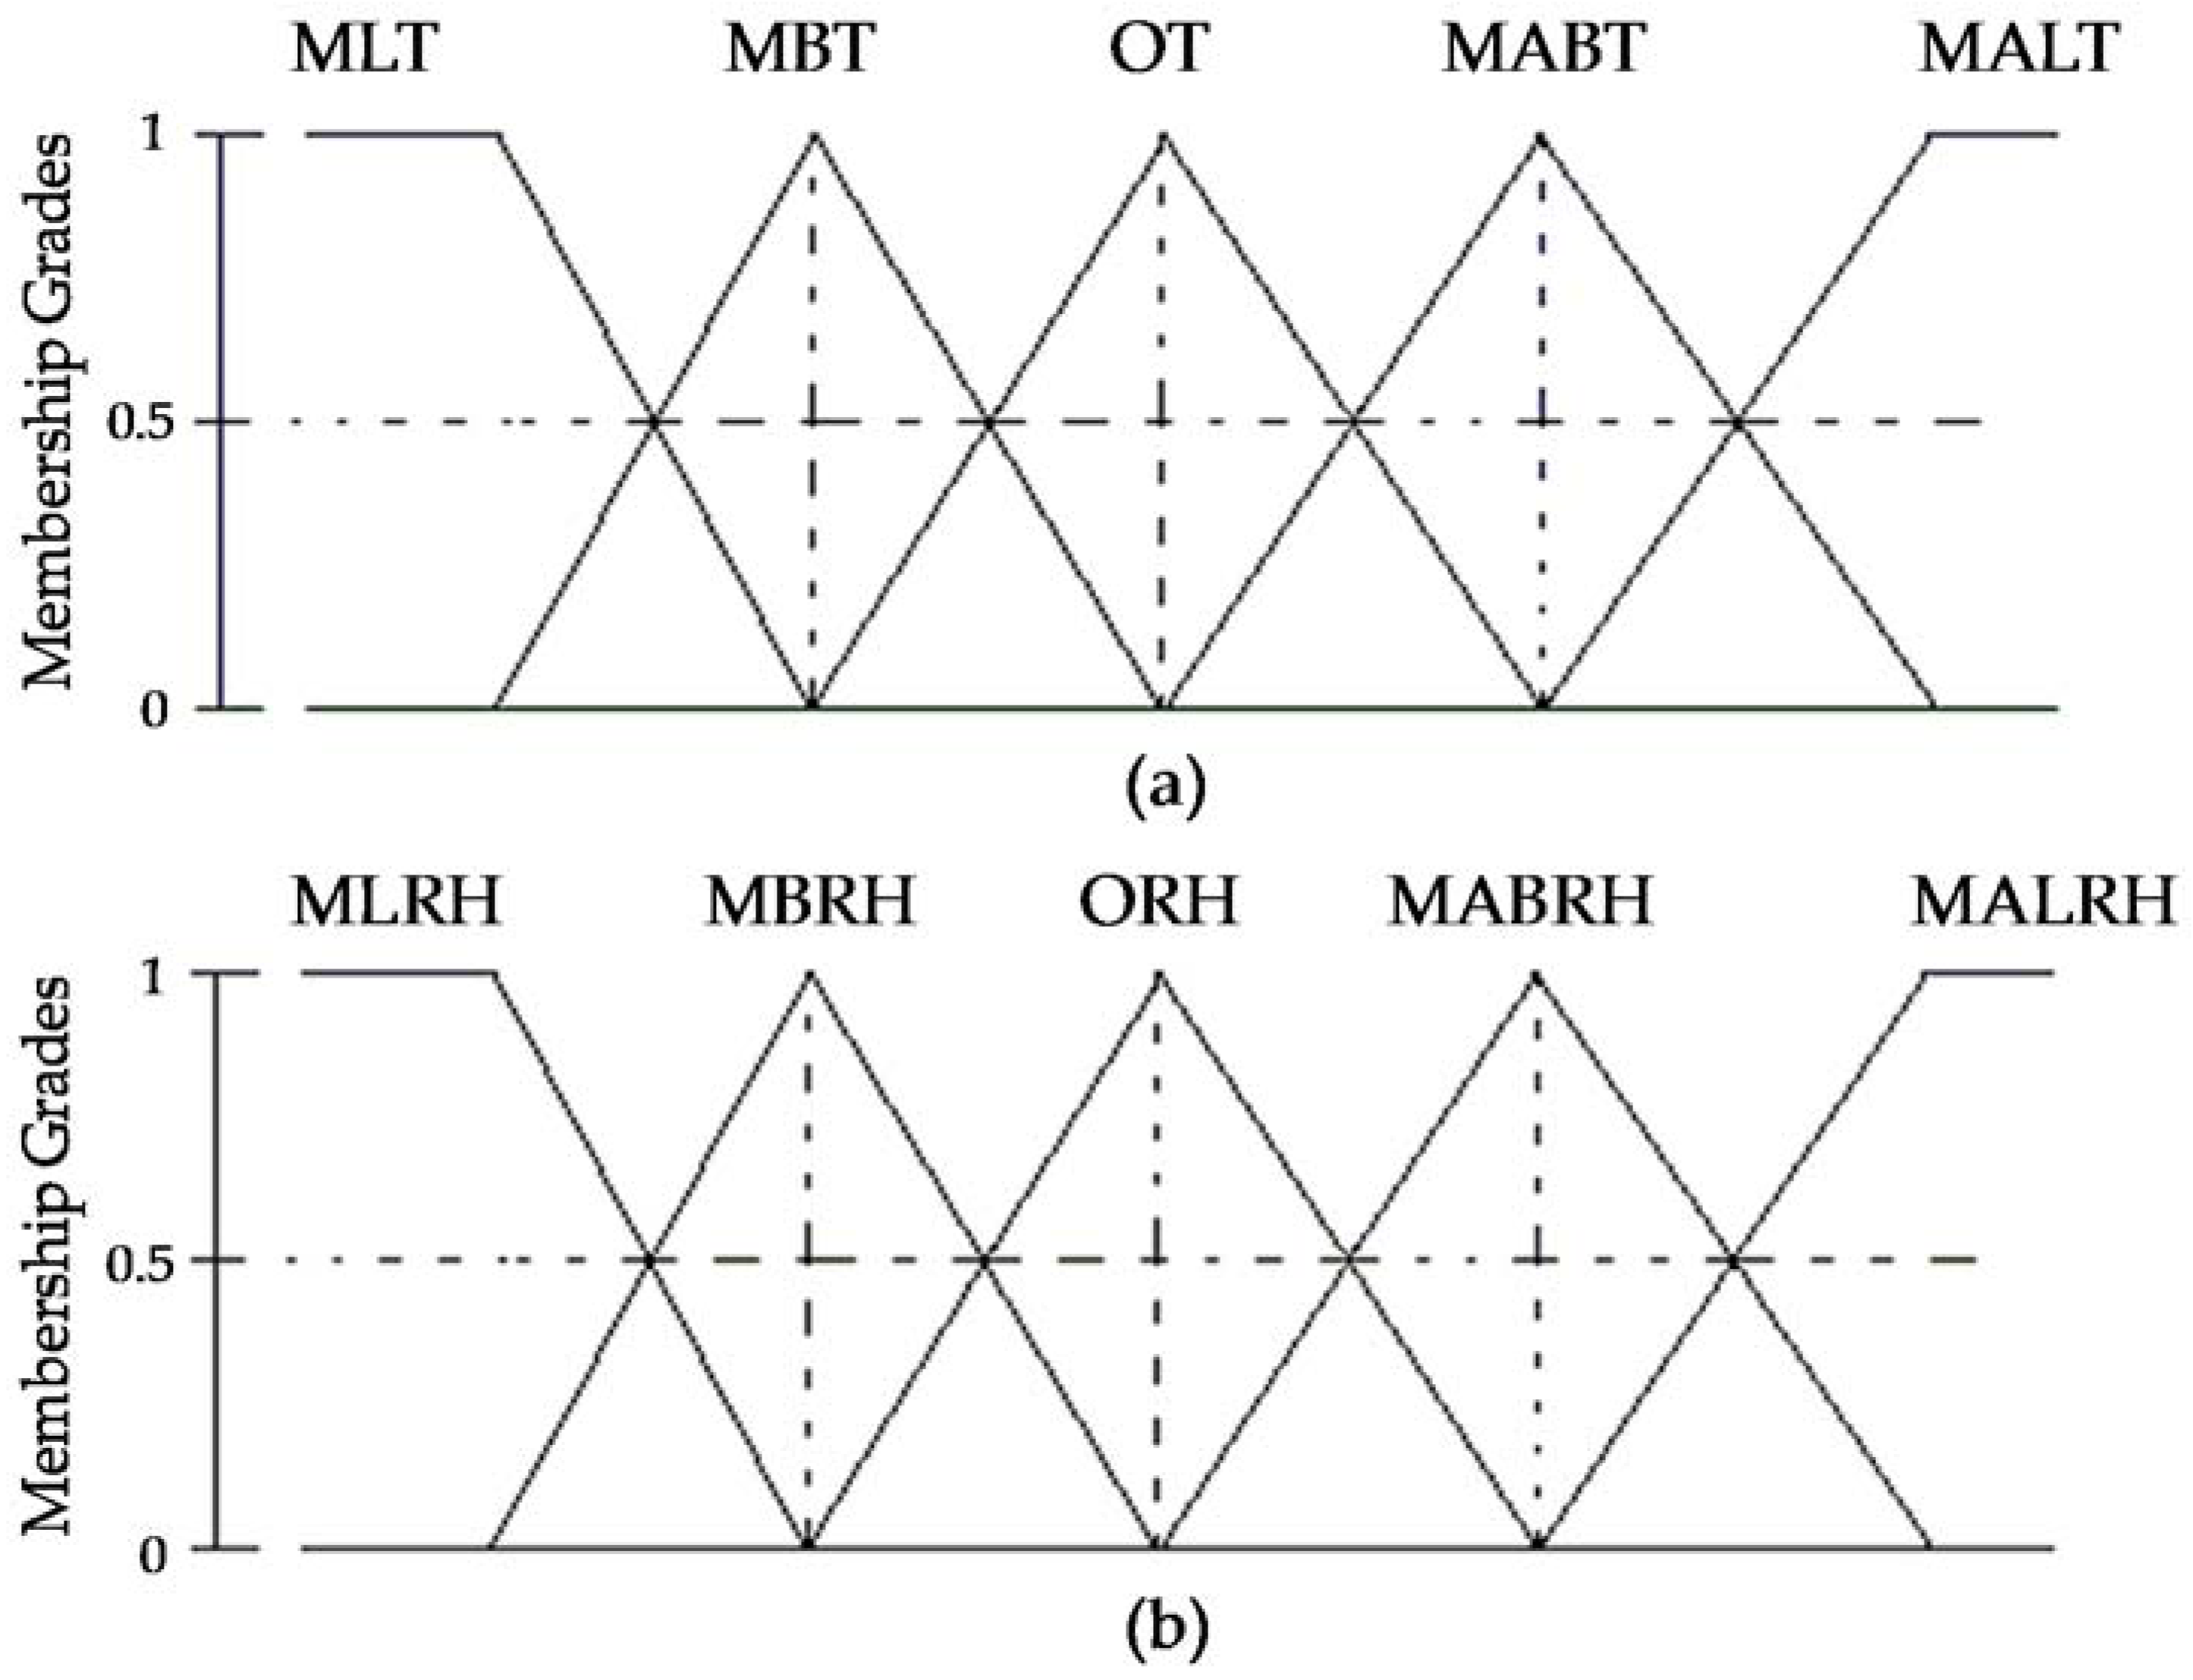
3.2. Fuzzification
Ten fuzzy sets for defining levels related to the input variables were identified. The linguistic values used for membership functions are MLT (Minimum Lethal Temperature), MBT (Minimum Biological Temperature), OT (Optimum Temperature), MABT (Maximum Biological Temperature), MALT (Maximum Lethal Temperature), MLRH (Minimum Lethal Relative Humidity), MBRH (Minimum Biological Relative Humidity), ORH (Optimum Relative Humidity), MABRH (Maximum Biological Relative Humidity), and MALRH (Maximum Lethal Relative Humidity).
For the representation of membership functions, triangular shapes were used because they have a central optimal value that is lost as the study variable increases or decreases, affecting the degree of membership, which is between 0 and 1.
Figure 6 represents fuzzy sets of temperature and relative humidity in the triangular function. As shown in
Figure 6, linguistic labels representing qualitative measurement values delivered by sensors of the greenhouse were created. To ensure a membership range between 0 and 1, a normalization process is made according to parameters set by the user on the website.
Membership ranges of temperature and relative humidity are determined by Equation (2) from the set point and the current value of the sensors.
When the sensors deliver values above the set point, Equation (3) was used to ensure the range in degrees of membership.
Table 2 shows the membership functions and generic ranges of the fuzzy variables.
3.3. Fuzzy Inference System
Once the fuzzy inputs were defined, each input variable with an inference mechanism was evaluated. Fuzzy variables were obtained, from which the control actions represented by the following parameters were established: FEMP (Front Extractor at Medium Power), FEMAP (Front Extractor at Maximum Power), REMP (Rear Extractor at Medium Power), REMAP (Rear Extractor at Maximum Power), HMP (Humidifier at Medium Power), HMAP (Humidifier at Maximum Power), HEMP (Heater at Medium Power), HEMAP (Heater at Maximum Power), and OS (Off System).
By applying the fuzzy associative matrix, possible combinations of antecedents were obtained with consequent variables, determining control actions for each climatic situation inside the greenhouse. This procedure was applied to define the 11 fuzzy if–then rules shown in
Table 3.
The Mamdani controller was used with the centroid defuzzification method. It is important to highlight that the code used to implement the controller was developed by the authors without Arduino libraries.
4. Remote Communication and Web Server
The Arduino Ethernet Shield is used for remote communication between the control system of the greenhouse and the user. This makes it possible to link the data with a router through an IP address that is within the range of addresses unused. Thus, it was possible to incorporate features in the prototype server that allow the user to manipulate the system from anywhere as long as access to the Internet or a local area network is obtained.
For the design of the website, information from Arduino was used as a reference for the web servers, where, using HTML, details are presented to create a web page from analog readings. From sample code, HTML code required to meet the needs of the prototype was annexed.
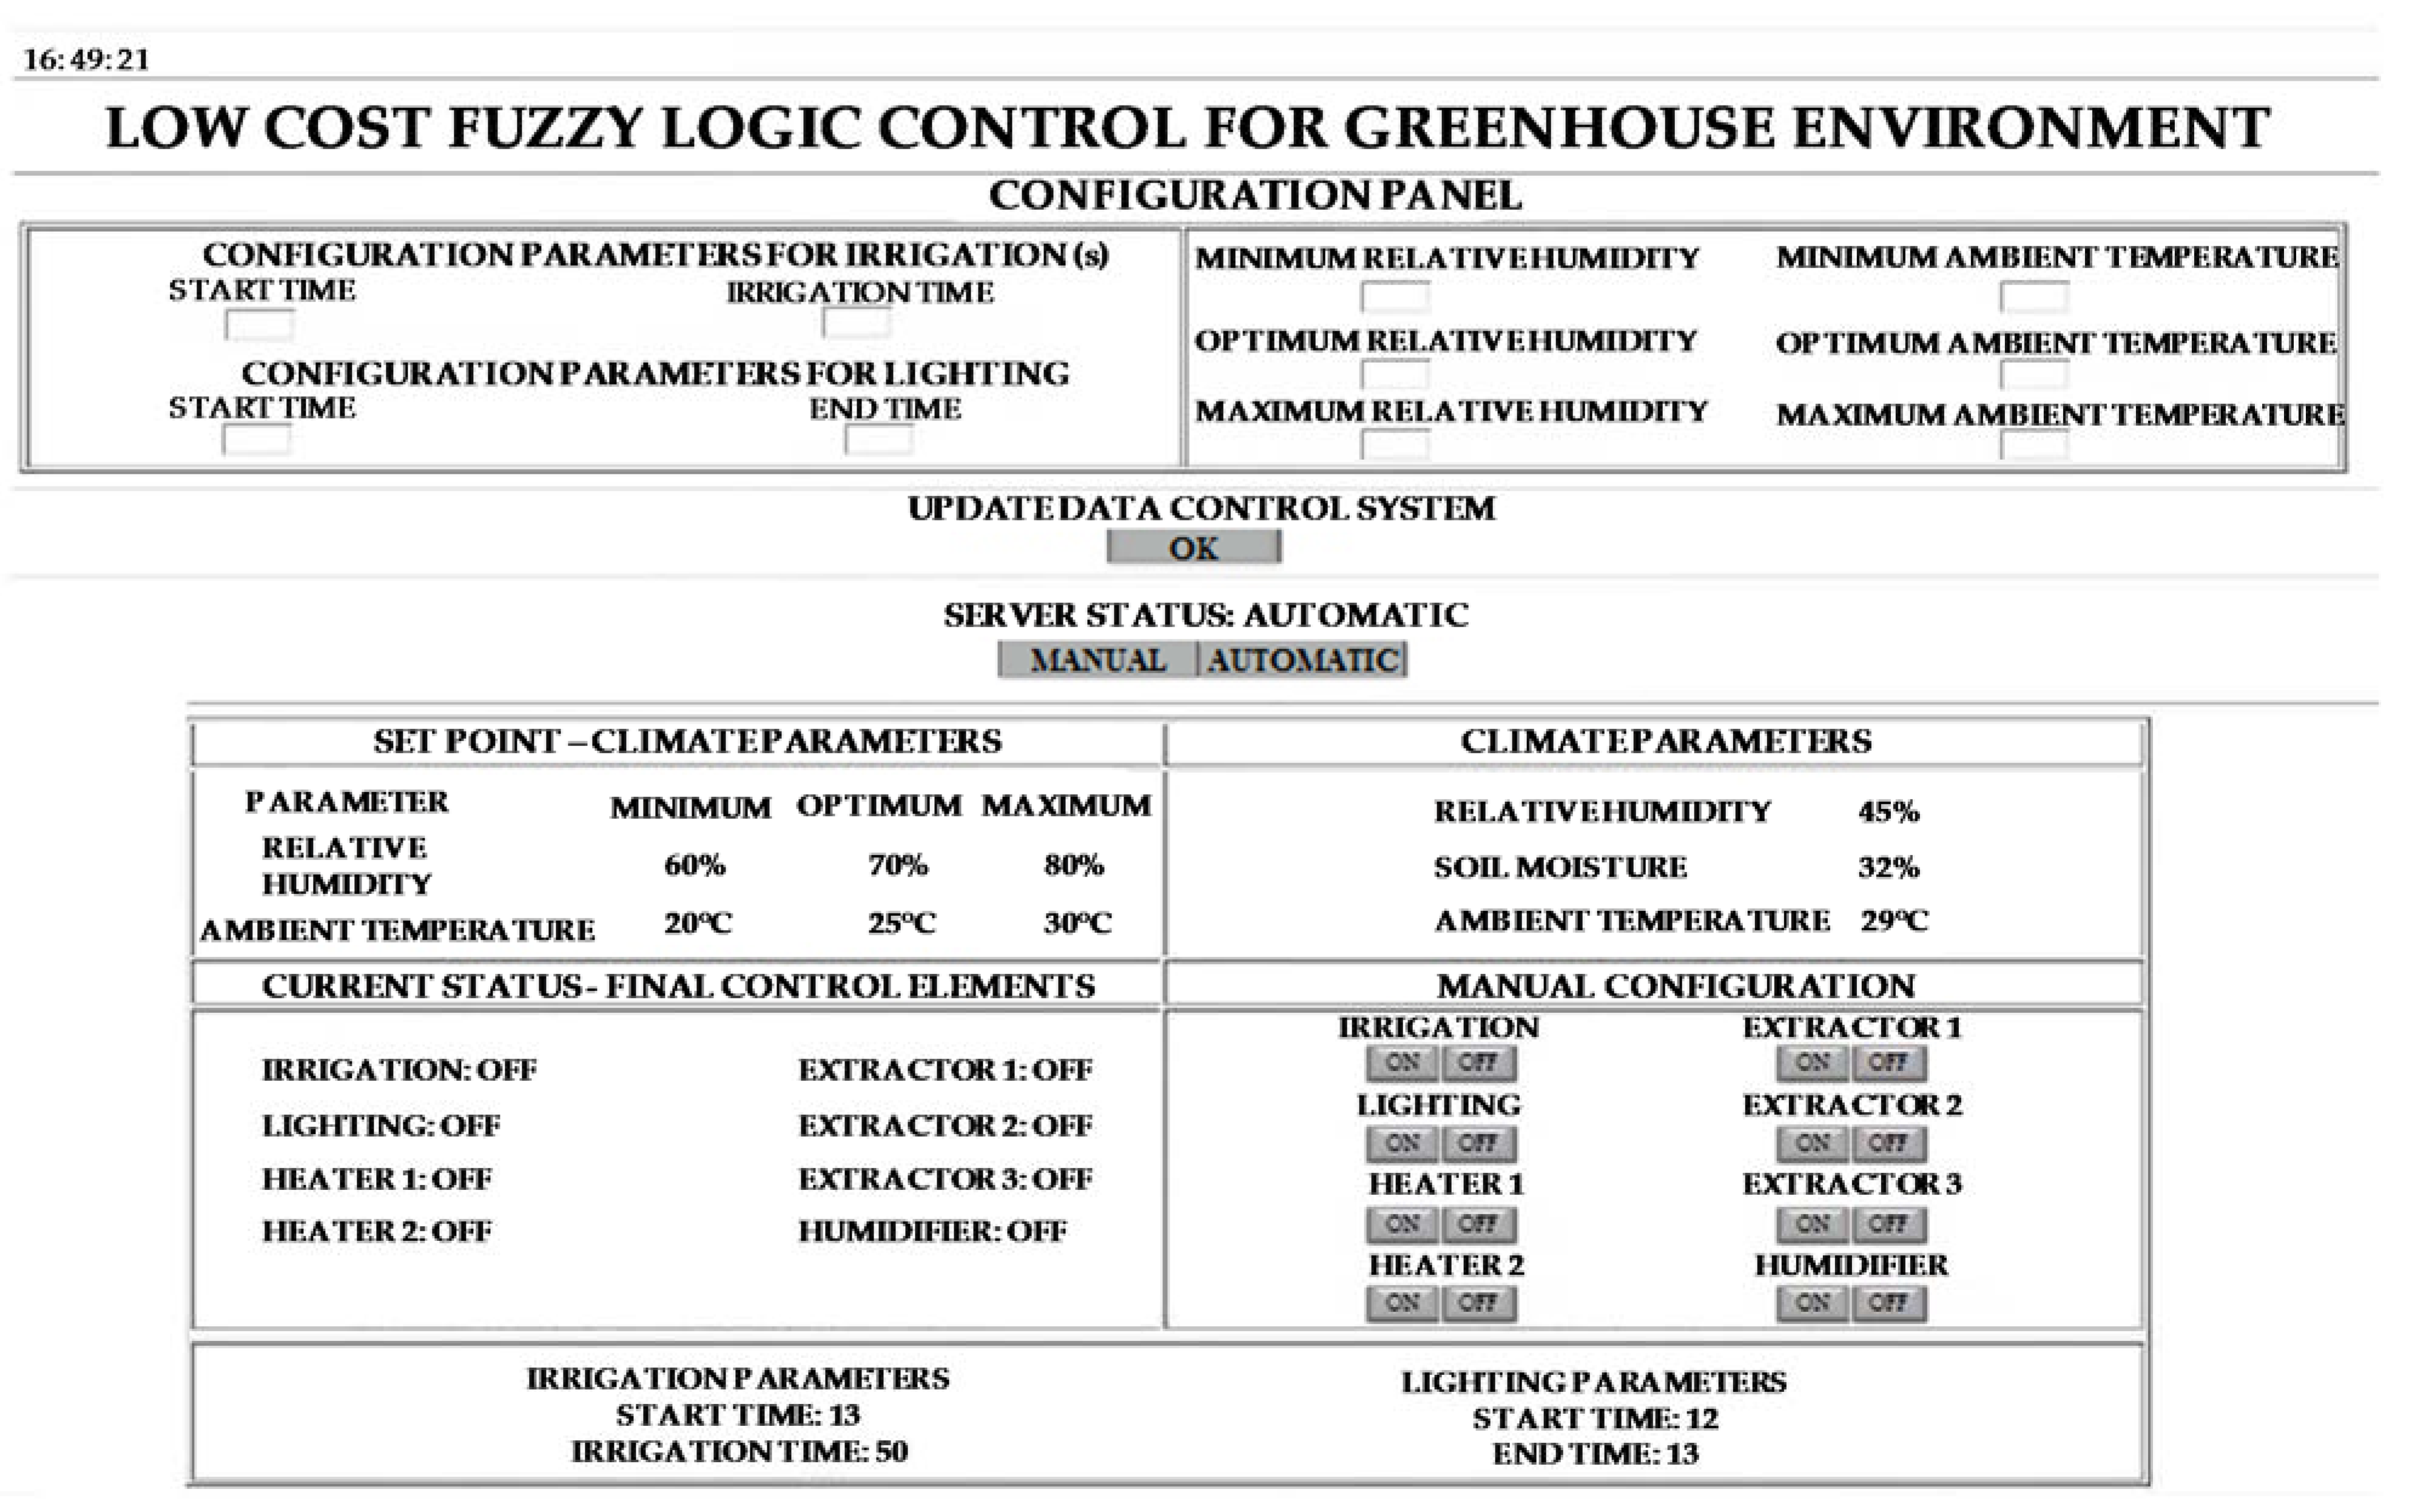
Figure 7 shows the final structure of the website that was developed for the monitoring and control of greenhouses.
Initially, there is a configuration panel where the user can set the start time of irrigation and the time limit of the water supply in seconds. It is also possible to set the start time and end time for cases in which additional lighting in the greenhouse is needed. Similarly, the user can define minimum, optimum, and maximum parameters for temperature and humidity.
Subsequently, the interface allows the definition of server status in automatic or manual modes. In automatic mode, the control system makes decisions based on previously set parameters, disabling manual control. In the set point climate settings, the values set in the configuration panel for relative humidity and temperature are displayed. In the climatic settings box, relative humidity, soil moisture, and temperature measurements, which are obtained in real time from sensors installed in the greenhouse, are displayed. In the current status box, the final control elements are displayed in real time. Finally, in manual mode, the web interface enables the user to activate lighting, irrigation, extractors, humidifiers, and heaters.
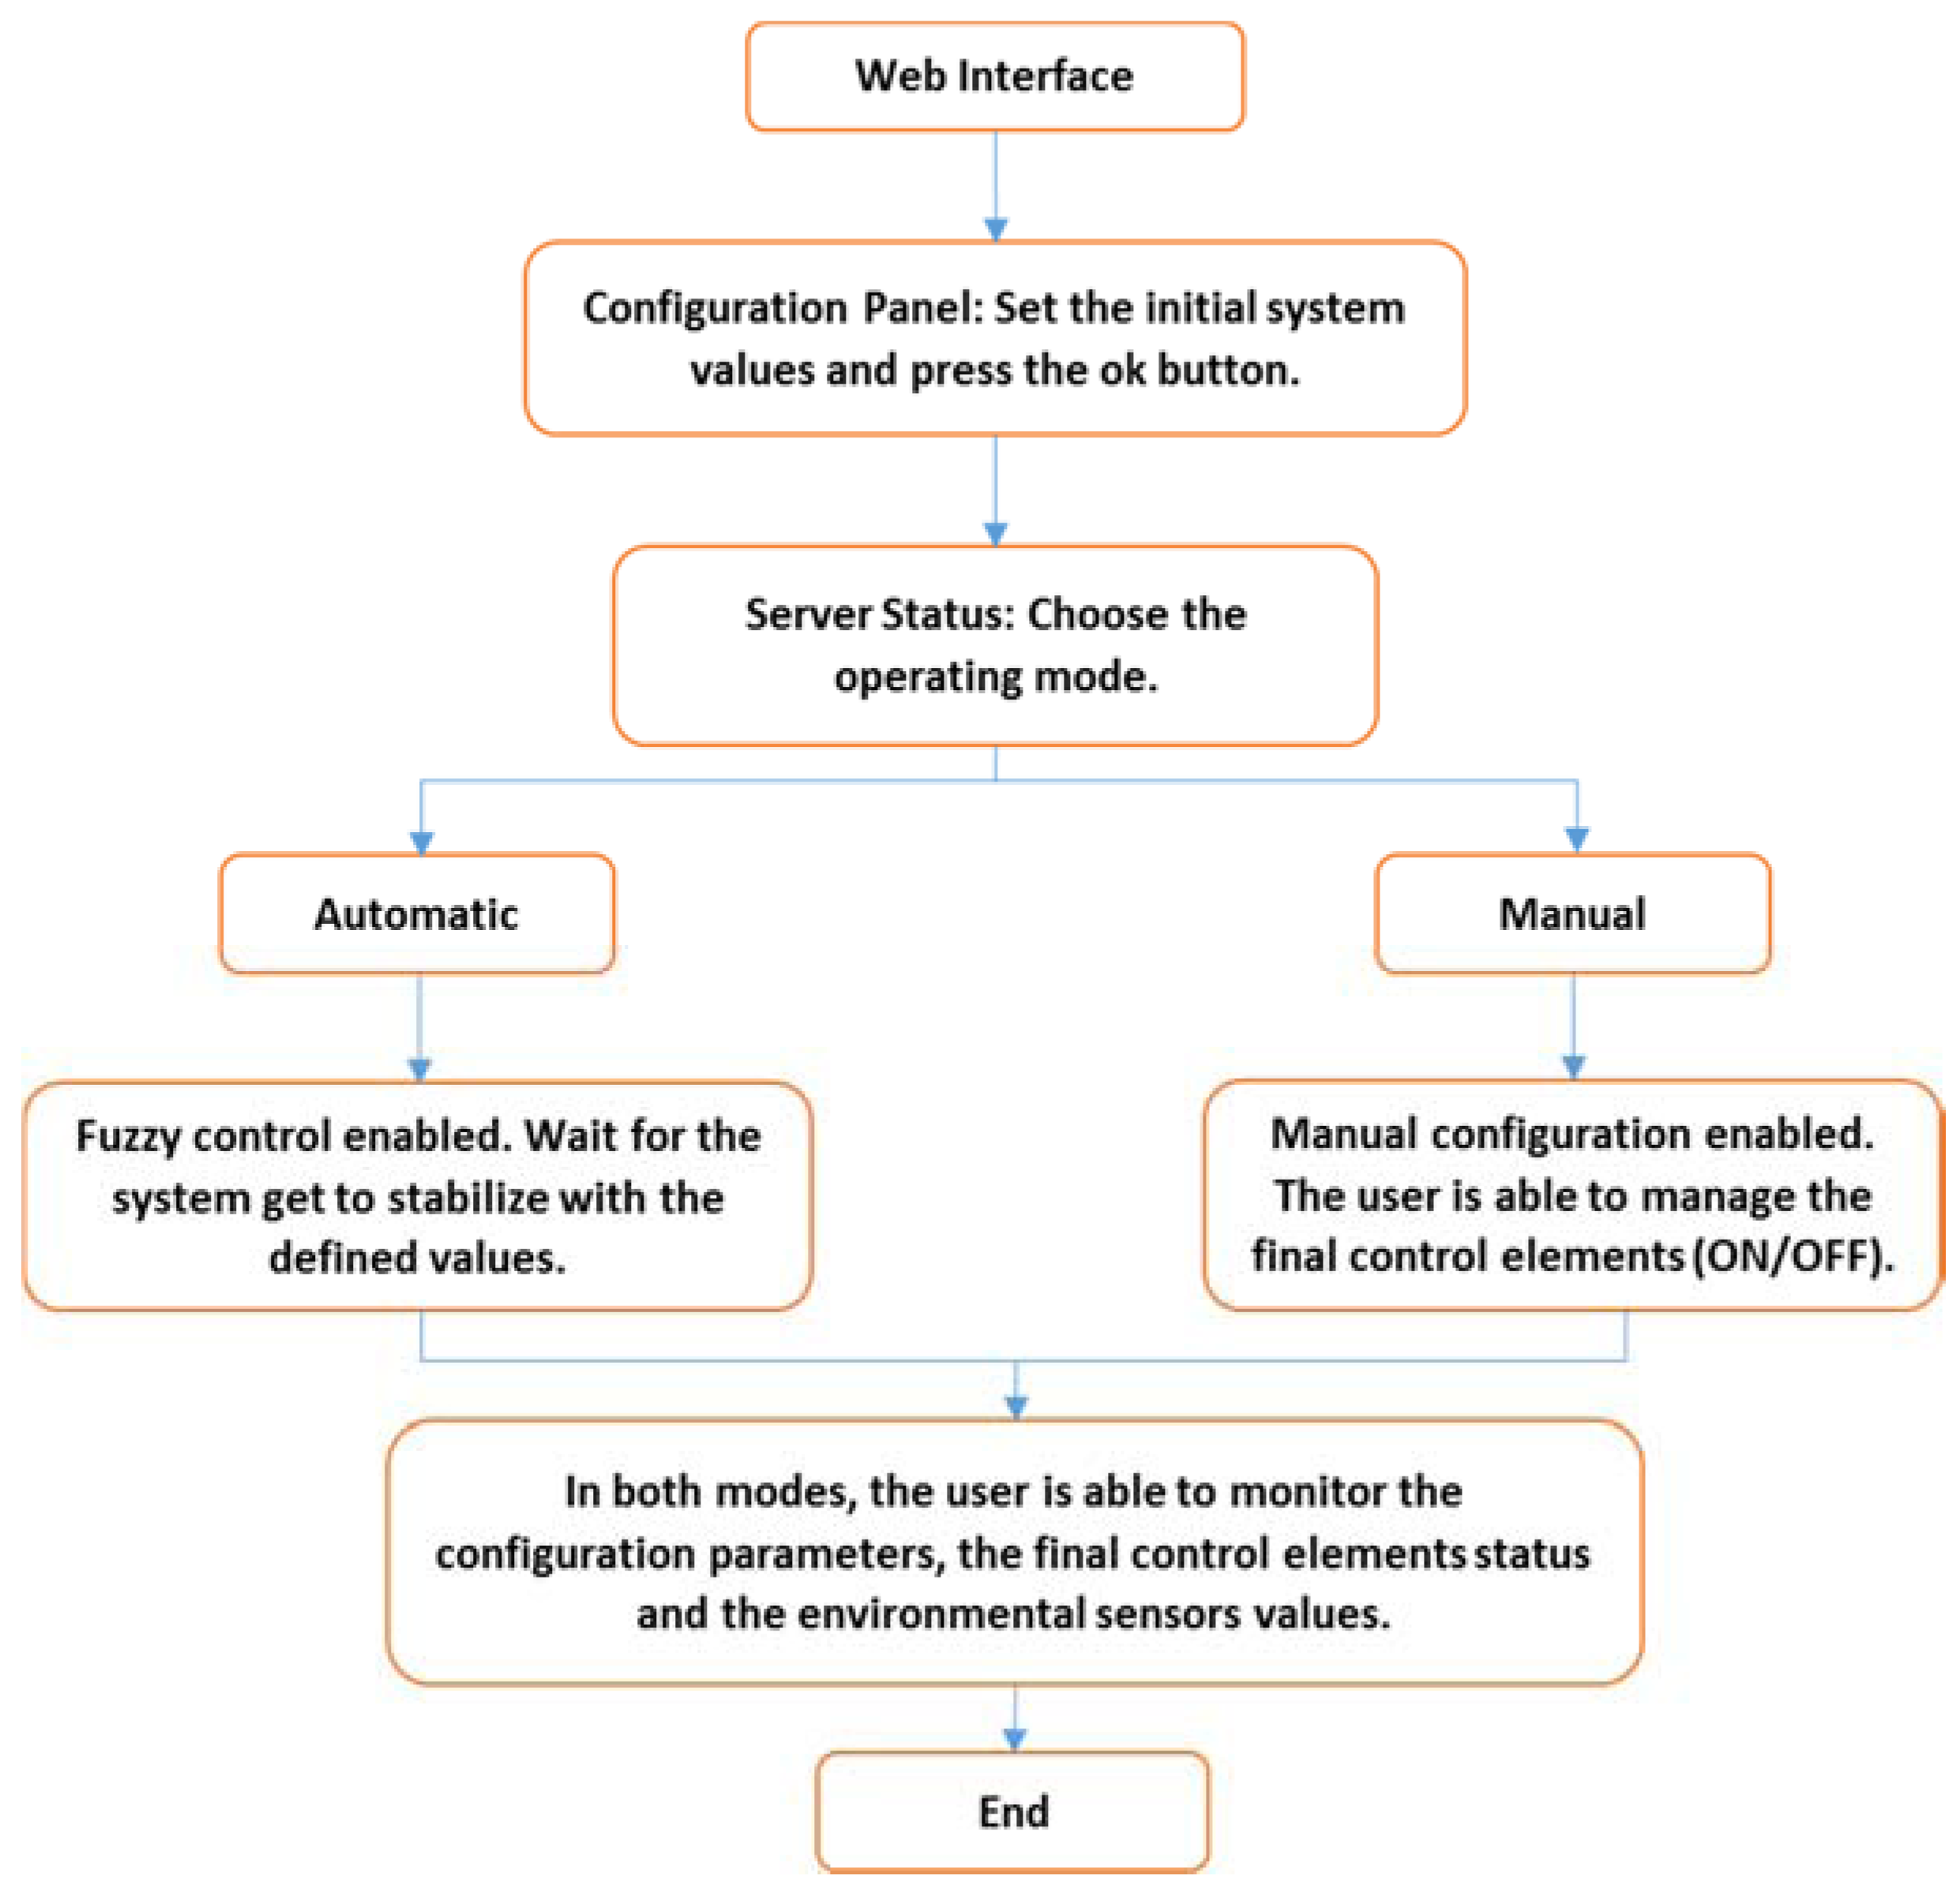
Figure 8 shows the flowchart that summarizes the process followed when using the web interface.
6. Results
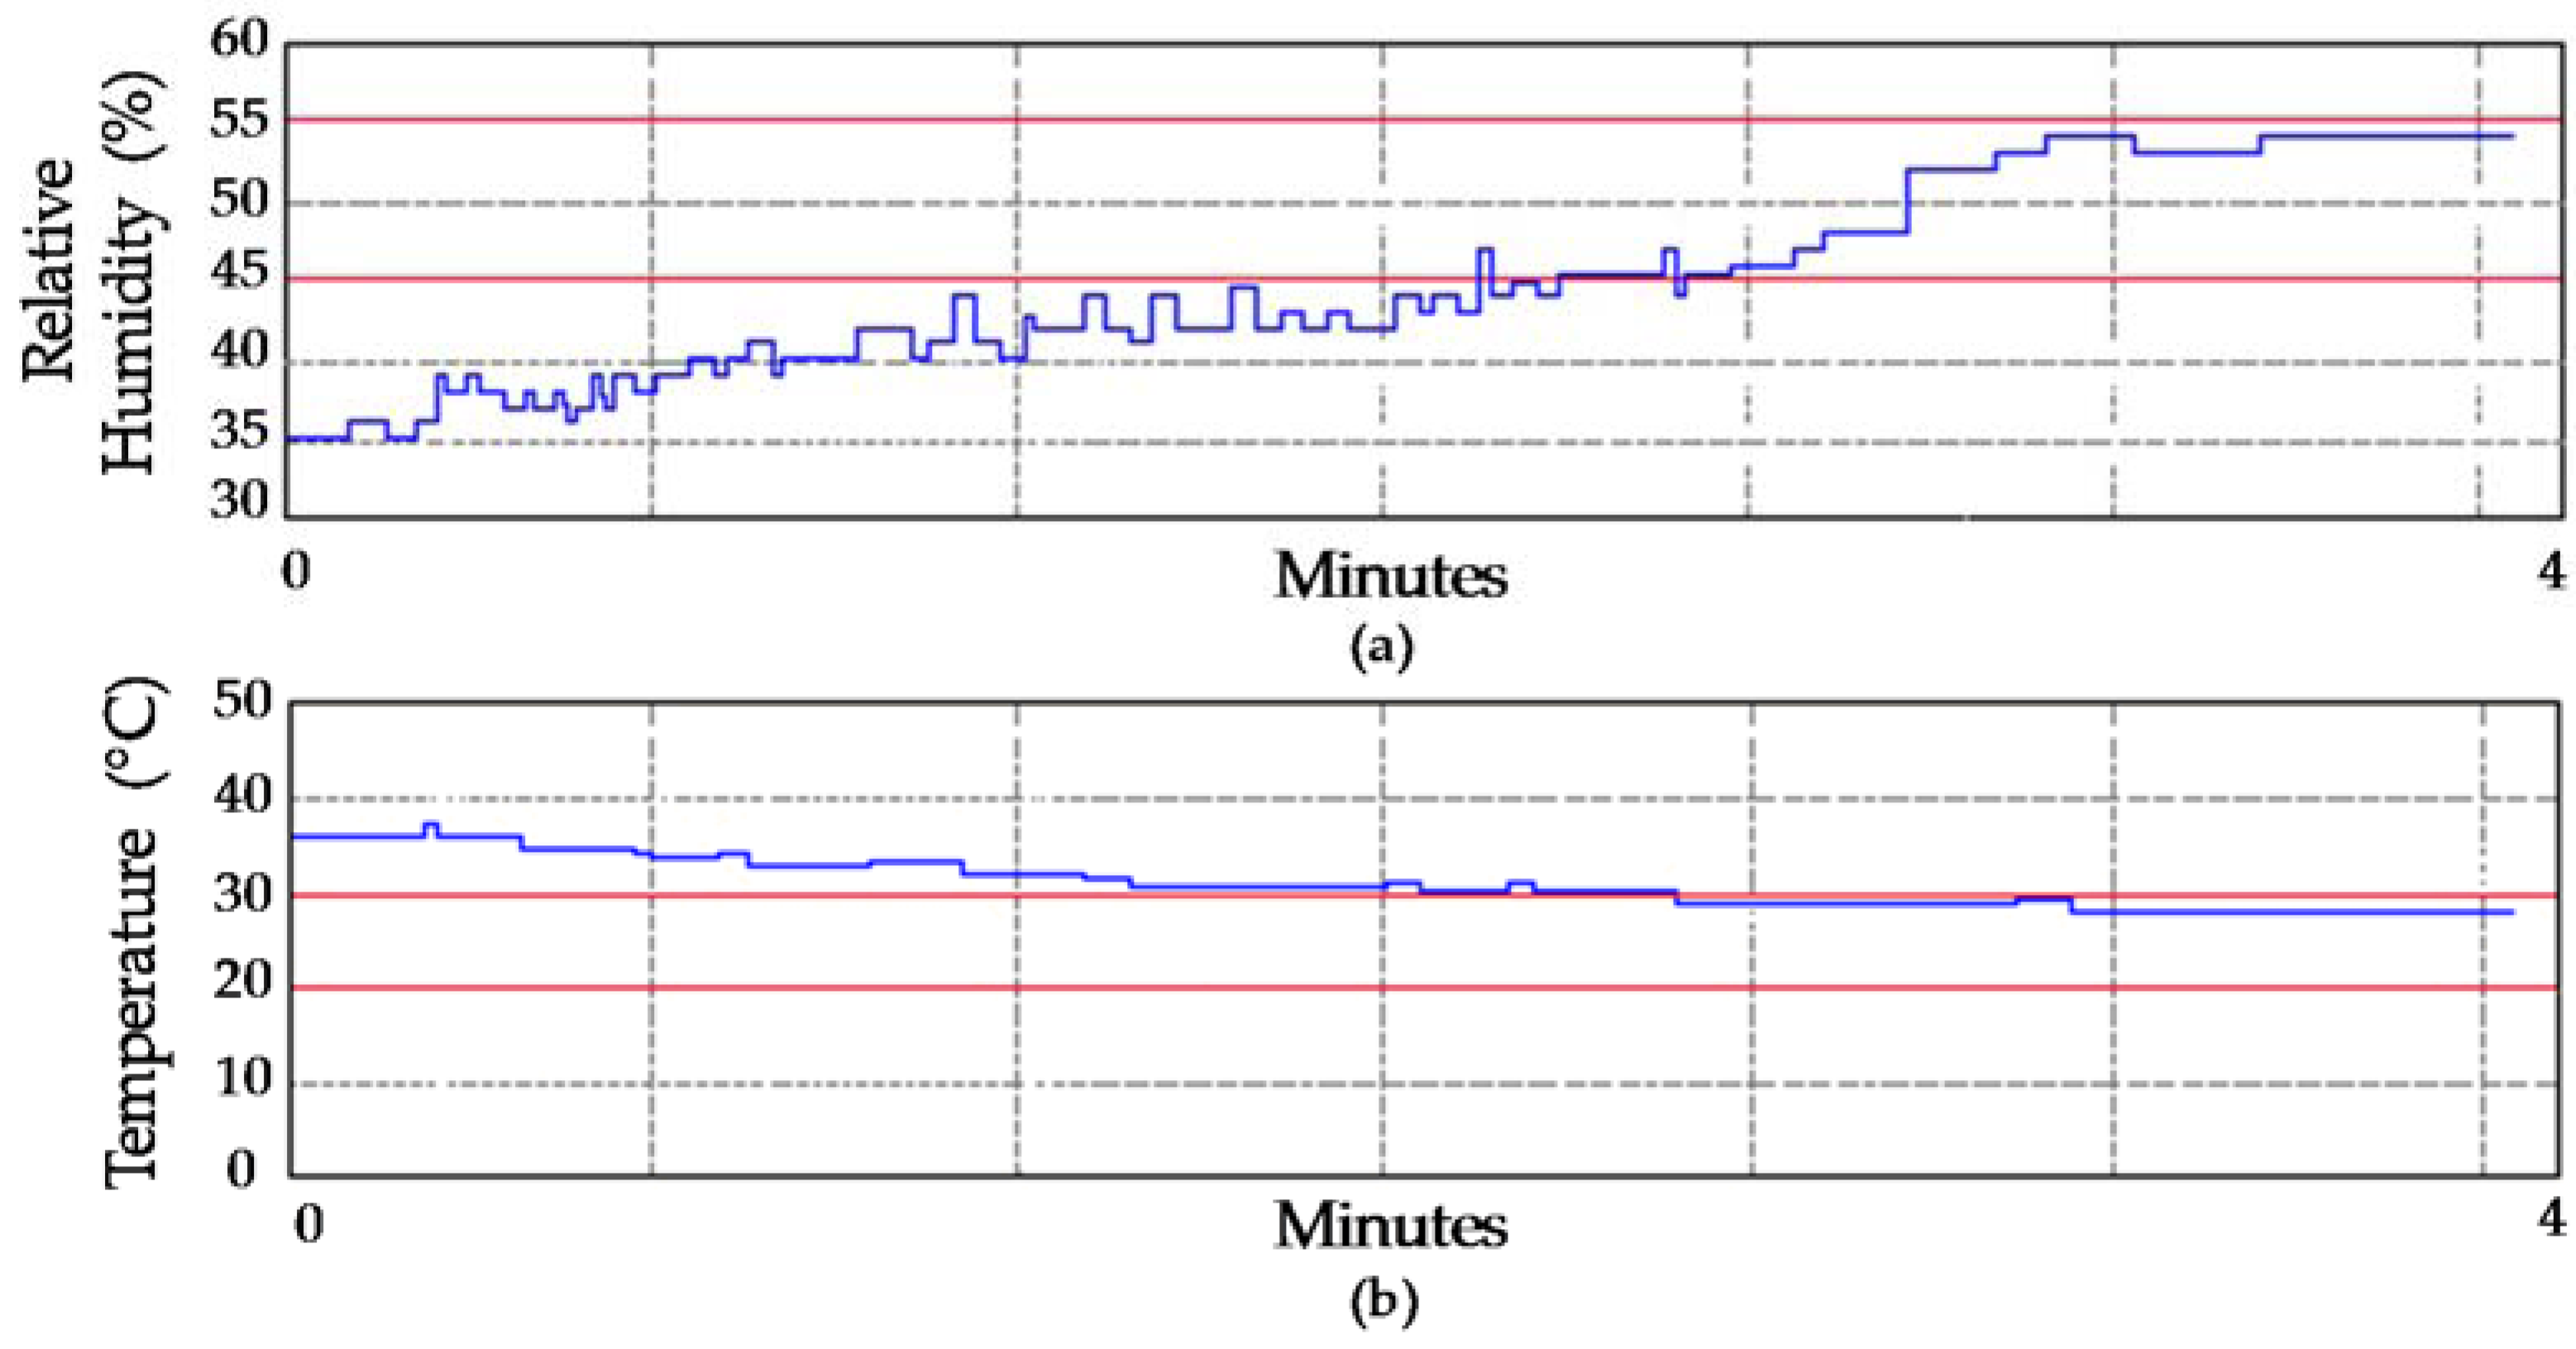
In this section, the results obtained from applying the automatic control system through activation on the website by setting different reference values and varying the initial climatic conditions are presented. In the first case, a critical situation where the temperature and relative humidity were outside the ranges defined by the set points was evaluated. The initial values of the indoor and outdoor climatic variables are shown in
Table 4 and the set points configured.
According to
Figure 10, the fuzzy system manipulates the final control elements to decrease the temperature, stabilizing between 28 and 29 °C, while the relative humidity increases to a value of 54% which is within the defined ranges. The stabilization time of the variables was 4 min.
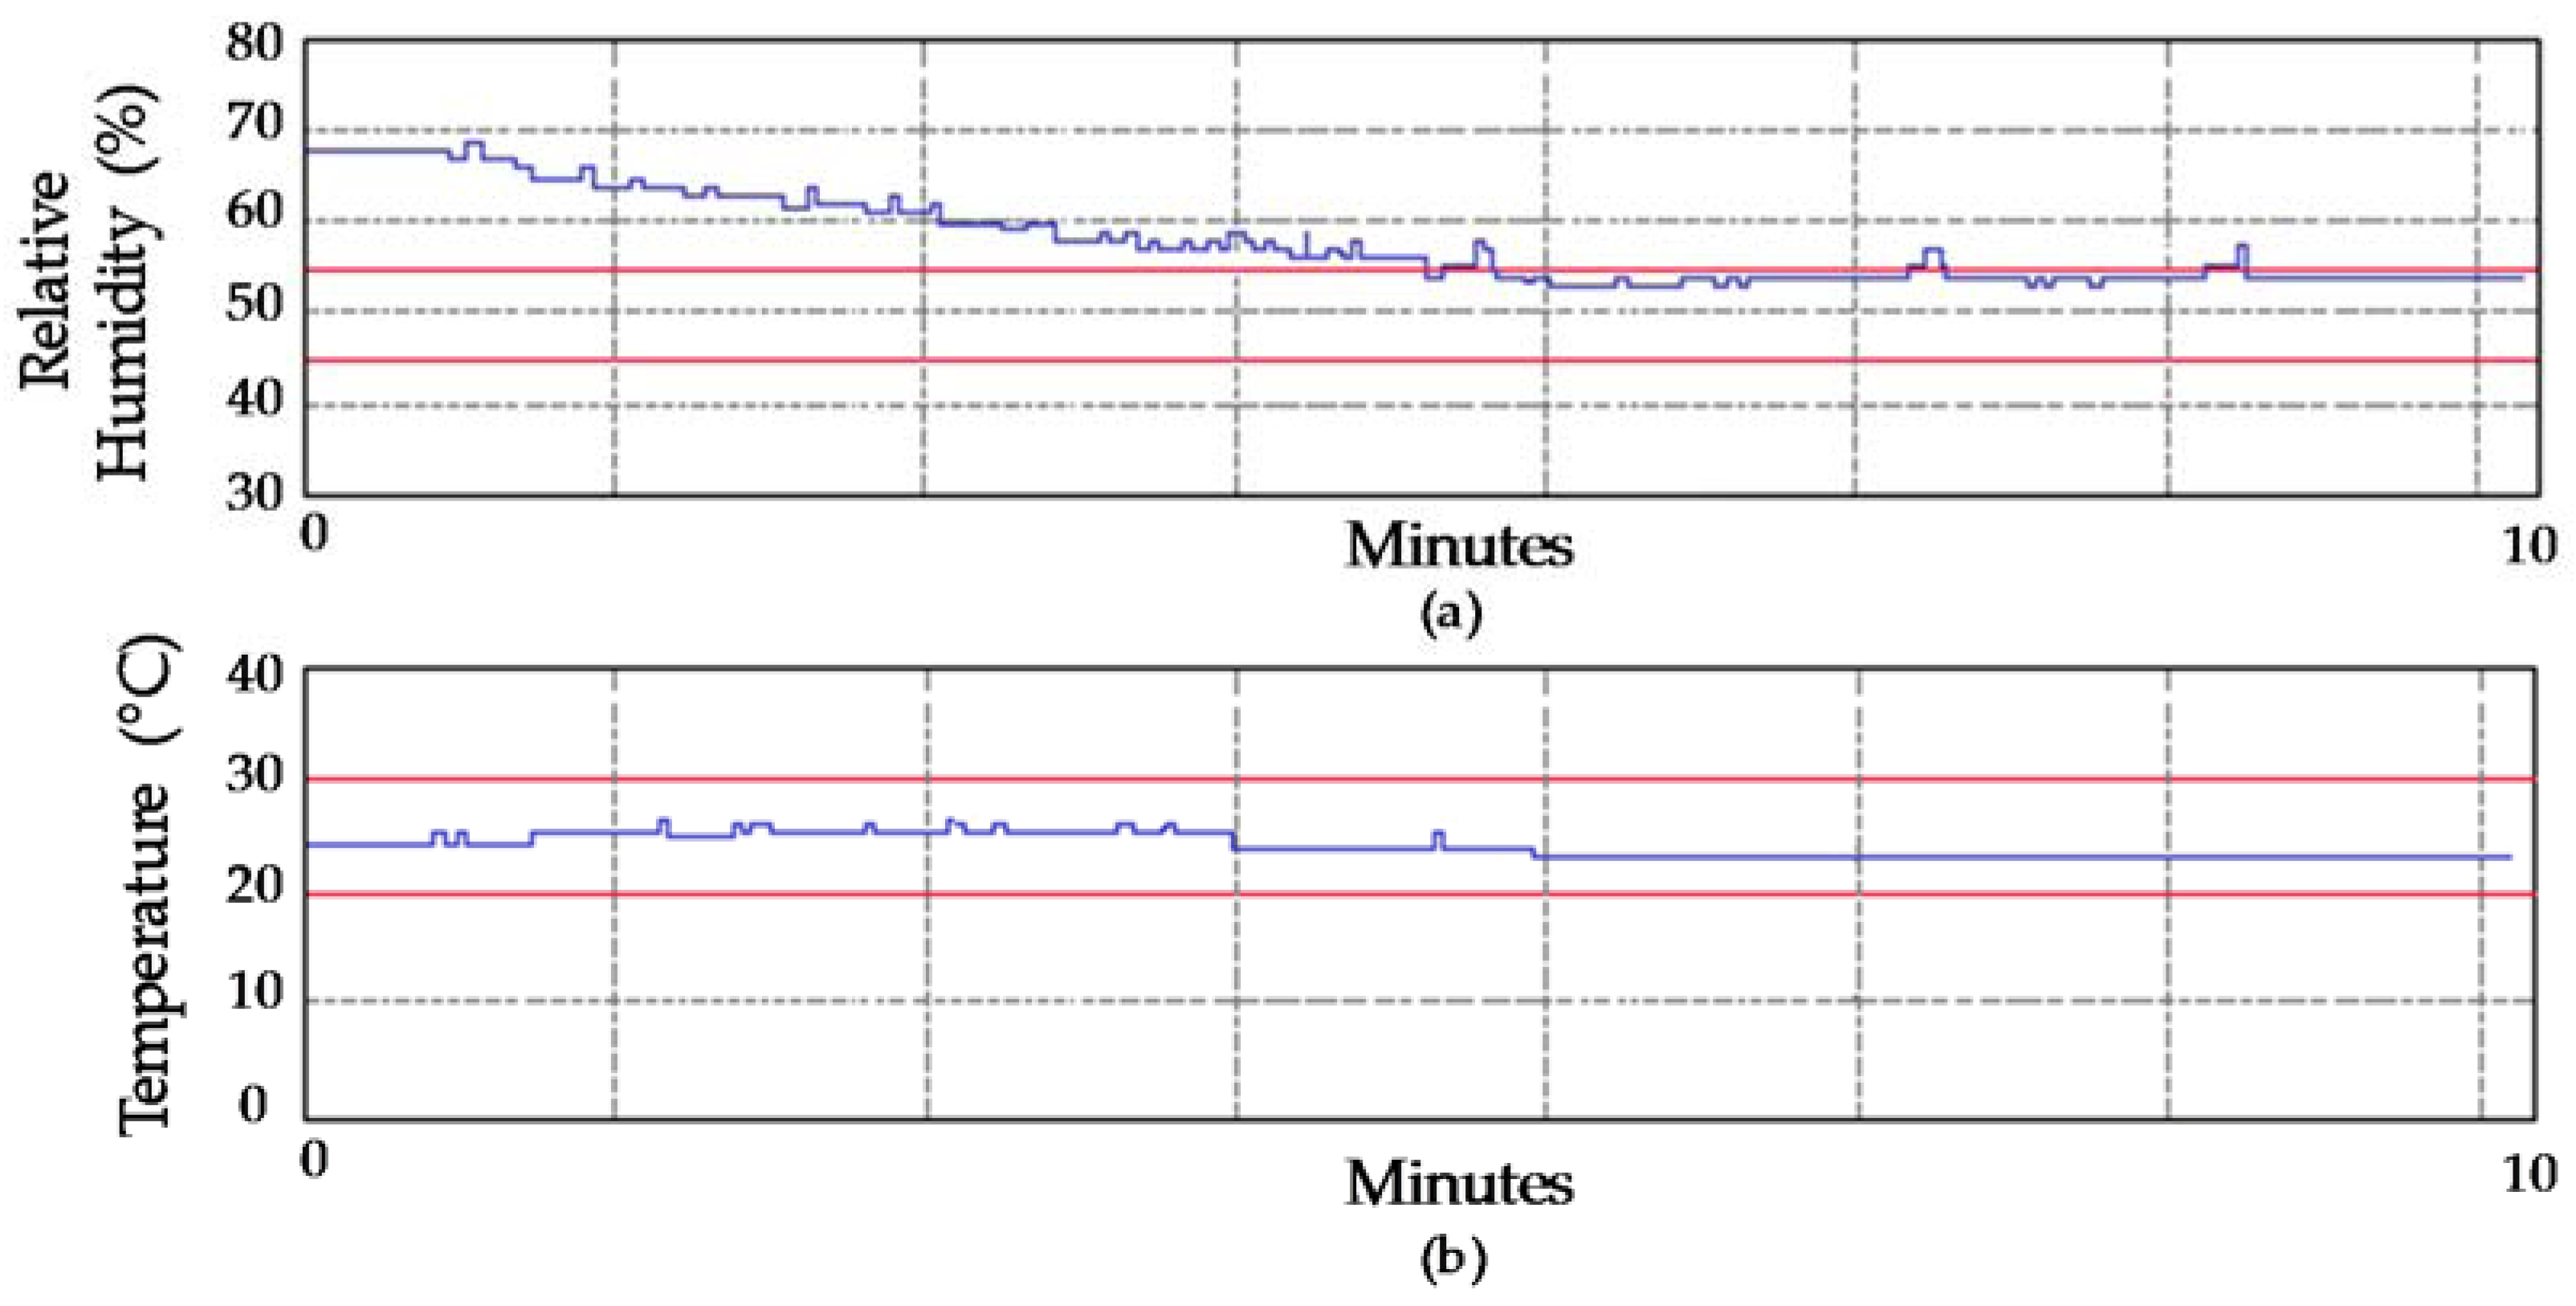
For the second stage of testing, the temperature was within the range determined in the initial parameters and the relative humidity was outside the range defined by the set points.
Figure 11 shows how the system allows for a reduction in relative humidity to 54%, setting it within the range defined by the set points while the temperature remains stable. The stabilization time was 10 min.
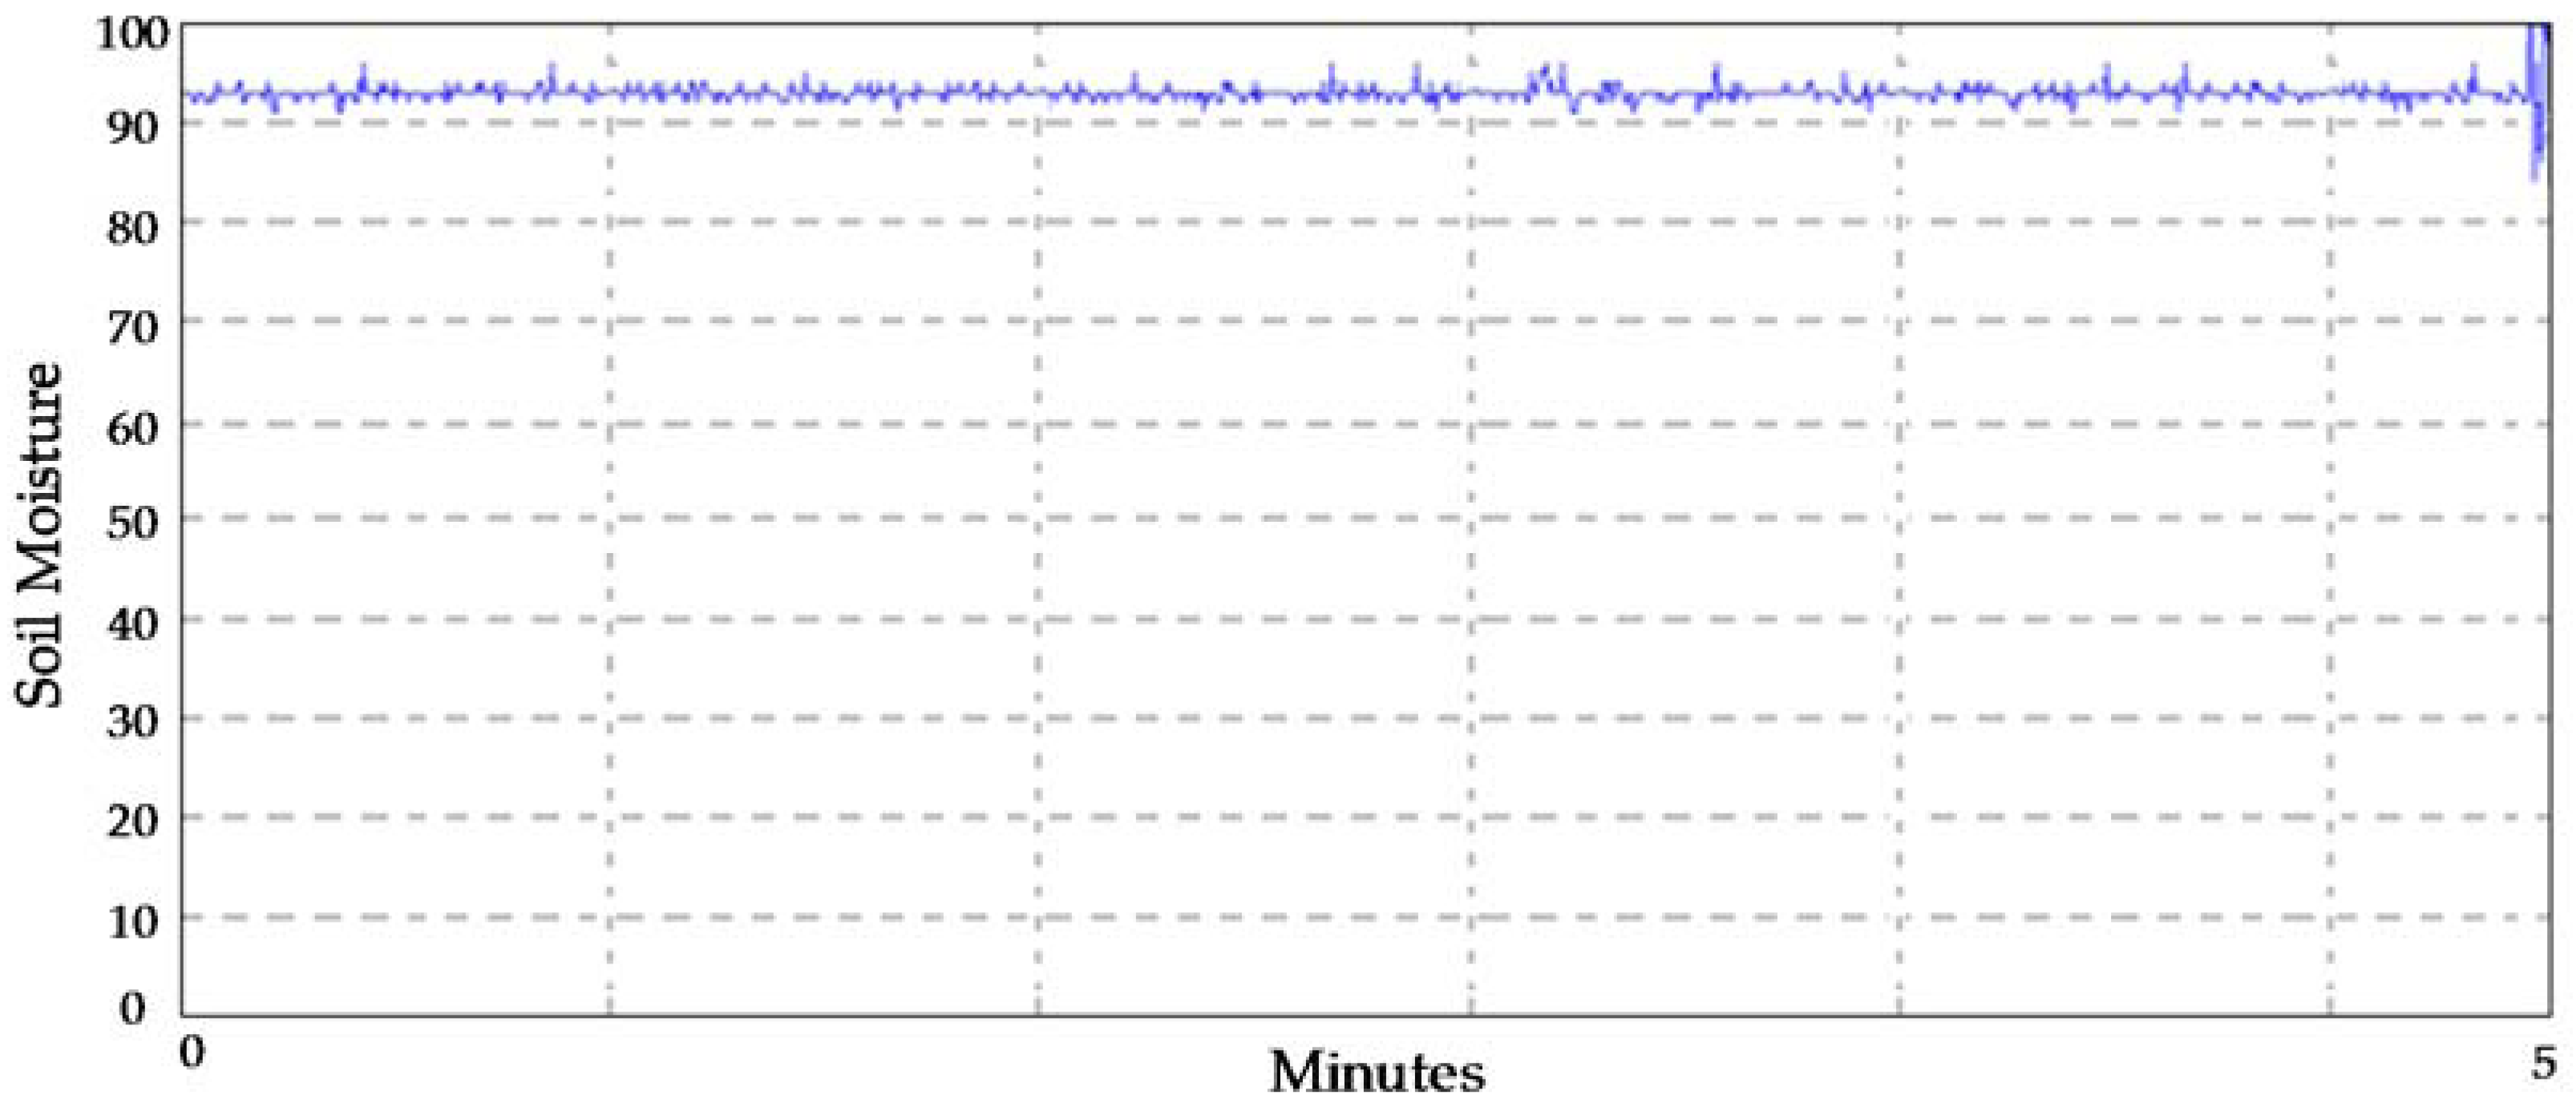
Finally, to test the irrigation system, the activation of this mechanism was carried out for a total time of 105 s, which was previously set through the web interface. A total of 9 irrigations were made, with a duration of 5 s and a waiting time of 5 min between each irrigation. During the first 5 min of waiting, after applying the first irrigation, the results showed a large variation in moisture sensor readings, from 30% to 100%, which was due to the effect of water distribution in the soil, which covered the sensor and the lack of homogeneity. However, for the ninth irrigation, an average moisture stabilized at 93% was obtained, so the proper functioning of the system was verified (
Figure 12).
7. Discussion and Conclusions
A prototype for the monitoring and real-time control of climatic variables within a greenhouse was presented. The DHT11 and soil moisture sensors showed good stabilization times and average tolerances of 5% for relative humidity, 2% for temperature, and 6% for soil moisture under different environmental conditions. Thus, it was possible to contribute to the stabilization of climatic parameters and the proper control of periodic processes such as lighting and irrigation, managing mitigation of the risks that threaten the optimum productivity of crops. These results are consistent with the research carried out in [
14] for monitoring environmental parameters in precision agriculture, in which tolerances of 0.7% for temperature and 5.2% for relative humidity were obtained.
It was possible to obtain the wireless connectivity needed to allow any device with Wi-Fi available within the local area network established to easily and accurately monitor and control the system, additionally providing the option to manually activate the final control elements in real time, as proposed in [
4]. The effectiveness of fuzzy logic, with which it was possible to define all situations that may occur in the greenhouse, was demonstrated. The results mentioned above are further supported in work carried out in [
2], in which the temperature and illuminance of a greenhouse were controlled. On the other hand, the results obtained in [
8] highlight the improvements that can be achieved in terms of greenhouse temperature control when a fuzzy controller is used with particle swarm optimization. Finally, it should be emphasized that the application developed in this work, allowed for man–machine interaction, offering access to the configuration, monitoring, and control of a fuzzy system, as proposed in [
5,
6,
7,
8].
For future work , the web interface can be improved by including graphical charts showing the evolution of the main variables being monitored in the greenhouse. It is also proposed to increase the storage capacity of the prototype with the use of SD cards. The utilization of cloud storage and access to managed data is also proposed.


