Garment-Integrated Bend Sensor

1
College of Science and Engineering, University of Minnesota, Minneapolis, MN 55455, USA
2
College of Design, University of Minnesota, St. Paul, MN 55108, USA
*
Author to whom correspondence should be addressed.
Electronics 2014, 3(4), 564-581; https://doi.org/10.3390/electronics3040564
Submission received: 3 March 2014
/
Revised: 31 August 2014
/
Accepted: 5 September 2014
/
Published: 26 September 2014
(This article belongs to the Special Issue Wearable Electronics)
Abstract
:Garment-integrated sensors equip clothes with a smart sensing capability, while preserving the comfort of the user. However, this benefit can be to the detriment of sensing accuracy due to the unpredictability of garment movement (which affects sensor positioning) and textile folds (which can affect sensor orientation). However, sensors integrated directly into garments or fabric structures can also be used to detect the movement of the garment during wearing. Specifically, a textile bend sensor could be used to sense folds in the garment. We tested a garment-integrated stitched sensor for five types of folds, stitched on five different weights of un-stretchable denim fabric and analyzed the effects of fold complexity and fabric stiffness, under un-insulated and insulated conditions. Results show that insulation improves the linearity and repeatability of the sensor response, particularly for higher fold complexity. Stiffer fabrics show greater sensitivity, but less linearity. Sensor response amplitude is larger for more complex fold geometries. The utility of a linear bending response (insulated) and a binary shorting response (un-insulated) is discussed. Overall, the sensor exhibits excellent repeatability and accuracy, particularly for a fiber-based, textile-integrated sensor.
1. Introduction
E-textiles are smart fabrics that enable smart clothing. Because of their proximity to the human body, e-textile sensors integrated into clothing represent an intuitive approach to sensing body signals and movements, and this approach has particular benefits for long-term monitoring scenarios, where user comfort is paramount. For example, e-textile systems have been developed that automatically generate an activity diary of healthcare monitoring applications, allowing the annotation of medical data with different user activities and contexts, without requiring user intervention [1]. Garment-integrated sensors have the potential to sense body movements without disrupting the outward aesthetics of self-presentation and dress. In our previous work, we described the development of a stitched sensor for measuring the elongation of fabrics, which can be used to sense joint bends [2]. However, stretch sensors are limited to use with elastomeric fabrics that allow for fabric stretch and require a tightly-fitted garment in order to effectively be used to sense joint bends. In this paper, we describe the use of the same stitched sensor approach, used instead to sense bends in an un-stretchable fabric, denim.
Jeans are among the most popular and commonly accepted article of casual dress around the world. The variety of jeans available in the market is broad and includes many different styles and materials. Because the sensor we describe is coupled to a fabric substrate, the mechanics of the fabric will likely have an effect on the relationship between the sensor response and the physical input (such as the bend angle of a joint or, in our case, the distance between linear moving parts). Here, we analyze the response of the stitched sensor to five different types of fabric bending, for sensors stitched to five different weights of denim fabric.
2. Background
Wearable sensing through garment-integrated sensors has been promoted as an alternative or a solution coupled to traditional body sensing techniques. The most common wearable body movement sensing technique is the use of inertial sensing units (such as accelerometers and gyroscopes), which are often stiff, bulky and possibly uncomfortable [3]. Bulky and uncomfortable wearable solutions for the wearer have been shown to affect the quality of the measured data [4] and may also affect the wearer’s attention and cognitive processes [5]. Sensing techniques that focus on bend and stretch tend to be possible with more textile-like sensors, either fiber-type sensors [6], stitched or knitted sensors [1,5] or printed sensors [7], but for some applications, these may not provide enough information or enough accuracy to fully characterize movement and position. Coupling garment-integrated sensing with existing body sensing techniques could be beneficial to the overall system accuracy and may allow the number of rigid sensing units to be decreased.
Wearable systems that use e-textile stretch sensing elements to measure body parameters have already been introduced in healthcare rehabilitation for cardiovascular and respiratory monitoring [8]. The Wearable Health Care System used knitted fabrics with conductive and piezoelectric yarns to make sensors and electrodes integrated into an elastic skin-tight body suit, in direct contact with the body. Breathing activity was measured by the resistance change of a Lycra fabric sensor coated with carbon-loaded rubber placed around the chest and abdomen after elongation of the sensor following inhalation and exhalation. The sensor used in that system was characterized as having a linear response for strain ranging between 10% and 66%, during static sensor calibration. Garment-integrated foam sensors (soft open-cell foam with an electro-active polymer coating) on a closely-fitting, non-extensible chest strap have also been used to monitor respiration rate. Correlations above 0.9 and deviation errors below 1.6 were computed [9].
In other studies, force sensitive resistors (polymer thick film) and fabric stretch sensors (carbon-loaded rubber) have been used to provide alternative methods to detect muscle activity. Both sensors can be easily integrated into clothing to provide an unobtrusive method to measure muscle activity: for example during the rehabilitation of a patient after a central nervous disorder, e.g., a stroke [7]. Coyle et al. used a textile sensing glove to detect finger flexion/extension exercises. Joint flexion sensors constituted by carbon-loaded elastomers were integrated onto the fingers of the glove [10].
However, relying on stretch to sense joint movements limits the amount of wearing ease in the garment, because a very loose garment will shift over the joint rather than being deformed by the joint movement. Tightly-fitting stretch garments are appropriate in some social contexts, but not all. Sensing bends does not require the kind of tight fit that is needed for joint bends to stretch a garment. Dunne et al. characterized garment-integrated plastic optical fiber (POF) sensors as bend sensors for the detection of spinal posture, with an average linear correlation with respect to the motion capture data of 0.9 [6]. The POF sensors are fiber-like, but cannot be creased and require a light source and light detector at either end of the sensor (introducing the rigid bulk that bend and stretch sensing seeks to avoid).
Sensing approaches that use knitting to create a sensor structure most commonly require that the sensor placement and layout on a garment are planned at the textile-design stage. Because of the geometry of a knit, it is most convenient to apply sensors in either the horizontal or vertical direction. Both of these variables limit the versatility of the sensor placement and length and require an additional layer of complexity in the garment design and construction process. Approaches that use printing or surface adhesion/lamination of sensors can remove constraints on sensor placement. However, they often change the mechanical properties of the textile substrate, leading to a more perceptible sensor. We find that stitched techniques provide the benefit of unconstrained placement and length, while minimizing the effect on the mechanical properties of the textile substrate.
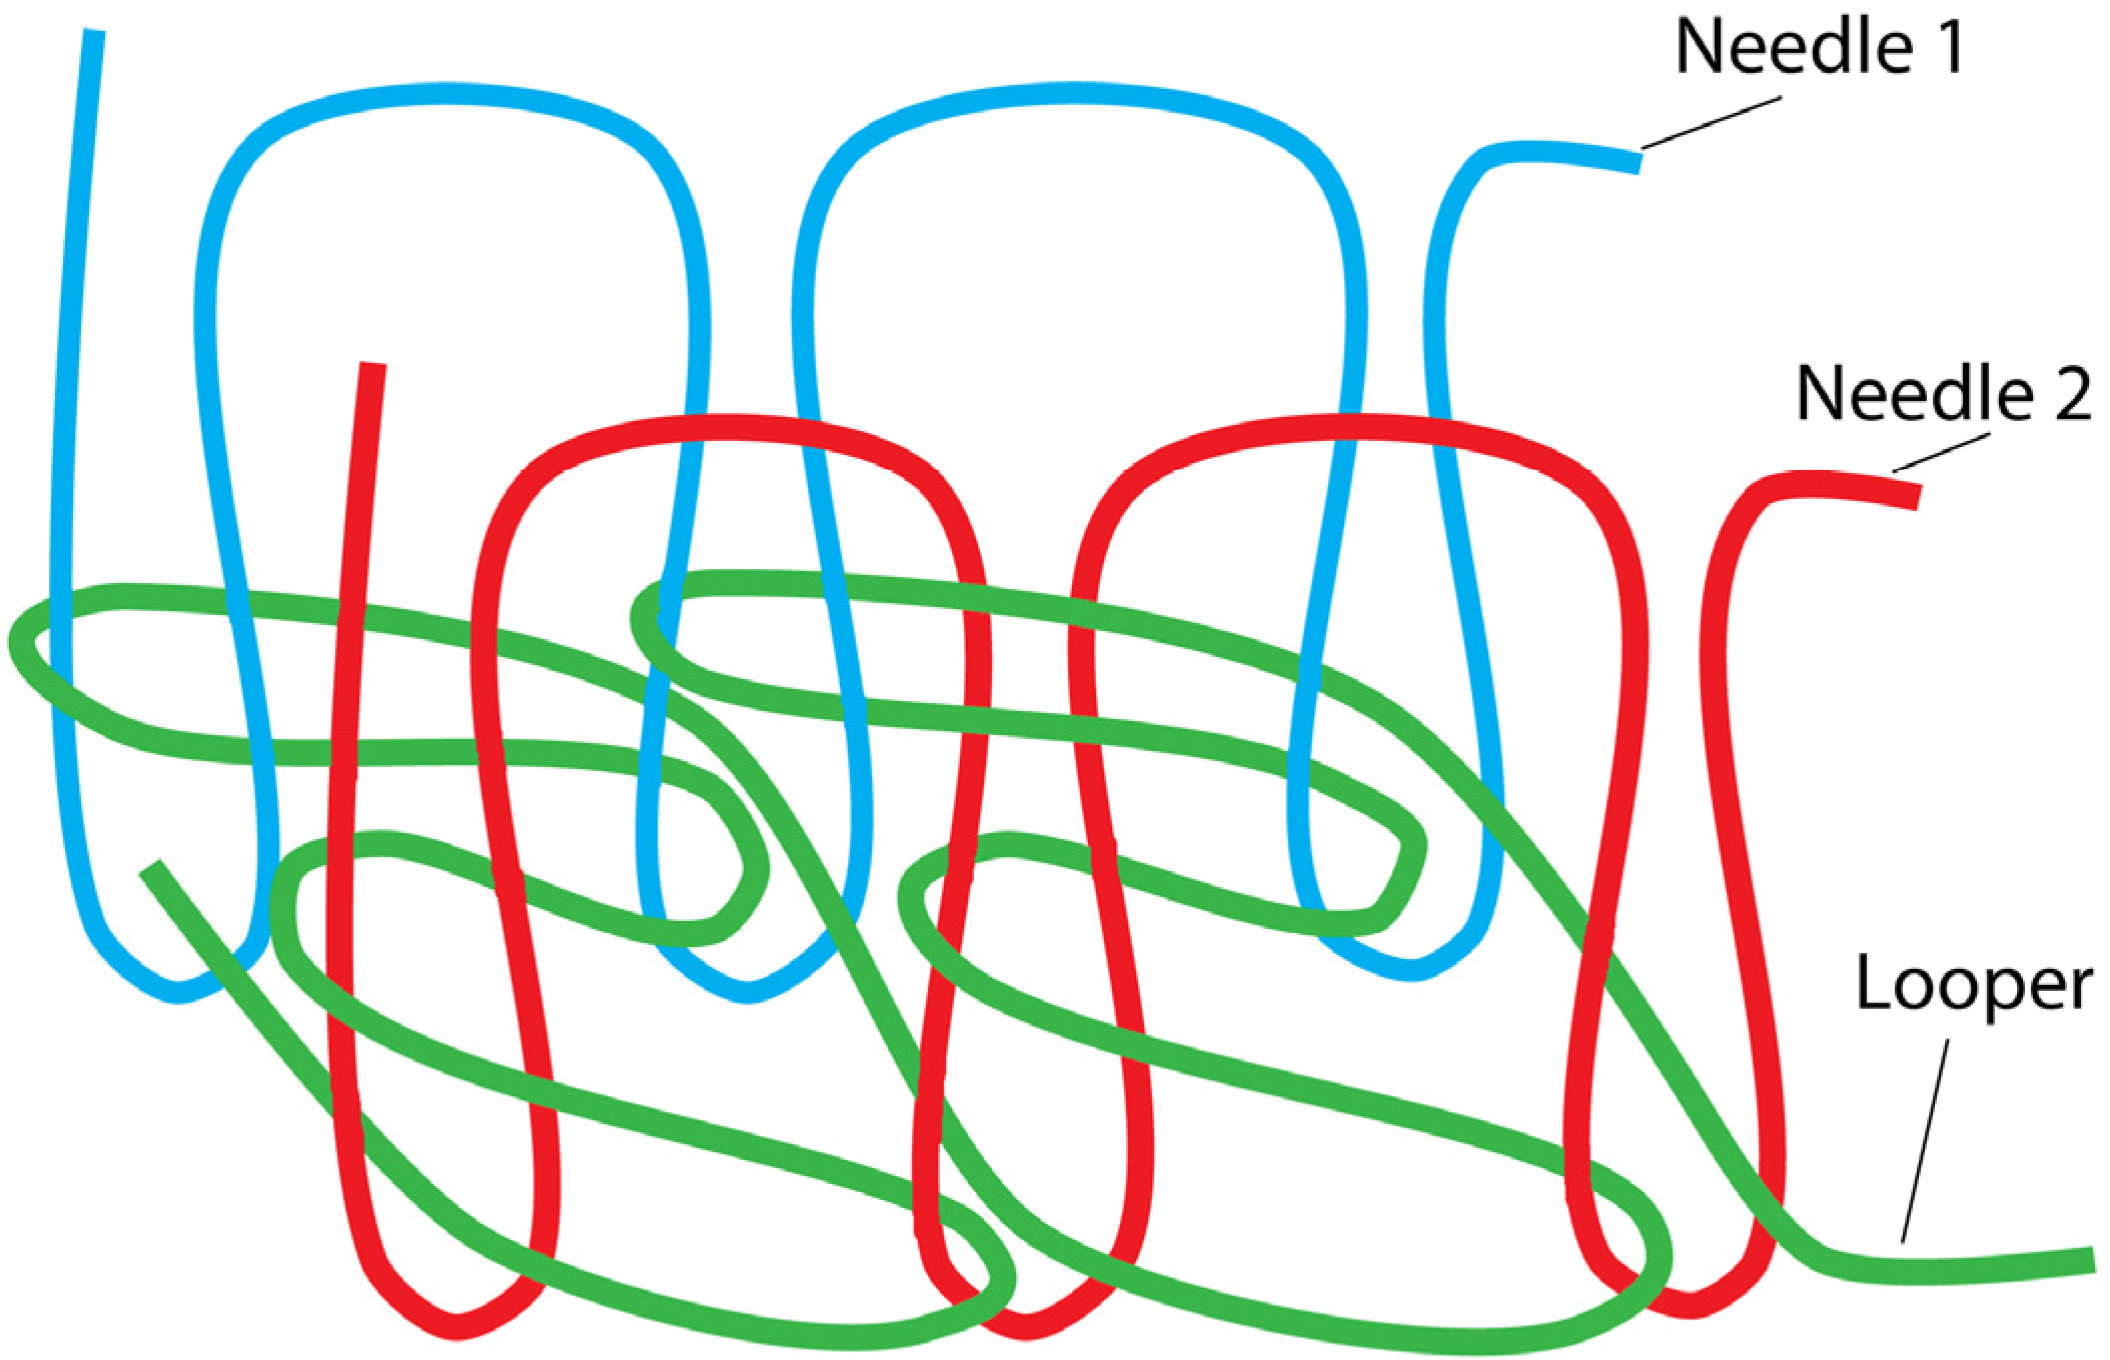
The sensor described here uses an ISO 406 stitch structure, commonly called a “coverstitch”, shown in Figure 1, where the “looper” is the stitch thread. This stitch is used in seaming and edge-finishing of stretch garments, as well as non-stretch garments. It creates a lock stitch structure with a common bobbin (or looper) thread shared between two to four needles. When a multi-filament conductive thread is used for the looper thread, the looped structure of the stitch in combination with the movement of yarn filaments results in a structure that changes electric resistance in response to deformation (bending or stretching).
Figure 1.
The ISO 406 bottom coverstitch.

We have previously characterized the ability to sense bends of the knee using the response of this stitched sensor to stretch [11] and have characterized the good correlation of the sensor output with respect to fabric elongation in the order of 0.9 [2]. As the fabric stretches, the stitched sensor conductive pattern deforms, increasing the electric resistance output; conversely, as the fabric relaxes, the conductive pattern returns to its initial structure, decreasing the sensor output resistance.
In addition to its response to stretch, the same stitch structure changes in resistance in response to bends. In our previous work, we demonstrated, using a pair of jeans and a human tester, how fabric folds in a worn garment could be correlated with joint knee bend angle [12] using this stitched sensor. Because the stitched sensor is much less stiff (it is as stiff as the fabric to which it is stitched, but does not introduce a significant amount of additional stiffness, as something like a POF sensor would), it can be used to detect fabric folds, as well as joint bends. As the knee bends (or flexes), the fabric of the jeans folds and the diameter of the fold curve decreases. The integrated sensor response was found to be proportional, decreasing as the bend diameter decreases. Conversely, as the knee straightens (or extends), the diameter of the fold curve increases, resulting in a proportional increase of the response. Linear correlation between the response of the bend sensor and knee bend angle were shown in the order of 0.8 with a corresponding bend sensors output resistance change between 10 Ohm and 45 Ohm, depending on the sensors’ locations, without compromising user comfort or aesthetics.
In this study, we introduce the characterization of a novel garment-integrated stitched sensor response to bends and fabric folds with different morphology (the kind of unconstrained folding that is seen in garments during body movement) and to explore the influence of the characteristics of the fabric substrate on the sensor response. The repeatability, accuracy and relations observed in controlled scenarios under different conditions show the ability of the sensor to effectively detect bending, while preserving wearer comfort, garment aesthetics and ease of production.
3. Methods
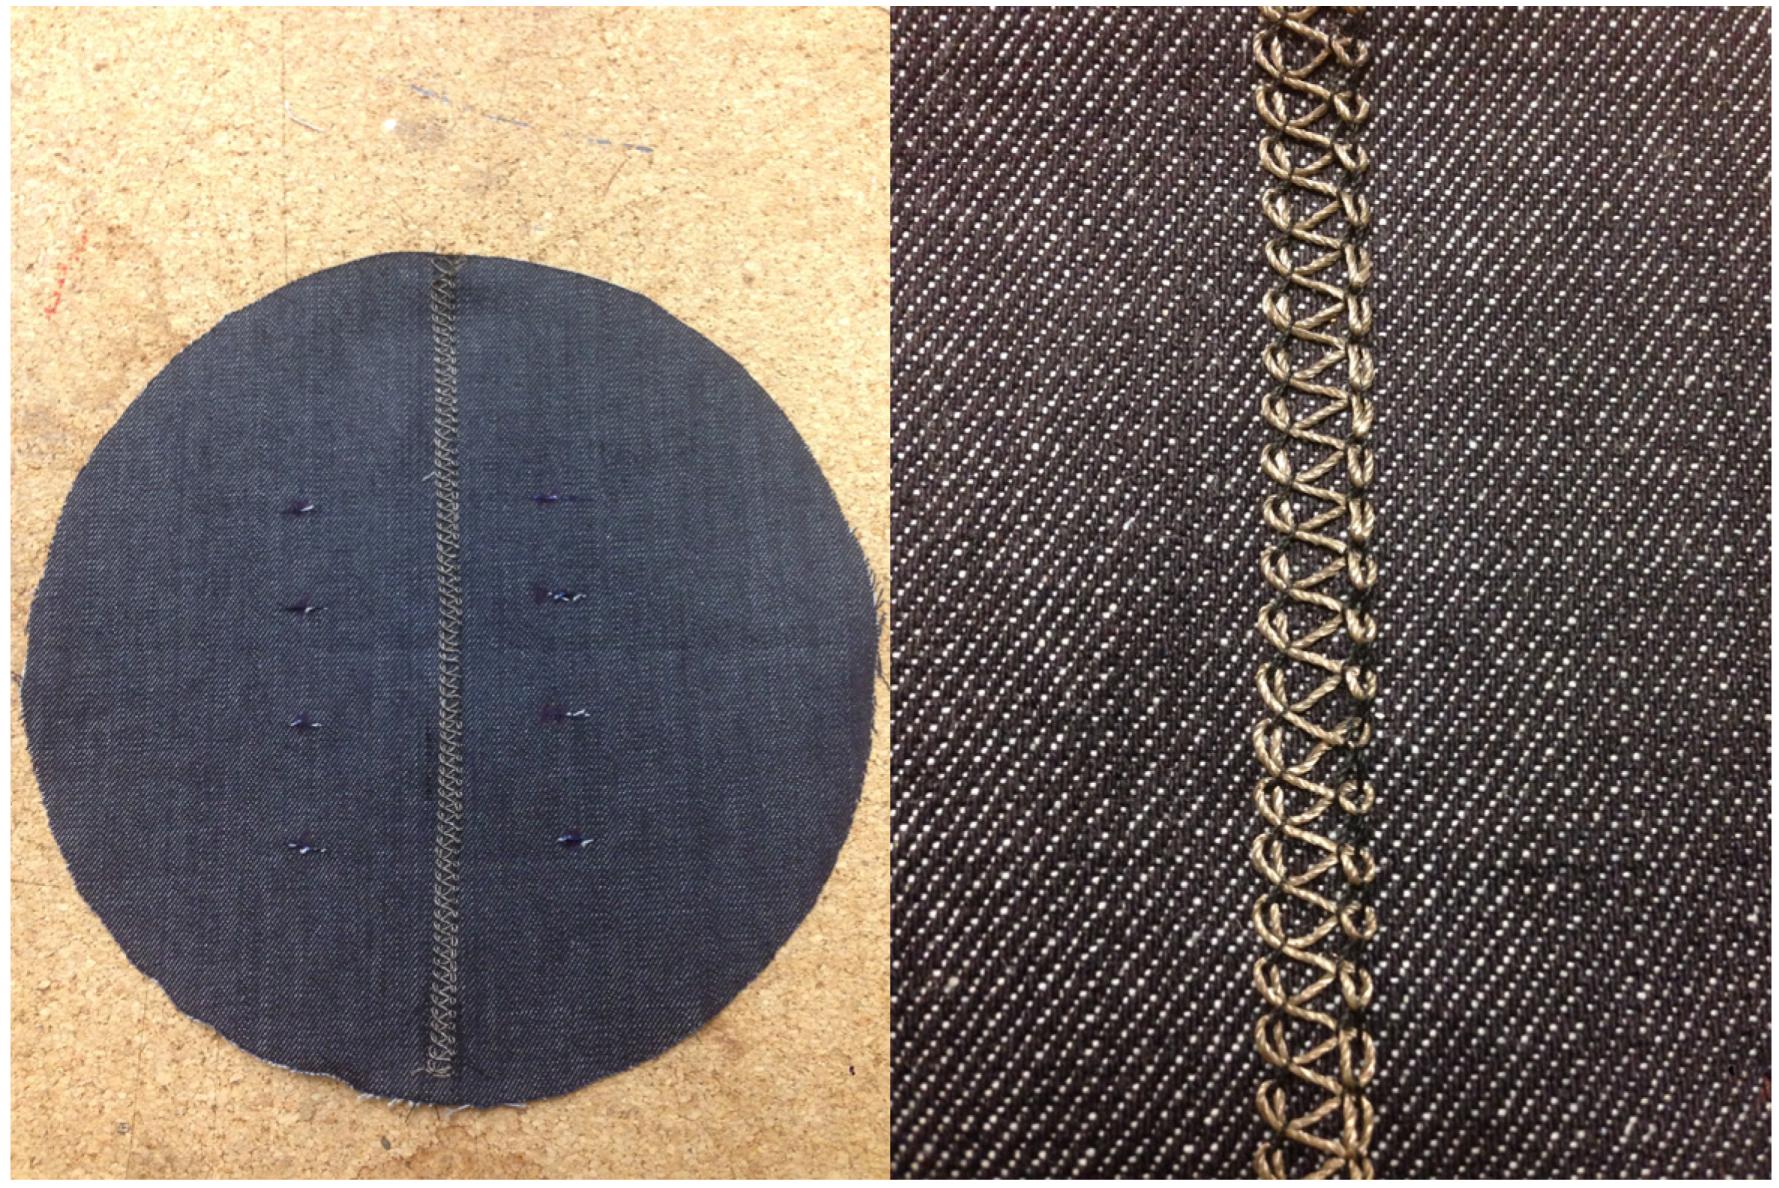
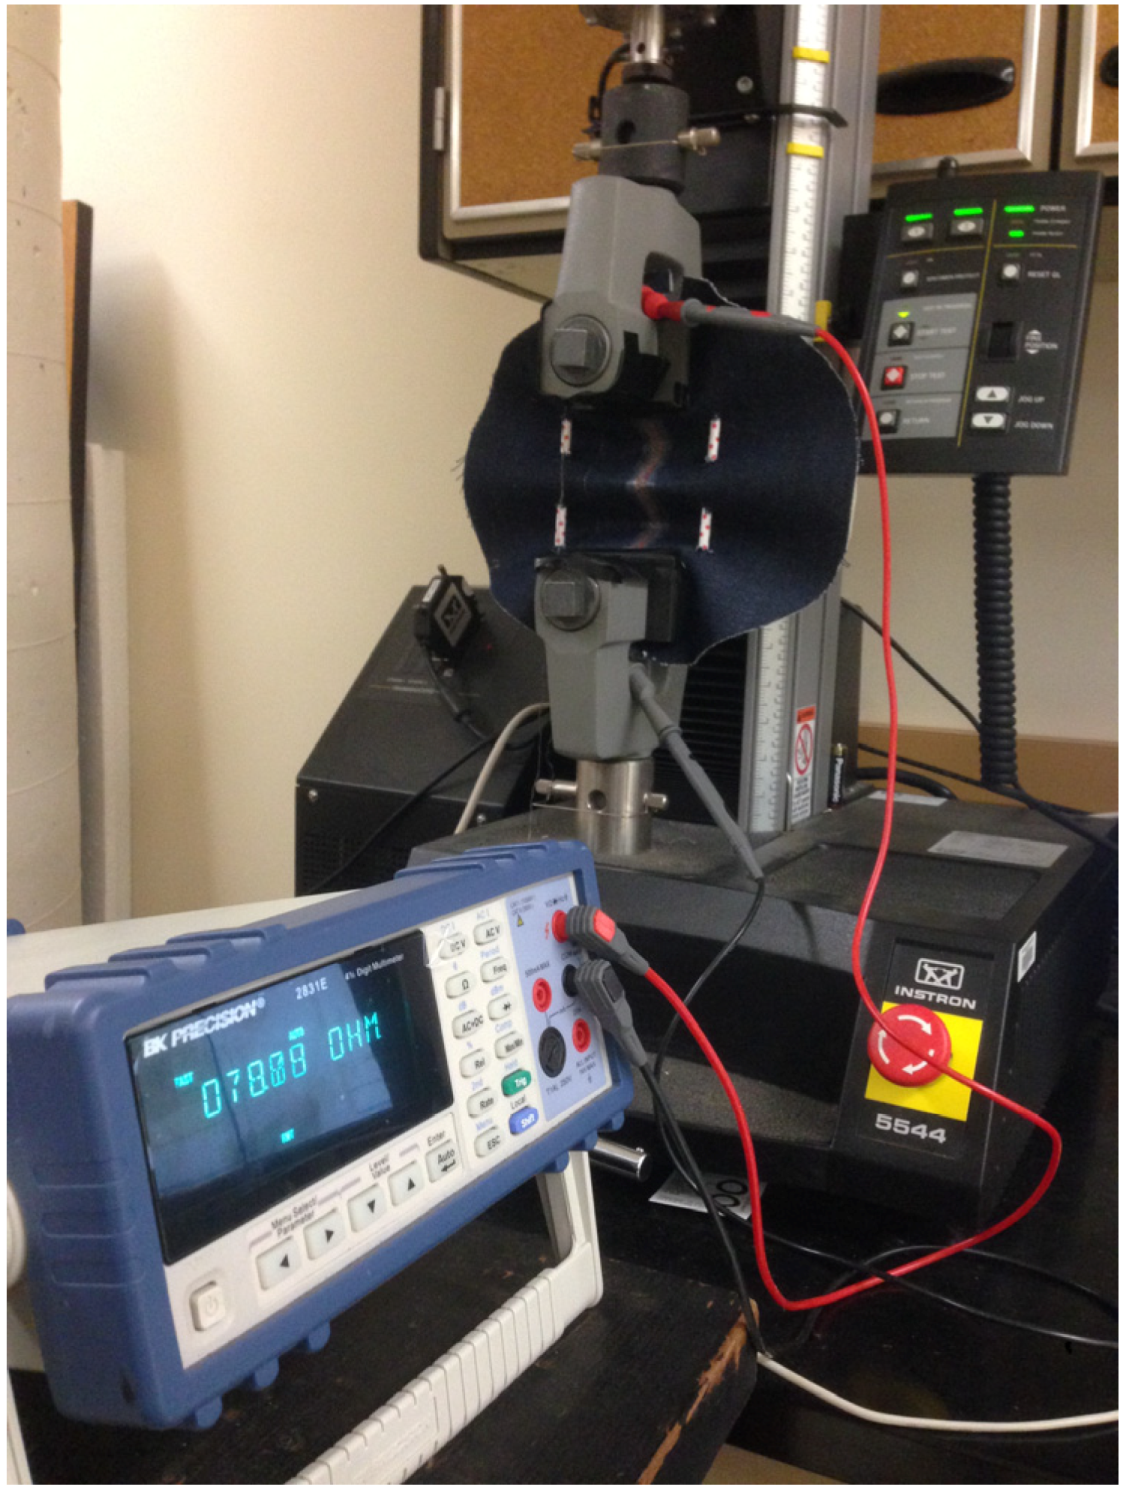
We tested stitched sensor samples on 5 weights of denim for 5 different bend types each, for a total of 25 tests. An INSTRON Tensile machine (model 5544) was used to produce a controlled input movement, while a digital multimeter (BK Precision, 2831E) was used to record responses from the sensors. The sensor was stitched to the surface of an 11" circular denim swatch, passing through the middle of the swatch from one end to the other for a total length of about 11", as shown in Figure 2.
Figure 2.
Denim sample (left) with a zoom of the stitched sensor (right).
Sensors were stitched on 5 different weights of denim fabric, all with identical weave structures. The weight and stiffness of these fabrics are reported in Table 1.

| Item No. | Manufacturer’s Specified Weight (oz/yd2) | Stiffness-ASTM D 1388 (in) |
|---|---|---|
| 80270 | 14.50 | 4.12 |
| 81415 | 13.75 | 4.40 |
| 80833 | 12.75 | 4.72 |
| 81814 | 12.50 | 4.17 |
| 52735 | 9.75 | 2.36 |
3.1. Experimental Setup
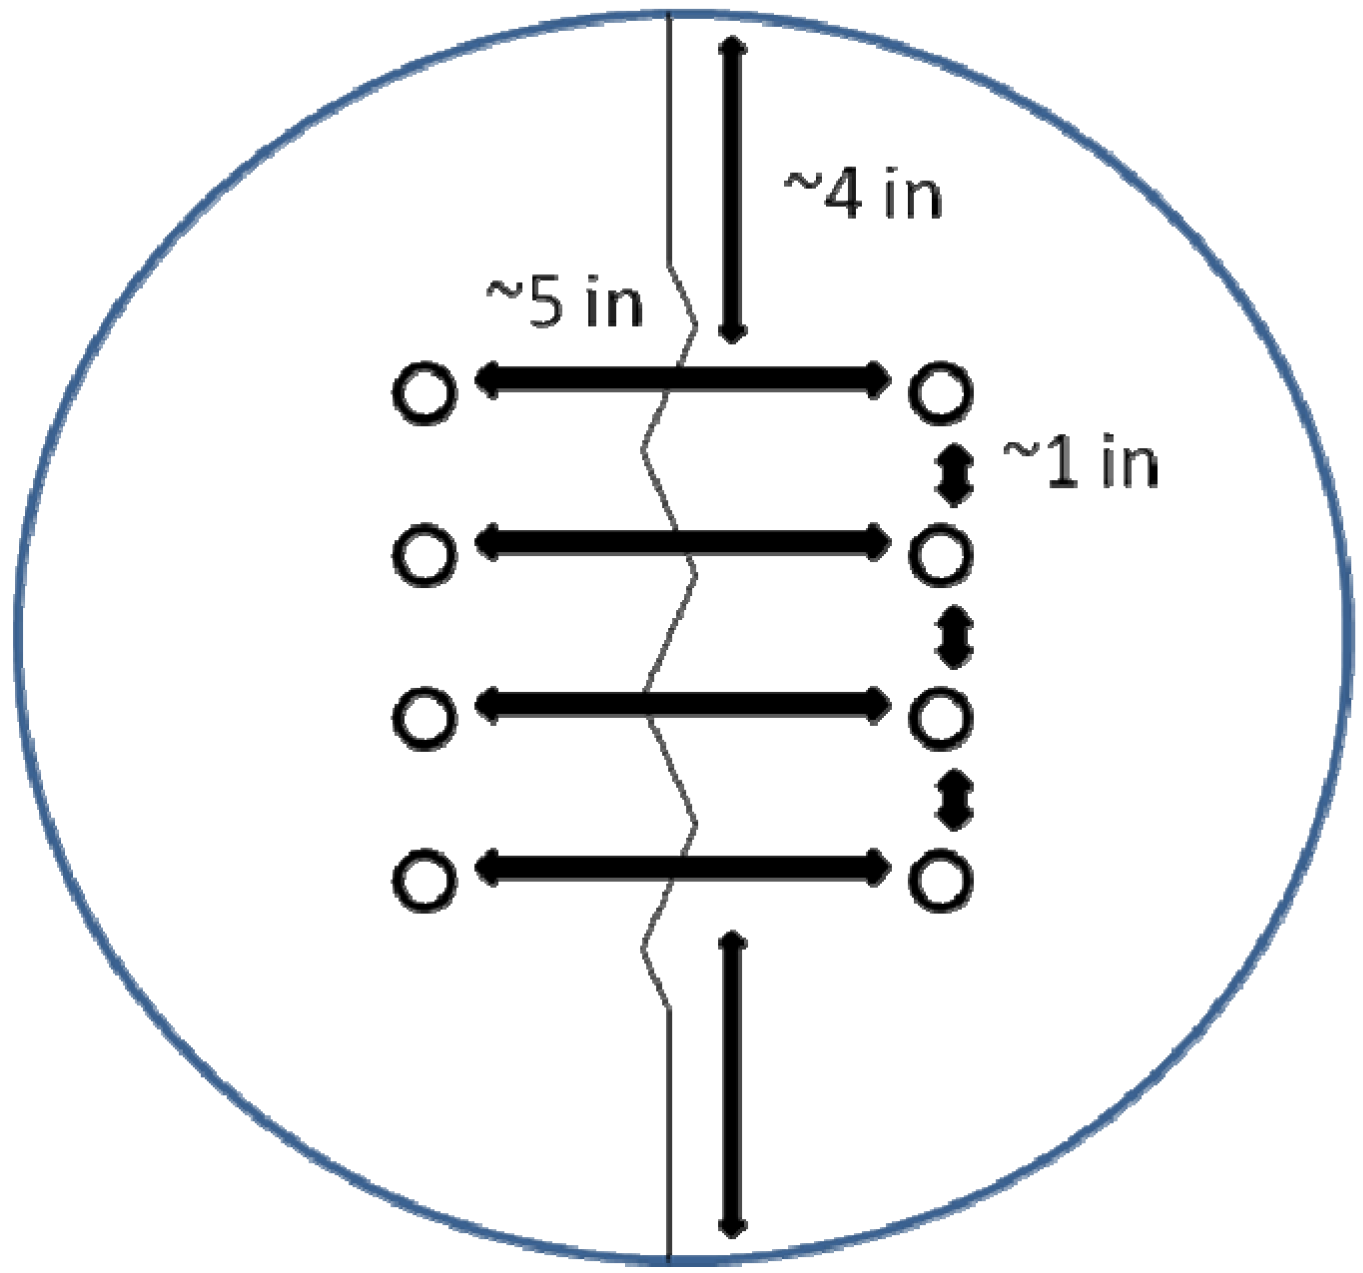
The sample was then symmetrically placed between the Instron clamps, and a layer of neoprene material was added between each clamp plate and the sample to prevent shorting between the metallic plates and the sensor. Given that the tendency of the fabric is to produce a single fold in the middle of the sample when the Instron clamps are brought together, we had to introduce a controlled bend to produce specific fold morphologies. Folds were induced in specific spots by inserting two straight, rigid rods passing through equally spaced perforations on both sides of the sensor, with each rod placed about 2.5" away from the sensor. By changing the orientation of the fabric as the guide rod was inserted, we could induce folds in either direction above and below the perforation. The diameter of the perforation allowed the fabric to slide along the guide rod as the Instron clamps (4" wide, 2" high) moved during flexion and extension (refer to Figure 2, left). Figure 3 shows our bend testing setup. The top and bottom perforations were spaced about 4" from the sensors’ ends to allow room for the Instron clamps and to connect the digital multimeter probes, and 1 in was left between perforations, as depicted in Figure 4. Different combinations of perforations were used to create the desired fold morphology in each test.
Figure 3.
Denim bend test setup: denim sample clamped between Instron plates and connected to digital multimeter.
Figure 3.
Denim bend test setup: denim sample clamped between Instron plates and connected to digital multimeter.

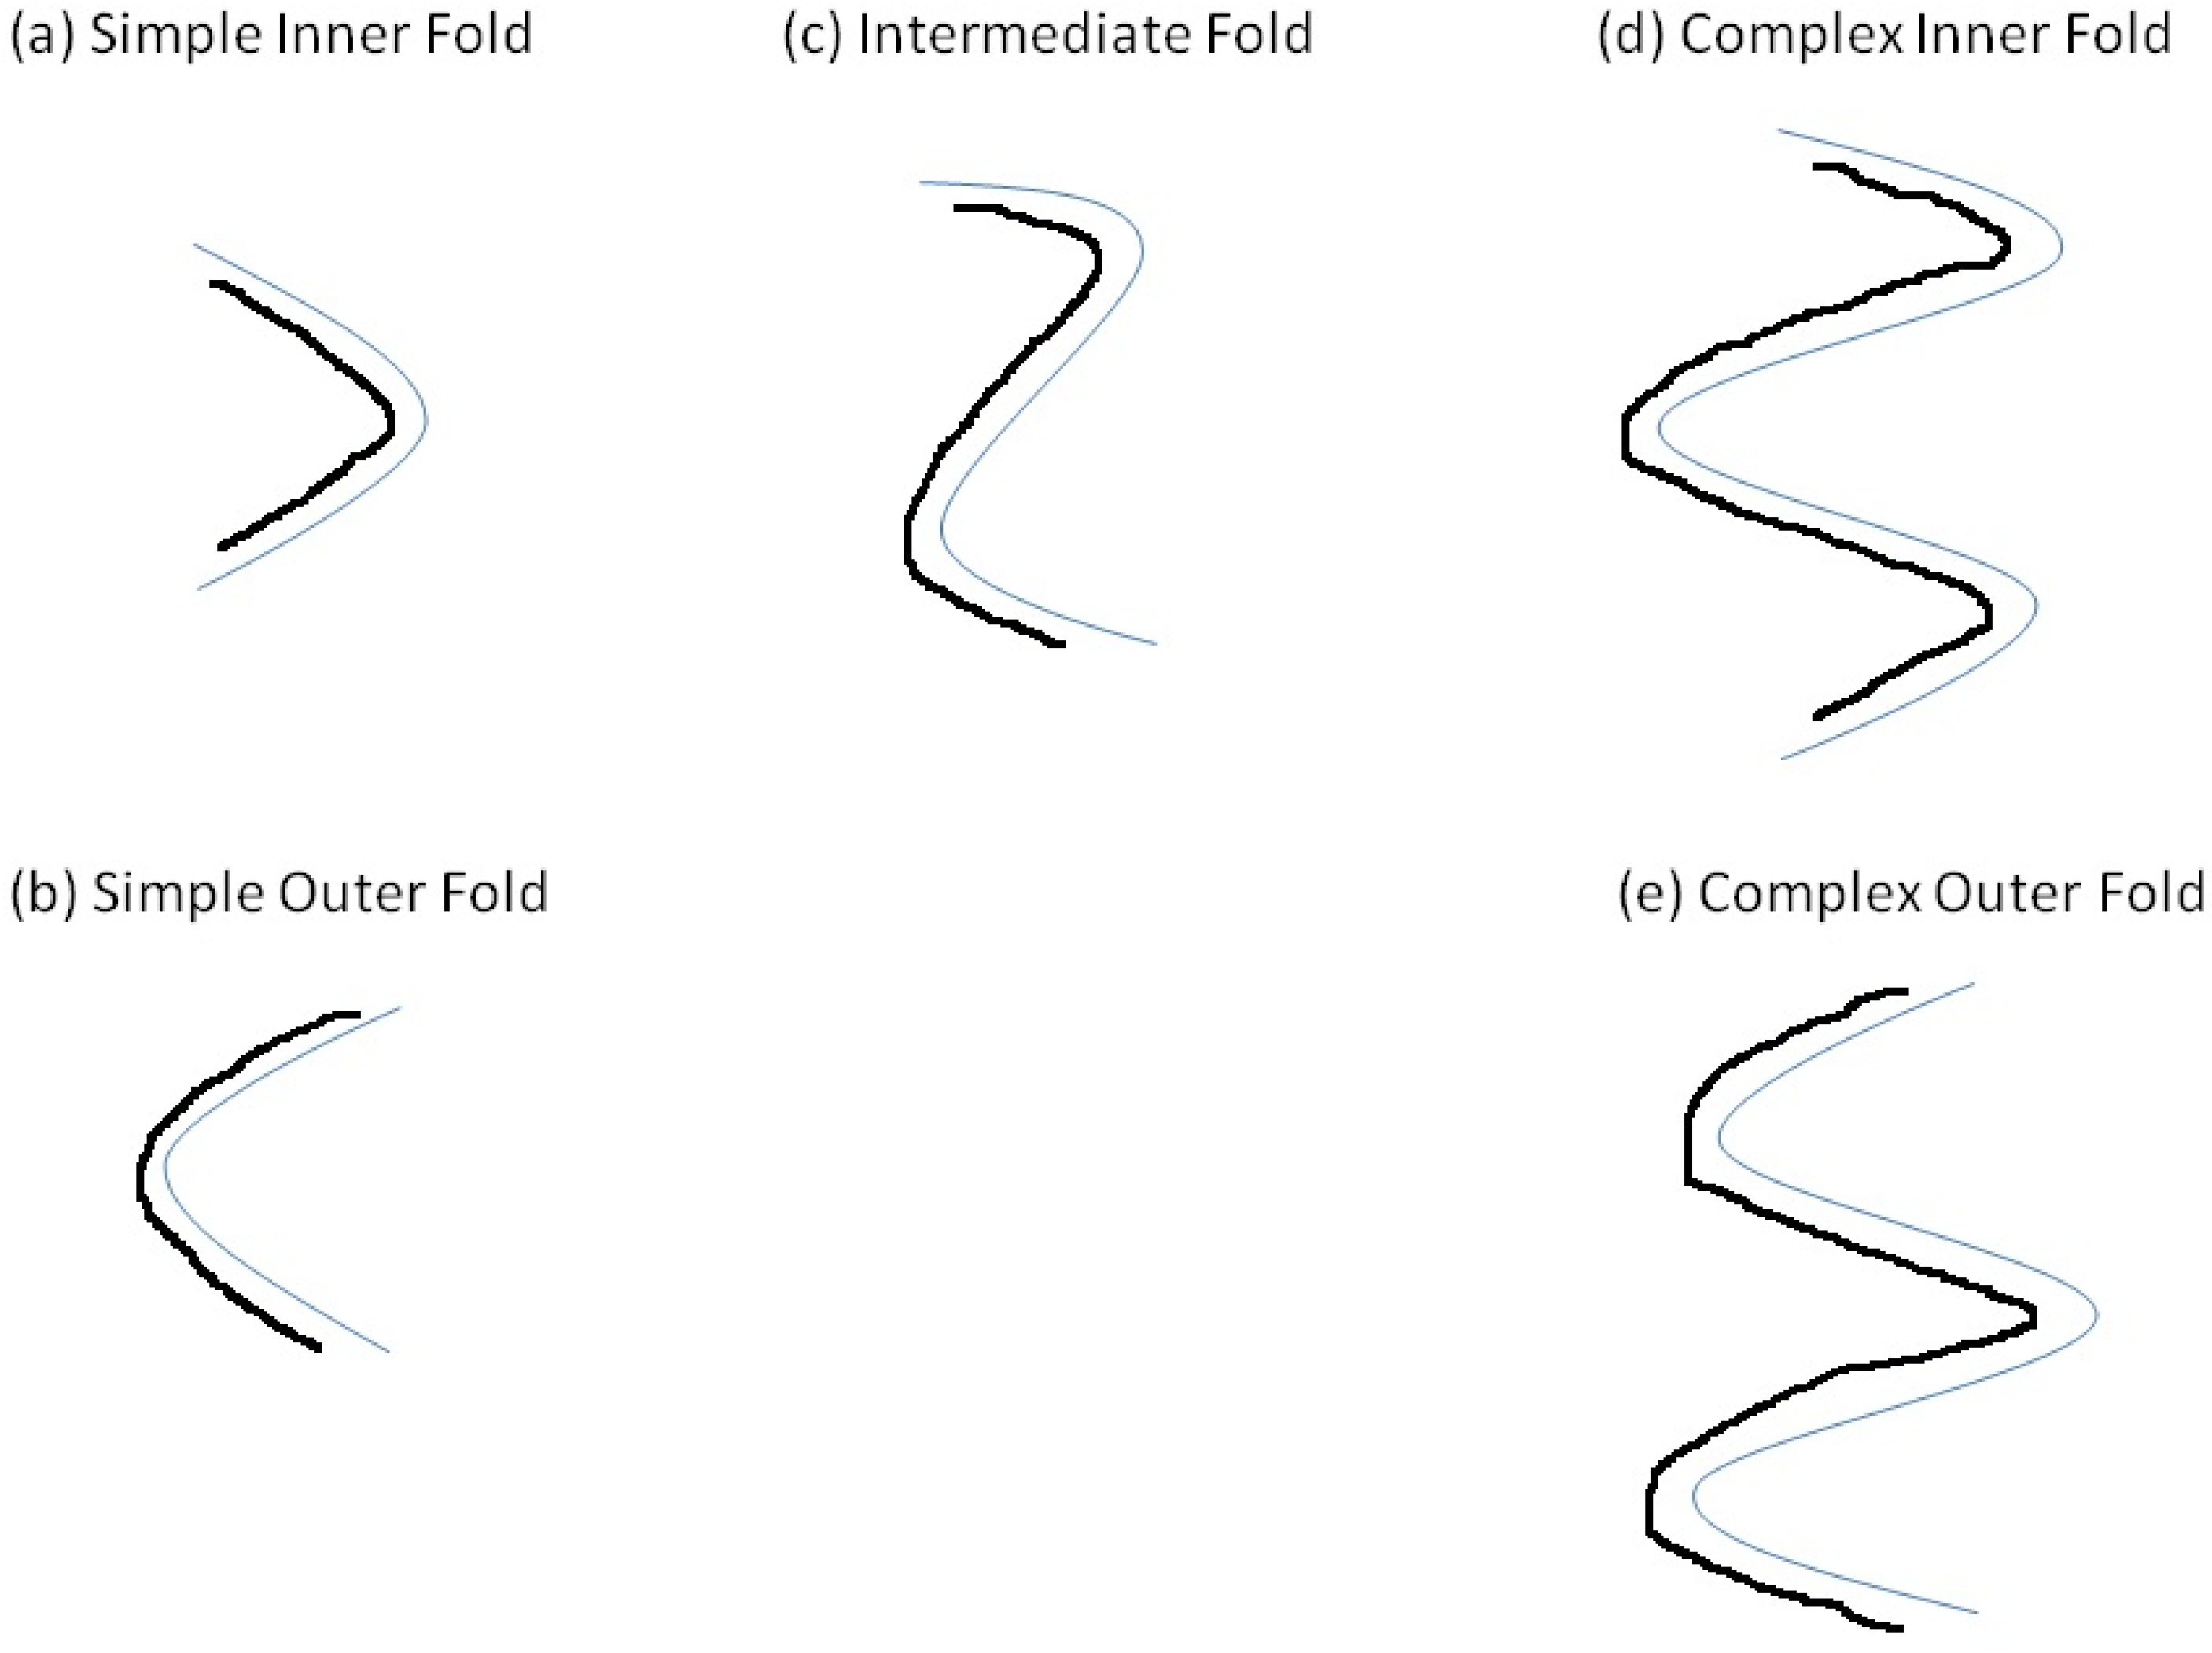
We tested 5 types of fabric bending morphology, depending on the number and direction of folds generated. Folds were generated in three categories: simple fold; intermediate fold; complex fold. The simple fold bend type is characterized by one fold (a C shape); the intermediate fold type by 2 folds (or 2 simple folds in opposite directions, resulting in an S shape); the complex fold type by 3 folds (or 3 alternating-direction simple folds, resulting in a sinusoidal wave). All folds for all bend types have equal lengths: complex folds can be seen as a combination of 3 simple folds; while intermediate fold as a combination of 2 simple folds.
Figure 4.
Denim sample layout for controlled bend: location of perforations for guide rods to control the number of folds.
Figure 4.
Denim sample layout for controlled bend: location of perforations for guide rods to control the number of folds.

For each fold type, we considered the two separate cases of the sensor along the inner (or convex) surface and the outer (or concave) surface of the fold, to investigate the effect of folding direction. The intermediate fold case was considered in only one direction, given the fold’s symmetry, as depicted in Figure 5.
Figure 5.
Fold types drawing (Note: the dark line represents the sensor).

In the un-insulated case, the inner folds at maximum bend cause shorts of the stitch with itself, due to the fact that the conductive thread of the stitch is exposed. In order to insulate the sensor, we fused a thin layer of transparent glue directly on the sensor, preserving sensor response and the fabric bending properties. Figure 3 is a test case of an insulated sensor, magnified in Figure 6 below.
Figure 6.
Insulation by fusing technique: a strip of bonding film is fused on the stitched sensor.
3.2. Test Method
For each test, each denim swatch was bent and straightened for 10 consecutive cycles, where one cycle includes bending plus recovery (straightening) phases. Specifically, for each bend cycle, the complex fold bend starts from an initial length of 5" (equivalent to a 5" distance between the Instron clamps) and bends the fabric 4.5" (down to a 0.5" distance between the Instron clamps plates). The Instron clamps are then returned to their original position, straightening the fold. In the same way, the intermediate fold bend starts from an initial length of 3.5" and bends the fabric 3". Simple fold bend starts from an initial length of 2" and bends the fabric 1.5". Systematically, for each fabric, the test session started by testing the complex inner fold, followed by the complex outer fold test. The Instron bottom plates were then unclamped, and the top plates were lowered from 5" to 3.5" to test the intermediate fold. Finally, the Instron bottom plates were unclamped again and the top plates lowered from 3.5" to 2" to test the simple outer fold first and then the simple inner fold after. The length of the sensor between the Instron clamps (and the corresponding displacement during bending) was chosen so that all folds had similar diameters and curvature when the fabric was fully bent. The minimum separation distance for the Instron clamps was calibrated to prevent clamps from touching in order to avoid the compression (thus distortion in the output) of the sensor.
The bend sensor output is originated by a geometric change on the number of contact points of the stitch with itself (true for the un-insulated case only) and on the number of self-intersecting yarn contacts in the conductive thread [12].
3.3. Data Analysis
Controlled bends were tested for all fold types, with and without sensor insulation. In order to characterize the sensor response, 8 parameters where computed: baseline resistance; sensitivity; base drift; normal drift; peak-to-peak mean and variance; hysteresis area; and linearity, for both bending and recovery phases. Specifically,
- (1)
- Baseline resistance (BR) is defined as the first peak in the sensor response (corresponding to a straight sensor), RM1 for the insulated case, and for the un-insulated case, RM1 minus the bias introduced by the two sections of sensor between the Instron clamp plates: BR = RM1 – bias;
- (2)
- Sensitivity (S) is the absolute average difference between the minimum and maximum of the sensor output Rci for cycle i normalized by the maximum bend length lx: S = abs (mean(MIN(Rci) – MAX(Rci)))/lx, for all i’s;
- (3)
- Base drift (BD) is the average difference between consecutive maxima (corresponding to the fully straightened sensor position) of the sensor resistance cycles: BD = ((RM2 – RM1) + (RM3 – RM2) + … + (RMN – RMN-1))/(N-1), where N is the number of cycles averaged;
- (4)
- Peak drift (PD) is the average difference between consecutive maxima (corresponding to the fully straightened sensor position) of the sensor resistance cycles: PD = ((Rm2 – Rm1) + (Rm3 – Rm2) + … + (RmN – RmN-1))/(N-1), where N is the number of cycles averaged;
- (5)
- Peak-to-peak (PtoP) is the difference between the minimum and maximum sensor output for each cycle i: PtoP = MIN(Rci) – MAX(Rci);
- (6)
- Hysteresis area (HA) is computed as the area between the bending and recovery curves of the hysteresis plot, using the trapezoidal numerical integration;
- (7)
- Linearity (L) is the slope of the sensor response approximated to a straight line passing between the maximum and minimum of the sensor response at the minimum and maximum bend, respectively.
Baseline resistance and base drift were calculated for the maxima of the sensor output in order to capture the reference resistance of the sensor in the straight position. Peak drift instead refers to the minima and captures the effect of the fabric in generating drift in the amplitude of the sensor response when fully bent. The peak-to-peak is here defined for the generic cycle i. We will refer to it in terms of mean and variance over all N cycles i of the trial.
4. Results
The sensors response preserved, on average, the relations between the folds, even though the variability that exist in the garment movement does not allow one to express more complex folds as the composition of simple ones for all fabrics and the insulated/un-insulated cases tested.
The Simple Fold Case: Alignment and Hysteresis Plots
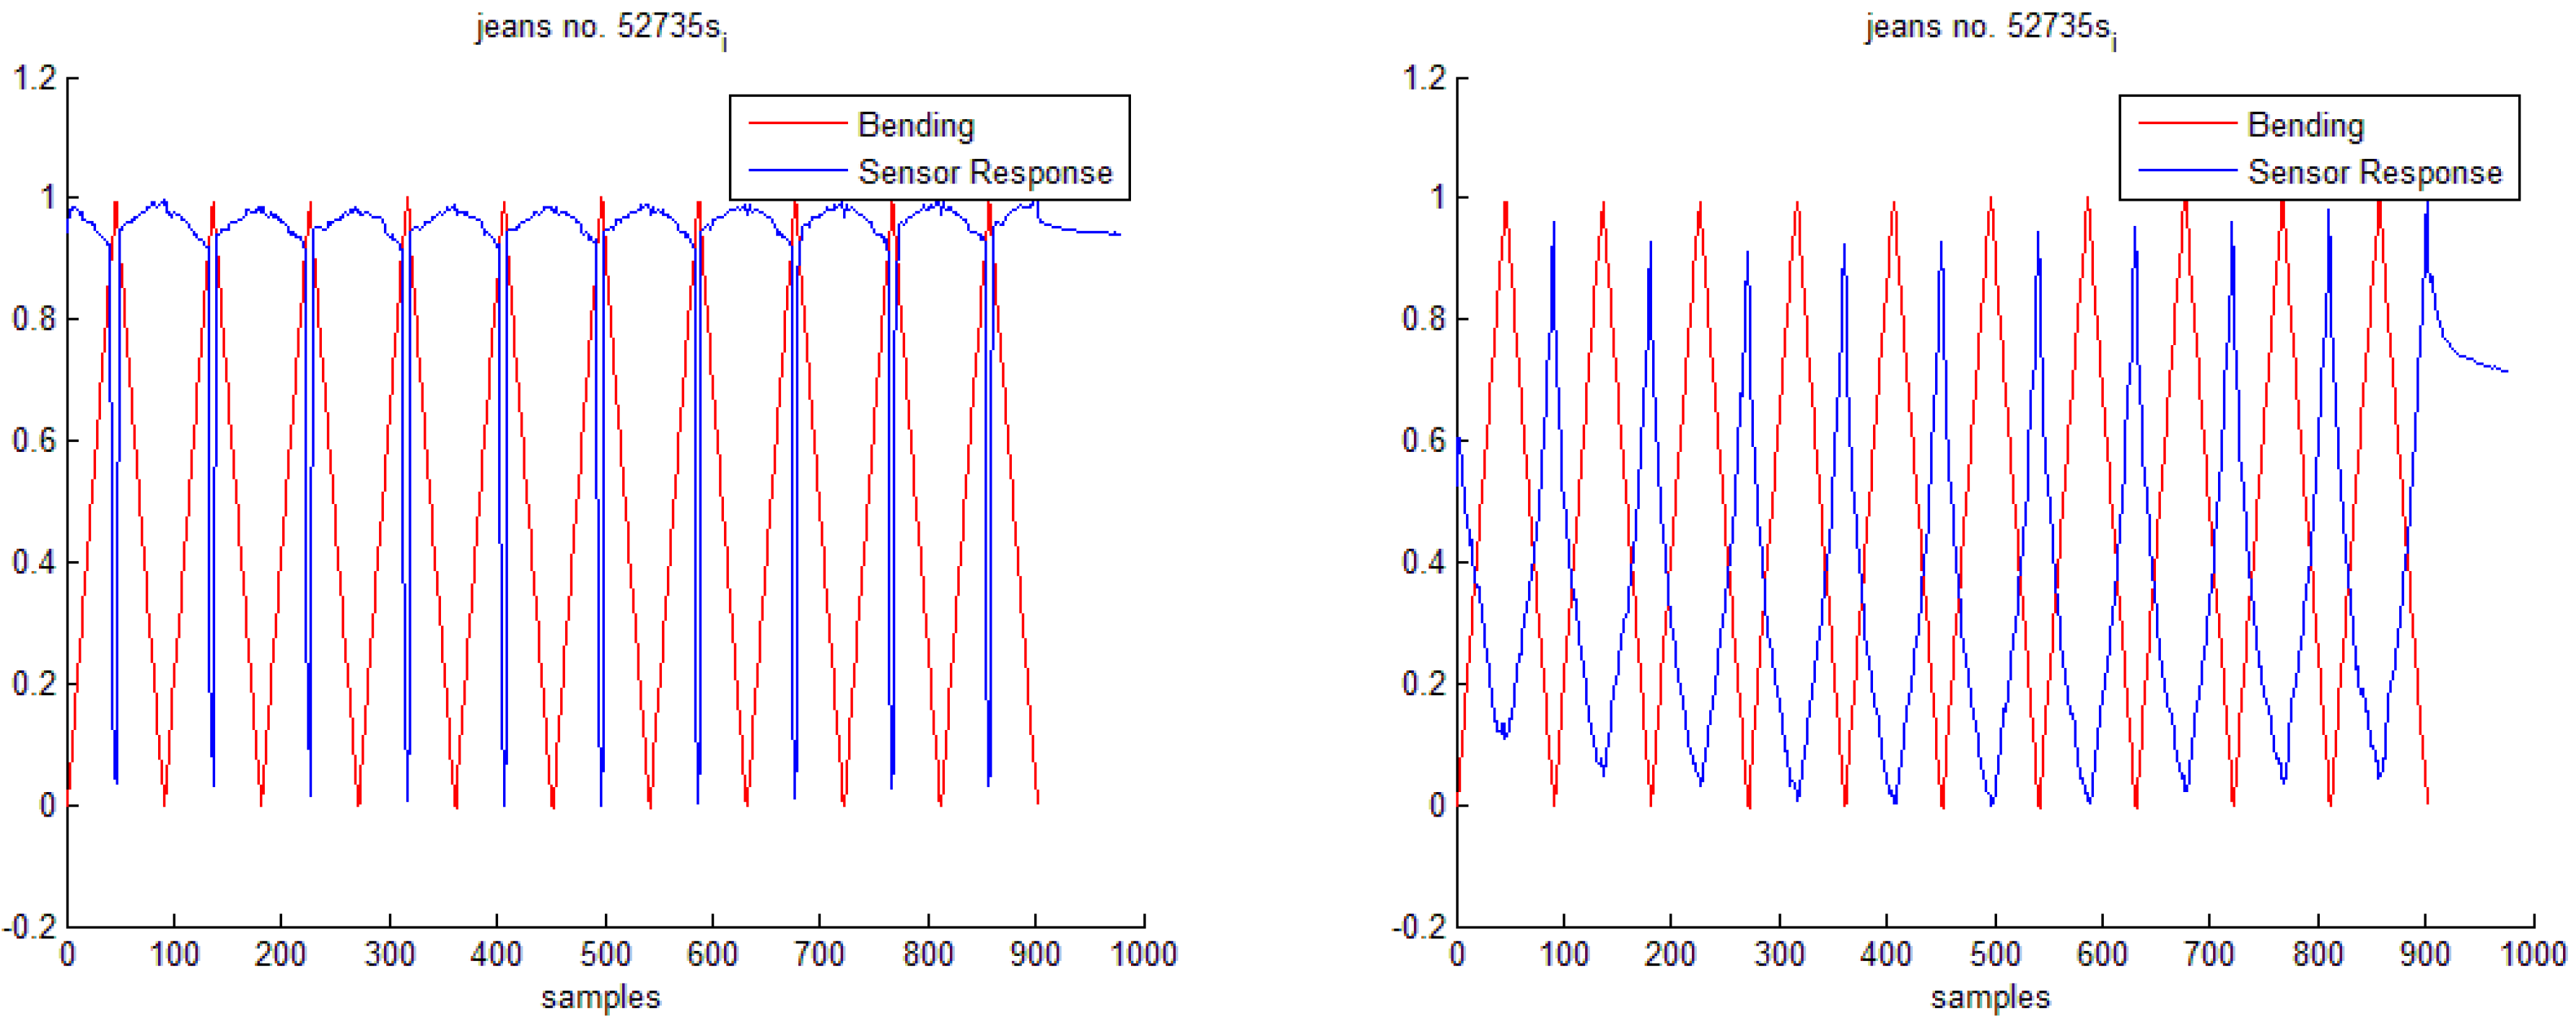
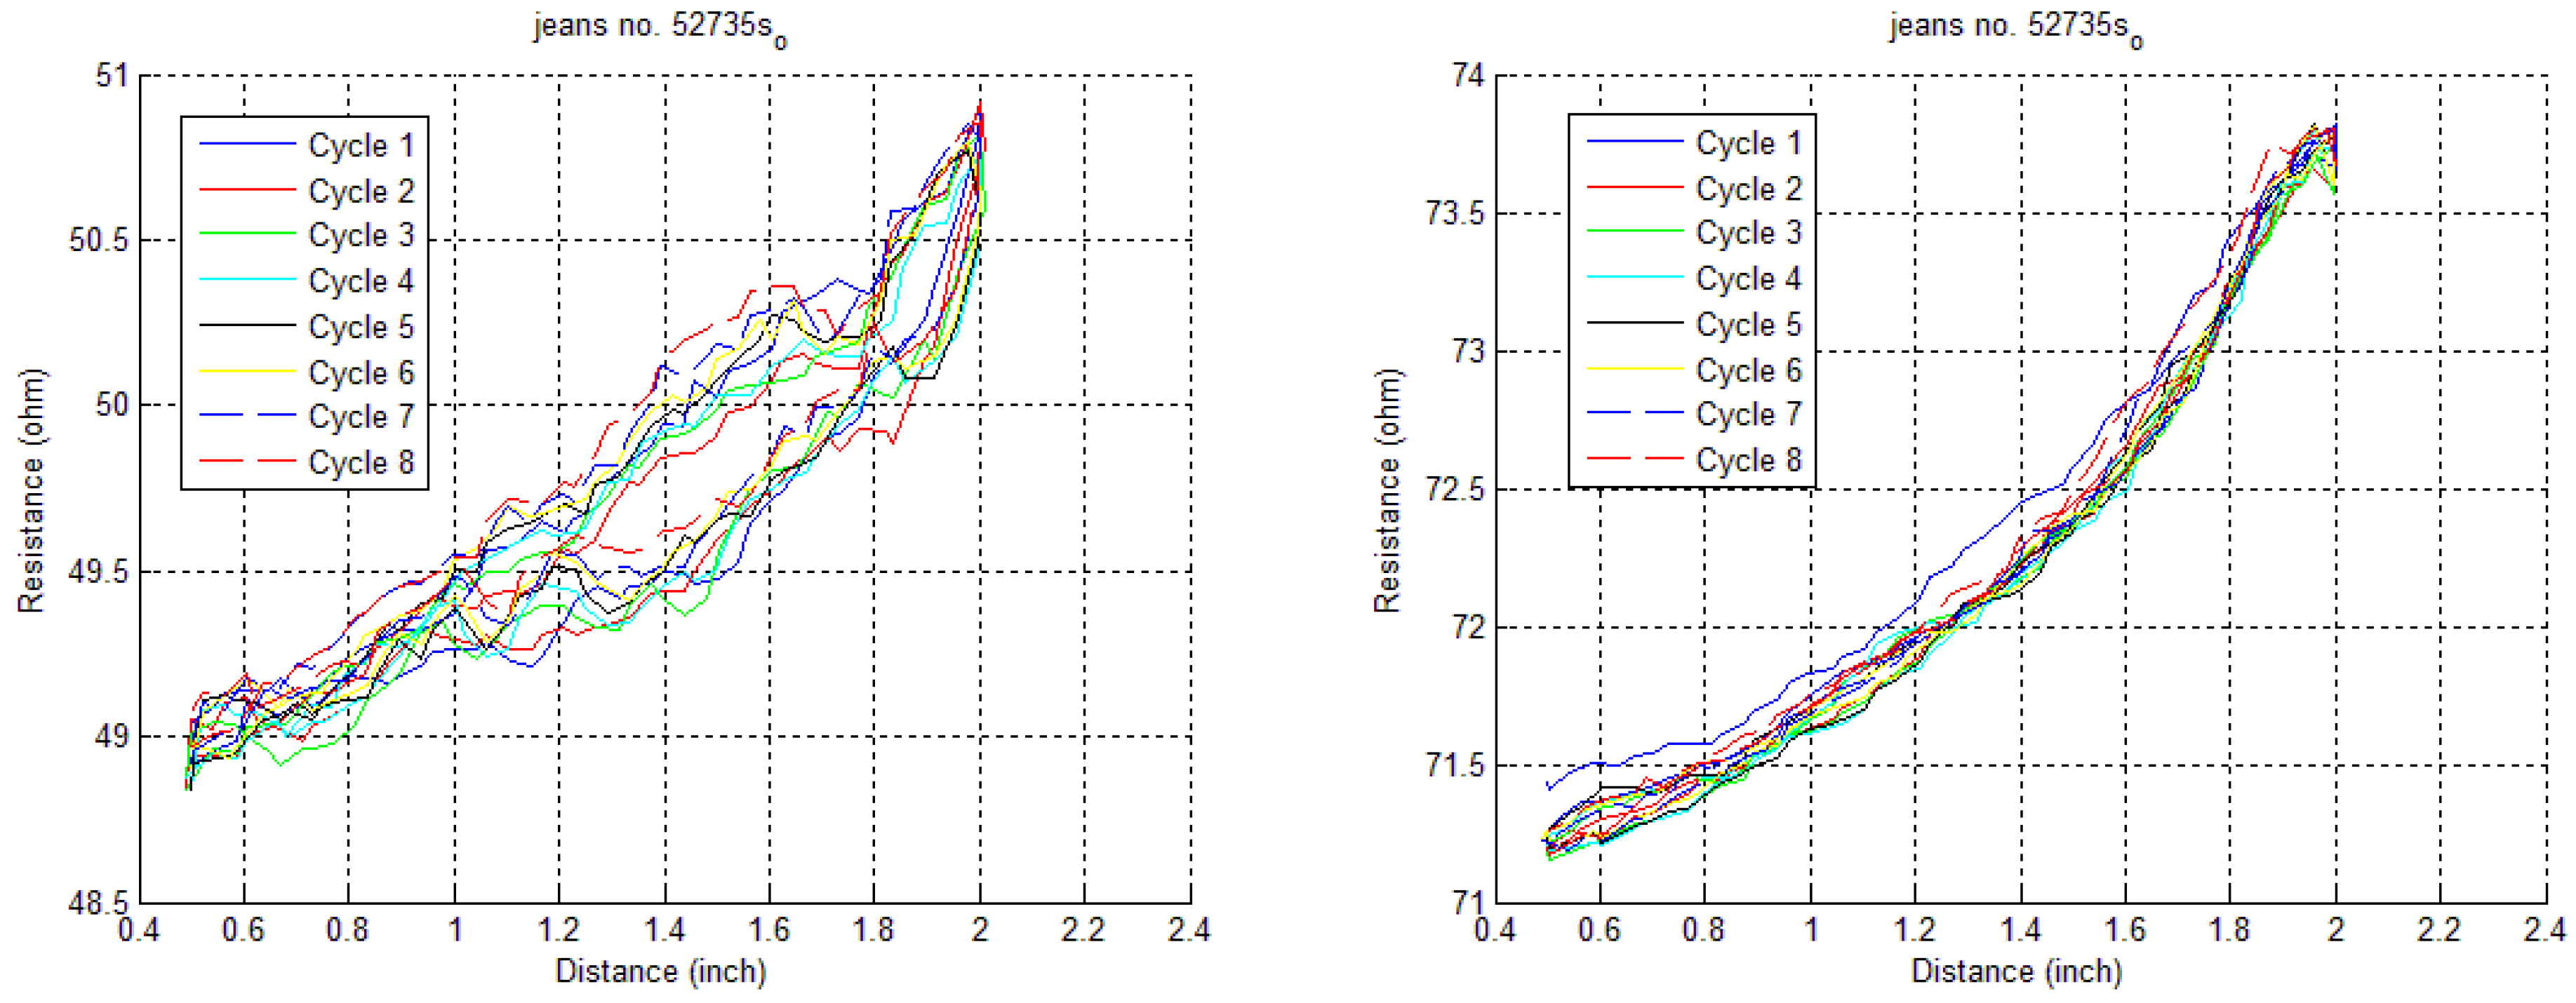
The least stiff and lightest fabric (No. 52735) showed, on average, for a simple bend the largest linearity for both bending and recovery phases and the smallest hysteresis, for both the insulated and the un-insulated case. This fabric is therefore used to show the best case scenario for the sensor response and hysteresis plot used for the calculation of the parameters mentioned above (Figure 7, Figure 8, Figure 9 and Figure 10).
Figure 7.
Normalized alignment, simple inner fold: (left) un-insulated case; (right) insulated case.
Figure 7.
Normalized alignment, simple inner fold: (left) un-insulated case; (right) insulated case.

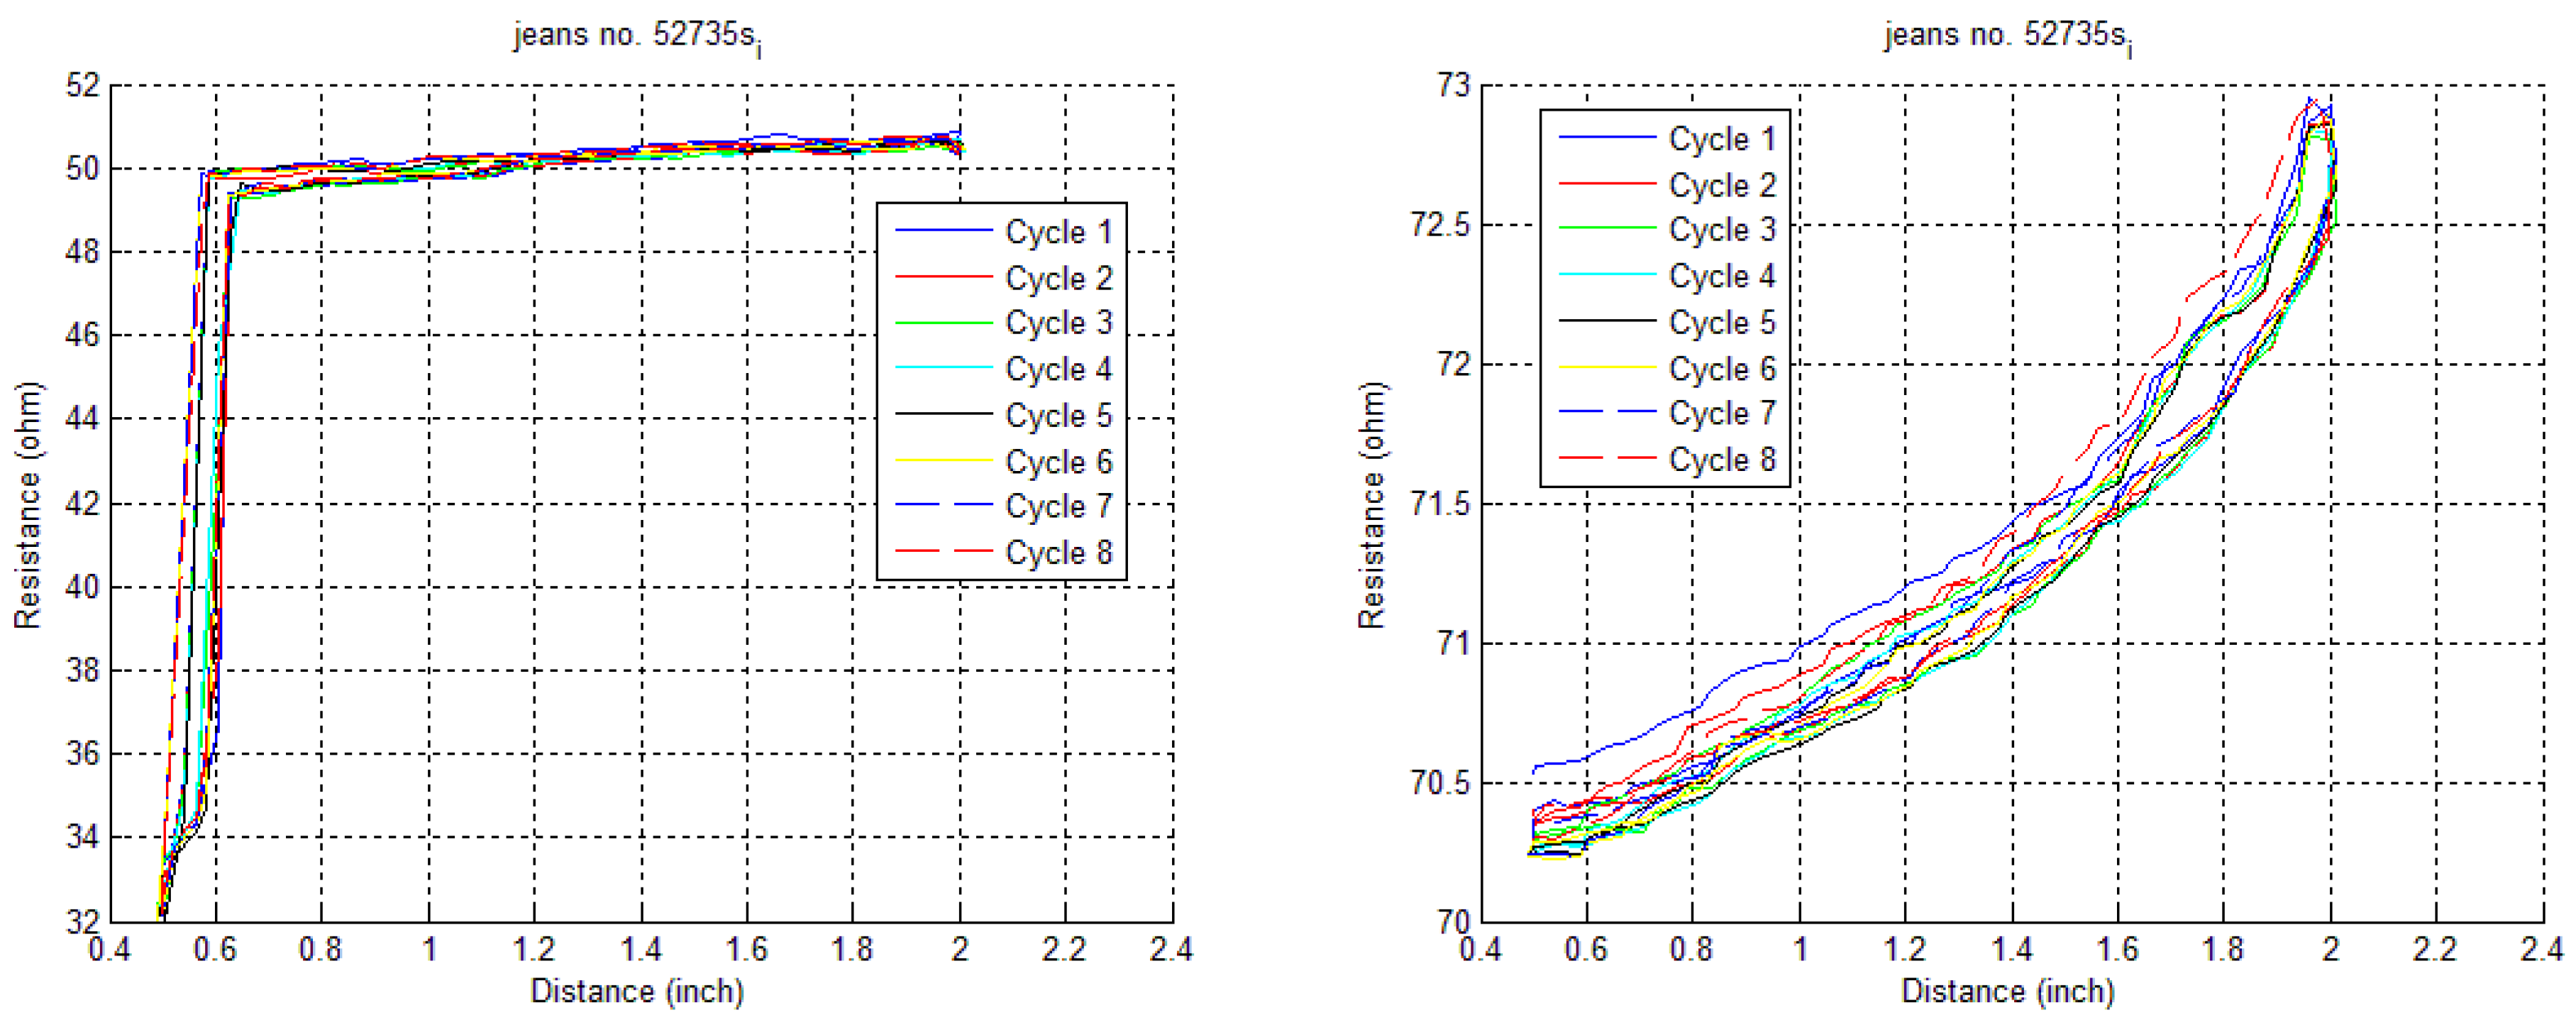
Figure 8.
Hysteresis, simple inner fold: (left) un-insulated case; (right) insulated case.

Figure 9.
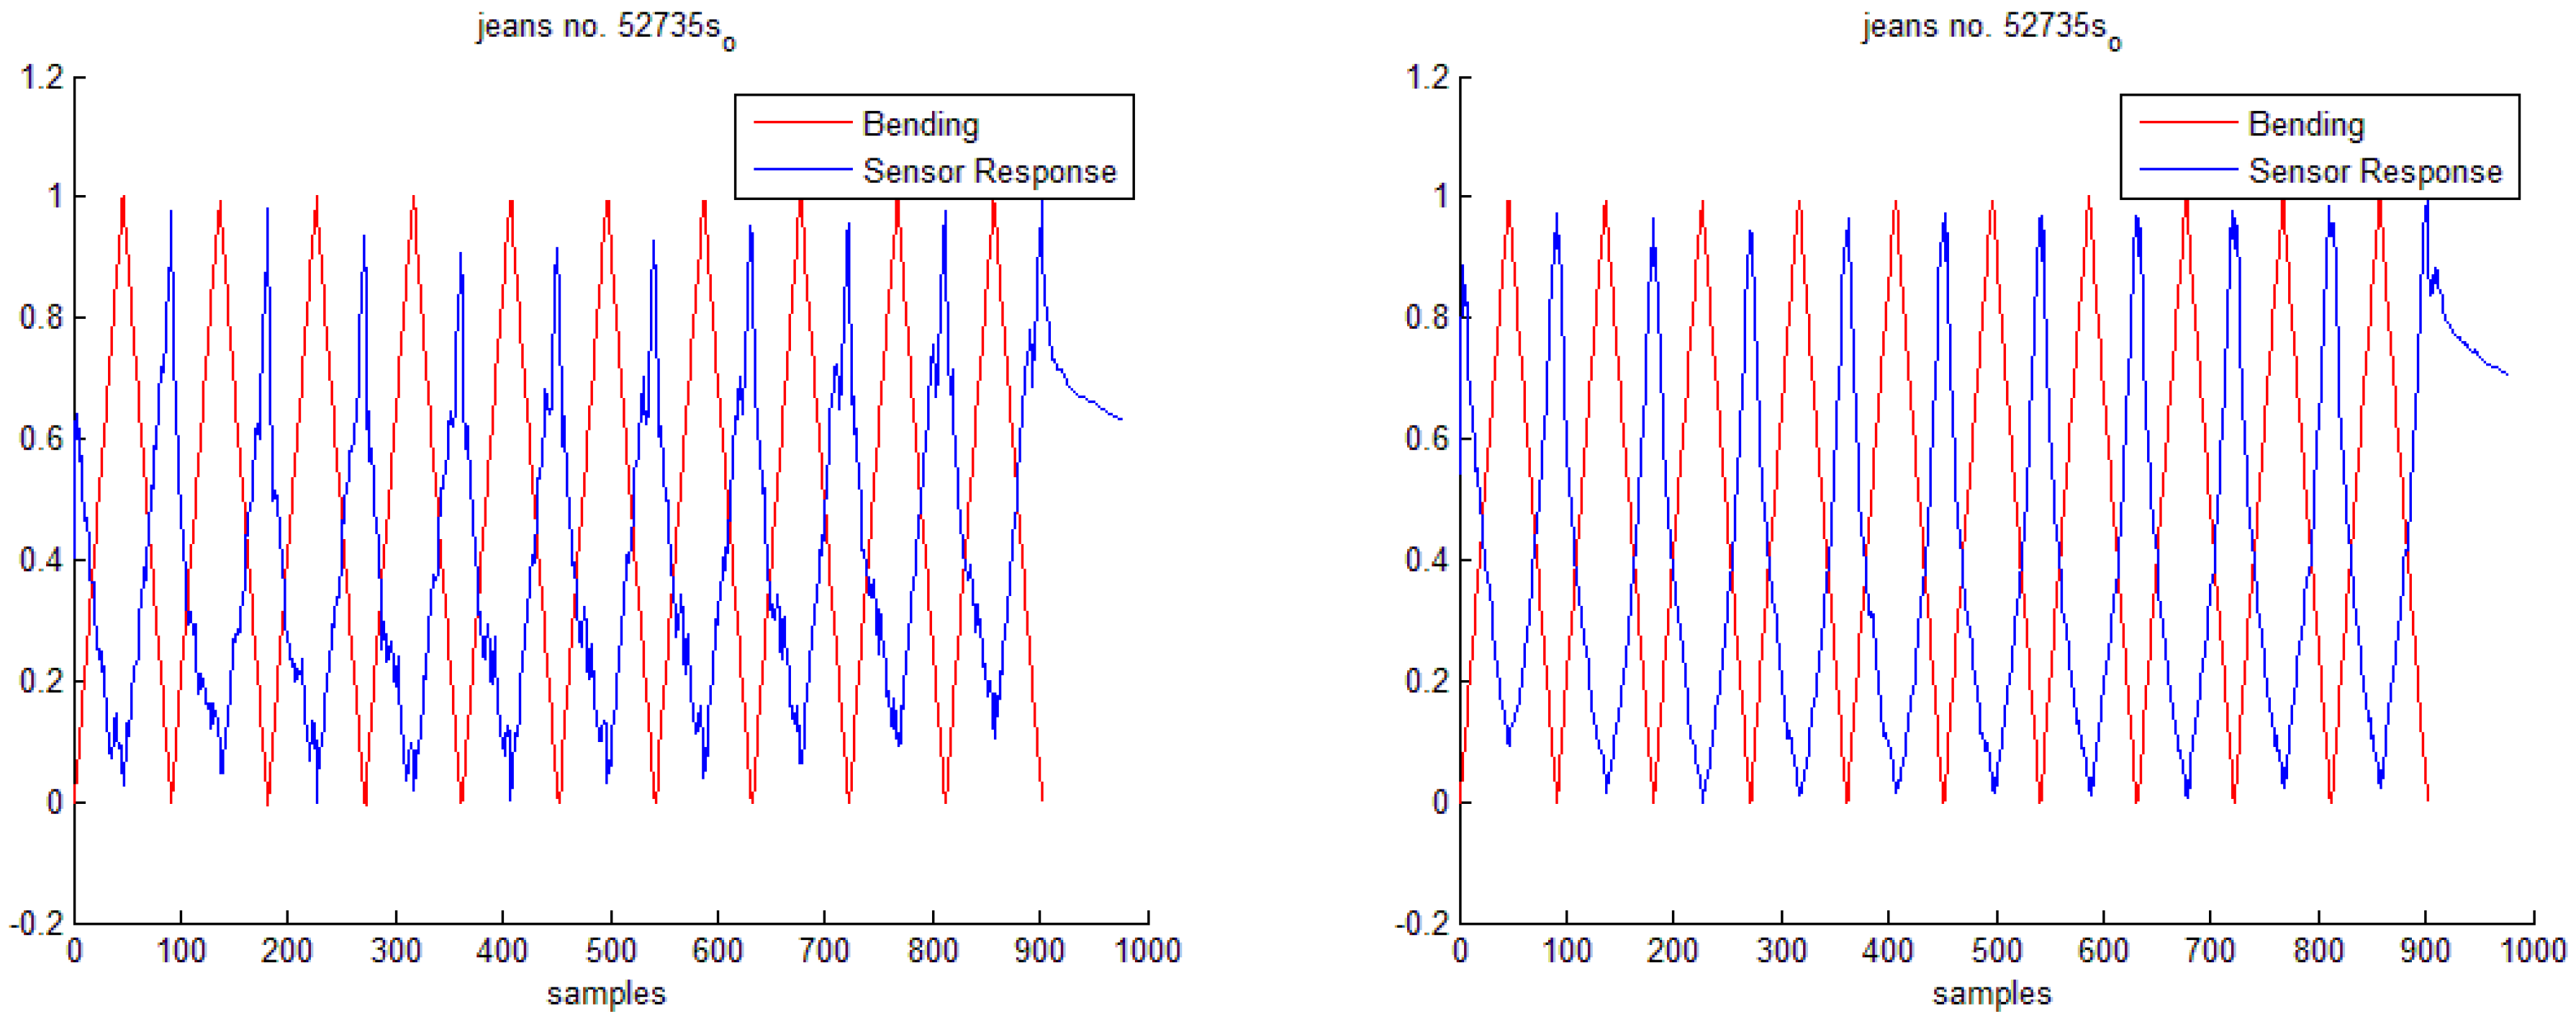
Normalized alignment, simple outer fold: (left) un-insulated case; (right) insulated case.
Figure 9.
Normalized alignment, simple outer fold: (left) un-insulated case; (right) insulated case.

Figure 10.
Hysteresis, simple outer fold: (left) un-insulated case; (right) insulated case.

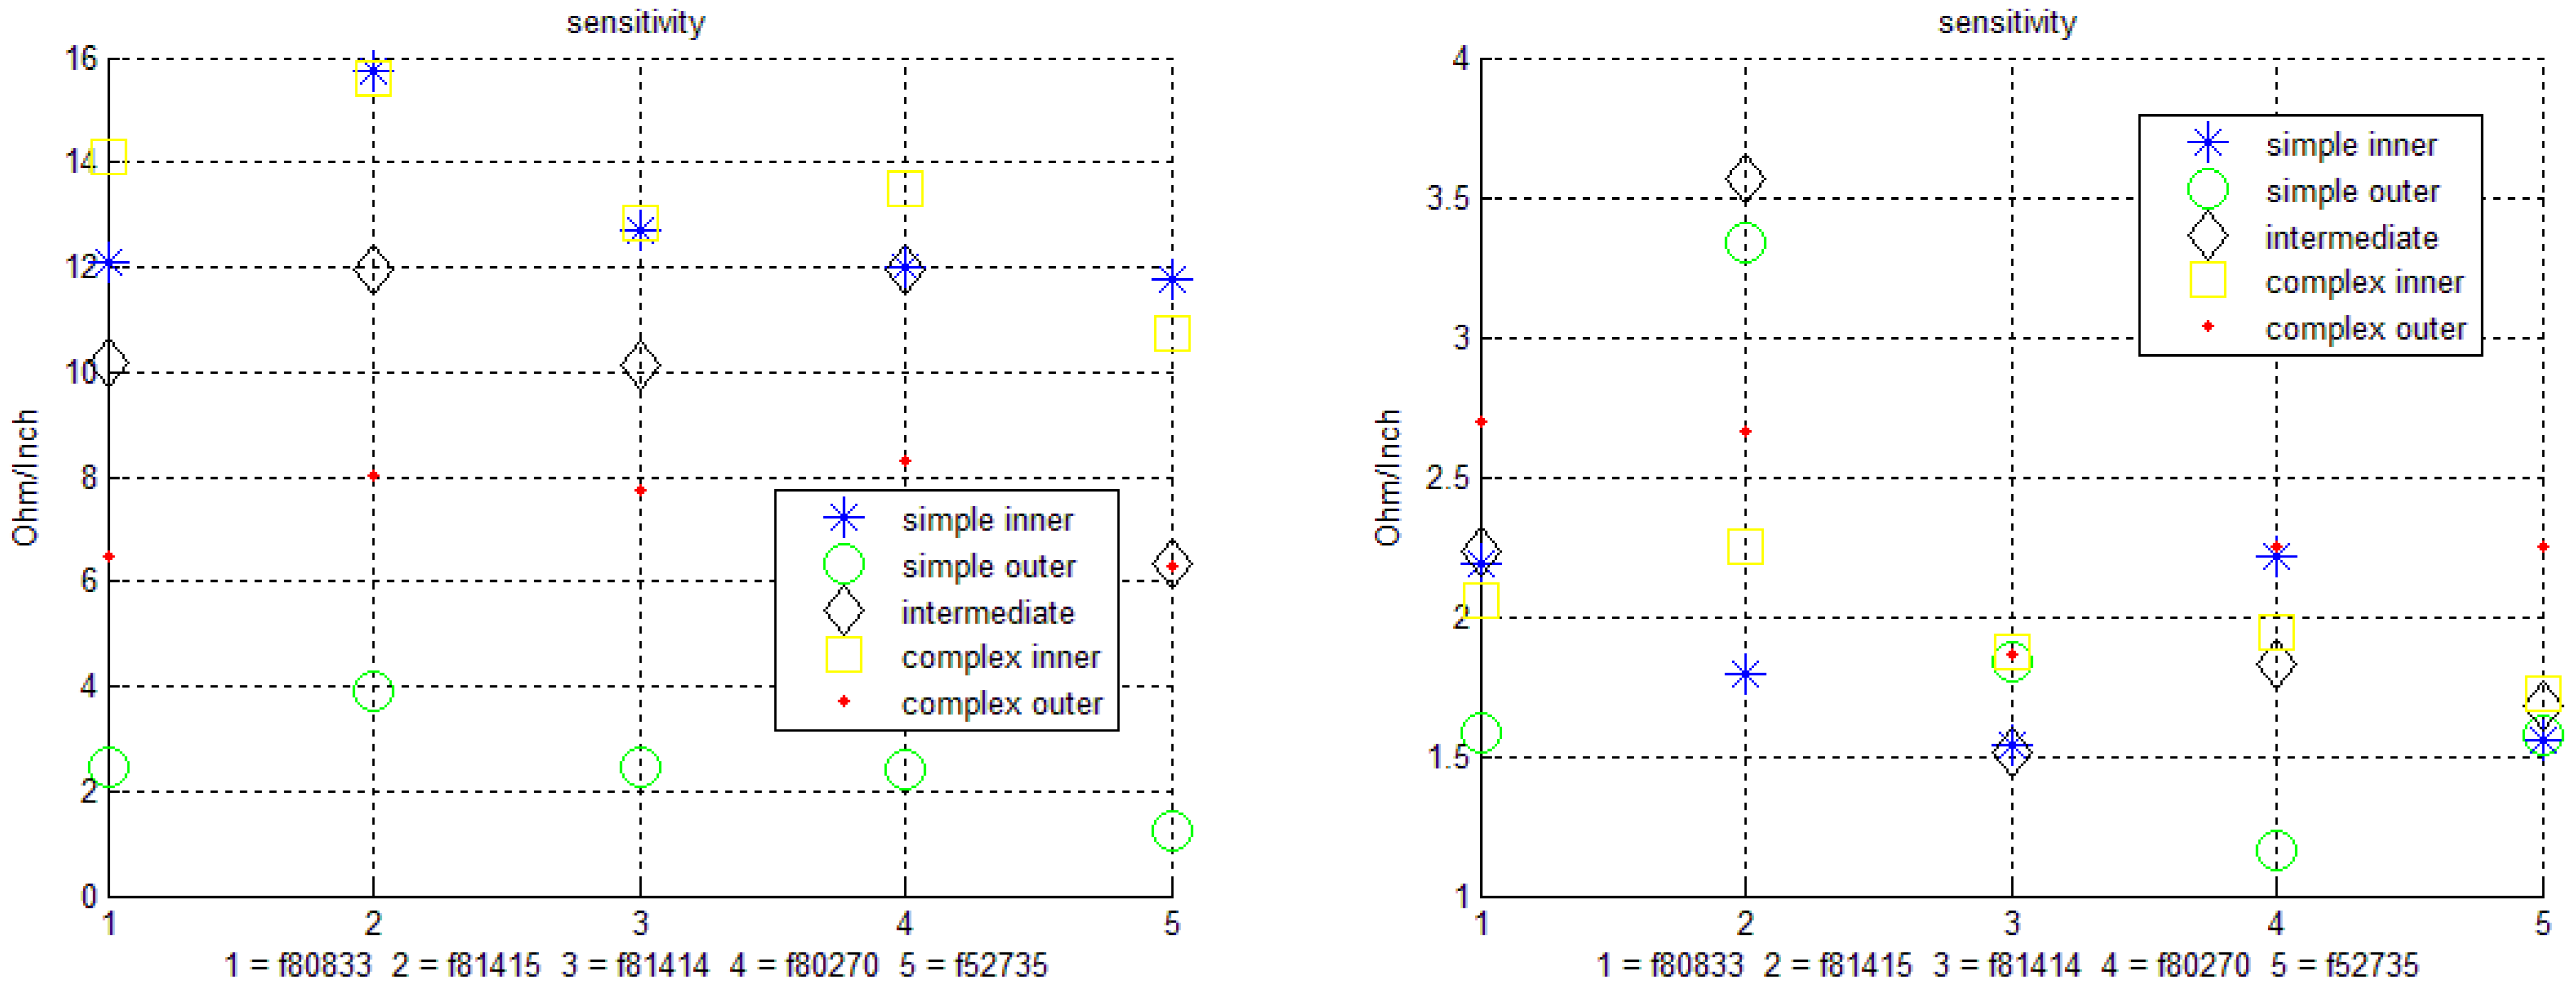
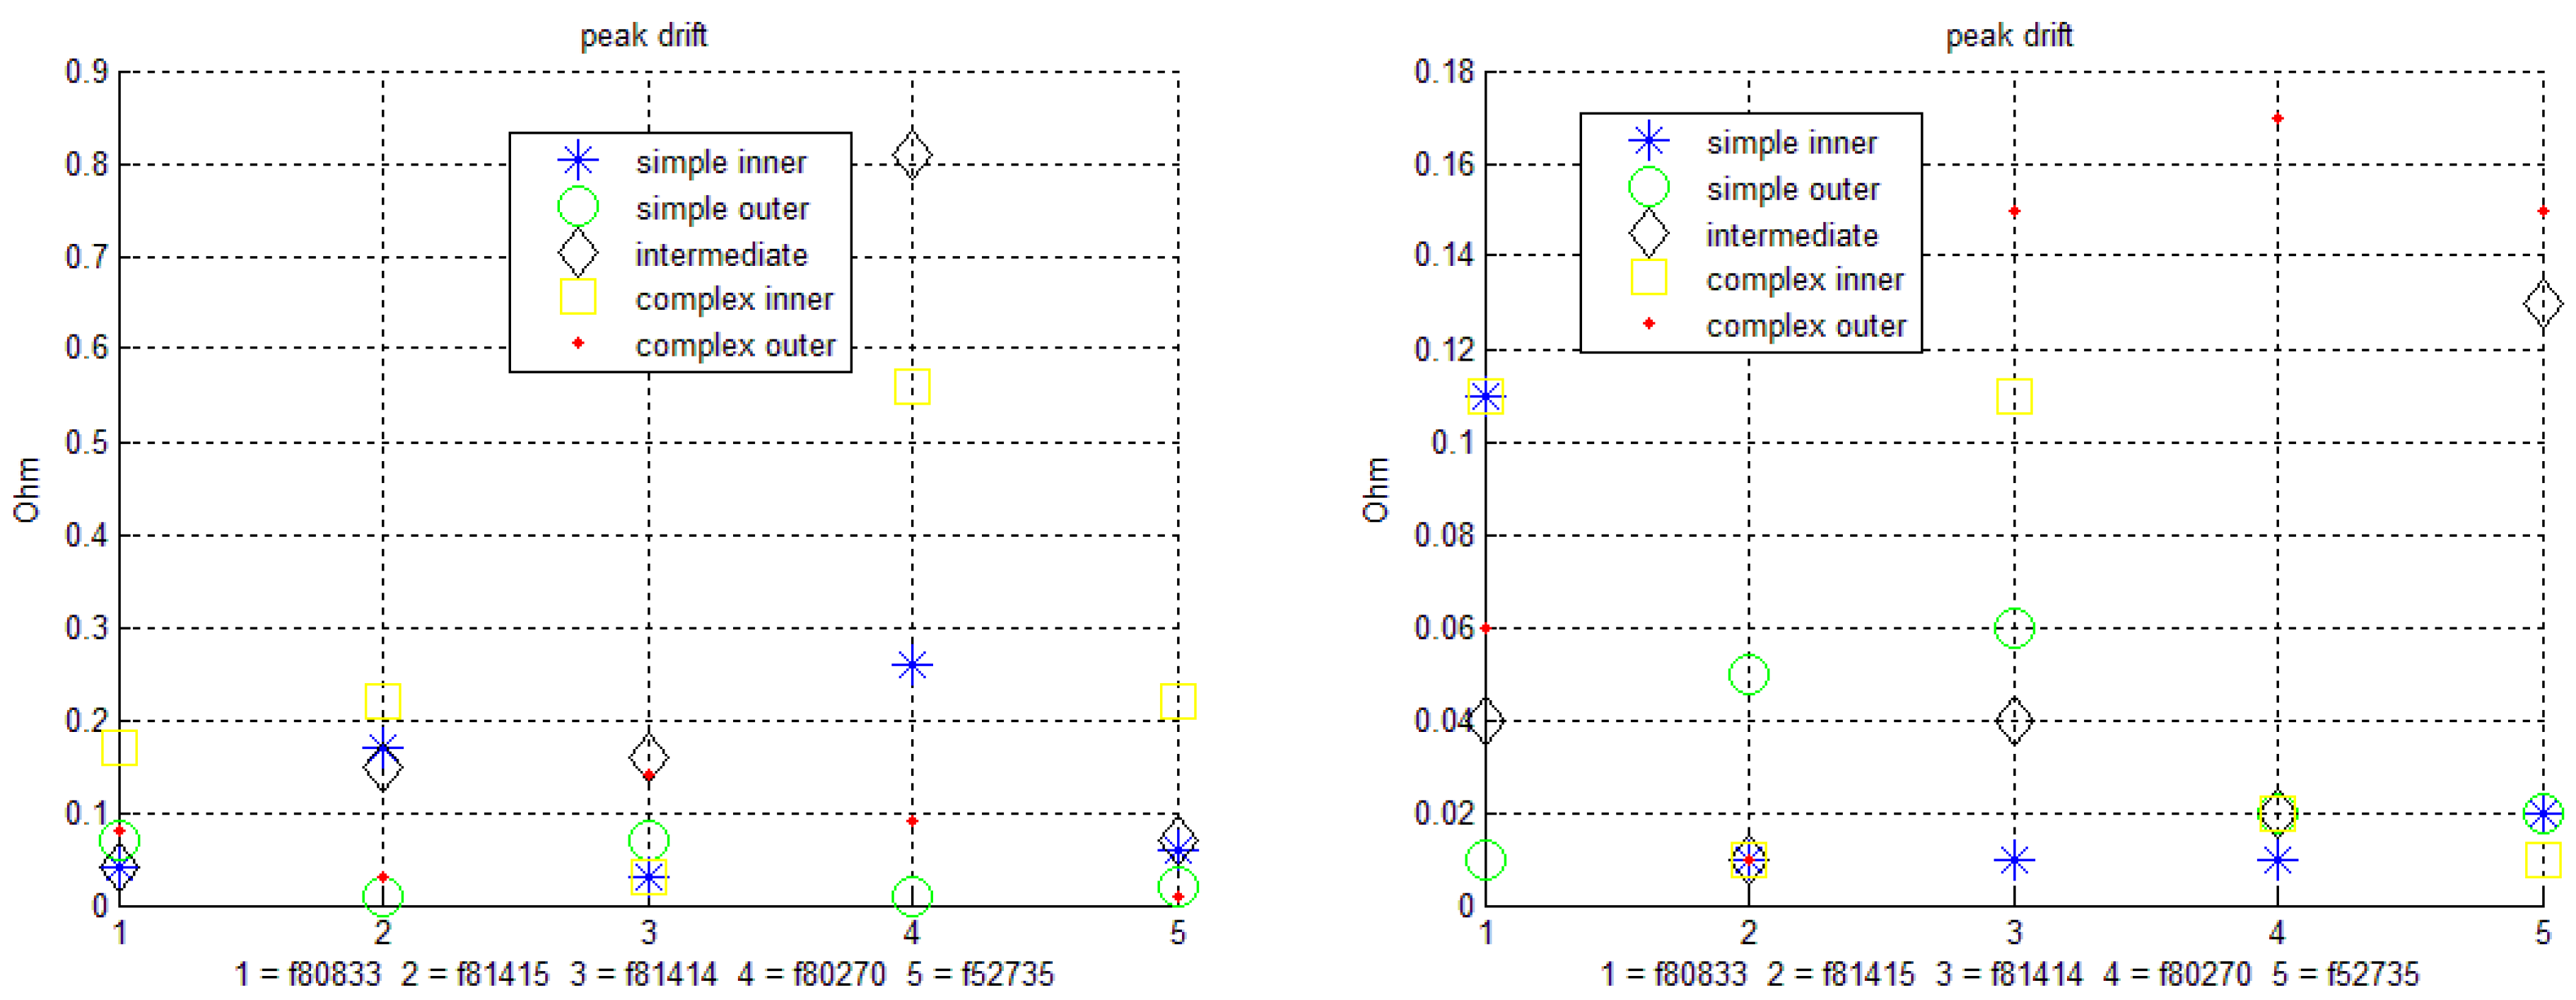
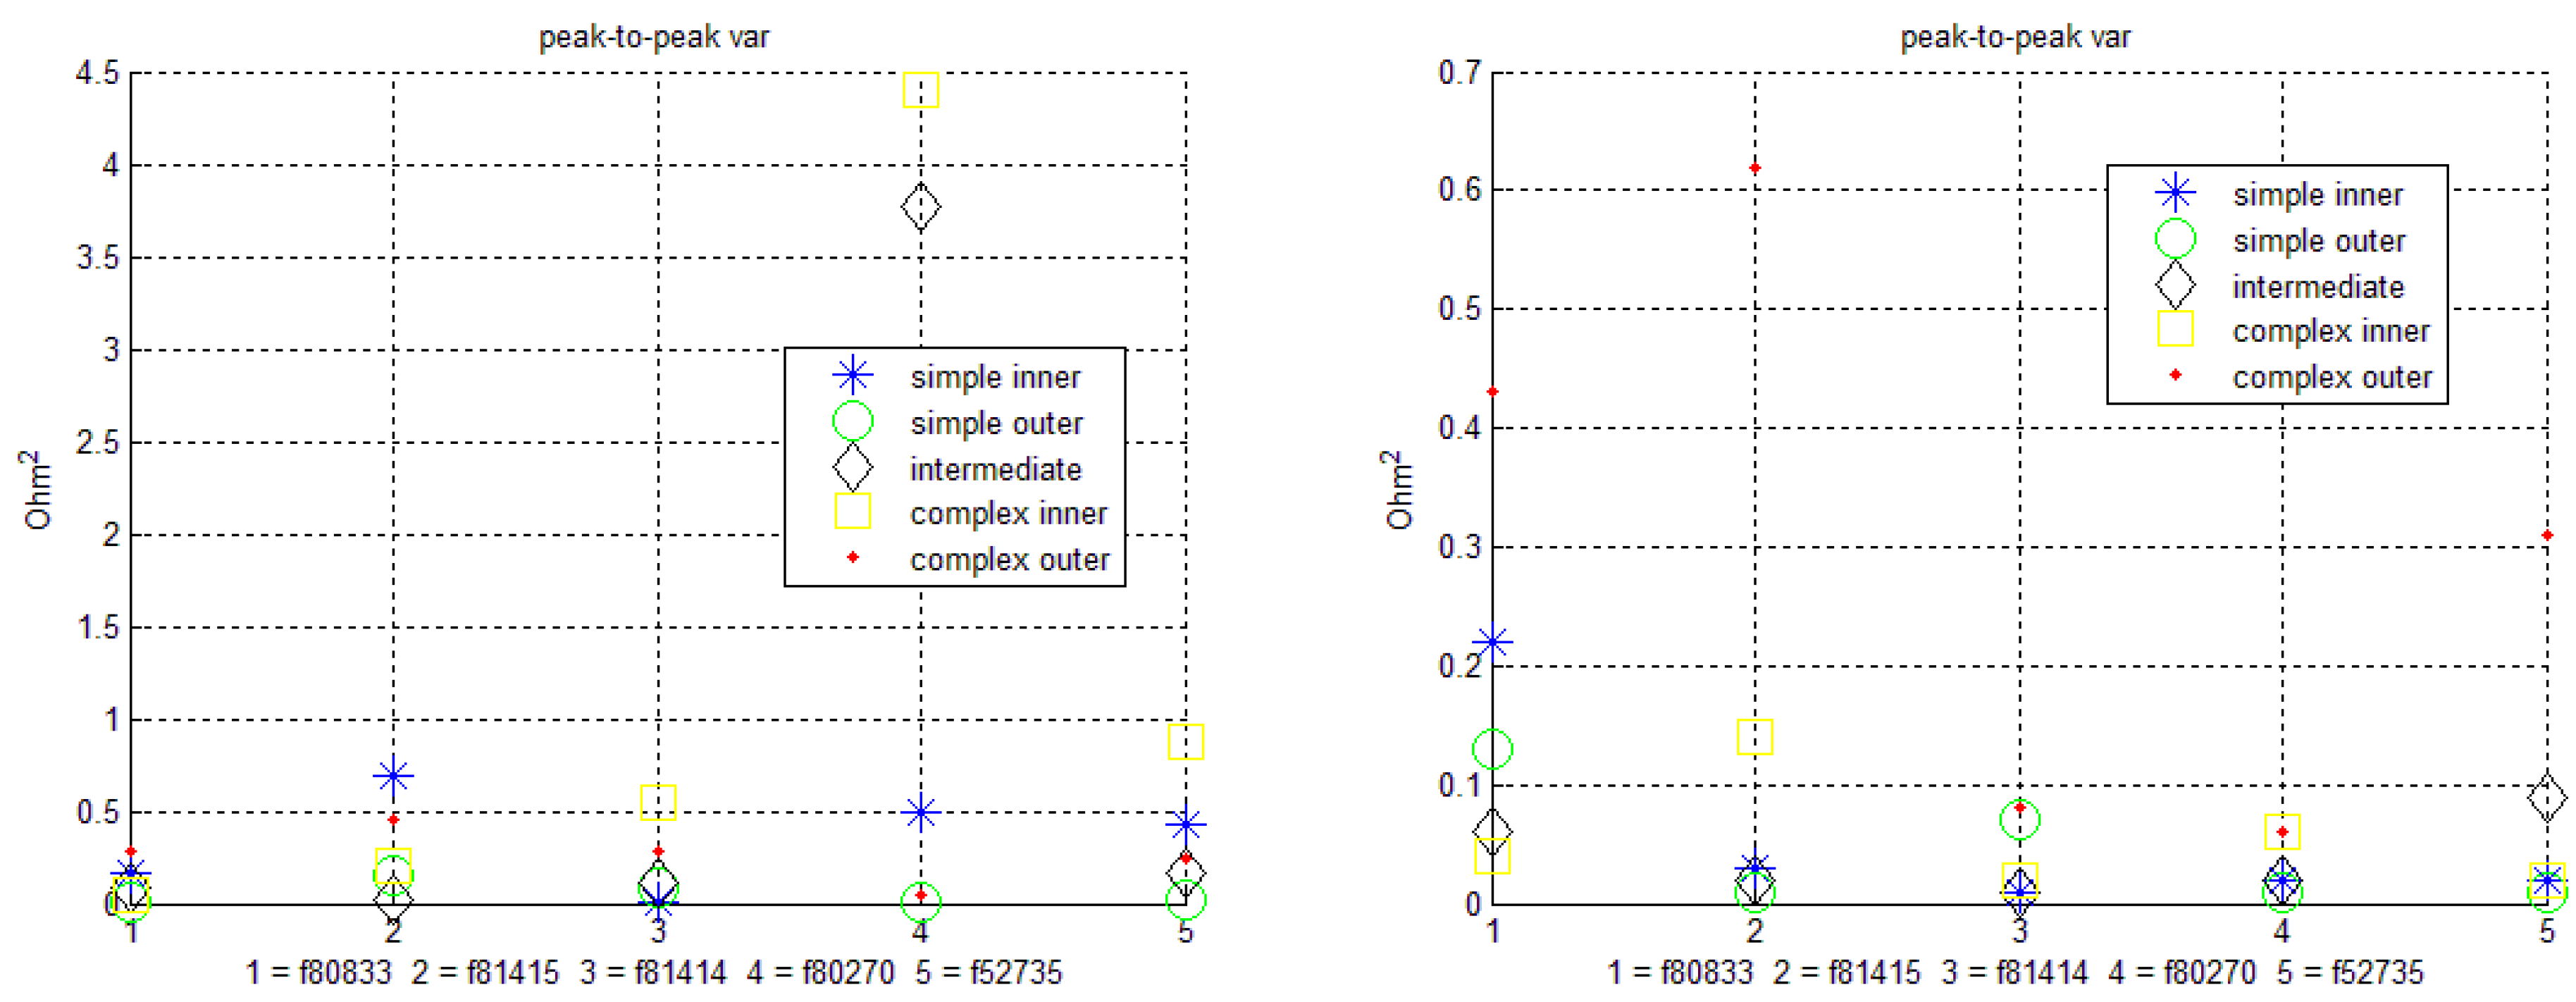
The following figures (Figure 11, Figure 12, Figure 13, Figure 14, Figure 15, Figure 16, Figure 17, Figure 18 and Figure 19) show all values of the sensor parameters introduced in the previous section, computed for all fold types and fabrics. Fabrics are listed in order of decreasing stiffness from 1 to 5 along the ordinates, while along the abscissa, the magnitude of the calculated parameter is displayed. The legend distinguishes the different fold types.
Figure 11.
Baseline resistance: (left) un-insulated case; (right) insulated case.
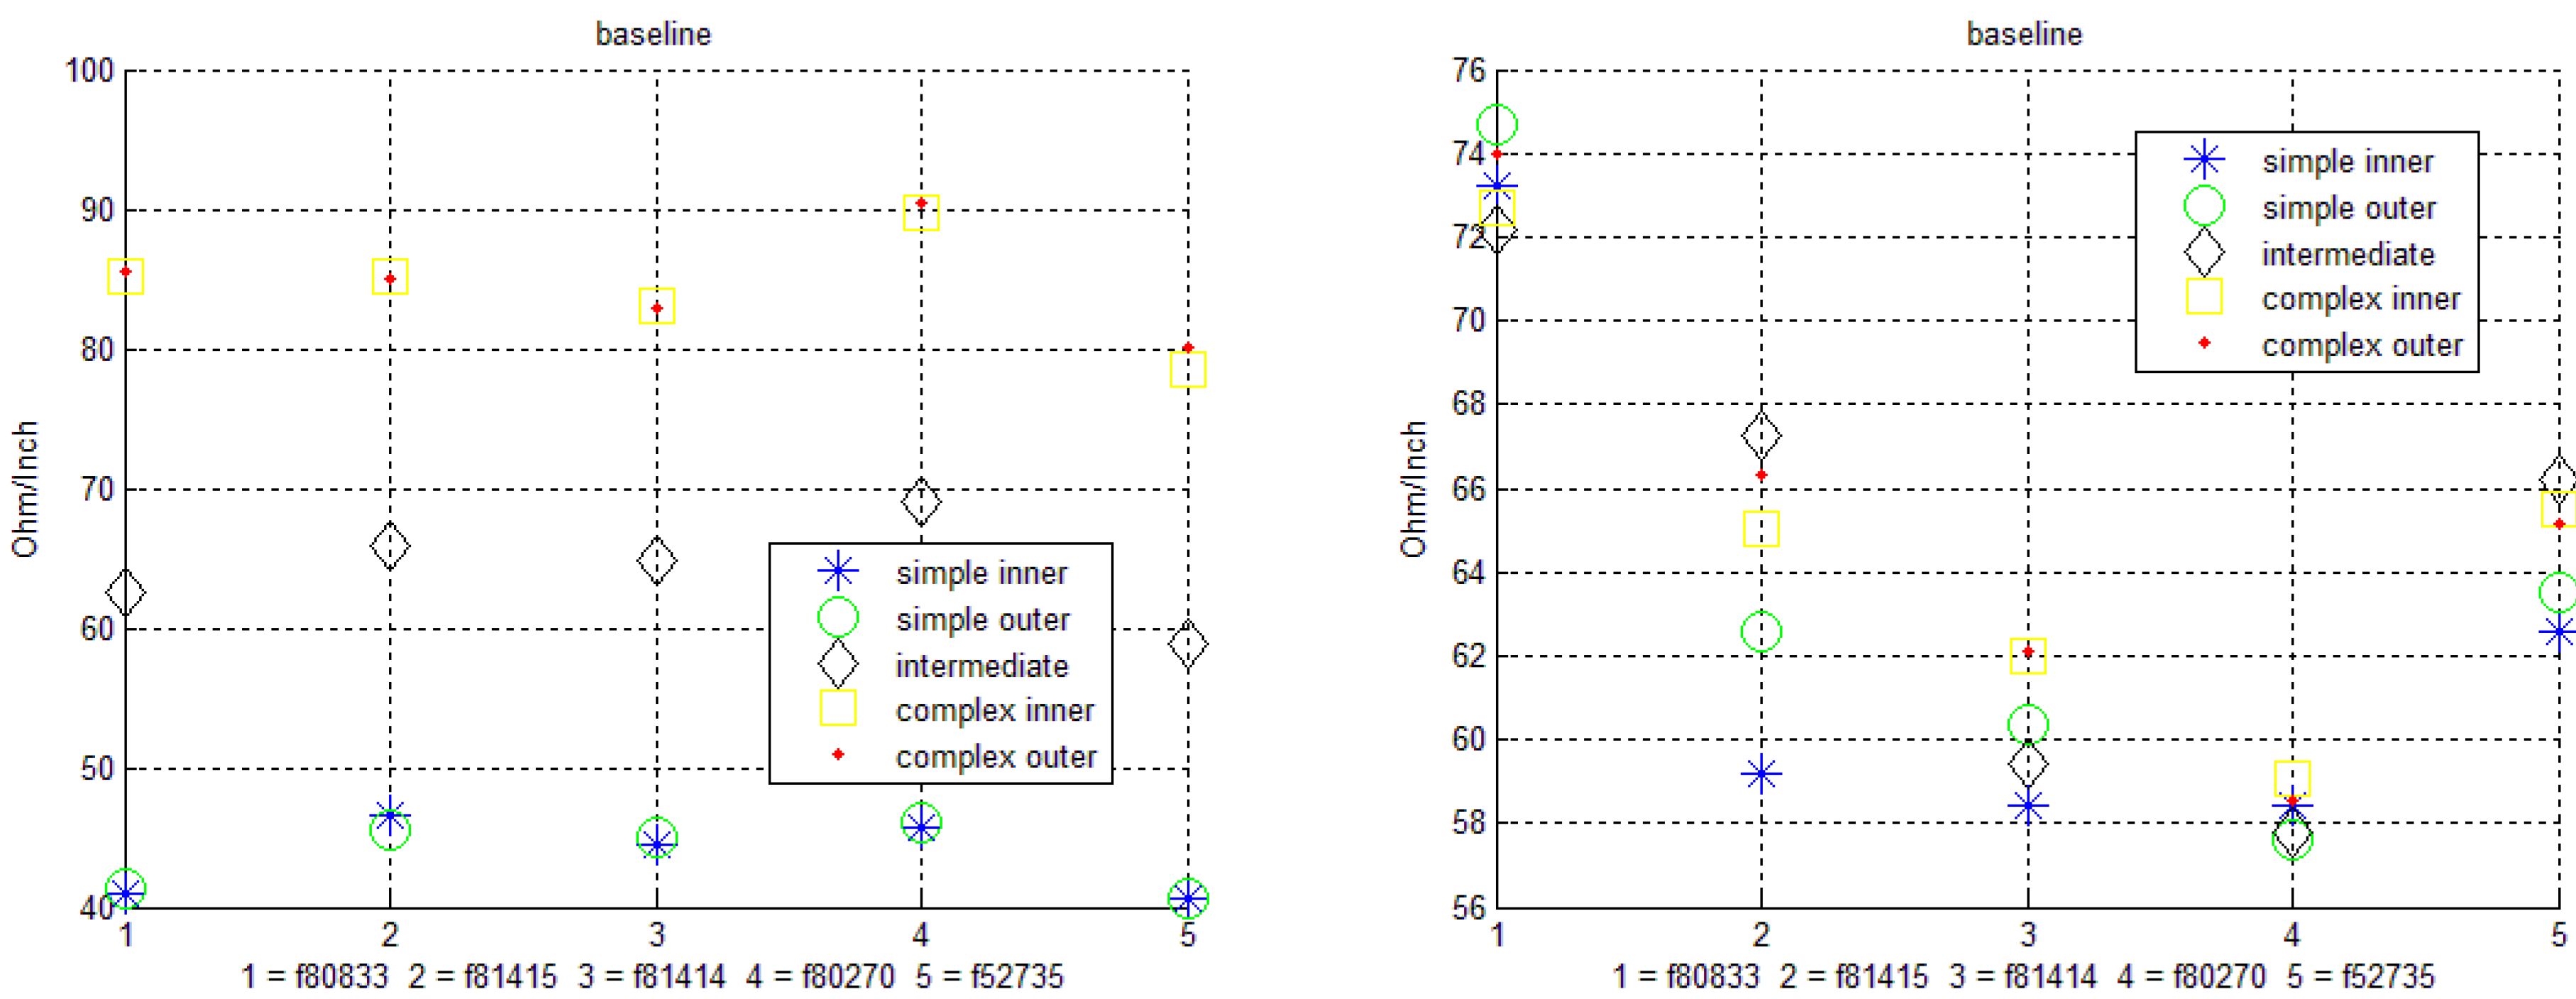
Figure 12.
Sensitivity: (left) un-insulated case; (right) insulated case.

Figure 13.
Base drift: (left) un-insulated case; (right) insulated case.
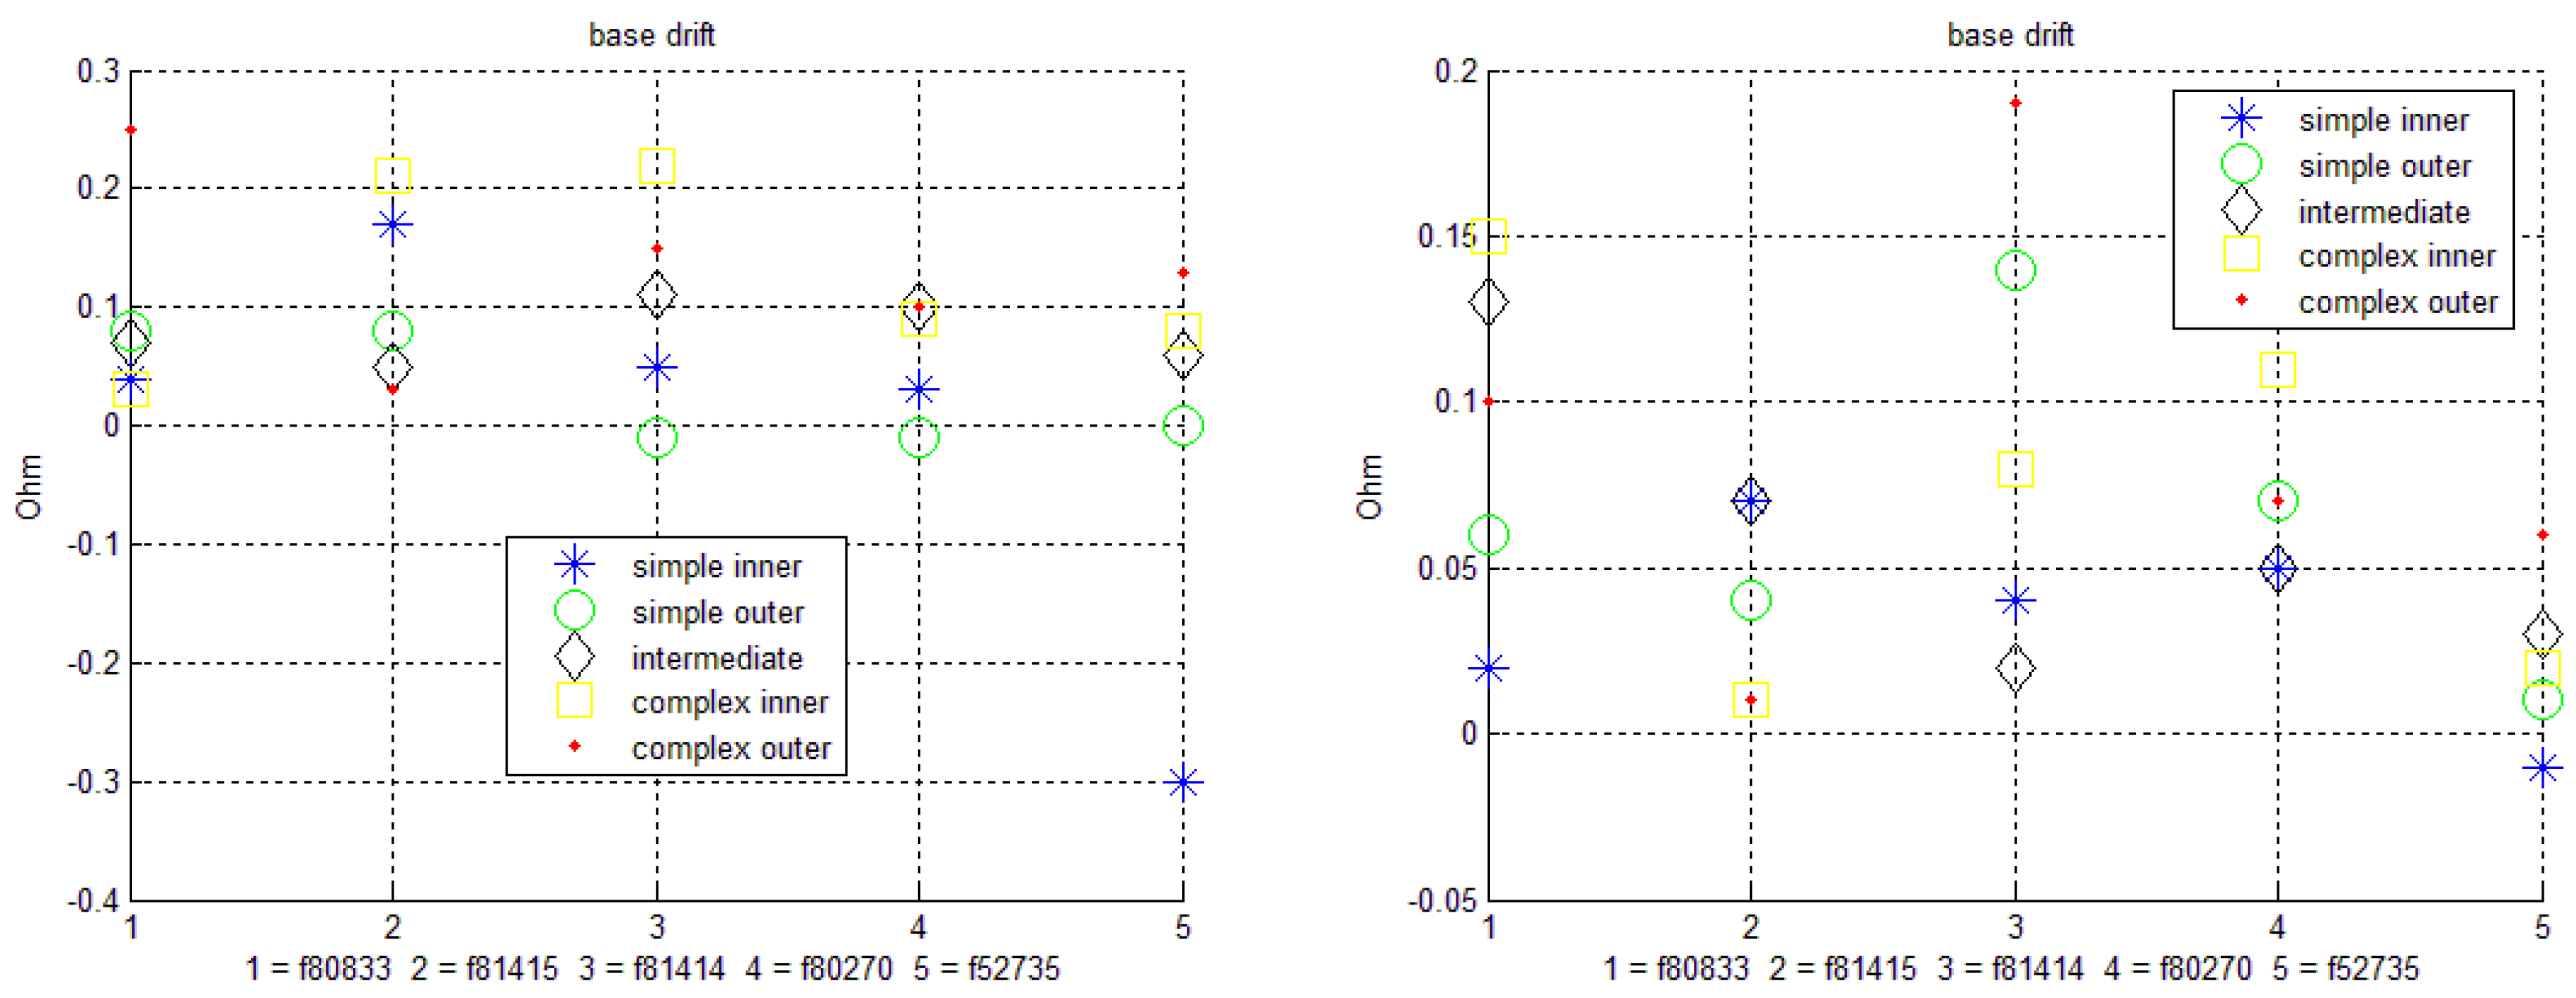
Figure 14.
Peak drift: (left) un-insulated case; (right) insulated case.

Figure 15.
Peak-to-peak mean: (left) un-insulated case; (right) insulated case.
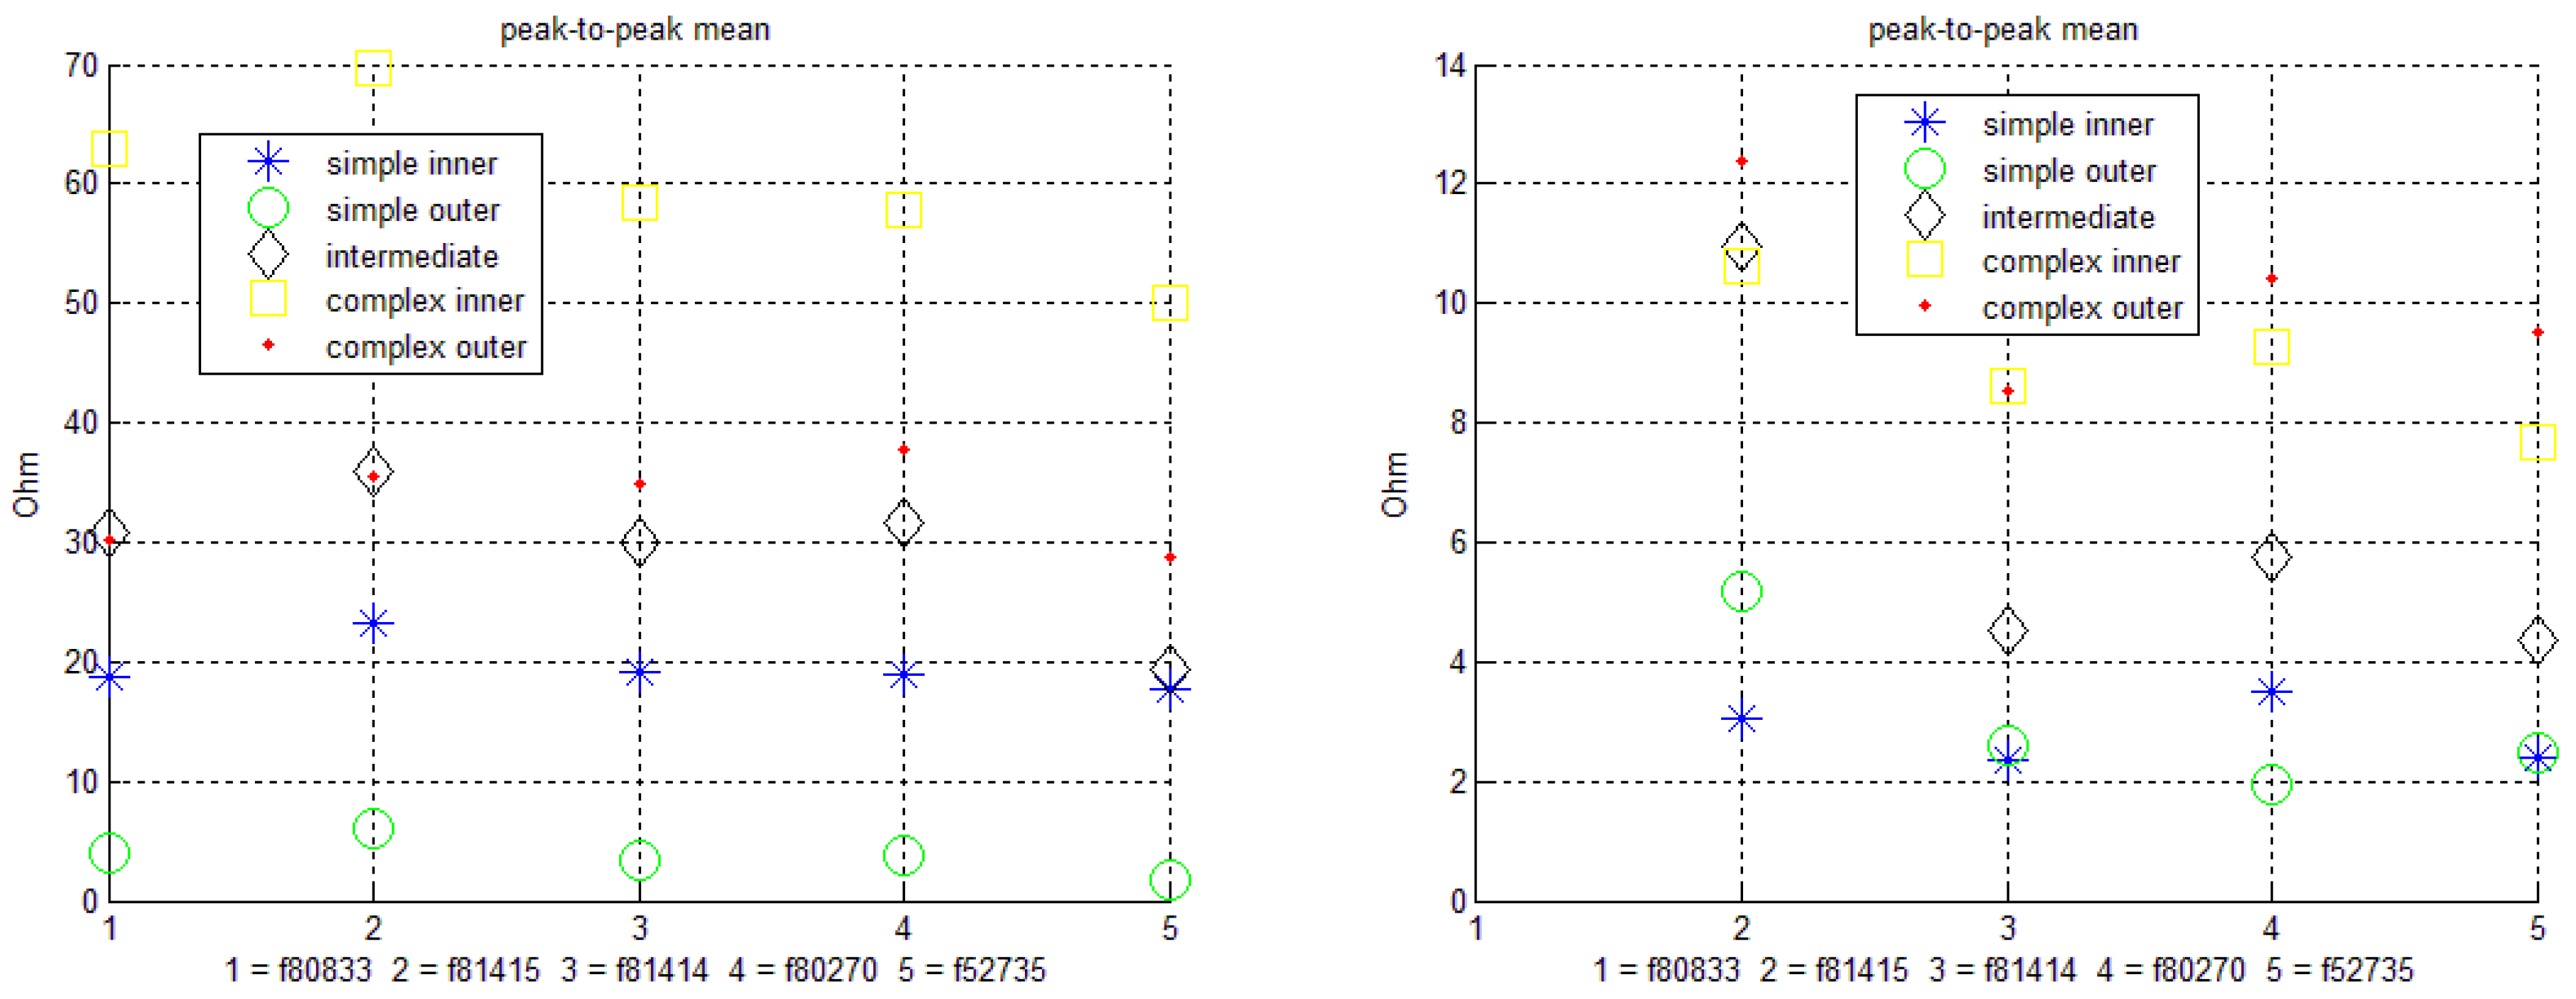
Figure 16.
Peak-to-peak variance: (left) un-insulated case; (right) insulated case.

Figure 17.
Hysteresis area: (left) un-insulated case; (right) insulated case.

Figure 18.
Linearity, bending phase: (left) un-insulated case; (right) insulated case.
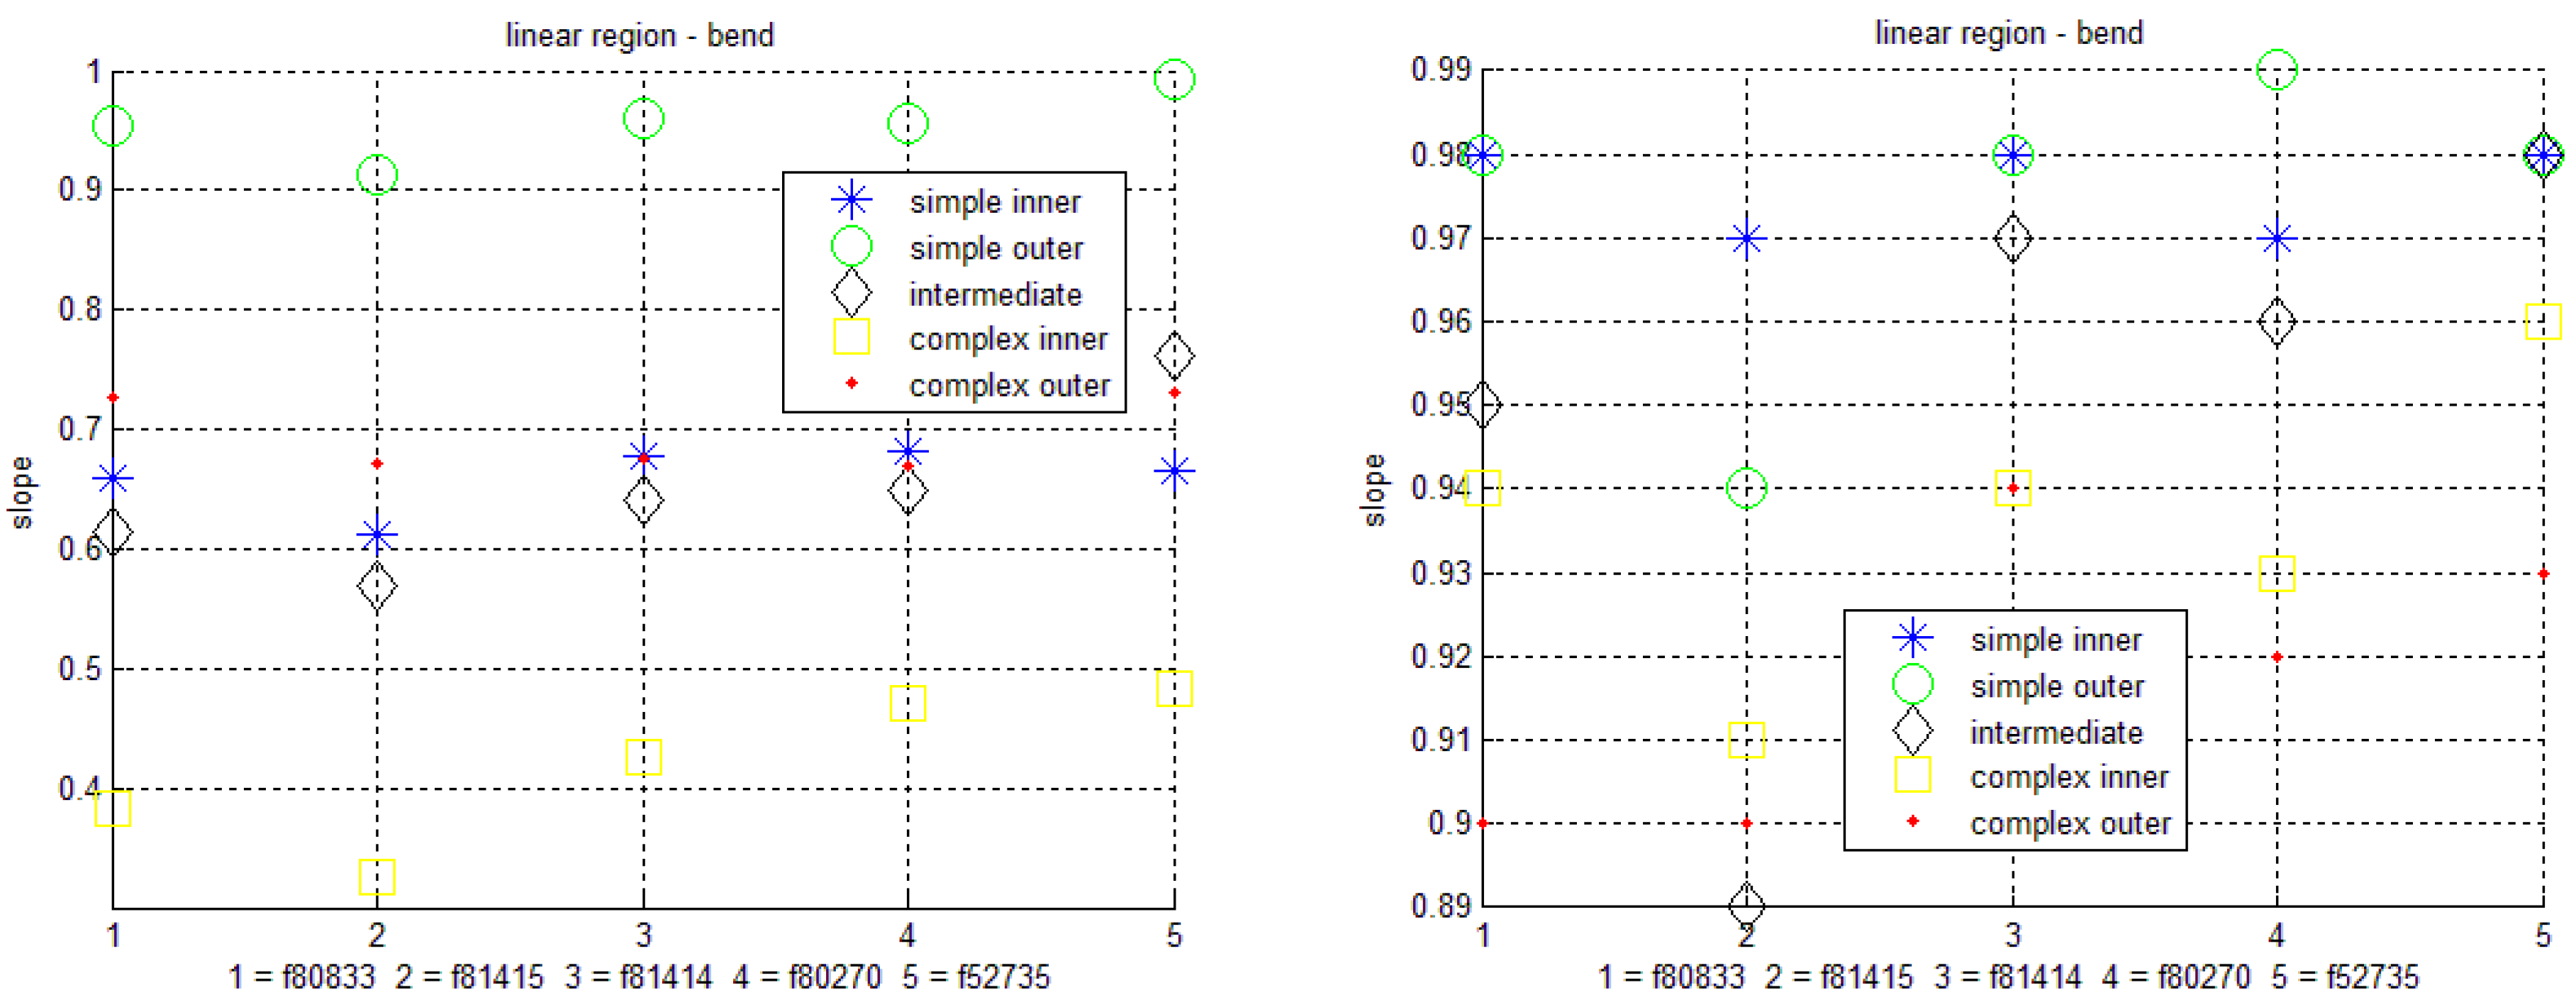
Figure 19.
Linearity, recovery phase: (left) un-insulated case; (right) insulated case.

The following Table 2 and Table 3 tabulate the numerical data values of Figure 11, Figure 12, Figure 13, Figure 14, Figure 15, Figure 16, Figure 17, Figure 18 and Figure 19 for the cases of the stiffest (80833) and the least stiff (52735) fabric, with and without sensor insulation.
Table 2.
Simple inner bend parameters for stiffest (80833) and least stiff (52735) fabric, both in the insulated and un-insulated sensor cases.
| Simple Inner | Baseline (Ω/in) | Sensitivity (Ω/in) | Base Drift (Ω) | Peak Drift (Ω) | P2P Mean (Ω) | P2P Var (Ω2) | Hysteresis (Ω * in) | Linear Bend; Recovery | |
|---|---|---|---|---|---|---|---|---|---|
| 80833 | Insulated | 73.24 | 2.19 | 0.02 | 0.11 | 3.14 | 0.22 | 15.97 | 0.98; 0.98 |
| Un-Insul | 40.96 | 12.11 | 0.04 | 0.04 | 18.71 | 0.17 | 36.84 | 0.66; 0.66 | |
| 52735 | Insulated | 62.57 | 1.55 | −0.01 | 0.02 | 2.39 | 0.02 | 8.76 | 0.98; 0.99 |
| Un-Insul | 40.53 | 11.78 | −0.3 | 0.06 | 17.79 | 0.43 | 32.58 | 0.67; 0.67 | |
Table 3.
Complex inner bend parameters for stiffest (80833) and least stiff (52735) fabric, both in the insulated and un-insulated sensor cases.
| Complex Inner | Baseline (Ω/in) | Sensitivity (Ω/in) | Base Drift (Ω) | Peak Drift (Ω) | P2P Mean (Ω) | P2P Var (Ω2) | Hysteresis (Ω * in) | Linear Bend; Recovery | |
|---|---|---|---|---|---|---|---|---|---|
| 80833 | Insulated | 72.67 | 2.05 | 0.15 | 0.11 | 9.48 | 0.04 | 102.18 | 0.94; 0.91 |
| Un-Insul | 85.24 | 14.13 | 0.03 | 0.17 | 63.03 | 0.05 | 626.34 | 0.38; 0.37 | |
| 52735 | Insulated | 65.48 | 1.72 | 0.02 | 0.01 | 7.67 | 0.02 | 113.43 | 0.96; 0.96 |
| Un-Insul | 78.50 | 10.74 | 0.08 | 0.22 | 50.07 | 0.88 | 676.17 | 0.48; 0.48 | |
5. Discussion
From Figure 7, Figure 8, Figure 9 and Figure 10, it appears clear how linearity benefits from insulation, for both bending and recovery phases. The transition 0–1 of the normalized alignment plots in Figure 7 and Figure 9 corresponds to the bending region, while the transition 1–0 corresponds to the recovery region. As the folds bend, the self-intersecting yarns of the stitch come closer together, creating more shorts between fibers of the yarn and within parts of the stitch, which results in a decrease in the resistance of the sensor [12]. The un-insulated simple inner bend of Figure 7 on the left shows how the short of the stitch with itself at the maximum bend results in a drop in resistance that does not happen for the insulated case, where the more linear response of the stitch to bending becomes more visible. This also applies for the hysteresis plots of Figure 8, where the resistance decreases with bending for eight consecutive cycles (the first cycle was used to get the right alignment between DMM and Instron data: since there is incomplete data for the cycle, it was discarded from the analysis). In the same way, Figure 9 and Figure 10 show alignment and hysteresis plots for simple outer folds, where now, we do not have the shorting of the stitch at the maximum bend, since the stitch faces the concave surface of the fold. It can be seen from the hysteresis plots that the resistance values of the insulated case are shifted upward. This is because the resistance of the insulated sensor can only be measured from the two extremes of the sensor, since the remaining sensor is completely insulated. The additional sensor length connected between the DMM probes added a constant bias to the simple bend tested between Instron clamps.
Over all fold types and fabric types, the stitched bend sensors showed more predictability for the insulated case, as shown by the smaller range and variability of the parameters computed. The repeatability and reliability of the sensor appeared to be more strongly related to the type of fold rather than the fabric properties.
Overall, as seen in Figure 11, insulated sensors showed variability in baseline resistance for the same fabric (same sensor) over all bend types between 2 Ohm and 10 Ohm; such variability becomes 4, 10 or more times bigger in the un-insulated case. Baseline resistance is a raw measure of the resistance of the individual sensor. Because the different bend types measure a different length of a single sensor, it is expected that the baseline resistance reflects considerable variability. The un-insulated sensor showed a more consistent baseline over the different fabrics for the same type of bend, in cases in which the same length is measured for all sensors. However, when the baseline resistance is divided by the length of the sensor tested (i.e., 5" for complex folds; 3.5" for intermediate folds; 2" for simple folds), we observed a consistent pattern between the type of folds, where more complex folds show lower Ohm/inch values, a maximum difference for the same fabric (same sensor) of about 20 Ohm/inch for the insulated case and about 6 Ohm/inch for the un-insulated case, as shown in Figure 20 below. This is likely due to the slight bend introduced into the insulated sensor by the guide rods, even in the straight position. The higher the number of bends, the more total bend is present in the straight position.
Figure 20.
Baseline resistance normalized by fold length: (left) un-insulated case; (right) insulated case.
Figure 20.
Baseline resistance normalized by fold length: (left) un-insulated case; (right) insulated case.

From Figure 12, a sensitivity variability for the same fabric (same sensor) over all bend types of 2 Ohm/in or less is observed for the insulated case, but became about six-times bigger for the un-insulated case (where self-intersecting folds produce dramatic changes in resistance due to the shorting of the sensor). Base drift even in the worst case (Figure 13) is less than 0.3 Ohm and does not show evident differences between the insulated and un-insulated scenarios, indicating a stable sensor with little base drift. The largest peak drift (Figure 14) was in the order of 0.1 Ohm for the insulated case and increased by about a factor 10 in the un-insulated case. For both drift cases, the drift values appear to be of the same order, both reflecting a very small amount of drift that is not consistently related to fold type or fabric type. In Figure 15, peak-to-peak sensor responses of 2–12 Ohms were observed for the insulated case, but increased in magnitude and variability to 2–70 Ohm in the un-insulated case. However, it is important to note that the un-insulated sensor experiences shorting across the sensor during inner-direction self-intersecting folds, which explains the extreme difference in peak-to-peak response. The largest peak-to-peak variance within a trial (Figure 16) was 0.63 Ohm for the insulated sensor, increasing to 4.4 Ohm in the un-insulated case. Normalizing both the base and peak drift of each fabric by the corresponding peak-to-peak mean value, for both un-insulated and insulated scenarios, we found the base drift to be a small fraction of the peak-to-peak, between 0.1% and 5.5% for the various bends tested. In Figure 17, the maximum hysteresis variability for the same fabric (same sensor) over all bend types was 180 Ohm per inch for the insulated case and almost a factor 10 larger for the un-insulated case. However, it is interesting to point out how hysteresis values among all fabrics for the simplest bends and, particularly, for the simple outer fold are close for both insulated and un-insulated sensors. The linearity variability for the same fabric (same sensor) over all bend types for both the bending (Figure 18) and recovery (Figure 19) phases was within 0.01 for the insulated case and within 0.6 for the un-insulated case, indicating a strongly repeatable response.
The direction of bend did change the response of the sensor. On average, an outer bend showed slightly higher sensitivity for the insulated case and smaller sensitivity for the un-insulated case; smaller peak drift in the un-insulated case (while in the insulated case the relation was almost inverted, particularly for complex folds); smaller peak-to-peak mean and variance (particularly for the un-insulated case); smaller hysteresis; and a larger slope for both phases (particularly for the un-insulated case). Baseline resistance and base drift did not show consistent changes in the response between outer and inner folds.
Insulation had a larger impact on the inner type of folds, as expected, since it is an effective solution to prevent shorts. Table 2 and Table 3 report the effect in amplitude due to insulation by reporting the numerical values for the inner folds in the case of the stiffest and least stiff fabric, and in particular, these show that insulation decreases sensitivity, peak-to-peak mean value and hysteresis, but increases linearity. Further, with insulation, the sensitivity of both the simple and complex inner folds becomes very close to the sensitivity of the corresponding outer folds (as would be expected). The same applies to the relative baseline values of Figure 11, for peak-to-peak mean and variance (particularly for the complex inner fold), peak drift, hysteresis and linearity regions. Base drift was not affected by the direction of the fold. In general, for all other types of bends and fabrics, insulation improves the linearity of the sensor response, acting like a sort of guideline or shell that limits the movement of the stitch. Such a limitation decreases peak drift, hysteresis, baseline resistance values and peak-to-peak mean and variance. Although a larger response may be useful in some scenarios, (where, for instance, the self-intersecting short may be used to detect, in a binary way, that a fold has occurred, rather than measuring the degree of bend), a cleaner, less noisy response may be more important in others. Peak drift also in the insulated case is no longer influenced by stitch shorting. Sensor response to complex bending, on average, changes the most after insulation, since it is the type of bend where the yarn in the sensor experiences the most folds. In this case, the “guiding” effect of the insulation patch is magnified by the multiple folds. In general, the insulated case shows much closer values for almost all parameters calculated.
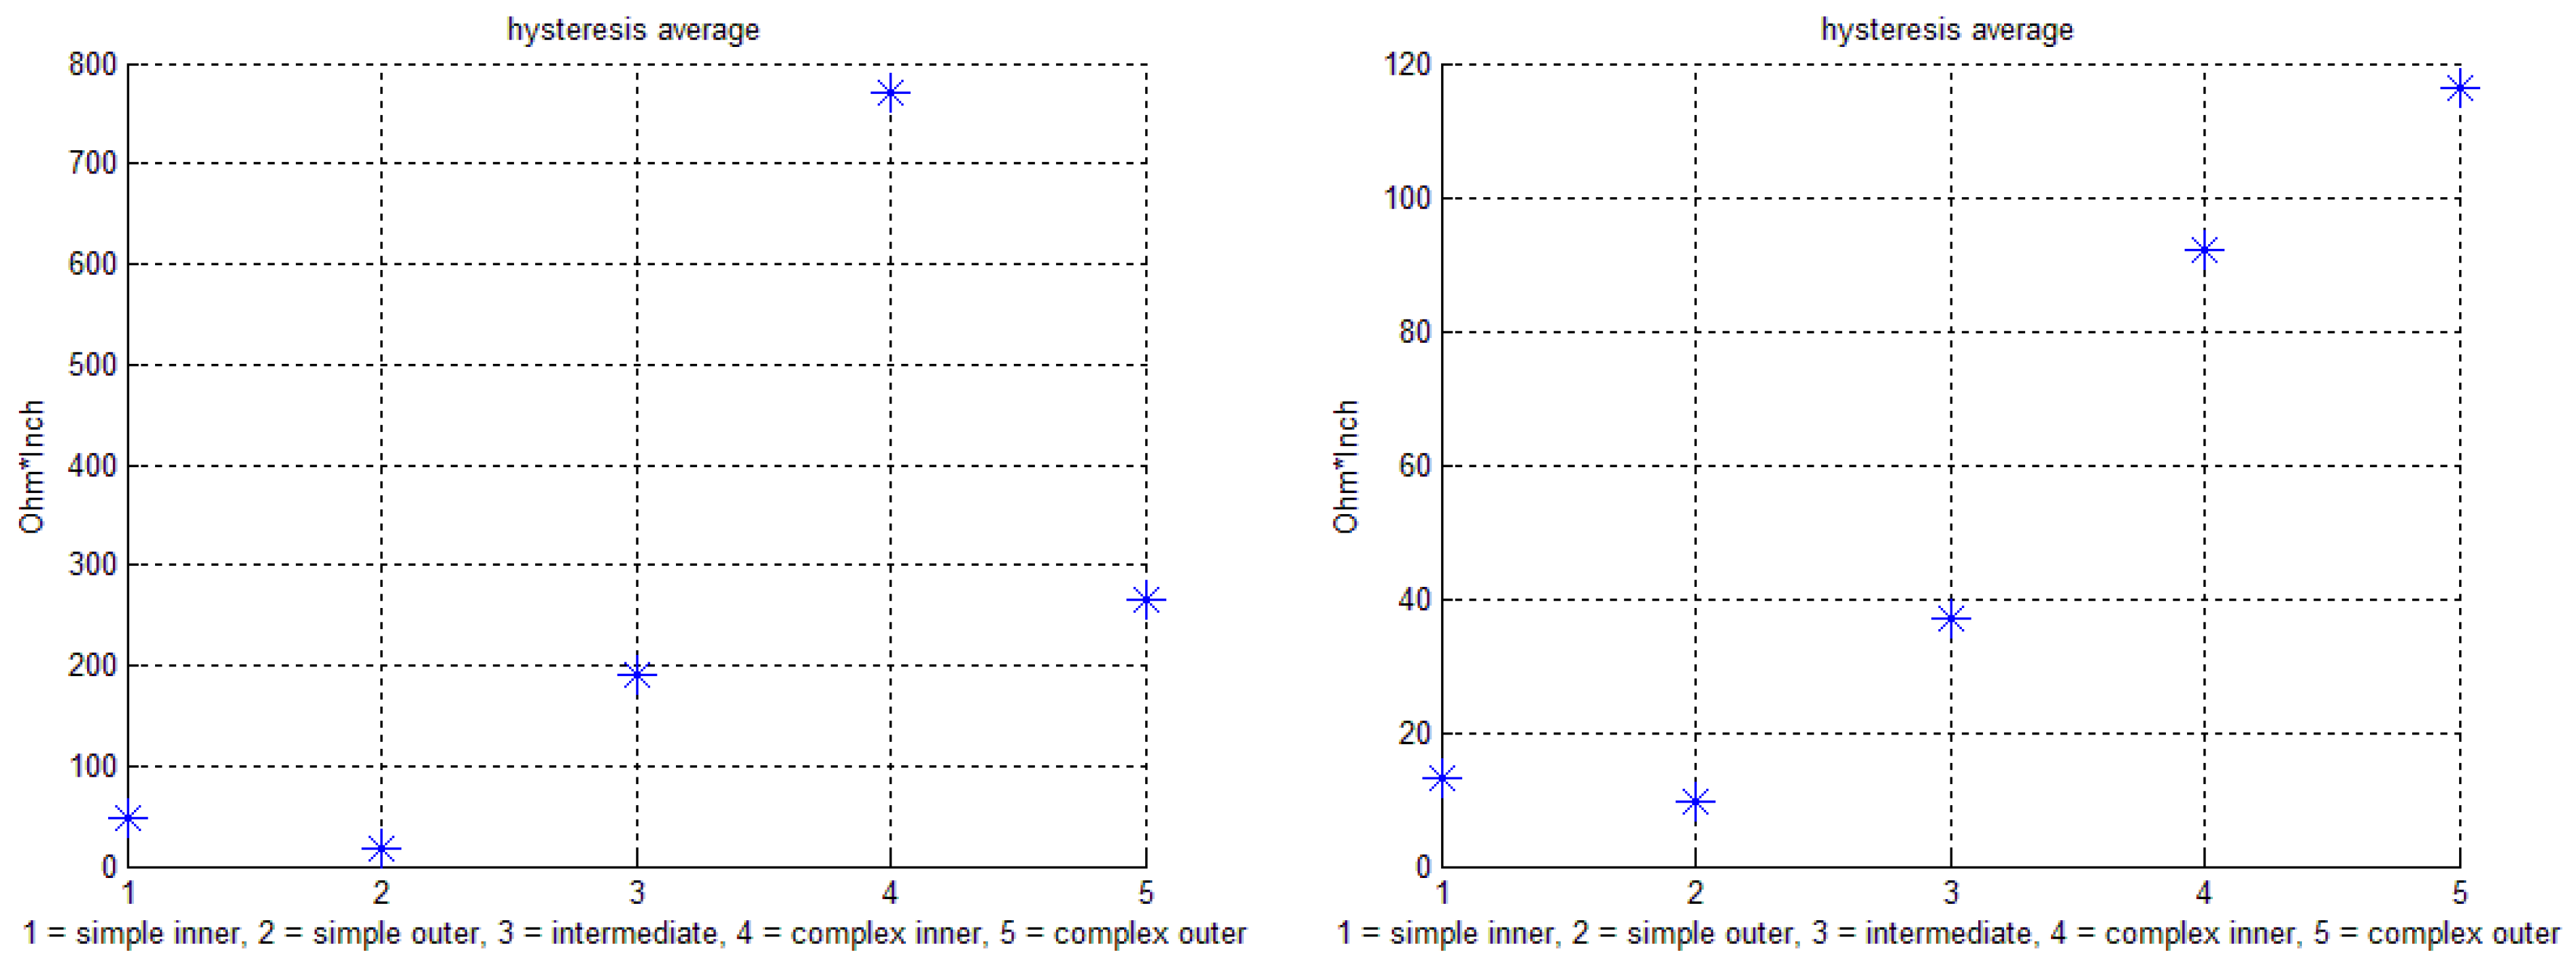
Hysteresis values are strongly correlated with the type of fold, (complex, intermediate or simple). More complex bends show the largest hysteresis, due to a larger length of fabric being folded by more folds. Figure 21 shows that such a relation is almost linear for the insulated case by averaging the results of Figure 17 over the fabrics, for each fold type.
For the same reason, more complex bends have, on average, more base and peak drift, smaller baseline per unit length (Figure 20), higher sensitivity (particularly for the un-insulated case), larger peak-to-peak (more in terms of mean than variance) and worse linearity (particularly for the un-insulated case).
Figure 21.
Hysteresis averaged over fabrics: (left) un-insulated case; (right) insulated case.
It is also observed that in the insulated case, the stiffest fabric No. 80833 is the most responsive with the largest average baseline in the insulated scenario for all fold types. It seems that the insulation patch added proportionally less stiffness to the stiffest fabrics, making its output resistance closer to the un-insulated case. Stiffer fabrics have also, on average, the largest sensitivity, the largest peak-to-peak (in terms of the mean in the un-insulated scenario) and the smallest linearity for both bending and recovery phases. The heaviest fabric No. 80270 showed the largest peak drift and peak-to-peak variance for the complex intermediate and inner complex folds of the un-insulated case, while in the insulated case, all fabrics values come closer together with the magnitude, related to the complexity of the bend.
6. Conclusions
Fabric folds in the clothes we are wear occur every time we bend a knee or an elbow, or any joint. The ability to sense fabric bending facilitates garment-integrated wearable applications that depend on sensing body movements, relevant for health and rehabilitation, but not limited to these areas. The stitched approach is particularly effective at preserving clothing comfort and aesthetics, which are essential for long-term monitoring and ubiquitous applications. We plan to use the bend sensing ability of the sensor discussed in this paper coupled with other existing garment-integrated stretch and/or bend sensing techniques for activity-recognition and body-monitoring purposes. More accurate joint movement measurements contribute to more reliable activity recognition and make possible a wider range of monitoring applications.
Acknowledgments
This work was sponsored by the National Science Foundation under Grant No. IIS 1116719.
Author Contributions
Guido Gioberto contributed to the study design and manuscript preparation and performed the data collection and analysis. Lucy E. Dunne contributed to the study design and manuscript preparation.
Conflicts of Interest
The authors declare no conflict of interest.
References
- Edminson, J.; Lehn, D.; Jones, M.; Martin, T. Textile based automatic activity diary for medical annotation and analysis. In Proceedings of the International Workshop on Wearable and Implantable Body Sensor Networks, Cambridge, MA, USA, 3–5 April 2006.
- Gioberto, G.; Dunne, L.E. Theory and characterization of a top-thread coverstitched stretch sensor. In Proceedings of the IEEE International Conference on Systems, Man, and Cybernetics, Seoul, Korea, 14 October 2012.
- Kern, K.; Schiele, B.; Junker, H.; Lukowicz, P.; Troster, G. Wearable sensing to annotate meeting recordings. In Personal and Ubiquitous Computing; Springer-Verlag: London, UK, 2003. [Google Scholar]
- Costa, M.; Cropley, M.; Griffith, J.; Steptoe, A. Ambulatory blood pressure monitoring is associated with reduced physical activity during everyday life. Psychosom. Med. 1999, 61, 806–811. [Google Scholar]
- Dunne, L.E.; Smyth, B. Psychophysical elements of wearability. In Proceedings of the ACM CHI Conference on Human Factors in Computing Systems, San Jose, CA, USA, 28 April–3 May 2007.
- Dunne, L.E.; Walsh, P.; Smyth, B.; Caufield, B. Design and evaluation of a wearable optical sensor for monitoring seated spinal posture. In Proceedings of the 10th IEEE International Symposium on Wearable Computers, Montreux, Switzerland, 11–14 October 2006.
- Amft, O.; Junker, H.; Lukowicz, P.; Troster, G.; Schuster, C. Sensing muscle activities with body-worn sensors. In Proceedings of the International Workshop on Wearable and Implantable Body Sensor Networks, Cambridge, MA, USA, 3–5 April 2006.
- Paradiso, R.; Loriga, G.; Taccini, N. A wearable health care system based on knitted integrated sensors. In Proceedings of the IEEE Transactions on Information Technology in Biomedicine, Milior S.p.A., Italy, 6 September 2005.
- Brady, S.; Dunne, L.E.; Tynan, R.; Diamond, D.; Smyth, B.; O’Hare, G.M.P. Garment-based monitoring of respiration rate using a foam pressure sensor. In Proceedings of the 9th IEEE International Symposium on Wearable Computers, Osaka, Japan, 18–21 October 2005.
- Coyle, S.; Morris, D.; Lau, K.-T.; Diamond, D.; Moyna, N. Textile-based wearable sensors for assisting sports perfomance. In Proceedings of the 6th International Workshop on Wearable and Implantable Body Sensor Networks, Berkeley, CA, USA, 3–5 June 2009.
- Gioberto, G. Measuring joint movement through garment-integrated wearable sensing. In Proceedings of the 17th IEEE International Conference on Wearable Computers, Zurich, Switzerland, 8–12 September 2013.
- Gioberto, G.; Coughlin, J.; Bibeau, K.; Dunne, L.E. Detecting bends and fabric folds using stitched sensors. In Proceedings of the 17th IEEE International Symposium on Wearable Computers, Zurich, Switzerland, 9–12 September 2013.
© 2014 by the authors; licensee MDPI, Basel, Switzerland. This article is an open access article distributed under the terms and conditions of the Creative Commons Attribution license (http://creativecommons.org/licenses/by/4.0/).
Share and Cite
MDPI and ACS Style
Gioberto, G.; Dunne, L.E. Garment-Integrated Bend Sensor. Electronics 2014, 3, 564-581. https://doi.org/10.3390/electronics3040564
AMA Style
Gioberto G, Dunne LE. Garment-Integrated Bend Sensor. Electronics. 2014; 3(4):564-581. https://doi.org/10.3390/electronics3040564
Chicago/Turabian StyleGioberto, Guido, and Lucy E. Dunne. 2014. "Garment-Integrated Bend Sensor" Electronics 3, no. 4: 564-581. https://doi.org/10.3390/electronics3040564