


Feature Transformation Method for Wheel Hub Shape Based on Target Detection and Geometric Analysis

1
School of Mechanical Engineering, Jiangsu University, Zhenjiang 212013, China
2
Lib, Jiangsu University, Zhenjiang 212013, China
*
Author to whom correspondence should be addressed.
Electronics 2023, 12(8), 1946; https://doi.org/10.3390/electronics12081946
Submission received: 10 March 2023
/
Revised: 13 April 2023
/
Accepted: 18 April 2023
/
Published: 21 April 2023
(This article belongs to the Section Artificial Intelligence)
Abstract
:Extracting and transforming shape features has been an important research domain in wheel hub design. The study of wheel hub design based on shape semantics, brand planning, and structural optimization requires regression analysis by using shape features and the corresponding variables to guide wheel hub design through the correlation model. The practical role of feature transformation in design is determined by its effectiveness, accuracy, and convenience. This process, however, has generally been handled manually in previous studies, limiting the universality and comprehensiveness of research outcomes. With the development of artificial intelligence, the automation of this process has become possible, ushering in the era of big data research for feature extraction and transformation. Hence, this study proposes a wheel hub feature transformation method based on target detection and geometric analysis. This method implements feature transformation in the following automation steps: (1) wheel hub feature point detection based on the YOLO model; (2) wheel hub feature grouping based on morphological parameters and position parameters; (3) feature point grooming based on geometric relations; and (4) parameter construction and transformation based on morphological features. Thus, an automatic, bidirectional, and morphological mechanism for transforming the parameters of a wheel hub shape can be developed. With the proposed transformation model, parameters related to the wheel hub shape and features can be transformed quickly, and the generative design of the wheel hub can be conducted based on big data.
1. Introduction
Consumers are increasingly demanding personalized and diversified car appearances, driving development trends. In a perfect scenario, the wheel hub is easily replaceable and has obvious features that enhance the overall appearance of a vehicle. However, conventional wheel hub design is being greatly challenged by development cycle compression [1], shape differentiation, performance optimization, and consumer preference transformation. The core issue lies in the effective application of abstract wheel hub shapes. Hub design is a transformation process from an abstract concept to a final shape. The efficiency, degree of freedom, and accuracy of the process determine the length of the product’s development cycle, the degree of product differentiation, and the level of satisfaction of consumer preferences. The application of an efficient method of abstracting features of wheel hub shape to the design process of the wheel hub can help designers design better wheel hubs at a faster rate, offering more options for consumers.
Based on the above observations, this paper proposes an automatic method for the transformation of wheel hub shape features. Usually, this process is manually completed, resulting in the inability to generate a large number of research samples for correlational analysis, which reduces the universality of the research. With the development of artificial intelligence and big data research, the correlational research process can be optimized by automating the extraction process, making the output more applicable to guide the wheel hub design process. As a result of feature transformation, a huge amount of feature information can be acquired quickly for associated research, providing a reliable data foundation for intelligent wheel hub design and optimization research. On the other hand, this method allows for the restoration of specific shapes based on adjusted feature values, enabling the intelligent generation of new wheel hub designs.
1.1. Shape–Feature Association
In a study on various aspects of shape–feature association, many researchers agreed that the shape of a product is composed of several basic geometric shapes [2,3], and a shape grammar can be constructed based on the relationships between these basic shapes [4,5]. Several researchers have proposed applying shape grammars in the design process, to use semantic features for shape optimization, generation, and expert system construction [6,7,8]. Shi et al. (2020) [9] studied shape aesthetics and plane composition theory to extract the structural lines of the wheel hub form by analyzing the front forms and outlining the basic forms of the wheel hub shape using geometric shapes. Li and Zheng (2019) [10] proposed the concept of a design prototype in the product design process, the selection of a method for the expression of the design prototype, and the methods of prototype modeling, evolution, and combination in design. Some studies have proposed a stylized product design method based on parametric modelling using the feature point of products and developed a product design scheme oriented toward user preferences by utilizing a generative design based on the combination of style and contour features [11,12]. Gunpinar et al. (2018) [13] proposed a shape-sampling technology based on particle tracking to find the shapes in space that met geometric constraints by combining product shapes and constraints using an iterative particle-tracking algorithm. Studies on shape–feature association have shown that shape extraction is the premise of feature association, and feature abstraction and expression ability are optimized during the extraction process. Using a simplified and combined approach, the wheel hub shape is extracted primarily from the shape of the front spokes. Depending on the feature construction mode, some feature models can be used to reconstruct the form and some are conducive to feature correlation analysis. However, most of these features must be manually extracted and they cannot be repurposed.
1.2. Shape Optimization
To optimize the shape, the most common method is the use of finite element analysis (FEA) [14,15,16]. Dynamic impact performance and aerodynamic optimization have been the main directions of the relevant research [17,18,19]. Luo et al. (2012) [20] proposed a methodology for evaluating the perceptual matching quality between the car body and wheel hub through a participatory experiment and obtained a correlation between the car and wheel hub shape. Kang et al. (2019) [21,22,23] proposed several deep generative design frameworks integrating topology optimization, which can generate numerous design options optimized for engineering performance. Wang et al. (2019) [24] established a parametric model of computational fluid dynamics by introducing the concept of hydrodynamics into the wheel hub design and implemented a multi-objective optimization design for the wheel hub through a genetic algorithm. Xu et al. (2020) [25] proposed a method of combining reverse modeling with topological optimization and formed a lightweight wheel hub by integrating mechanical principles with the wheel hub shape. Kim et al. (2022) [26] integrated topology and shape optimization to determine an optimal steel wheel with an enhanced natural frequency. The above literature demonstrates that the combination of different fields and hub shapes can produce various optimal wheel hub designs, while shape optimization depends on the abstraction of wheel hub features. The effective extraction of wheel hub feature parameters enables us to integrate wheel hub shape design with diversified influencing factors, producing a more optimized wheel hub design.
2. Materials and Methods
In this research, a feature transformation model was developed to optimize the transformation of wheel hub shape features. Combining target detection with geometric analysis made it possible to achieve this goal. The former principle is primarily concerned with the extraction of feature points, while the latter focuses on the consolidation of those points and transformation of them into shape features. This research work primarily consists of the following steps: (1) analyze target shape features and train a target detection model through wheel hub samples; (2) build the wheel hub feature grouping method to extract the spoke grouping information from the wheel hub shape image; (3) utilize the geometric characteristics of the wheel hub shape and sort the extracted feature points based on feature grouping; and (4) convert the sorted feature points into efficient shape feature values for further research and shape generation based on the target shape features. Figure 1 illustrates the process flow, methodology, and output of the present research work.
2.1. Research Sample
This study used 682 samples of different front shapes of wheel hubs procured from the Chinese market. All samples were standardized by taking a unified resolution of 512 px × 512 px desaturated images with transparent backgrounds. Figure 2 presents a partially processed wheel hub sample. The samples were primarily used for the following two processes in the research: (1) Analysis of target shape features: Acquiring representative wheel hub features through expert interviews, ensuring the extraction results satisfy the association research in terms of abstraction and expression ability, and (2) Training of feature point extraction model: The labeled research samples were used as training datasets to complete the construction and evaluation of the extraction model.
2.1.1. Feature Analysis
The primary output of this transformation method is the parameters pertaining to shape features taking part in the correlation analysis. The analysis of wheel hub shape features ensures the effectiveness and comprehensiveness of parameters [27]. The post-transformation target features were obtained through interviews with three experts on wheel hub design and two specialists in wheel hub engineering. In order to facilitate feature description and simplicity based on the general condition of the wheel hub shape samples, this research work defines that: (1) overall, there are wheel hub spokes T, a wheel hub window W, and each wheel hub has groups of the same features, with spokes in the same feature group; (2) each spoke has two edge lines, and , each having only two or three feature points, that is, start points and , endpoints and , and optional middle points and . All features hold the relationship between these feature points, the center , and radius of the wheel hub, including:
- (a)
- Feature group representing the number of repeated groups of the same spoke on the wheel hub shape, which is defined as according to the general rules;
- (b)
- Number of spokes in the group representing the number of spokes with different shapes in each group, which is defined as according to the general features of the wheel hub shape;
- (c)
- Spoke position representing the starting position of the spokes on the rim, which is expressed as the radian between two vectors, one comprising the center point of start points on both sides of the spoke and the center of wheel , and the other comprising the start point of all spokes and the center of wheel ;
- (d)
- Spoke width representing the spoke width on the rim, which is expressed as the radian between the vectors formed by the start points on both sides and the center of the circle;
- (e)
- Spoke angle representing the overall deflection trend of the spoke, which is expressed as the radian between the vectors formed by the center point of the start point on both sides of the spoke and the center point of the endpoint on both sides of the spoke and ;
- (f)
- Included angle on both sides representing the opening and closing of sidelines on both sides of the spoke, which is expressed as the radian between the vectors formed by the start point and center point on both sides of the spoke;
- (g)
- Position of the middle point representing the position of a middle point on the spoke, which is expressed as the ratio of the length of the segment formed by the start point and the middle point , and the radius ;
- (h)
- Angle of the middle point , representing the degree of deviation of the middle point from the main direction of the spoke, which is expressed as the radian between the vector formed by the start point at the edge line of the spoke and the middle point , and the vector formed by the start point of the spoke and the center of the wheel ;
- (i)
- Closing position , which is located on the wheel hub where the window is close to the center and is expressed as the ratio of the length of the line segment formed by the center point at the endpoint of the spokes on both sides of the window and the center of wheel , to the radius ;
- (j)
- Window position , representing the position of the window between spokes, which is expressed as the closest distance between the closest point of the window contour on the corresponding spoke edge and the spoke edge;
- (k)
- Symmetry and , indicating whether the spokes in the same group are symmetrical along the centerline. In each feature group, there may be several groups of spokes and corresponding edge lines . The feature difference within the group less than a certain threshold indicates the existence of a symmetrical relationship between the corresponding spokes. The judgment for symmetry is based on the range and morphological characteristics of different features as shown in Table 1.
2.1.2. Feature Point Labeling
Feature points can be labeled according to the definition of spoke feature points in feature analysis, as shown in Figure 3. Since detection targets cover the feature points on the entire wheel hub, there are at least 4 spokes per wheel hub and 4 feature points per spoke, which means that at least 10,912 feature points can be used as a dataset, meeting the training requirements of the deep learning model. After labeling, wheel hub samples were divided into a training set and a verification set according to the requirements of model training.
2.2. Research Method
Spokes are an integral part of a wheel hub and it is therefore difficult to define the boundary of the spoke region if directly extracting spoke features from the image. In order to resolve this issue, this study proposes a method of extracting feature points before transformation to abstract spoke shapes and establishing the transformation relationship between the wheel hub shape and wheel hub feature data. The method includes four steps: feature point detection, feature grouping, Feature point grooming and Parameter construction and transformation.
2.2.1. Feature Point Detection
This step is mainly to train the feature point extraction model to extract the feature points on the wheel hub shape. In this study, YOLOv5m [28] was selected for feature point extraction based on a comparative analysis. Since YOLO is a target detection model, its target region must therefore be identified first for the detection of feature points. Based on the distribution of feature points, a 20 px × 20 px square area around the feature points was located as the target area, as shown in Figure 4. The feature point extraction model was acquired by training the model at 300 epochs for a batch size of 32 by running a machine equipped with two GeForce GTX TITAN for 3 h. However, further processing was required to construct the wheel hub feature parameters to develop a correlation between the feature points extracted in this process.
2.2.2. Feature Grouping
This step divides wheel hub shapes into groups based on window detection. Wheel hub shapes are grouped based on the window area using the two features: (1) the region is closed and easy to extract and (2) the shape and distribution of the area are consistent with the distribution of spokes. In this research work, Python and OpenCV were used to detect the contour of the window area. A small hole with a length and width of less than 5 px was removed before the windows were sorted according to their geometric center of the extracted windows on the circumference. To determine the number of wheel hub feature groups, two groups of parameters (Groups A and B) were used to analyze the windows for their shape and arrangement rules.
- (1)
- Parameter A
Parameter A, a morphological parameter, is mainly used to judge the difference in geometric form between windows and is composed of window compactness and similarity . The compactness of a polygon is the ratio of its circumference to its area and is given as . The shape similarity is described by Hu’s moment. By assuming the window area function to be , the central moment of the order p + q is given as
The normalized center moment is
Seven invariant moments can be determined through the normalized central moments of the second and third order, and thus, the shape-matching function can be established to obtain the similarity :
The shape parameter is available after the changes in the trends and dimensions of and are unified. The morphological parameter of the whole wheel hub is .
- (2)
- Parameter B
Parameter B, a position parameter, is mainly used to judge the difference in the spatial layout between various windows, comprising the distance between the geometric center of the window and the center of the circle, and the standard arc length between the geometric centers of different windows. Since the standard arc length is the product of the angle, which is formed by the geometric center of the window, the center of the circle, and its radius, is given as the following:
The shape parameter is available after the changes in the trends and dimensions of and are unified. The morphological parameter of the whole wheel hub is .
Windows can be grouped based on the number of windows , parameters and , as shown in Figure 5. This process adopts the estimation method prior to matching. As , the possible group set can be obtained after estimating the number of spokes in a group. For each possible value of in the set, the mean value of the product of two parameters at the same location in each group can be calculated and then used to calculate the combined standard deviation . The group represented by having the maximum value of is considered the best group as the largest shape difference falls within this group.
2.2.3. Feature Point Grooming
The feature points on both sides of each spoke in the group were analyzed for their positional relationship based on the wheel hub feature points and wheel hub grouping in order to sort them. This involved a three-step process, including feature point separation, radial position analysis, and sideline analysis.
- (1)
- Feature point separation
To effectively distinguish the shape points of different spokes, it is necessary to construct a corresponding detection area for each shape group. In this study, the window area was divided radially into three distinct subareas by using the nearest and farthest points of the window contour and the center of the circle based on the actual condition of the wheel hub shape. Further, a detection area was constructed using the geometric centers of multiple subareas. The feature points corresponding to the edge line on both sides of the spokes, represented by points in this area, are illustrated in Figure 6. Once the feature points on both sides of each spoke are separated, each group of feature points is collectively rotated to the y-axis for position analysis based on the geometric center of the detection area.
- (2)
- Radial position analysis
The spatial order must be determined for the feature points on both sides of the spoke before the estimation of the feature parameters. After rotation, the feature points are located on both sides of the y-axis. The start and endpoints are determined based on the shape characteristics of the wheel hub, specifically by identifying the two y-coordinates—the largest and smallest points. The start and endpoints are recorded as and , respectively. Using the two recorded points as base points, unit vectors and are formed in the direction of the x-axis. Additionally, vectors and are formed by the nearest and farthest points and , respectively, from the center of the wheel and the window outline. The included angles formed by these two sets of vectors, denoted as and , serve as a detection basis for the other start and endpoints, as illustrated in Figure 7. In the case of the remaining point in excluding and , then and . If or , the corresponding point is another start point and endpoint which, together with the base point, form the start point set and endpoint set , while the possible middle point set is .
- (3)
- Sideline analysis
If the start point set and endpoint set contain 2 points, the x value of each point can be sorted to distinguish the spoke edge line where the point is located. When only one point is detected, it indicates that the point may be missing. In this case, two related points, namely and , are constructed around the point as optimized key points.
The middle point set , shows that the middle points are absent on both sides of the spoke, while represents at least one middle point on both sides of the spoke. The selection and arrangement of middle points depends on the relationship between edge lines on both sides and the window, and the distance between the middle point and the judgment target. The basic edge lines on both sides of the spoke are constructed using and to form and using and to form , while the windows on both sides are denoted as and , respectively. If the window intersects the basic edge line on the same side, a point is selected on the window edge line between the intersection points to represent the point that is farthest away from the corresponding edge line. On this basis, for any point within , there may be the following four linear parameters: , are the distances of a point from the basic edge line on both sides, while and are the projection lengths of the x-axis to the nearest point of the windows on both sides. To establish the relationship between different basic edge lines and windows, different length parameters have to be used to detect the nearest point, as shown in Table 2. The comparison of the length parameters on both sides indicates that the edge with the minimum length parameter corresponds to the edge where the point is located.
2.2.4. Parameter Construction and Transformation
In this step, the groomed feature points are calculated according to the target shape features (according to step 1) and converted into eleven groups of feature parameters. Based on the geometric characteristics of the wheel hub shape, the shape of the wheel hub can be restored using the converted parameters. Table 3 presents the wheel hub feature parameters derived from the sorted feature point.
The wheel hub shape transformation is implemented by the grasshopper in Rhinoceros in the following five steps, as shown in Figure 8:
- (1)
- Calculating the coordinates of feature points using feature parameters. All feature parameters can be reconstructed as corresponding point sets according to their construction process. For example, based on the size of the wheel hub and the position of the spokes , the coordinates of the starting points of the spokes can be obtained. Based on these coordinates and the spoke width , can be calculated, and the starting points on both sides , of the spokes can be obtained.
- (2)
- Using the feature points in the group to construct edge lines on both sides of the spoke. By connecting the feature points on both sides of each spoke, the basic outline of the spoke can be constructed, which is used to describe the basic shape of the spoke.
- (3)
- Combining the rim boundary with an array, and then connecting the spoke edge lines to form the spoke contour. The upper part of the spoke can be constructed by intersecting the outer edge of the hub with the basic outline of the spokes. Combining the endpoints of the spoke sides and the closing position , a transition curve can be constructed to form the lower part of the spoke. Connecting the two parts of the spoke outlines gives the complete spoke outline of the wheel hub.
- (4)
- Constructing the window shape according to the position of the window. The connected spoke outline is a closed curve. Combined with the window position parameters, it can be converted into an offset distance and a movement distance , which can be used to construct the window area outline of the wheel hub.
- (5)
- Building a plane shape and 3D model according to the contour. By filling the spoke area and the window area with different colors, a 2D model of the reconstructed hub can be obtained. Based on the spatial base surface of the wheel hub, the constructed edge curves can be projected onto the upper base surface and the bottom base surface. The side of the spoke can be composed by lofting. Combined with the top, bottom, side surfaces, and rim surface, the complete 3D model of the wheel hub can be created, as shown in Figure 9.
3. Results
In this study, a two-way automatic conversion process between wheel hub shape and feature data was constructed based on sample training, shape calculation, and shape reconstruction. The effectiveness and convenience of this process are the primary indicators for assessing whether it meets the research requirements. These indicators can be evaluated based on the following four aspects: (1) the accuracy of the feature point extraction model; (2) the accuracy of the shape feature transformation; (3) the similarity between the reconstructed shape and the original shape; and (4) the time consumed by the conversion process.
3.1. Accuracy of Feature Point Extraction
The precision of the feature point extraction model depends on its construction process. The accuracy of feature point detection was verified by the output results of the YOLO model. Figure 10 depicts the location loss, box_loss, which represents the discrepancy between the predicted and calibrated frames. The location loss was measured on the training and validation sets after 300 epochs, and the error was found to be 0.036 and 0.022, respectively. The obj_loss measures the confidence of the computation network, and it was evaluated on the training and validation sets after 300 epochs. The obj_loss was found to be 0.128 and 0.088 on the training and validation sets, respectively. In addition, the precision and recall rates were 0.994 and 0.983, respectively. These results indicate that this high-precision model can be effectively used for the detection of shape feature points of the wheel hub. Figure 11 shows the extraction results of some wheel hubs, indicating that the feature point detection satisfied the research expectation. Any missing detections can be addressed in the subsequent feature point sorting process.
3.2. Accuracy of Feature Transformation
The accuracy of the extracted wheel hub features is influenced not only by the precision of the detected feature points but also by the transformational accuracy of the features. The transformational accuracy of the features is affected by two important factors: (1) the accuracy of grouping the wheel hub shapes and (2) the similarity between the converted edge lines of the spokes and the actual edge lines. Grouping accuracy refers to the ratio of the number of correctly grouped samples to the total number of samples. The comparison between the automatic and manual grouping results of 682 wheel hub samples tested in this research work showed a grouping accuracy of 97.65%, which was satisfactory. Although the method used demonstrated a relatively high sensitivity to changes in shape and position, incorrectly grouping the 16-wheel hubs did not significantly affect the overall shape transformation. However, this misgrouping could potentially have had a subtle impact on the accuracy of the shape association research.
The similarity of the spokes after transformation is composed of the distance between feature points at the corresponding position on both sides of the spoke and the actual feature points. As the distance decreases, the spoke edge lines become nearly similar, leading to more precise converted parameters that describe the shape of the original wheel hub. The edge lines of the converted spoke are shown in Figure 12. To obtain the mean similarity of each wheel hub, the spoke edge lines of the remaining 650 wheel hub shapes were analyzed for similarity after the incorrect grouping and removal of identical shapes, as illustrated in Figure 13. Feature point extraction involves defining identical points as those within a distance of 20 pixels in the sample, which introduces minimal error and has only a slight impact on the overall shape. With 20 px as the threshold (similarity > 0.05), 96.2% of samples showed similarity within the threshold, indicating that the process could accurately transform feature points into edge lines of the corresponding spoke.
3.3. Reconstruction Similarity
Reconstruction similarity reflects the information loss of the shape during abstraction and restoration, which is primarily used to verify the use of extracted shape features of the wheel hub to guide the generation of the wheel hub shape. The reconstructed wheel hub shape is shown in Figure 14. As some details may be lost during the shape abstraction process, similarity judgment is mainly based on a consistent overall shape. In this study, a questionnaire survey was conducted with a 10-level scale to evaluate the similarity of 40 random wheel hub shapes before and after reconstruction. A total of 157 out of 160 questionnaires was recovered, with an effective rate of 98.1%. The confidence of 40 options in the survey results was 0.934, demonstrating the credibility of the survey results. The distribution shown in Figure 15 indicates that 97.5% of samples received a similarity rating of six to eight points, which falls within the range of “relatively similar” to “very similar”, aligning with the research expectation of a high degree of similarity between the reconstructed shape and the original one.
3.4. Time Consumed by the Conversion Process
The time consumed in the shape transformation process is the key indicator for assessing the efficiency of the transformation method. The process of shape transformation can be divided into several steps, and among them, three steps are particularly time-consuming. These three steps include feature point detection and sorting, shape grouping, and shape reconstruction, which require a significant amount of time to complete. The overall efficiency of this method can be obtained from the mean time for each step, as shown in Figure 16.
The time consumed in the feature extraction process was estimated for 650 wheel hub samples. The mean time consumed in feature point detection and sorting was found to be 0.174 ± 0.044 s. Furthermore, for 96.5% of the samples, the time taken for this step fell between 0.1 s and 0.3 s, which was notably faster than manual sorting. This indicates that the automated method of feature point detection and sorting is highly efficient. The process of shape grouping was found to take an average time of 0.027 ± 0.003 s, with the majority of samples (99.6%) completing the step in less than 0.04 s. This level of consistency indicates that the automated shape grouping method is highly reliable and outperforms manual grouping. The mean time consumed by the generation process was estimated to be 12.1 ± 0.7 s for 50 wheel hub shapes generated randomly. It failed to meet the requirements of real-time generation due to increased computational efforts and poor software performance. However, this method significantly improved efficiency compared with the manual design. In general, the extraction process took about 0.2 ± 0.05 s, while the generation process took approximately 12.1 ± 0.7 s. As a result of the significant reduction in the time required for both feature extraction and shape generation, researchers were now able to conduct research on the relationship between wheel hub features and big data through fast shape generation.
4. Discussion
This study effectively created a bidirectional transformation system for wheel hub shape and parameters through the combination of target detection and geometric analysis. Compared to previous methods, the proposed approach is primarily distinguished by its automation and universality. The proposed feature transformation method provides an automated process of program analysis. Once the transformational model is constructed, there is no need for manual intervention in the feature extraction process, resulting in significantly improved efficiency. According to the results of the above research, this method greatly reduces the time for shape conversion and generation while maintaining a high accuracy. The proposed method is universal because it enables the convenient association of the extracted parameters, which consist of semantic structural features, with different factors that influence shape [29]. This allows for the creation of conversion relationships between the parameters and factors, which in turn enables the generation of shapes by modifying the corresponding wheel hub parameters.
The proposed method has potential applications in various research fields related to wheel hub shape, and the utilization of a big data approach in the feature association process can further enhance the comprehensiveness and effectiveness of research. In terms of design guidance, this method provides a generative model for shape modification after feature correlation. Through semantic inputs, suitable shape prototypes can be quickly generated for reference by wheel hub designers to conduct an in-depth design. In actual project processes, this method accelerates the proposal and confirmation stages of the design scheme and provides a reliable design reference space for wheel hub design through accurate semantic and feature translation, as well as efficient prototype generation. The conventional wheel hub development cycle, which previously consisted of three rounds of two weeks each, was shortened to one round per week, optimizing development efficiency.
As an illustration of this method of extracting and analyzing shape features of different brands of wheel hubs for correlation analysis, the wheel hub shape and brand relevance were taken as an example. Developing and maintaining a consistent brand statement is an important aspect of developing a successful product [30]. This method allows for the quick and efficient extraction of shape feature information for each collected wheel hub, providing the corresponding shape features under each brand for correlation analysis. In this research work, 650 wheel hub shapes were extracted, representing 15 brands from five countries. By establishing a distribution relationship between brands and features, we could identify feature parameters that exhibited significant brand differences:
- (1)
- Spoke width. Figure 17 shows the range of the mean spoke width on each wheel hub of different brands. A wide range of spoke widths offered by each brand indicates their comprehensive coverage of spoke widths. Upon aggregating the data, it became evident that various brands display unique preferences for spoke width. Certain brands such as Audi, Volkswagen, BMW, Mercedes-Benz, Citroen, Peugeot, and Ford tend to have narrower spoke widths, whereas Honda and Chevrolet tend to have wider spoke widths, aligning with consumer perceptions of these brands.
- (2)
- Spoke angle. Figure 18 presents the mean spoke angles on each wheel hub for each brand. A significant difference can be observed in the angle coverage and mean angle for different brands. Honda has a relatively high coverage range and mean value of the spoke angle, indicating a preference for spokes with rotation angles. Conversely, Mercedes-Benz and Mazda have relatively low coverage ranges and mean values of the spoke angle, suggesting a preference for non-rotating spokes.
- (3)
- Position of the window. Figure 19 presents the mean distance between the window on each wheel hub and the spoke of each brand. It reflects the distance between the window area and the spokes. A larger value indicates that the window is further away from the spokes, resulting in a wider slope on both sides of the spokes. Overall, there is a significant variation in this value among different brands. Citroen has a significantly higher range and mean value compared to other brands, indicating quite a large distance between the window on its wheel hub and the spokes, and a wider side of the spokes as well. Buick and Toyota, which have smaller values, exhibit a window edge that is closer to the spokes and a narrower slope on both sides of the spokes.
5. Conclusions
The present study optimized the extraction and transformation of features from automobile wheel hub shapes. To achieve this, the study employed target detection technology and geometric shape analysis to overcome the issues of inconsistent and non-interpretable feature extraction from wheel hub shapes. By doing so, the study enhanced the efficiency of the feature extraction process and the conversion of features into shapes and vice versa. The analysis revealed that the conversion method has good precision and conversion efficiency and can effectively optimize the research and generation process of wheel hub shapes. This study highlights the vital role of the feature transformation method in conducting correlation research on wheel hub shapes and brands, as well as in wheel hub shape research based on big data. By integrating the feature transformation method into the research process, this study showed how to facilitate wheel hub design and modeling association research. Additionally, the integration of wheel hub shape generation into the design process was made more accessible, which further enhanced the efficiency of the design process.
Author Contributions
Conceptualization, W.L.; methodology, W.L.; software, W.L.; validation, W.L.; formal analysis, W.L.; investigation, W.L.; resources, W.L.; data curation, W.L.; writing—original draft preparation, W.L.; writing—review and editing, Z.L.; visualization, W.L.; supervision, Z.L.; project administration, W.L.; funding acquisition, W.L. All authors have read and agreed to the published version of the manuscript.
Funding
This research received no external funding.
Data Availability Statement
The labeled dataset used to support the findings of this study is available from the corresponding author upon request.
Conflicts of Interest
The authors declare no conflict of interest.
References
- Liu, J.; Zhi, Q.; Ji, H.; Li, B.; Lei, S. Wheel hub customization with an interactive artificial immune algorithm. J. Intell. Manuf. 2021, 32, 1305–1322. [Google Scholar] [CrossRef]
- Yamamoto, S.; Morita, R.; Oike, M. Transmission-equipped Wheel Hub Motor for Passenger Cars. MTZ Worldw. 2018, 79, 54–58. [Google Scholar] [CrossRef]
- Jowers, I.; Earl, C.F.; Stiny, G. Shapes, structures and shape grammar implementation. Comput. Aided Des. 2019, 111, 80–92. [Google Scholar] [CrossRef]
- Oster, A.; McCormack, J. A Methodology for Creating Shape Rules During Product Design. J. Mech. Des. 2011, 133, 061007. [Google Scholar] [CrossRef]
- Wu, Y. Representing the Reasoning Process of Shape Transformations in Sketches by Combination of Ontology and Shape Grammar. Adv. Eng. Des. Optim. 2012, 201–202, 47–50. [Google Scholar] [CrossRef]
- Nasuf, A.; Bhaskar, A.; Keane, A.J. Grammatical evolution of shape and its application to structural shape optimisation. Struct. Multidiscip. Optim. 2013, 48, 187–199. [Google Scholar] [CrossRef]
- Orsborn, S.; Cagan, J. Multiagent Shape Grammar Implementation: Automatically Generating Form Concepts According to a Preference Function. J. Mech. Des. 2009, 131, 121007. [Google Scholar] [CrossRef]
- Agarwal, M.; Cagan, J. On the use of shape grammars as expert systems for geometry-based engineering design. Artif. Intell. Eng. Des. Anal. Manuf. 2000, 14, 431–439. [Google Scholar] [CrossRef]
- Shi, Z.; Sun, X.; Cai, Y.; Tian, X.; Chen, L. Design optimization of an outer-rotor permanent magnet synchronous hub motor for a low-speed campus patrol EV. IET Electr. Power Appl. 2020, 14, 2111–2118. [Google Scholar] [CrossRef]
- Li, Z.; Zheng, L. Integrated design of active suspension parameters for solving negative vibration effects of switched reluctance-in-wheel motor electrical vehicles based on multi-objective particle swarm optimization. J. Vib. Control 2019, 25, 639–654. [Google Scholar] [CrossRef]
- Zhang, C.; Zhang, R.; Wang, R.; Chang, B.; Ma, J. Design of Torque Distribution Strategy for Four-Wheel-Independent-Drive Electric Vehicle. Autom. Control. Comput. Sci. 2020, 54, 501–512. [Google Scholar] [CrossRef]
- Wu, F.; Yu, C. Parametric Design and Kansei Engineering in Goblet Styling Design. Math. Probl. Eng. 2020, 2020, 8259698. [Google Scholar] [CrossRef]
- Gunpinar, E.; Gunpinar, S. A shape sampling technique via particle tracing for CAD models. Graph. Model. 2018, 96, 11–29. [Google Scholar] [CrossRef]
- Li, Y.D. Application of Parametric Modeling in Optimization Design on Aluminum Alloy Wheels. Appl. Mech. Mater. 2012, 178–181, 2834–2836. [Google Scholar] [CrossRef]
- Liu, J.P.; Ye, B.Y.; Li, G. Application of Finite Element Analysis in Automotive Wheel Design. Key Eng. Mater. 2010, 455, 350–354. [Google Scholar] [CrossRef]
- Jiang, X.; Liu, H.; Lyu, R.; Fukushima, Y.; Kawada, N.; Zhang, Z.; Ju, D.Y. Optimization of Magnesium Alloy Wheel Dynamic Impact Performance. Adv. Mater. Sci. Eng. 2019, 2019, 2632031. [Google Scholar] [CrossRef]
- Dang, T.P.; Gu, Z.; Chen, Z. Numerical simulation of flow field around the race car in case. Int. J. Numer. Methods Heat. Fluid. Flow 2015, 25, 1896–1911. [Google Scholar] [CrossRef]
- Huňady, R.; Fabian, M.; Lengvarský, P.; Mareš, A.; Kupec, F. Design and fatigue analysis of an aluminium alloy aerodynamic wheel. Int. J. Veh. Des. 2021, 85, 97–113. [Google Scholar] [CrossRef]
- Huang, T.; Yuan, Y.; Pan, H.; Wang, W.; Meng, Y.; Guan, C. Research on the effect of car’s roll motion on the aerodynamic characteristics of high-speed car. Proc. Inst. Mech. Eng. Part D J. Automob. Eng. 2021, 236, 1700–1715. [Google Scholar] [CrossRef]
- Luo, S.J.; Fu, Y.T.; Zhou, Y.X. Perceptual matching of shape design style between wheel hub and car type. Int. J. Ind. Ergon. 2012, 42, 90–102. [Google Scholar] [CrossRef]
- Oh, S.; Jung, Y.; Kim, S.; Lee, I.; Kang, N. Deep Generative Design: Integration of Topology Optimization and Generative Models. J. Mech. Des. 2019, 141, 111405. [Google Scholar] [CrossRef]
- Yoo, S.; Lee, S.; Kim, S.; Hwang, K.H.; Park, J.H.; Kang, N. Integrating deep learning into CAD/CAE system: Generative design and evaluation of 3D conceptual wheel. Struct. Multidiscip. Optim. 2021, 64, 2725–2747. [Google Scholar] [CrossRef]
- Jang, S.; Yoo, S.; Kang, N. Generative Design by Reinforcement Learning: Enhancing the Diversity of Topology Optimization Designs. Comput.-Aided Des. 2020, 146, 103225. [Google Scholar] [CrossRef]
- Wang, D.; Zhang, S.; Zhang, S.; Wang, Y. Analysis and multi-objective optimization design of wheel based on aerodynamic performance. Adv. Mech. Eng. 2019, 11. [Google Scholar] [CrossRef]
- Xu, P.F.; Duan, S.Y.; Wang, F. Reverse Modeling and Topological Optimization for Lightweight Design of Automobile Wheel Hubs with Hollow Ribs. Int. J. Comput. Methods 2020, 17, 1950064. [Google Scholar] [CrossRef]
- Kim, J.; Kim, J.J.; Jang, I.G. Integrated topology and shape optimization of the five-spoke steel wheel to improve the natural frequency. Struct. Multidiscip. Optim. 2022, 65, 78. [Google Scholar] [CrossRef]
- Ruiz-Montiel, M.; Belmonte, M.-V.; Boned, J.; Mandow, L.; Millán, E.; Badillo, A.R.; Pérez-De-La-Cruz, J.-L. Layered shape grammars. Comput. Aided Des. 2014, 56, 104–119. [Google Scholar] [CrossRef]
- Jocher, G.; Chaurasia, A.; Stoken, A.; Borovec, J.; NanoCode012; Kwon, Y.; Michael, K.; TaoXie; Fang, J.; imyhxy; et al. Ultralytics/Yolov5: V7.0—YOLOv5 SOTA Realtime Instance Segmentation. 2022. Available online: https://zenodo.org/record/7347926#.ZED1SnZByUk (accessed on 17 April 2023).
- Hsu, S.H.; Chuang, M.; Chang, C. A semantic differential study of designers’ and users’ product form perception. Int. J. Ind. Ergon. 2000, 25, 375–391. [Google Scholar] [CrossRef]
- McCormack, J.; Cagan, J.; Vogel, C. Speaking the Buick Language: Capturing, Understanding, and Exploring Brand Identity with Shape Grammars. Des. Stud. 2004, 25, 1–29. [Google Scholar] [CrossRef]
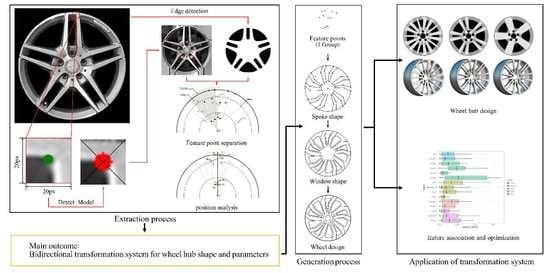
Figure 1.
Research process. Step 1 and step 2 decompose the wheel hub sample into feature points and feature groups, while step 3 and step 4 convert the feature points into semantic structural features. Step 4 can also be used to convert features into point coordinates for shape generation.
Figure 1.
Research process. Step 1 and step 2 decompose the wheel hub sample into feature points and feature groups, while step 3 and step 4 convert the feature points into semantic structural features. Step 4 can also be used to convert features into point coordinates for shape generation.

Figure 2.
Research sample. A total of 682 wheels from 15 brands was used as the research samples, and all samples were pre-processed to avoid the influence of light and size on the results.
Figure 2.
Research sample. A total of 682 wheels from 15 brands was used as the research samples, and all samples were pre-processed to avoid the influence of light and size on the results.

Figure 3.
Labeled samples. All samples were labelled using LabelMe to extract feature points on either side of each spoke. In the central area, the position where the trend of the spokes changes was used as the endpoint.
Figure 3.
Labeled samples. All samples were labelled using LabelMe to extract feature points on either side of each spoke. In the central area, the position where the trend of the spokes changes was used as the endpoint.

Figure 4.
Transformation process of feature points and target areas. Transform the labeled feature points (green circle) into a 20 px × 20 px square target area for the training process; the midpoint of the feature region (red circle) obtained by the detection model result is the extracted feature point.

Figure 5.
Feature grouping process. Based on the number of windows , parameters and . By evaluating the under all the expected groupings, the window difference within the group corresponding to its maximum value is the largest, indicating that the individual spokes within this group are least similar to each other and can be classified into a feature group.

Figure 6.
Optimization of feature point detection area. Line 1 and Line 2 divide the window on each side of the spokes into three subareas, and the geometric center of each subarea together with the center forms the construction point of the optimized detection area. Compared to the original area, the new area better fits the shape trend of the spokes.

Figure 7.
Radial position analysis. and are unit vectors. is the point farthest from the center and is the closest to the center. and are used to detect another start and endpoint.
Figure 7.
Radial position analysis. and are unit vectors. is the point farthest from the center and is the closest to the center. and are used to detect another start and endpoint.

Figure 8.
Shape transformation process. The transformation model reduces the feature values to a set of feature points. Spoke edges are constructed from the relationships between the feature points. The spoke edges and the rim together form the window construction area, which is shaped according to the offset values.

Figure 9.
3D model building process. (A) Projection on the upper surface. (B) Projection on the bottom surface. (C) Combining the surfaces to form the complete shape of the wheel hub.
Figure 9.
3D model building process. (A) Projection on the upper surface. (B) Projection on the bottom surface. (C) Combining the surfaces to form the complete shape of the wheel hub.

Figure 10.
Training results of the feature point extraction model. The top row is for training and the bottom row, for validation. According to the output, it shows that box_loss (train) = 0.036, box_loss (val) = 0.022, obj_loss (train) = 0.128, obj_loss (val) = 0.088, precision rates = 0.994, and recall rates = 0.983, indicating that the feature point detection met the research expectation.

Figure 11.
Detection results of feature points. The results were basically the same for different wheel shapes. The start point and midpoint of the wheel hub had good detection results. Partially missed endpoints can be filled in by subsequent processing.
Figure 11.
Detection results of feature points. The results were basically the same for different wheel shapes. The start point and midpoint of the wheel hub had good detection results. Partially missed endpoints can be filled in by subsequent processing.

Figure 12.
Boundary transformation of spokes. The boundaries (red lines) on either side of each spoke were sorted clockwise, and the feature points (blue dots) on each boundary were sorted according to their distance from the center of the wheel hub. The sorted feature points were used to determine the degree of similarity by performing a distance calculation with the original feature points at the corresponding locations.

Figure 13.
Similarity of spokes after transformation. The x-axis represents the reciprocal of the average distance between points in the same location, and the y-axis represents the data density. The larger the value, the more similar the shape. The green area is the number of samples with an average distance of less than 20 px, and the similarity of the detection results in this area was high.

Figure 14.
Results of the reconstruction of wheel hub shape. (A) Original sample. (B) Generated 2D shapes. (C) Constructed 3D models.
Figure 14.
Results of the reconstruction of wheel hub shape. (A) Original sample. (B) Generated 2D shapes. (C) Constructed 3D models.

Figure 15.
Reconstruction similarity. The x-axis is the reconstruction similarity and the y-axis is the data density. The higher the value, the more similar the two shapes are. The styling similarity between the orange and red areas was greater than 6, which means that the styling in this area was more than “relatively similar” to the original wheel hub.

Figure 16.
Time consumed by the conversion process. (A) Time consumed by feature point detection and sorting. (B) Time consumed by grouping. (C) Time consumed by reconstruction. Each x-axis was the elapsed time of the process (in seconds) and the y-axis was the data density. The smaller the value, the more efficient was the conversion.

Figure 17.
Spoke width based on different brands. The x-axis is the average spoke width on each wheel and the y-axis is the brand. The larger the value, the wider the spokes overall. In the graph, BMW has a narrower average spoke width, while Chevrolet has a wider average spoke width.
Figure 17.
Spoke width based on different brands. The x-axis is the average spoke width on each wheel and the y-axis is the brand. The larger the value, the wider the spokes overall. In the graph, BMW has a narrower average spoke width, while Chevrolet has a wider average spoke width.

Figure 18.
Spoke angle based on different brands. The x-axis is the average spoke angle on each wheel and the y-axis is the brand. The larger the value, the greater the deflection of the overall wheel shape. In the graph, Honda has more overall deflection, while Mazda has essentially no deflection.
Figure 18.
Spoke angle based on different brands. The x-axis is the average spoke angle on each wheel and the y-axis is the brand. The larger the value, the greater the deflection of the overall wheel shape. In the graph, Honda has more overall deflection, while Mazda has essentially no deflection.

Figure 19.
Window distance based on different brands. The x-axis is the average of the window-to-spoke distance and the y-axis is the brand. The larger the value, the wider the slope on either side of the spoke. In the graph, Citroen has a wider slope, while Buick has a narrower slope.
Figure 19.
Window distance based on different brands. The x-axis is the average of the window-to-spoke distance and the y-axis is the brand. The larger the value, the wider the slope on either side of the spoke. In the graph, Citroen has a wider slope, while Buick has a narrower slope.


Table 1.
Basis of symmetry detection.
| Detection Objects | |||
|---|---|---|---|
| Parameter | Value | ||
| Position of spoke | |||
| Spoke width | |||
| Spoke angle | 0 | ||
| Bilateral included angle | |||
| Position of middle point | |||
| Angle of middle point | |||
| Closing position | |||
| Position of window | |||
Table 2.
Center point judgment method.
| Relationship | Relationship | ||||||
|---|---|---|---|---|---|---|---|
| Graph | Left | Right | Graph | Left | Right | ||
| A |  | Disjoint | Disjoint | B |  | Intersect | Disjoint |
| C |  | Disjoint | Intersect | D |  | Intersect | Intersect |
Table 3.
Table of wheel hub feature parameters.
| Figure | Feature | Parameter | |||||||
|---|---|---|---|---|---|---|---|---|---|
| 1 | 2 | 3 | 4 | 5 | 6 | 7 | 8 | ||
 Sample 110 | Hub grouping | 5 | |||||||
| Spokes in the group | 2 | ||||||||
| Symmetry | True | ||||||||
| Position of spoke | −0.545 | −0.736 | – | – | |||||
| Spoke width | 0.008 | 0.008 | – | – | |||||
| Spoke angle | −0.118 | 0.131 | – | – | |||||
| Included angle of spoke | 0.108 | 0.102 | – | – | |||||
| Position of middle point | 0 | 0.651 | 0.635 | 0 | – | – | – | – | |
| Angle of middle point | 0 | −0.068 | 0.076 | 0 | – | – | – | – | |
| Closing position | 0.356 | 0.174 | 0.370 | – | – | ||||
| Position of window | 8.125 | 5 | 7.016 | 8.290 | – | – | – | – | |
Disclaimer/Publisher’s Note: The statements, opinions and data contained in all publications are solely those of the individual author(s) and contributor(s) and not of MDPI and/or the editor(s). MDPI and/or the editor(s) disclaim responsibility for any injury to people or property resulting from any ideas, methods, instructions or products referred to in the content. |
© 2023 by the authors. Licensee MDPI, Basel, Switzerland. This article is an open access article distributed under the terms and conditions of the Creative Commons Attribution (CC BY) license (https://creativecommons.org/licenses/by/4.0/).
Share and Cite
MDPI and ACS Style
Li, W.; Lu, Z. Feature Transformation Method for Wheel Hub Shape Based on Target Detection and Geometric Analysis. Electronics 2023, 12, 1946. https://doi.org/10.3390/electronics12081946
AMA Style
Li W, Lu Z. Feature Transformation Method for Wheel Hub Shape Based on Target Detection and Geometric Analysis. Electronics. 2023; 12(8):1946. https://doi.org/10.3390/electronics12081946
Chicago/Turabian StyleLi, Wangxi, and Zhangping Lu. 2023. "Feature Transformation Method for Wheel Hub Shape Based on Target Detection and Geometric Analysis" Electronics 12, no. 8: 1946. https://doi.org/10.3390/electronics12081946
Note that from the first issue of 2016, this journal uses article numbers instead of page numbers. See further details here.