Article

Research on Orderly Charging Strategy for Electric Vehicles Based on Electricity Price Guidance and Reliability Evaluation of Microgrid

Inverter Technology Engineering Research Center of Beijing, North China University of Technology, Beijing 100144, China
*
Author to whom correspondence should be addressed.
Electronics 2023, 12(23), 4876; https://doi.org/10.3390/electronics12234876
Submission received: 8 October 2023 / Revised: 29 November 2023 / Accepted: 29 November 2023 / Published: 4 December 2023

Abstract

:
With the increasing use of electric vehicles (EVs), EVs will be widely connected to the microgrid in the future. However, the influence of the disorderly charging behavior of EVs on the stable and reliable operation of the power grid cannot be ignored. To address these challenges, the charging load characteristic model is established to describe the charging behavior of EVs. Then, an EVs orderly charging strategy based on electricity price guidance is proposed, and the goal is to minimize the peak–valley difference ratio and the total cost of EV charging. The result shows that, compared with disorderly charging, the EV orderly charging strategy based on electricity price guidance proposed in this paper can effectively reduce the peaking and valley difference ratio of load, reduce user’s charging costs, and optimize the reliability level of the microgrid.

1. Introduction

With the worsening of environmental problems, people’s awareness of environmental protection has reached an unprecedented height. As a representative of green transportation and a contributor to carbon emissions, new energy electric vehicles (EVs) have been widely recognized and developed at home and abroad [1]. According to statistical data from the International Energy Agency (IEA) in the “Global EV Outlook 2023” [2] and Bloomberg’s “Electric Vehicle Outlook 2023” [3], the majority of EV sales are currently concentrated in three major markets: China, Europe, and the United States. Over half of global EV sales in 2022 took place in China, and EV sales in Europe and the United States are increasing by 15% and 55%, respectively. Projections indicate that by 2030, China will maintain its position as the largest EV market, accounting for 40% of total sales. By the end of this century, the market share in the United States is expected to double, reaching 20%, while Europe’s market share will remain at its current 25%. At present, the microgrid presents four characteristics: extensive access to new energy, diversified load characteristics, versatile operational modes, and the increasing penetration of EVs. At the same time, the impact of the rapid development of EVs on the microgrid should not be ignored [4,5,6]. Without proper guidance, the disordered access of large-scale EVs will increase the peak–valley difference of the power grid load, resulting in line overload and endangering the safe and stable operation of the power grid [7,8,9]. Since EV charging is entirely determined by user willingness, conventional measures have a limited impact on EV guidance. Through the implementation of a time-of-use (TOU) mechanism, users can be encouraged to shift their charging loads temporally. This ensures that the load levels during different periods remain within manageable limits, allowing for the optimization of the grid’s load curve and an enhancing the system’s reliability [10,11].
In recent years, a lot of research has been carried out on the orderly charging of EVs at home and abroad. The acceptance capacity of the power grid for EVs and the degree of users’ response are two important factors in measuring orderly charging, and the former is described in detail in the literature [12]. By increasing the capacity of access points, line overload can be avoided and the reliability of a small-region distribution network can be effectively improved [13]. At present, TOU and real-time pricing (RTP) mechanisms are important methods with which to guide users to charge orderly. Based on TOU, studies [14,15] have established a multi-objective orderly charging model from the perspectives of users and power grids, which ensures the safety and stability of distribution networks and improved users’ charging satisfaction. Further, a study [16] proposed an orderly charging method based on the demand response of the optimal time-of-use price (OTOUP) of EVs, and used the demand price elasticity matrix to measure the relationship between the charging demand and charging price of EVs. Through the guidance of RTP, another study [17] maximizes the reliability of MG while minimizing the comprehensive operating cost (COC) by establishing a two-layer planning optimization model for HESS capacity.
In addition, a comprehensive operating cost, peak–valley load difference, and network loss are also optimized objects for orderly charging research [18,19,20,21]. With the aim of optimizing power supply reliability, a study [18] established a peak–valley TOU model to evaluate system reliability before and after. Another study [19] used a dynamic TOU mechanism to guide EVs to make charging and discharging decisions. Then, the orderly charging and discharging scheduling model of EVs was established by considering the comprehensive operating cost and minimizing the peak–valley load difference. Similarly to the study in [19], the study in [20] developed an EV orderly charging strategy aimed at minimizing peak–valley difference and network loss, and evaluated the impact of EV access under different proportions, load transfer rates, and scenarios. More extensively, Ref. [21] mentions a hybrid modified MG-SAPSO scheme for optimizing load scheduling in microgrids that include EVs. The cost and load changes of the microgrid are compared using three strategies: disorderly charging, orderly charging and discharging, and the orderly charging and discharging of distributed generation (DG). The results show that the orderly charging and discharging strategy of DG is more advantageous.
In summary, the above studies provide valuable insights into the topic of this paper. However, few studies have focused on the impact of large-scale EV access to microgrids on power supply reliability, and the reliability of microgrids also needs to be evaluated from multiple dimensions, especially in the context of research related to TOU. In fact, the greater the number of EVs connected to the grid, the greater the impact on grid reliability. Therefore, it is of great significance to take the orderly charging of EVs into the research field of microgrid reliability evaluation.
Differing from the aforementioned literature, the purpose of the research in this paper is to obtain the characteristics of the charging start time, charging end time, charging duration, and daily mileage by modeling the charging load characteristics of EVs. Subsequently, taking the reliability of the microgrid into consideration, an orderly EV charging strategy is proposed with the following objectives: minimizing the peak–valley difference ratio and total charging costs for EVs users. This strategy incorporates constraints such as power balance, ESS charging and discharging, and EV SOC limitations. Finally, the effects of disorderly charging and orderly charging on the peak–valley load ratio, total charging cost of EVs, and microgrid reliability are calculated via the elite genetic algorithm (EGA) method.
The contributions of this paper are as follows:
(1)
The interactive relationship between the orderly charging and reliability of microgrid are analyzed, and the reliability of the microgrid can be improved via orderly charging;
(2)
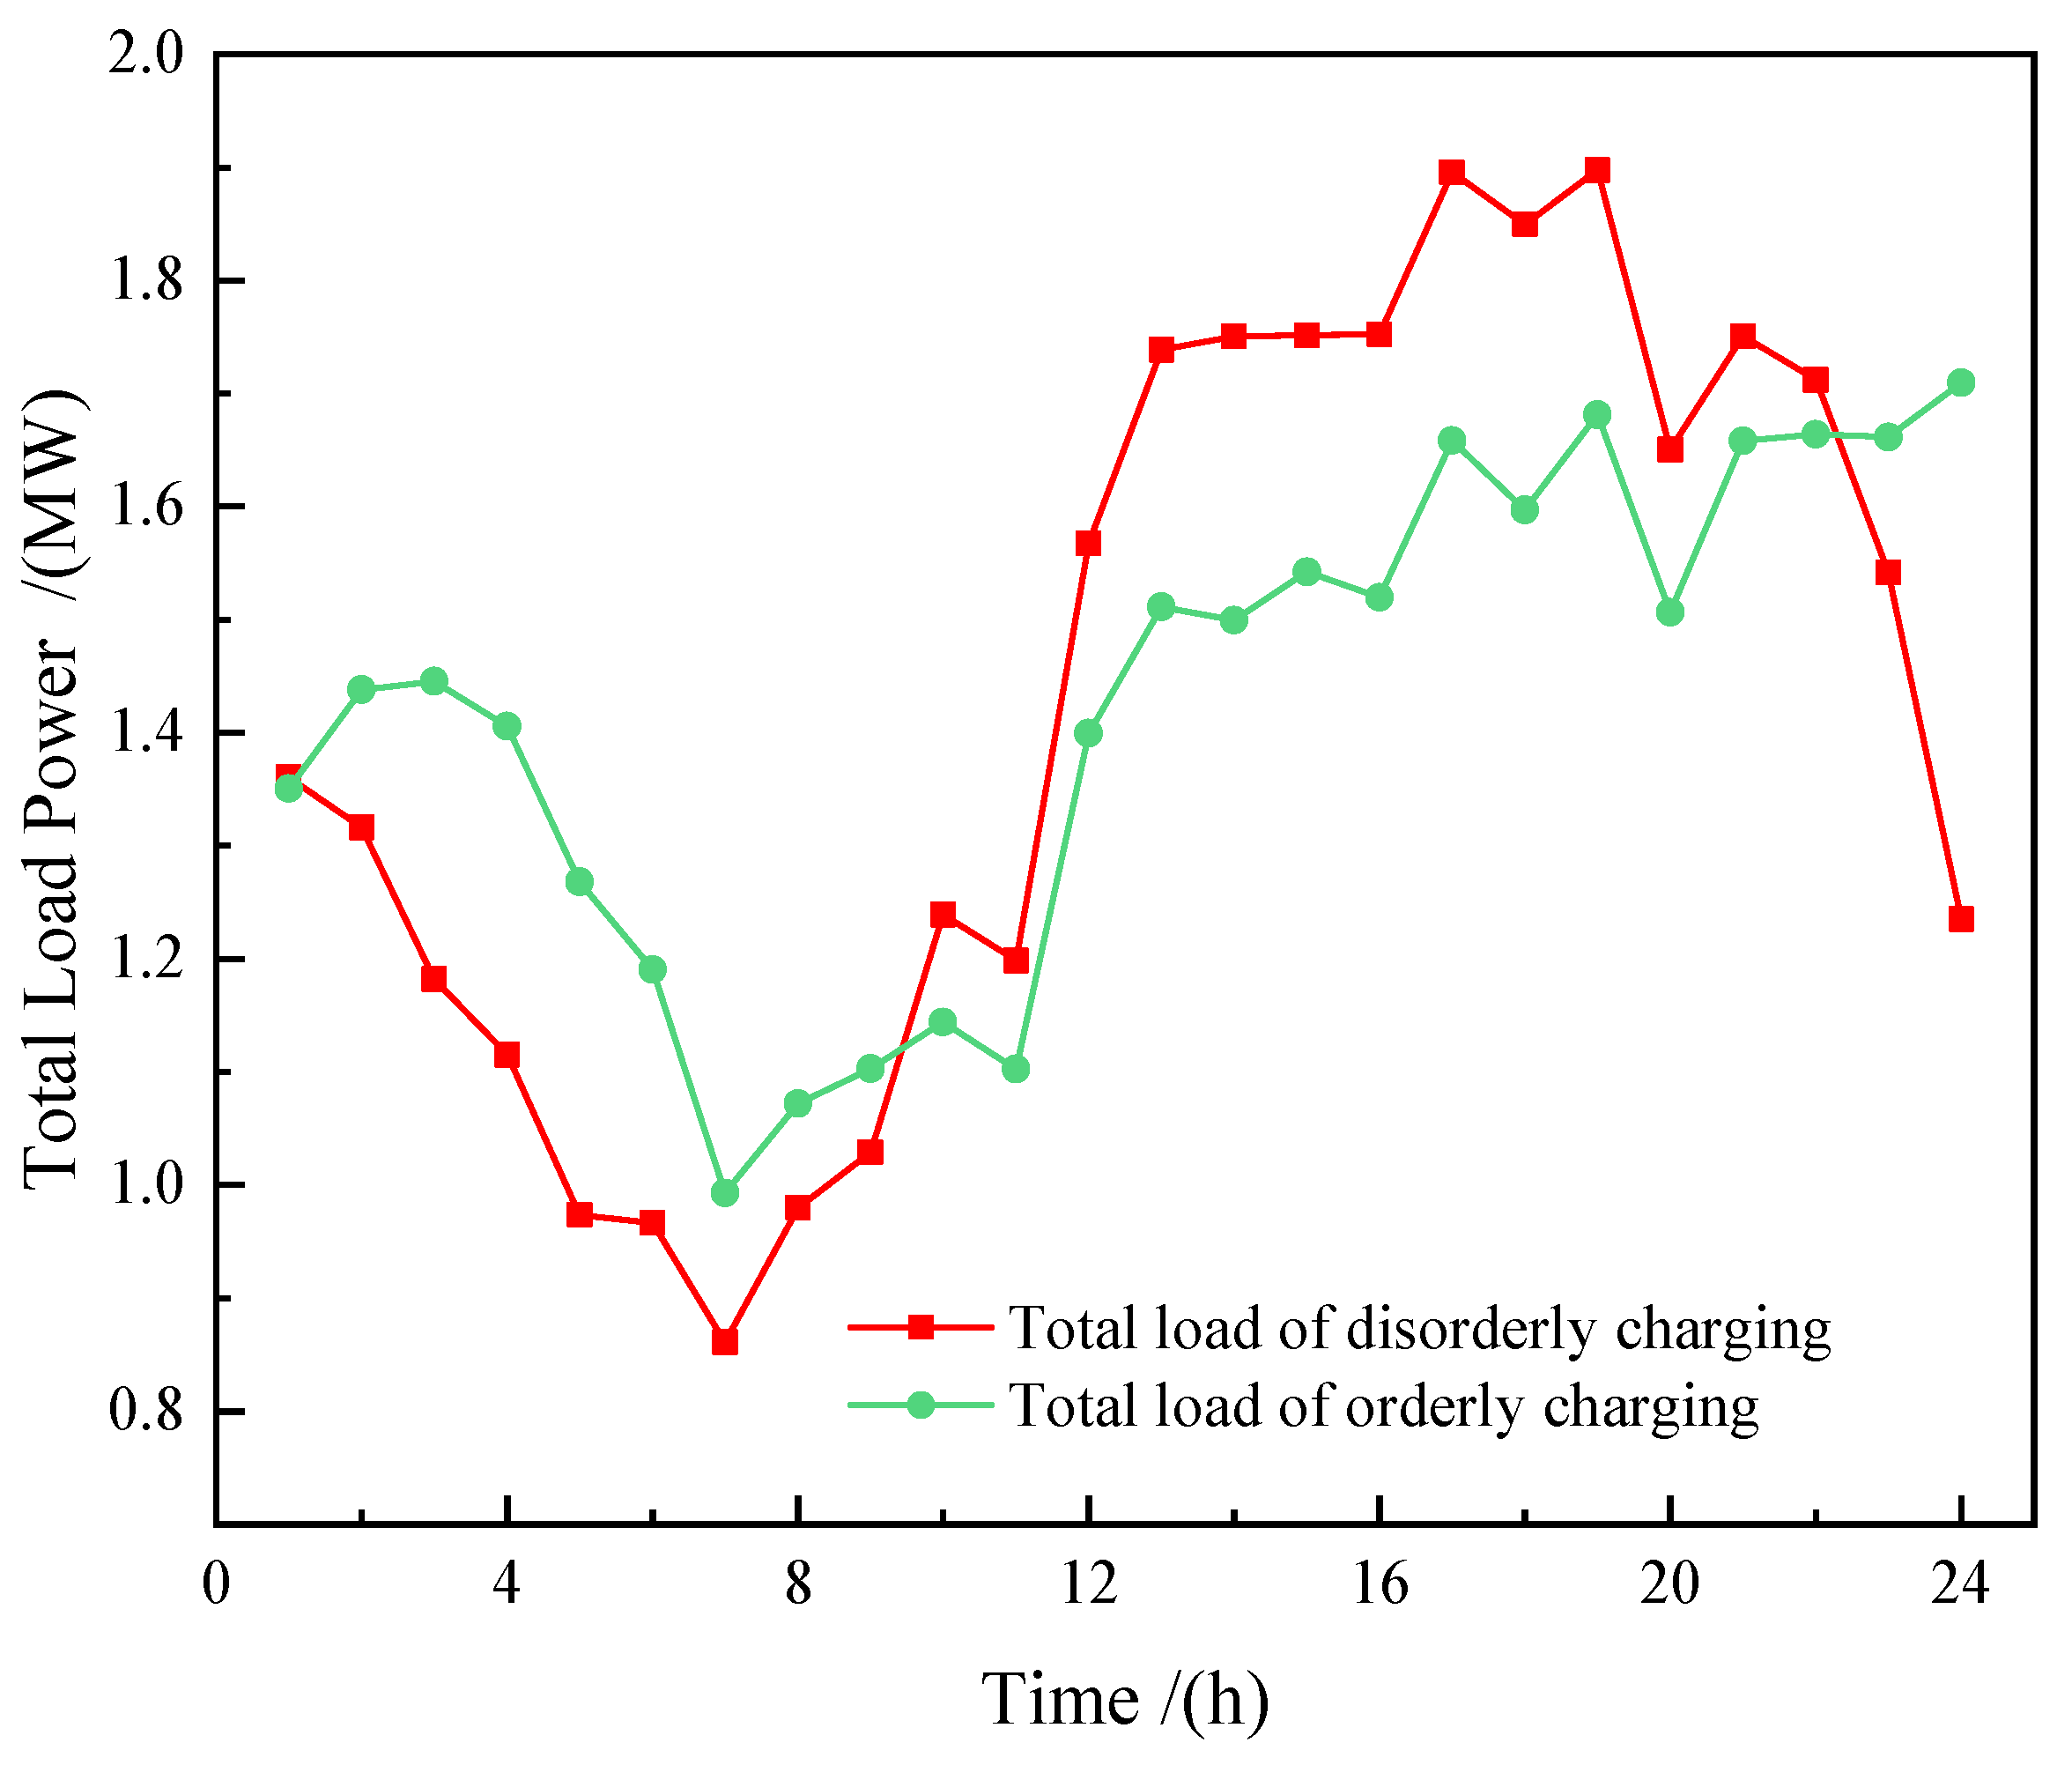
By comprehensively considering the orderly charging and reliability evaluation of EVs, an orderly charging strategy for EVs based on TOU pricing guidance is proposed, which can effectively reduce the peak–valley load difference ratio and reduce the charging cost for users.
The rest of the paper is arranged as follows. We build the EV charging load characteristic model in Section 2. In Section 3, we elaborate on electricity price guidance and orderly charge optimization, which includes establishing the optimization objective function and determining constraint conditions. Then, the workflow and implementation of the elite genetic algorithm (EGA) are given in Section 4. In Section 5, the optimization effect of EV charging and reliability evaluation based on electricity price guidance are analyzed, followed by the conclusions of the paper in Section 6.

2. Modeling of EV Charging Load Characteristics

The study of EV charging load modeling is helpful for analyzing the impact of EVs on the power grid. However, it is difficult to model and analyze the charging behavior of a single EV due to the large differences in users’ travel needs and habits, types of EVs, and battery parameters. Through a statistical analysis of EV driving patterns, such as the 2017 National Household Travel Survey (NHTS) data released by the U.S. Department of Transportation, accurate EV charging load data can be obtained. By extracting the daily mileage distribution, charging start time, charging time and charging end time of EVs, and other main factors affecting the load characteristics of EVs, the load characteristic model of EVs was obtained via the Monte Carlo (MC) probabilistic simulation method.

2.1. EV Charging Start Time

As a special load and energy storage device, an EV’s mobility makes its charging load random and dynamic in time and space. Users can choose the appropriate time and way to charge according to their travel needs. Therefore, one day can be divided into several charging periods based on the travel statistics of EVs, and the probability distribution of the charging start time can be determined by the driving habits of users and actual statistical data. The research shows that the charging start time meets the normal distribution, and the probability density function (PDF) is [4] as follows:
f T ( t i ) = 1 2 π σ i 2 exp ( t i μ i ) 2 2 σ i 2 , μ i 12 < t i 24 1 2 π σ i 2 exp ( t i + 24 μ i ) 2 2 σ i 2 , 0 < t i μ i 12
where t i is the charging start time of the i-th EV, and μ i and σ i are the expectation and standard deviation of t i , respectively.

2.2. EV Charging End Time

According to the research, the EV charging end time also satisfies the normal distribution, and its PDF can be expressed via Equation (2) [22]:
f T ( t d ) = 1 2 π σ d 2 exp ( t d 24 μ d ) 2 2 σ d 2 , μ d + 12 < t d 24 1 2 π σ d 2 exp ( t d μ d ) 2 2 σ d 2 , 0 < t d μ d + 12
where t d is the charging end time of the d-th EV, and μ d and σ d are the expectation and standard deviation of t d , respectively.

2.3. EV Charging Time

At present, EV manufacturers mainly focus on lithium iron phosphate batteries and ternary lithium batteries in terms of on-board battery selection. A lithium battery is generally charged via the three-stage charging method of pre-charging, constant-current charging, and constant-voltage charging. When an EV starts charging from a lower starting state of charge (SOC), in order to avoid the impact of large currents on the battery, a short period of pre-charging is required. In the constant-current charging stage, the voltage at both ends of the battery is basically unchanged, so the charging power of the process is basically unchanged. When the battery is nearly fully charged, the battery will undergo a short period of constant-voltage charging. Therefore, the charging process of the lithium battery can be assumed to be a constant-power charging mode. The research shows that the EV charging time is mainly determined via the EV rated capacity, rated power, charging efficiency, and SOC state, as shown in Equation (3) [23]:
T i = E EV i ( 1 SOC EV ) η P EV i
where E EV i , P EV i , and η are the rated capacity, rated charging power, and charging efficiency of the i-th EV, respectively. SOC EV is the SOC of the EV.

2.4. EV Daily Mileage

The daily mileage reflects the power consumed by an EV in a day. This research shows that EV daily mileage approximately follows a lognormal distribution with parameters ( μ , σ 2 ), and its PDF can be expressed via Equation (4) [24]:
f D ( d i ) = 1 d i 2 π σ D 2 exp ( ln d i μ D ) 2 2 σ D 2
where d i is the daily mileage of the i-th EV after the last charging, and μ D and σ D are the expectation and standard deviation of d i , respectively.

3. Electricity Price Guidance and Orderly Charging Optimization

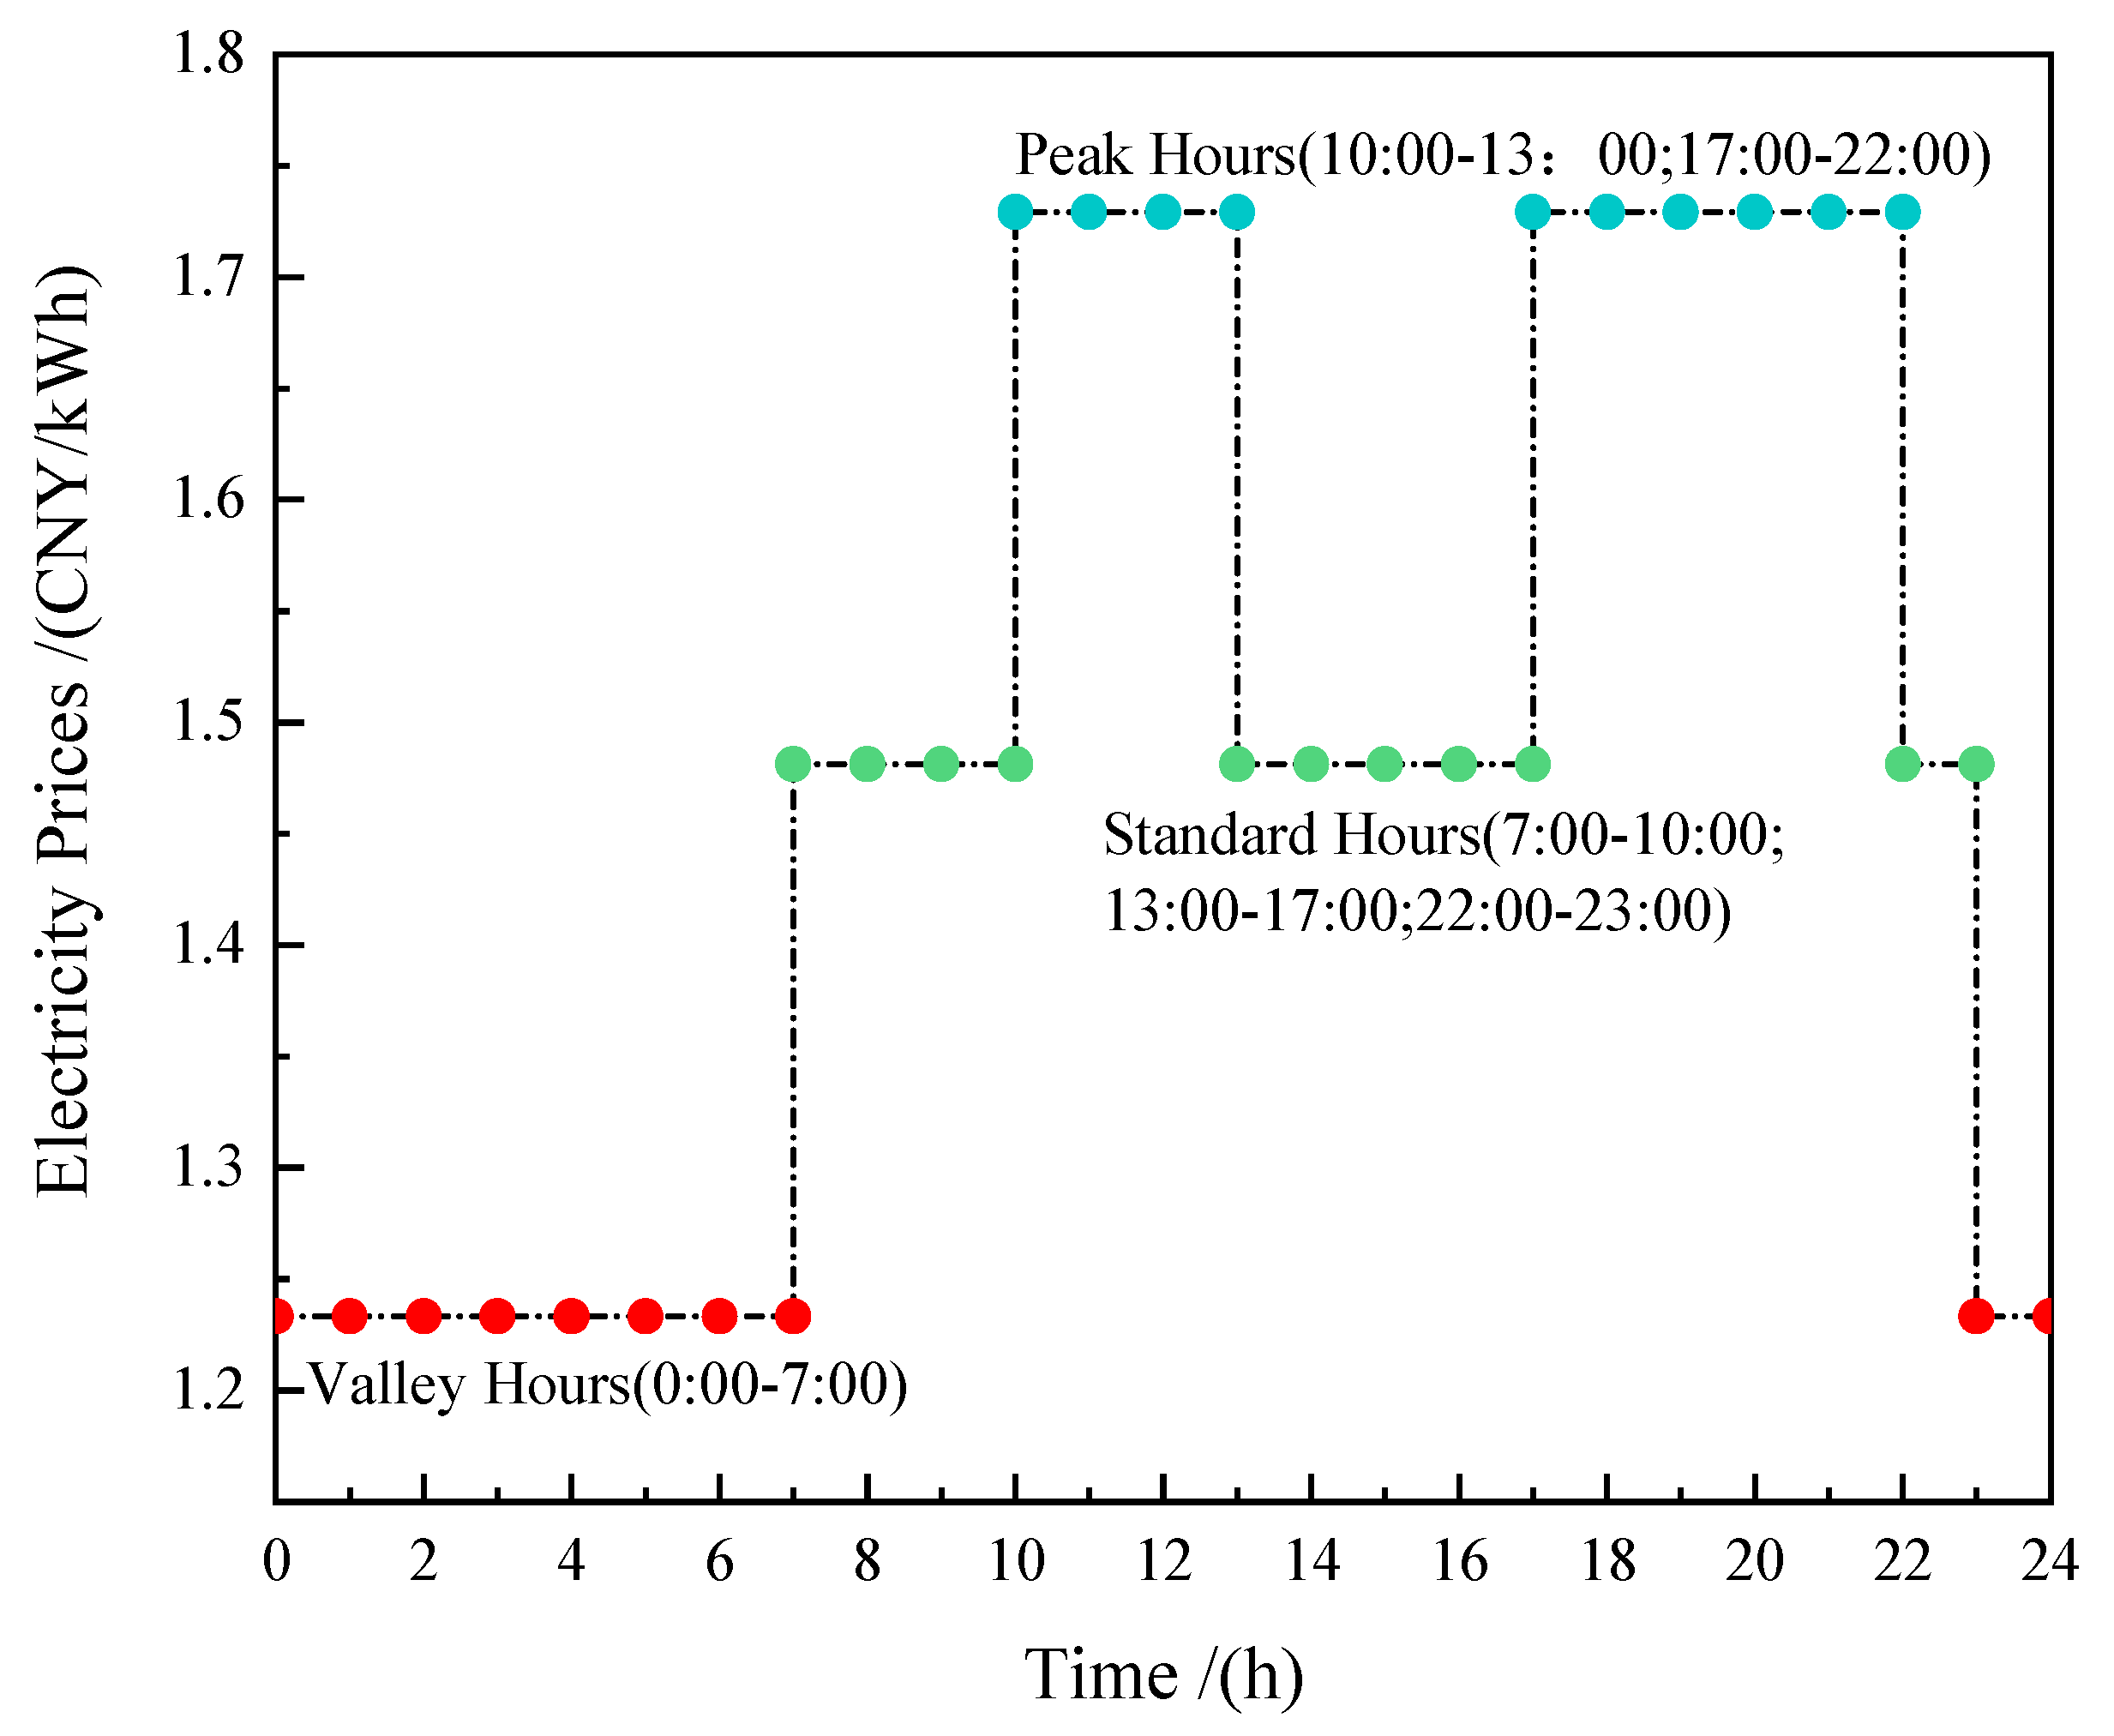
3.1. Electricity Price Guidance

According to a news release by The People’s Government of Beijing Municipality [25], by the end of June 2023, the number of motor vehicles in China reached 426 million, including more than 3 million in Beijing and other cities, representing an increase of 41.6%. It can be seen that, with the increase in EV ownership year by year, the demand for EV charging will be more urgent. Only relying on distribution capacity expansion does not only make it difficult to support the huge EV charging demand, but also impacts the stable economic operation of the distribution network. Without proper guidance, the large-scale disorderly load will be imposed on the distribution network, which will put forward a severe challenge to the safety of the distribution network and the acceptance capacity of the charging station. For the power grid, disorderly charging means that EVs only have charging behavior and are not controlled by the power grid; that is, EVs can be connected to the microgrid at different times and in different places. Compared with disorderly charging, orderly charging adjusts EV charging through control strategies or technical methods, reduces the peak and valley difference of the grid load, ensures a balance between supply and demand, and improves the comprehensive utilization rate of electric energy and the acceptance level of EVs in the distribution network. The peak–valley TOU electricity price mechanism is one effective incentive for the orderly charging of EVs. In general, when the electricity price during the charging period is lower, the number of EVs charged will increase. In contrast, when the price of the charging period increases, the number of EVs charged will decrease. This can not only encourage users to shift their energy consumption to valley hours, but also promotes the integration of renewable energy [26,27]. Grid operators formulate TOU pricing intervals and prices based on the peak–valley characteristics of grid loads, providing spatial–temporal guidance for EV charging behavior [28].
According to the charging data of the public charging stations in Shijingshan district of Beijing in September 2023, the public charging stations in this area apply the TOU electricity price, in which the valley time period is 0:00–7:00 and 23:00–24:00, and the charging price is 1.2334 CNY/kWh. The standard hours are 7:00–10:00, 13:00–17:00, and 22:00–23:00, and the charging price is 1.4813 CNY/kWh. The peak hours are 10:00–13:00 and 17:00–22:00, and the charging price is 1.7291 CNY/kWh, as shown in Figure 1. The charging price consists of a basic electricity charge and charging service fee. The charging service fee, which is 0.800 CNY/kWh at public charging stations in the region, is charged by the operators of the charging station, which acts as a communication bridge between the power grid and the users. Its provide users with operational information and charging tariff data. Users use this information to make charging decisions according to their requirements and then send charging requests to the charging station operators. Then, the operators, upon verifying the charging orders, proceed with the charging process. By obtaining the agency of the charging facilities in a certain area, the charging service is purchased from the power grid to provide the users with a charging service and make profits from it.

3.2. Objective Function

On the foundation of ensuring the optimal reliability level of the microgrid, we developed an orderly EV charging strategy with the following objectives: minimizing the peak–valley difference ratio and total charging costs for EV users. This strategy incorporates constraints such as power balance, ESS charging and discharging, and EV SOC limits.
(1)
Minimizing Peak–Valley Difference Ratio
With the goal of minimizing the peak–valley difference ratio, the day is divided into 24 schedulable time periods. One of the objective functions is to minimize the difference in the ratio of load peaks to valleys, which is achieved by combining the microgrid’s base load with the EV load across these time periods.
min f 1 = max ( P L MG ( h ) + P L EV ( h ) ) min ( P L MG ( h ) + P L EV ( h ) ) max ( P L MG ( h ) + P L EV ( h ) ) × 100 %
where P L M G (h) and P L E V (h) represent the microgrid base load and EV load, respectively.
(2)
Minimizing Total Charging Costs for EV Users
Simultaneously, to balance the interests of users and the grid, we propose an objective function that minimizes the total cost of EV charging:
min f 2 = min t = 1 24 P L EV ( h ) F L EV ( h ) P t T i
where F L EV (h) represents the EV state function, F L EV (h) = 1 indicates that the EV is charging at this moment, and F L EV (h) = 0 indicates that the EV is idle; Pt represents the charging electricity price at the current time.
There are two objective functions aforementioned, each optimizing different dimensions. Therefore, it is necessary to transform the multi-objective optimization problem into a single-objective optimization problem. Here, the weight coefficient method is used for multi-objective optimization problems:
min F = λ 1 f 1 + λ 2 f 2
where λ1 and λ2 are the weighting coefficients of the objective functions f1 and f2, respectively, and λ1 + λ2 = 1.

3.3. Constraint Conditions

(1)
Power Balance Constraint
To ensure the reliable operation of the microgrid, the real-time power balance in the microgrid needs be taken into account.
P L MG ( h ) + P L EV ( h ) = P PV ( h ) + P MT ( h ) + P WTG ( h ) + P ESS ( h ) + P G ( h )
where PPV(h), PMT(h), and PWTG(h) represent the output power of the photovoltaic (PV), microturbine (MT), wind turbine generator (WTG), and PESS(h) and PG(h) represent the energy storage system (ESS)’s charging/discharging power and grid power, respectively.
(2)
ESS Charging and Discharging Constraint
During ESS charging and discharging, the power should not exceed the constraints of the ESS charging and discharging power and SOCESS.
SOC ESS min SOC ESS ( h ) SOC ESS max
SOC ESS ( h ) = E ESS ( h ) / E ESS max
P dch max ( h ) P ESS ( h ) P ch max ( h )
where SOC ESS min and SOC ESS max are the allowable lower and upper limits of the ESS SOC, SSOC(h) is the SOC of ESS at the h-th moment, EESS(h) is the current capacity of the ESS, E ESS max is the upper limit of ESS capacity, and P ch max ( h ) and P dch max ( h ) are the maximum allowable charge and discharge power of the ESS, respectively.
(3)
EV SOC Constraint
To extend the lifespan of EV batteries, the SOCEV of EVs at any given moment should not exceed the set SOCEV upper and lower limits.
SOC EV min SOC EV i , j SOC EV max
where SOC EV min and SOC EV max are the upper and lower limits of EV SOC, and SOC EV i , j is the i-th EV SOC in the time period j.

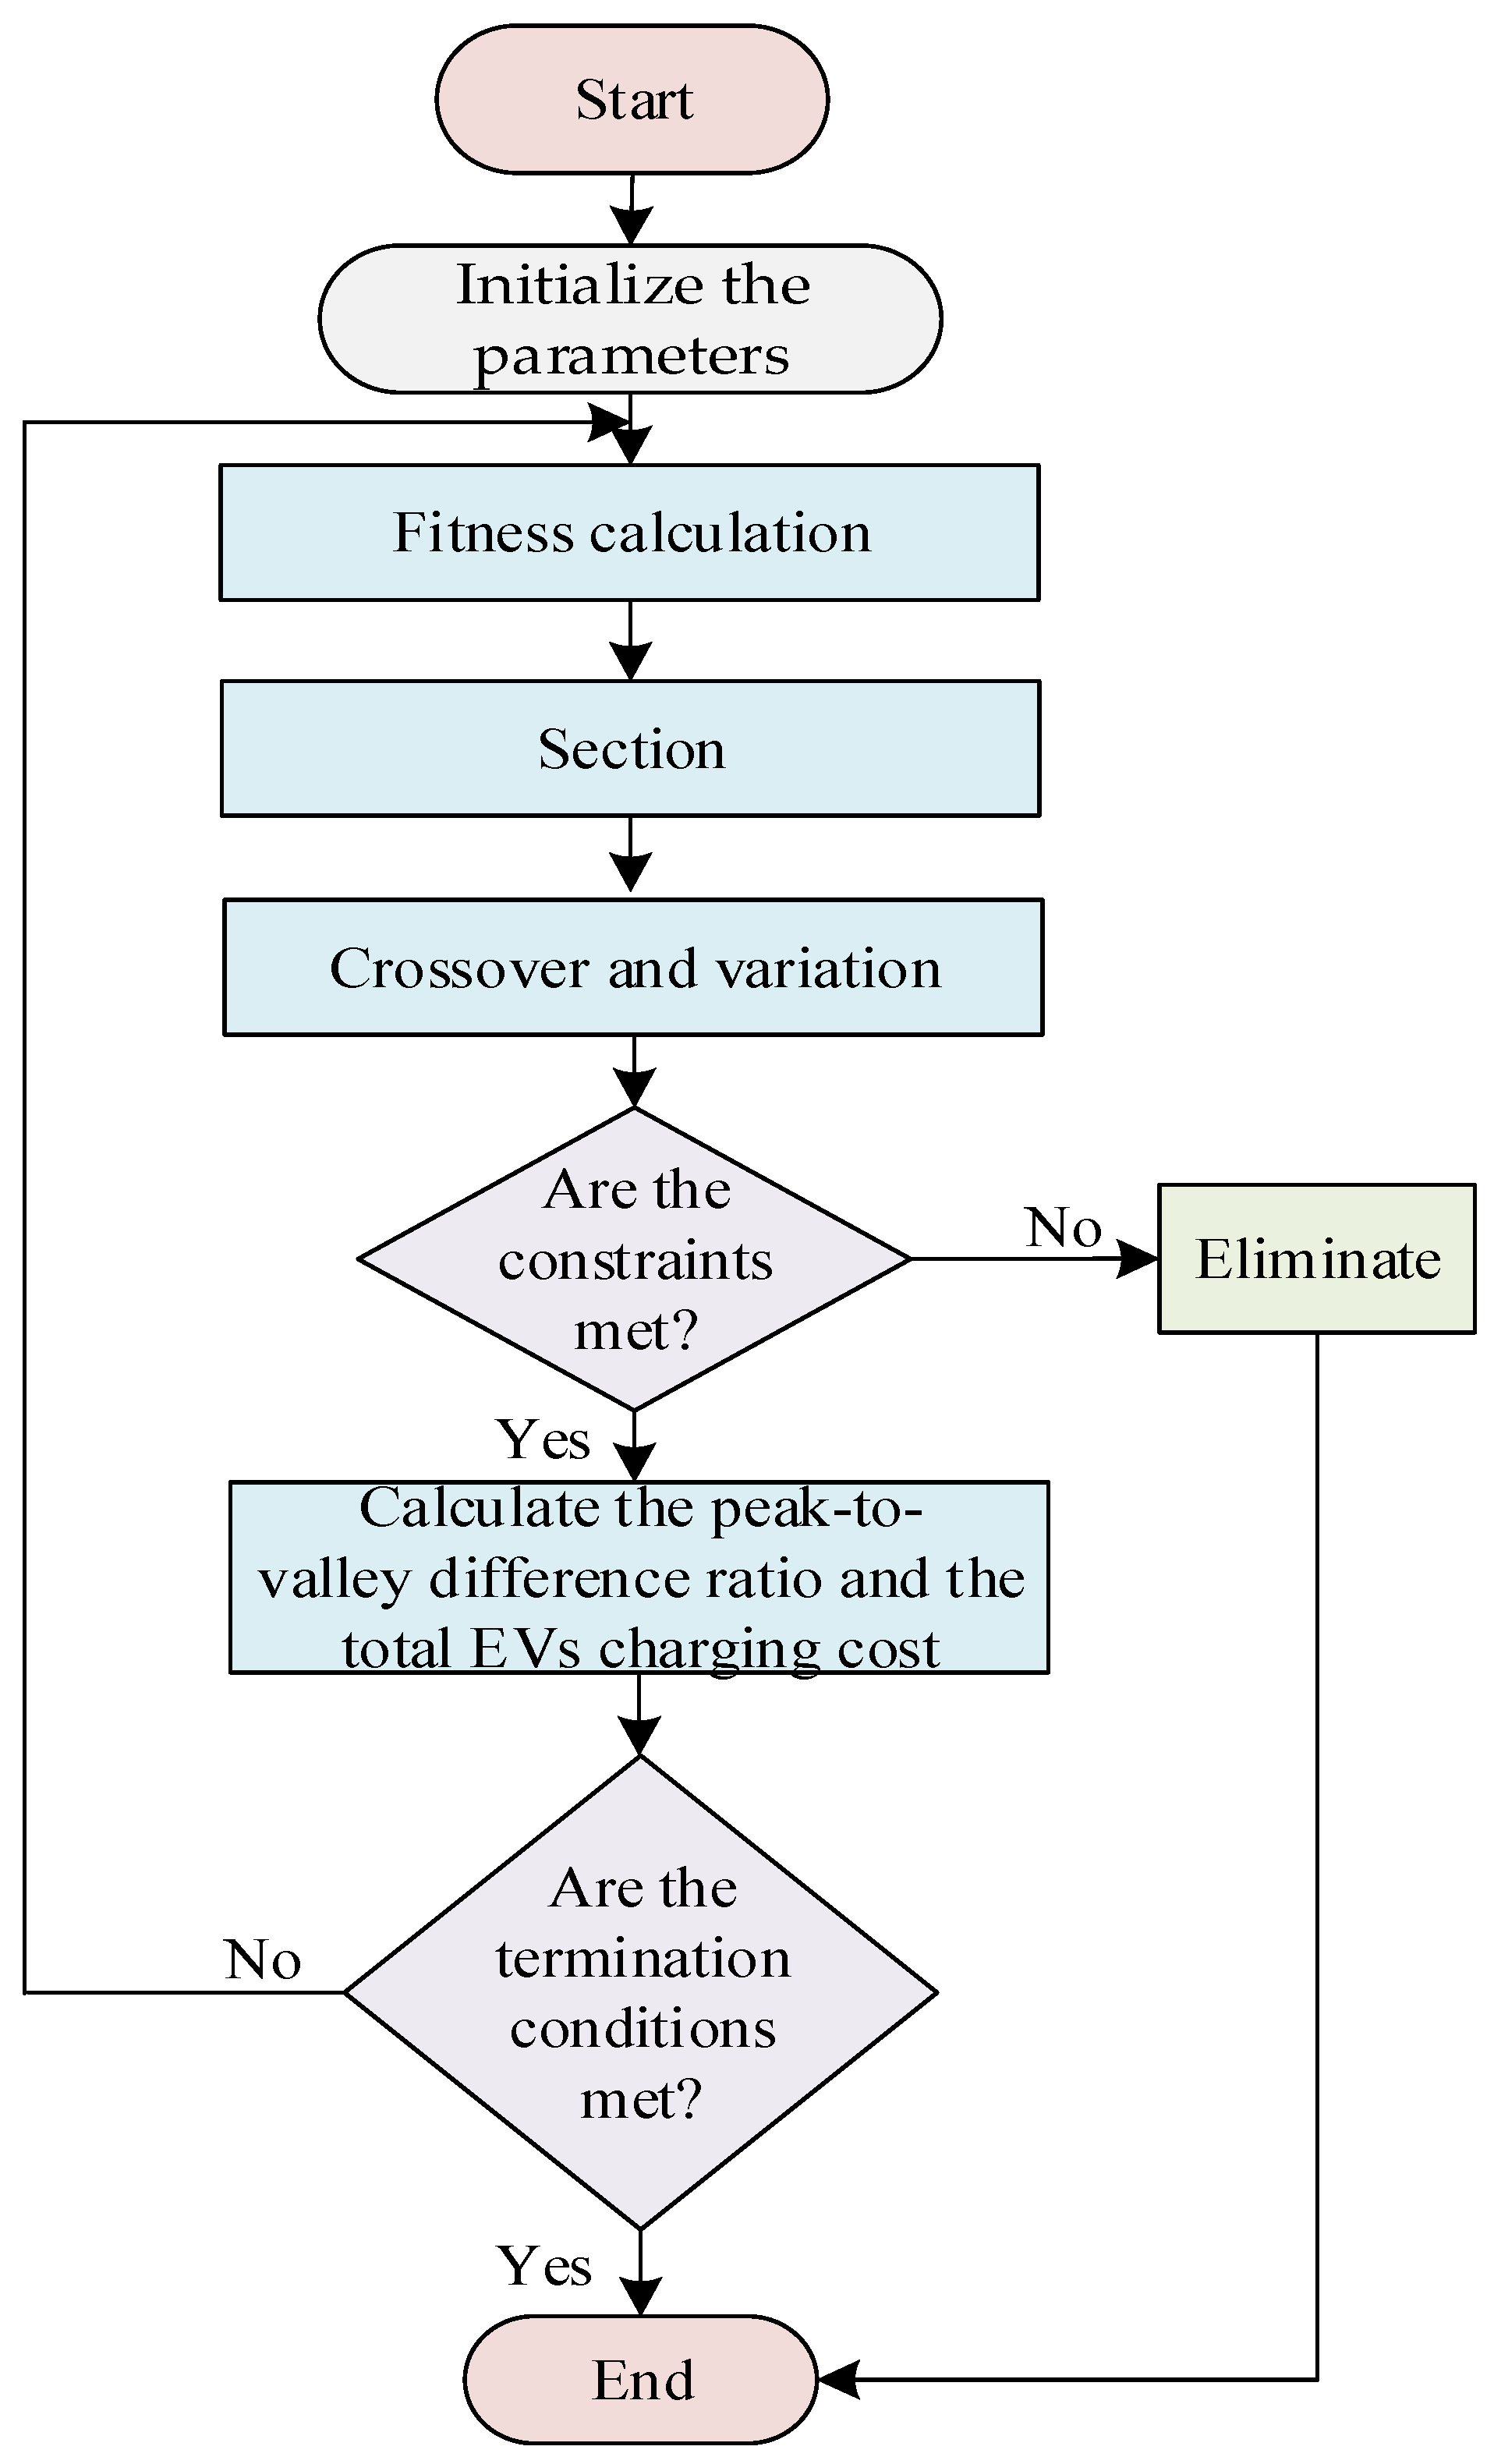
4. The Workflow and Implementation of Elite Genetic Algorithm

The genetic algorithm (GA) is a method for searching for optimal solutions by simulating the natural process of evolution. In GA, species undergo operations such as selection, crossover, and variation to achieve the “survival of the fittest” [28,29]. The EGA is an improved genetic algorithm that performs well in solving complex optimization problems by retaining excellent solutions, and improving convergence speed and precision. For the EGA, its core parameters include population size, iteration number, crossover probability, variation probability, and so on. In this manuscript, the population size is 100, the number of iterations is 200, and the crossover probability and variation probability are 0.8 and 0.4, respectively. The main steps of the EGA algorithm include the following, and its algorithmic flowchart is depicted in Figure 2.
Step 1. Initialize the parameters: Initialize the population size, number of iterations, etc.
Step 2. Fitness evaluation: Fitness values are calculated for each individual in the population and are used to measure an individual’s ability to solve problems.
Step 3. Selection: A subset of individuals from the current population is selected as “Elites”. Usually, selection is based on fitness values, and individuals with higher fitness are more likely to be selected as elites.
Step 4. Crossover and variation: A crossover operation is used to pair the remaining individuals to produce new offspring individuals. Variation manipulation is applied to some offspring individuals to introduce new diversity. The variation operation randomly changes certain characteristics or parameters of an individual to explore a new solution space.
Step 5. Eliminate: Some old individuals with newly generated offspring are eliminated to form a new population. Usually, elite individuals are not replaced in order to preserve the best solution to the problem.
Step 6. Iterative repetition: Steps 2 through 5 are repeated executed until the maximum number of iterations is reached or the predefined optimization objectives are achieved.

5. Simulation Analysis

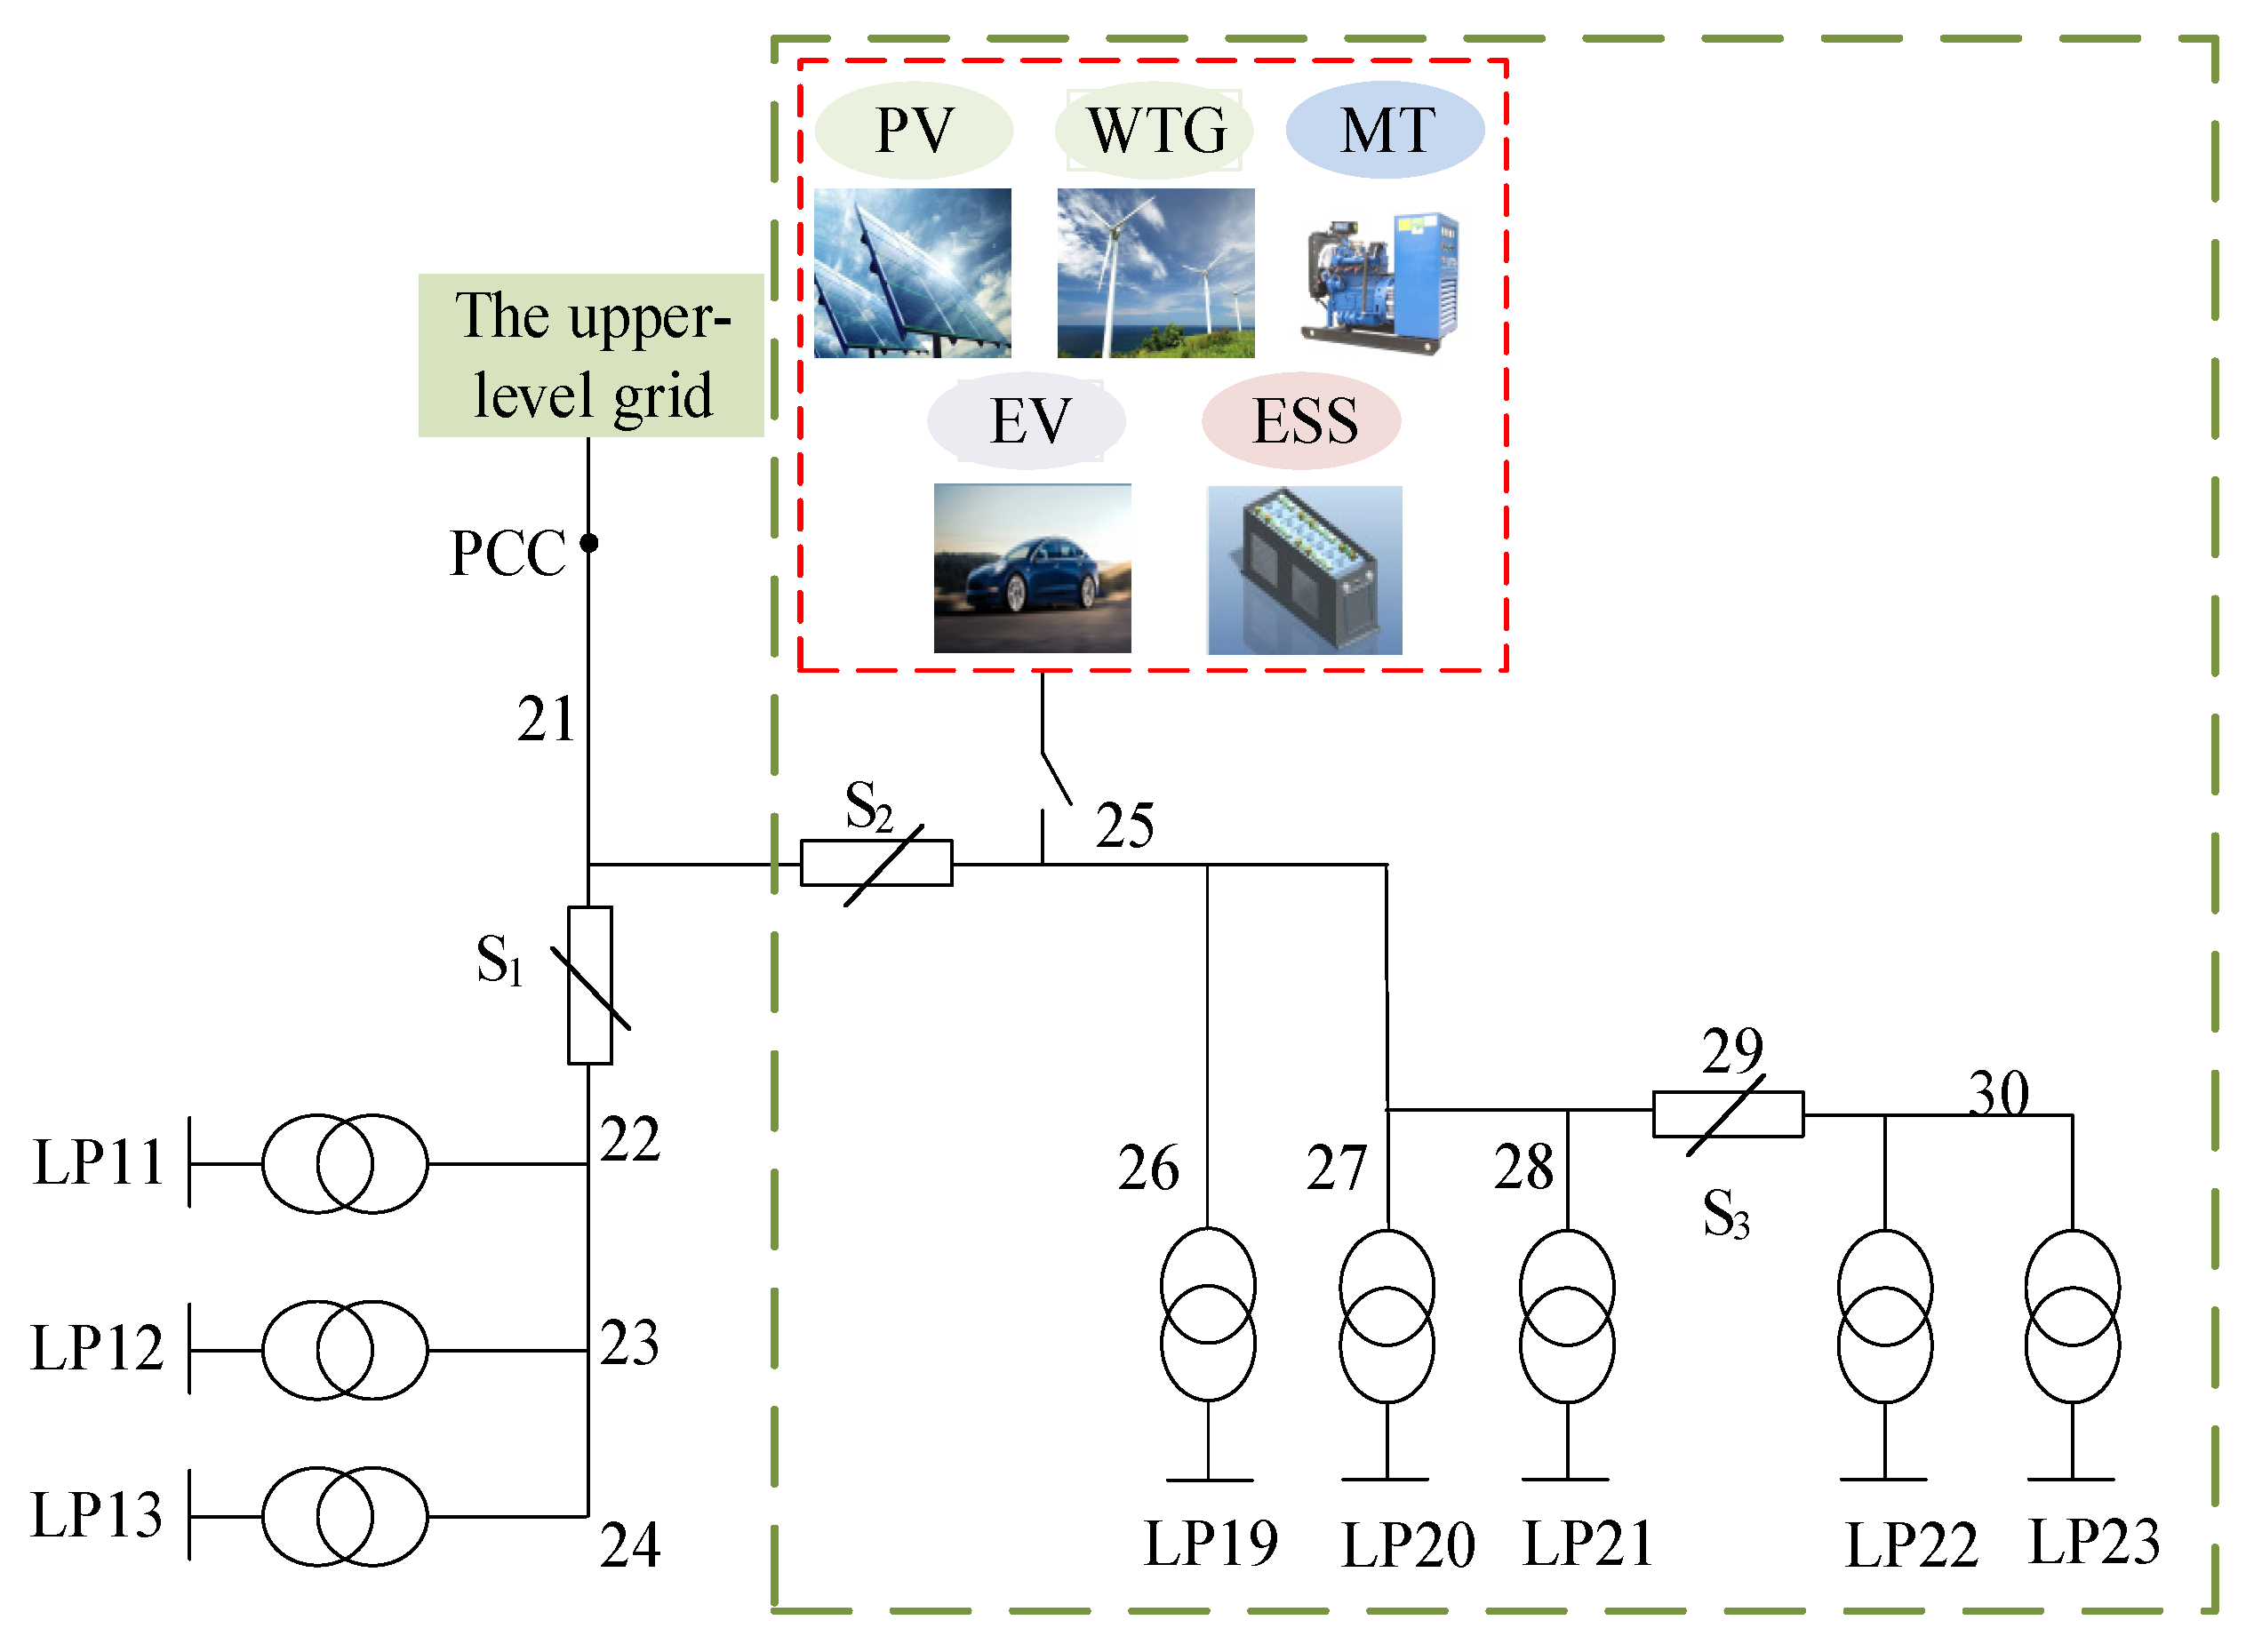
5.1. Basic Parameter Configuration

The study utilizes the improved RBTS BUS6 F4 system for simulation analysis, with 25 branches of the microgrid system, consisting of MT, WTG, PV, EVs, ESS, and loads, as shown in Figure 3. There are 23 load points in the system in total, and some branches are equipped with intelligent switches, which can effectively cut off the load currents. Energy interaction between the microgrid and the upper-level grid occurs via the point of common coupling (PCC). The output characteristic models of MT, WTG, PV, and ESS have been established in the literature [30]. For the EV load model, by using the MC simulation method, we extracted the load characteristic information of each EV, such as the charging start time, daily mileage, charging duration, etc. [31,32,33]. After superimposing the load characteristics of N-th EVs, the total charging load of EVs under a certain number was obtained. The model was mainly fitted with the data of passenger cars, and could reflect the load characteristic fluctuation curve of passenger cars. Compared with commercial vehicles such as buses, engineering vehicles, and postal vehicles, which usually have fixed driving characteristics and parking places, the power demand of cars is fixed, while passenger vehicles are more random and flexible in terms of mileage or user charging behavior, and can achieve orderly charging through electricity price guidance. Therefore, this paper takes the family passenger car as the research object and considers its driving characteristics. Here, the basic parameters of the EV model are shown in Table 1. In addition, the failure rates of MT, WTG, PV, and ESS were 0.05 occurrences per year, 0.05 occurrences per year, 0.25 occurrences per year, and 0.05 occurrences per year, respectively. The repair rates were 0.083 occurrences per hour, 0.0167 occurrences per hour, 0.0125 occurrences per hour, and 0.02 occurrences per hour, respectively. The parameters of the PV power output model with beta distribution are 2 and 0.8. The capacity of MT is 2.2 MW, the capacity of PV and WTG are both 2.4 MW, and the capacity and power of ESS are 4 MWh and 2 MW, respectively. The expectation of the microgrid base load deviation, μL, and standard deviation, σL, are 0 and 0.1, respectively. Appendix A Table A1, Table A2 and Table A3 shows the microgrid base load data.
Figure 4 depicts the charging demand of different EVs when they are connected to the microgrid, obtained using the MC simulation method. It can be seen that the more EVs are connected, the greater the charging power is demanded. From the microgrid base load curve, it can be seen that the peak time of microgrid users’ electricity consumption is from 16:00 to 21:00, which is also the peak time of EV charging. The overlap of the charging peak and user consumption peak easily causes line overload and endangers the safe operation of the power grid. Therefore, it is very necessary to carry out research on the orderly charging of EVs under a certain scale with electricity pricing guidance.

5.2. Analysis of EV Charging Optimization Effect Based on Electricity Price Guidance

5.2.1. Optimization Effect Analysis of a Certain Number of EVs

In order to analyze the optimization effect of electricity price guidance under a certain number of EVs, we take 100 EVs as an example to illustrate this, as shown in Figure 5. In combination with Figure 4, through electricity price guidance, the charging time of EVs is more concentrated in the valley electricity price period, while the charging demand is reduced due to the peak electricity price. This avoids the overlap of microgrid users’ electricity consumption and EV charging peaks, and is conducive to the stable and reliable operation of microgrid.
Furthermore, taking Table 2 as an example, a comparison is made between microgrid load levels and total EV charging costs before and after electricity price guidance. It can be seen that under the guidance of the electricity price, the peak load is reduced from 1.90 MW to 1.71 MW, a decrease of 10%. The valley load increased by 0.13 MW from 0.86 MW to 0.99 MW. The peak–valley difference decreased from 1.03 MW to 0.72 MW, and the peak–valley difference ratio also decreased from 54.63% to 41.92%. The above data show that electricity price guidance can achieve the peak cutting and valley filling of the microgrid well. Simultaneously, with electricity price guidance, the total EV charging costs decrease from 6562.54 CNY to 5525.76 CNY; 1036.78 CNY is saved for users. Obviously, reduced charging costs for EV users can effectively increase user responsiveness to the electricity price guidance mechanism, which can enhance users’ adherence to orderly charging.

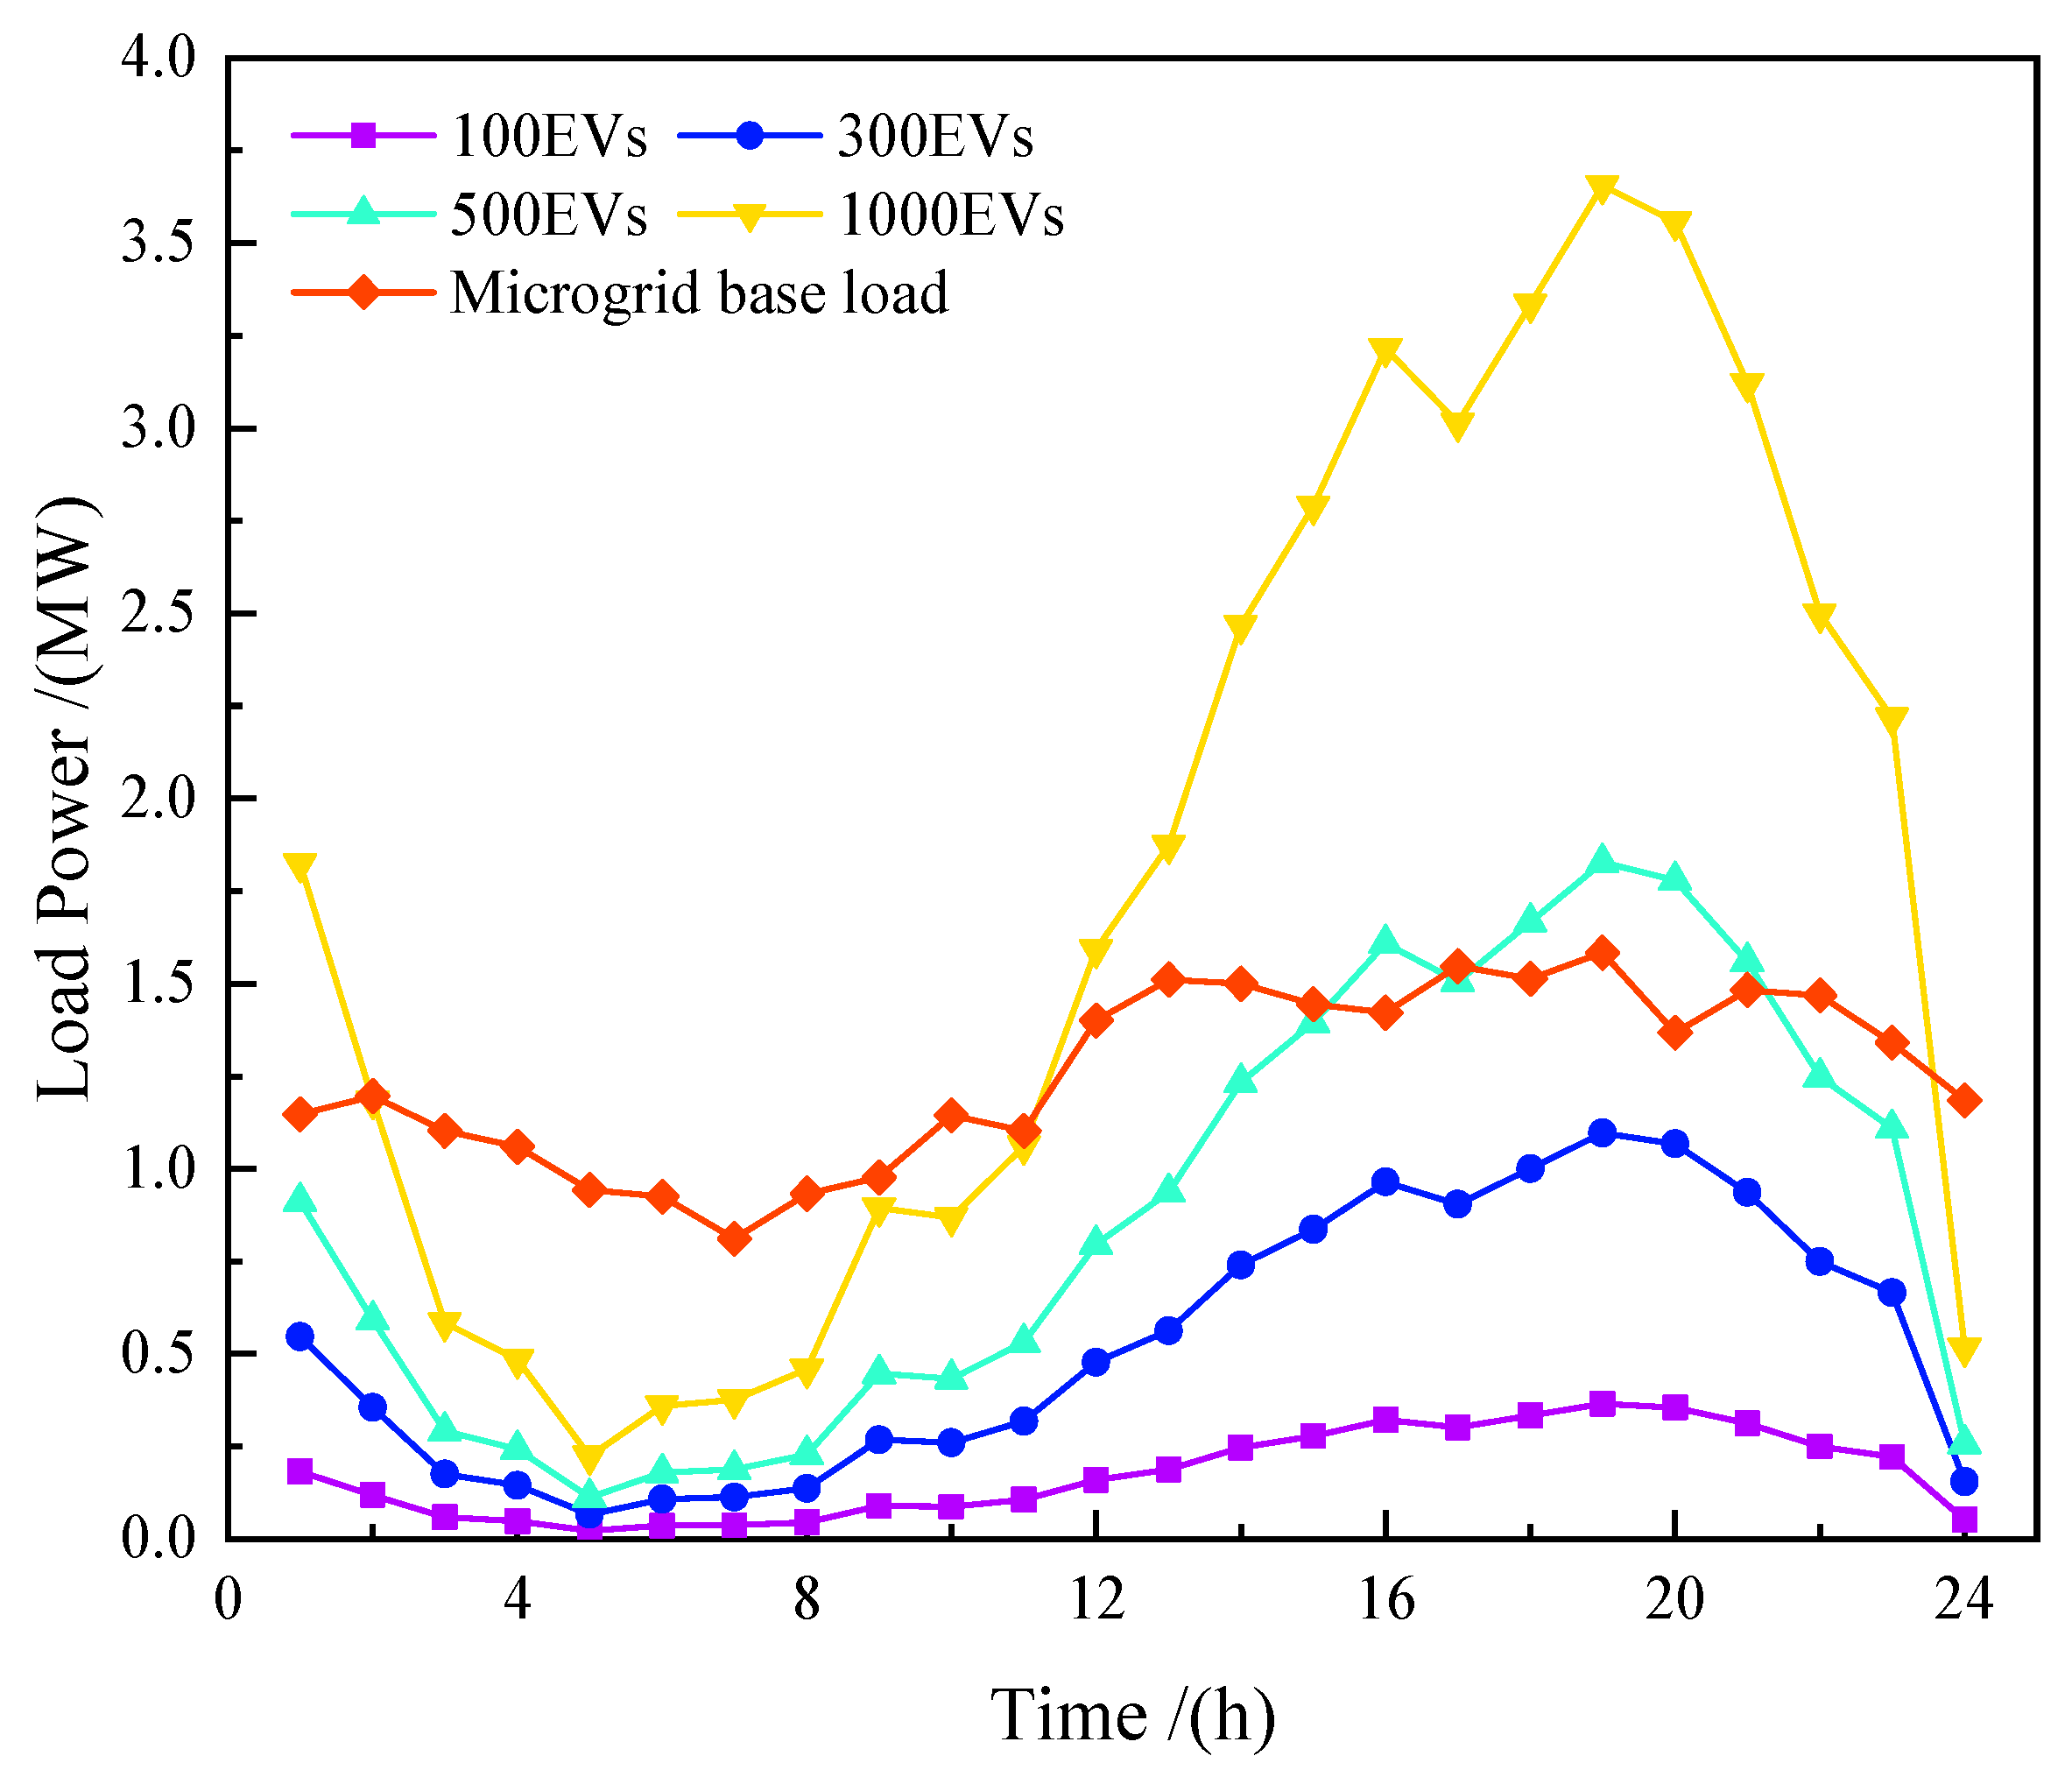
5.2.2. Analysis of the Optimization Effect of EV Number Changes

In the above experiments, we analyzed the peak–valley difference and the total charging cost before and after electricity price guidance with a certain number of EVs. In order to further analyze the optimization effect of the electricity price guidance strategy under the condition of an increasing number of EVs, the access scale of EVs was gradually increased from 100 to 300, and from 500 to 1000. The effect of electricity price guidance for different numbers of EVs is shown in Table 3, Table 4 and Table 5. It can be seen that whether the number of EVs is 300, 500, or 1000, the peak–valley difference ratio and the total EV charging cost can be effectively reduced through electricity price guidance.

5.3. Analysis of the Influence of EV Orderly Charging on Reliability

5.3.1. Reliability Analysis for a Certain Number of EVs

The reliability level of a microgrid can be evaluated using reliability indicators. With the rapid development of microgrid technology, a large number of reliability indicators have been proposed to comprehensively evaluate the reliability of a microgrid. The reliability indicators proposed in this paper include the loss of load probability (LOLP), customer average interruption duration index (CAIDI), system average interruption frequency index (SAIFI), system average interruption duration index (SAIDI), and average service availability index (ASAI) [30,34,35,36]. Among them, the LOLP refers to the probability that the system cannot meet the load demand within a specified time period. CAIDI refers to the duration in average hours of customer outage. SAIDI refers to the average power outage hours of the system within the total simulation time. SAIFI refers to the average outages of the system within a specified length of time. ASAI can represent the probability that the system does not have a power outage within the total simulation time. These reliability indicators can not only describe the demand for the power supply reliability from microgrid load users and for the operating status of the system under grid-connected or off-grid conditions, but also better reflect the reliability level of the system from the perspective of probability, frequency, and time. Therefore, they have been widely used in power system reliability evaluation. Table 6 shows reliability indicators before and after electricity price guidance with 100 EVs.
It can be seen from Table 6, compared with disorderly charging, that LOLP, CAIDI, SAIFI, and SAIDI all decrease to varying degrees when EVs are charged in an orderly manner. Among them, the LOLP decreased from 0.017% to 0.005%, CAIDI decreased from 5.00 h/customer·interruption to 2.00 h/customer·interruption, SAIFI decreased from 1.23 interruption/customer·yr to 1.16 interruption/customer·yr, and SAIDI decreased from 2.57 h/customer·yr to 1.66 h/customer·yr. Meanwhile, the ASAI increased from 99.97% to 99.98%. The above data indicate that the reliability of the microgrid can be improved through electricity price guidance.

5.3.2. Reliability Analysis for EV Number Changes

Still taking the reliability index ASAI as an example for analysis, when the number of EVs accessed increases from 0 to 1000, the results of the ASAI with and without electricity price guidance are shown in Figure 6.
It can be seen that the ASAI of a microgrid will decrease with the access of EVs. The reason is that as the number of EVs increases, the total load level of the microgrid continues to increase, and in a microgrid system, the load size has an essential impact on the reliability level of the system. However, when orderly charging is selected, the ASAI reducing rate is slower than that of disorderly charging, and the microgrid shows higher reliability than that of disorderly charging. When the ASAI required by the microgrid is not less than 99.5%, the approximate number of EVs that can be connected in the case of disorderly charging is 590. However, if orderly charging is chosen, the number of EVs can be increased to approximately 770. It can be seen that at the same reliability level, orderly charging can improve the acceptance of EVs to connect to the microgrid, which undoubtedly provides an effective way for large-scale EVs to connect to the grid.

6. Conclusions

In this paper, a characteristic model of the EV charging load was established, including the charging start time, charging end time, charging duration, and daily mileage. Then, on the foundation of ensuring the optimal reliability level of the microgrid, we developed an orderly EV charging strategy with the following objectives: minimizing the peak–valley difference ratio and total charging costs for EVs users. This strategy incorporates constraints such as power balance, ESS charging and discharging, and EV SOC limits. Finally, the effects of disorderly charging and orderly charging before and after electricity price guidance on the peak–valley load difference ratio, total EV charging cost, and microgrid reliability are evaluated using the EGA. The research results show that the large-scale access of EVs has a great impact on the reliability of the microgrid, and that microgrid reliability will decrease with the access of EVs. Compared with disorderly charging, the orderly charging strategy proposed in this paper can not only effectively reduce the peak-to-valley difference ratio of microgrid load to user charging costs, but also improve the reliability level of the microgrid.
With large-scale EVs connected to the microgrid, the EV access forms are diverse, and the energy use characteristics are different, not only make EV charging characteristics diversified in demand but also diversified in supply characteristics. Factors such as the security of the microgrid, the acceptance level of charging stations, the charging demand of EVs, and the uncertainty of user behavior interact with each other. The frequent interaction between supply and demand and the diversity of the space–time scale make the improvement of the ordering level of EV charging face huge challenges. Therefore, EV orderly charging strategies covering more factors need to be further studied in future work.

Author Contributions

Conceptualization, Z.W., J.Z. and X.S.; methodology, Z.W., J.Z. and X.S.; software, Z.W. and X.S.; validation, Z.W., J.Z., X.S. and L.J.; formal analysis, Z.W., J.Z., X.S. and L.J.; investigation, Z.W., J.Z. and X.S.; resources, Z.W., J.Z. and X.S.; data curation, Z.W.; writing—original draft preparation, Z.W., J.Z., X.S. and L.J.; writing—review and editing, Z.W., J.Z., X.S. and L.J.; visualization, Z.W., J.Z. and X.S.; supervision, Z.W., J.Z., X.S. and L.J.; project administration, J.Z.; funding acquisition, J.Z. All authors have read and agreed to the published version of the manuscript.

Funding

This paper was supported by the National Key R&D Program of China (No. 2021YFE0103800) and Beijing High Level Innovation Team Construction Plan (No. IDHT20180502).

Data Availability Statement

Data are contained within the article.

Conflicts of Interest

The authors declare no conflict of interest.

Appendix A

Table A1. Load data of RBTS Bus6 F4 system.
Load Point NumberPeak Load/MWAverage Load/MW
1, 60.29640.1659
20.32290.1808
3, 13, 170.65170.2501
4, 180.68600.2633
50.36980.2070
7, 230.79650.3057
8, 11, 14, 190.27760.1554
9, 210.73750.2831
10, 12, 16, 220.28310.1585
15, 200.50250.1929
Table A2. Daily load variation parameter.
HourPercentagesHourPercentages
0:000.740712:000.9133
1:000.692313:000.9531
2:000.652714:000.9392
3:000.621215:000.9489
4:000.584516:000.9758
5:000.597217:000.9893
6:000.607918:001
7:000.622719:000.9921
8:000.641020:000.9554
9:000.693921:000.9104
10:000.749822:000.8467
11:000.862123:000.8154
Table A3. Monthly load variation parameter.
MonthsPercentagesMonthsPercentages
10.595970.9422
20.497381
30.435690.9695
40.4343100.8081
50.5136110.5305
60.7530120.4861

References

  1. Sun, Y.Y.; Zhao, P.F.; Wang, L.W.; Malik, S.M. Spatial and temporal modelling of coupled power and transportation systems: A comprehensive review. Energy Convers. Econ. 2021, 2, 55–66. [Google Scholar] [CrossRef]
  2. International Energy Agency: Global EV Outlook 2023. Available online: https://iea.blob.core.windows.net/assets/dacf14d2-eabc-498a-8263-9f97fd5dc327/GEVO2023.pdf (accessed on 20 November 2023).
  3. BloombergNEF Electric Vehicle Outlook 2023. Available online: https://about.bnef.com/electric-vehicle-outlook/ (accessed on 20 November 2023).
  4. Mei, Y.; Li, B.; Wang, H.L.; Wang, X.L.; Michael, N. Multi-objective optimal scheduling of microgrid with electric vehicles. Energy Rep. 2022, 8, 4512–4524. [Google Scholar] [CrossRef]
  5. Zhou, J.H.; Weng, Z.P.; Song, X.T. Capacity configuration method of islanded microgrid with photovoltaic and energy storage system considering reliability and economy. Autom. Electr. Power Syst. 2021, 8, 166–174. [Google Scholar]
  6. Jiang, H.Y.; Ning, S.Y.; Ge, Q.B. Multi-objective optimal dispatching of microgrid with large-scale electric vehicles. IEEE Access 2019, 7, 145880–145888. [Google Scholar] [CrossRef]
  7. Zhang, Z.Y.; Lv, L.J. Status and development of research on orderly charging and discharging of electric vehicles. Electronics 2023, 9, 2041. [Google Scholar] [CrossRef]
  8. Khalid, M.R.; Alam, M.S.A.; Jamil Asghar, M.S. A comprehensive review on electric vehicles charging infrastructures and their impacts on power-quality of the utility grid. eTransportation 2019, 1, 100006. [Google Scholar] [CrossRef]
  9. Du, W.Y.; Ma, J.; Yin, W.J. Orderly charging strategy of electric vehicle based on improved PSO algorithm. Energy 2023, 271, 127088. [Google Scholar] [CrossRef]
  10. Crozier, C.; Morstyn, T.; McCulloch, M. The opportunity for smart charging to mitigate the impact of electric vehicles on transmission and distribution systems. Appl. Energy 2020, 268, 114973. [Google Scholar] [CrossRef]
  11. Li, H.J.; Lv, J.Q.; Chen, W.; Zeng, X.Q. Orderly charging model of private electric vehicle based on double sequence valley period. In Proceedings of the 2018 China International Conference on Electricity Distribution, Tianjin, China, 17–19 September 2018; pp. 2961–2965. [Google Scholar]
  12. Zuo, Q.; He, H.L.; Liang, C.H.; Zhou, M.; Zhou, Q.Y. Quantitative evaluation method of system acceptance capacity of electric vehicles in ordered charging mode. Proc. CSU-EPSA 2017, 6, 1–6. [Google Scholar]
  13. Li, L.; Li, X.H.; Liu, W.D.; Zhao, X.; Xie, Q.; Ge, L.J. An impact analysis of large-scale electric vehicle charging on reliability of small-regional distribution network. J. Henan Polytech. Univ. (Nat. Sci.) 2019, 5, 105–111. [Google Scholar]
  14. Wang, L.; Wan, Y.H.; Cao, W.T.; Cao, Y.H. Multi-objective orderly charging strategy for electric vehicles based on interactive network model. IEEJ Trans. Electr. Electron. Eng. 2021, 4, 519–525. [Google Scholar] [CrossRef]
  15. Tao, Y.; Huang, M.H.; Chen, Y.P.; Yang, L.S. Orderly charging strategy of battery electric vehicle driven by real-world driving data. Energy 2020, 193, 116806. [Google Scholar] [CrossRef]
  16. Goh, H.H.; Zong, L.; Zhang, D.D.; Wei, D.; Lim, C.S.; Kurniawan, T.A.; Goh, K.C. Orderly charging strategy based on optimal time of use price demand response of electric vehicles in distribution network. Energies 2022, 5, 1869. [Google Scholar] [CrossRef]
  17. Yang, A.; Wang, H.L.; Li, B.; Tan, Z.K. Capacity optimization of hybrid energy storage system for microgrid based on electric vehicles’ orderly charging/discharging strategy. J. Clean. Prod. 2023, 411, 137346. [Google Scholar] [CrossRef]
  18. Liu, L.P.; Yang, X.P.; Li, Y.L.; Zeng, Q.B. TOU price model of reliability optimization considering electricvehicles accessing. Guangdong Electr. Power 2017, 5, 56–62. [Google Scholar]
  19. Wu, S.C.; Pang, A.P. Optimal scheduling strategy for orderly charging and discharging of electric vehicles based on spatio-temporal characteristics. J. Clean. Prod. 2023, 392, 136318. [Google Scholar] [CrossRef]
  20. Gou, J.W.; Lin, C.S.; Li, J.; Geng, B.; Li, Z.; Cao, Y.; Li, Y.; Bao, Y.Q. Charging strategy for electric vehicles considering consumer psychology and trip chain. Front. Energy Res. 2021, 9, 723370. [Google Scholar] [CrossRef]
  21. Zhang, X.Z.; Wang, Z.Y.; Lu, Z.Y. Multi-objective load dispatch for microgrid with elec-tric vehicles using modifed gravitational search and particle swarm optimization al-gorithm. Appl. Energy 2022, 306, 118018. [Google Scholar] [CrossRef]
  22. Zhou, K.L.; Cheng, L.X.; Wen, L.L.; Lu, X.H.; Ding, T. A coordinated charging scheduling method for electric vehicles considering different charging demands. Energy 2020, 213, 118882. [Google Scholar] [CrossRef]
  23. Song, X.T.; Lv, Q.N.; Sun, Y.; Liu, X.B. Interactive strategy of electric vehicles and inte-grated energy system based on electricity price guidance. High Volt. Eng. 2021, 47, 3744–3756. [Google Scholar]
  24. Ruiz-Rodríguez, F.J.; Hernández, J.C.; Jurado, F. Probabilistic load-flow analysis of bio-mass-fuelled gas engines with electrical vehicles in distribution systems. Energies 2017, 10, 1536. [Google Scholar] [CrossRef]
  25. The People’s Government of Beijing Municipality: It’s a Record High! A Total of 3.128 Million New Energy Vehicles Were Registered in the First Half of the Year. Available online: https://www.beijing.gov.cn/ywdt/zybwdt/202307/t20230709_3158372.html (accessed on 20 November 2023).
  26. Wang, K.; Wang, H.; Yang, J.; Feng, J.; Li, Y.; Zhang, S.; Onyeka, O.M. Electric vehicle clusters scheduling strategy considering real-time electricity prices based on deep reinforcement learning. Energy Rep. 2022, 8, 695–703. [Google Scholar] [CrossRef]
  27. Vuelvas, J.; Ruiz, F.; Gruosso, G. A time-of-use pricing strategy for managing electric vehicle clusters. Sustain. Energy Grids Netw. 2021, 25, 100411. [Google Scholar] [CrossRef]
  28. Xing, Q.; Cheng, M.; Liu, S.; Xiang, Q.; Xie, H.; Chen, T. Multi objective optimization and dispatch of distributed energy resources for renewable power utilization considering time-of-use tariff. Front. Energy Res. 2021, 9, 68. [Google Scholar] [CrossRef]
  29. Hou, S.; Jiang, C.; Yang, Y.; Xiao, W. Electric vehicle charging scheduling strategy based on genetic algorithm. J. Phys. Conf. Ser. 2020, 1693, 012104. [Google Scholar] [CrossRef]
  30. Weng, Z.P.; Zhou, J.H.; Zhan, Z.D. Reliability evaluation of standalone microgrid based on sequential Monte Carlo simulation method. Energies 2022, 15, 6706. [Google Scholar] [CrossRef]
  31. Heinisch, V.; Göransson, L.; Erlandsson, R.; Hodel, H.; Johnsson, F.; Odenberger, M. Smart electric vehicle charging strategies for sectoral coupling in a city energy system. Appl. Energy 2021, 288, 116640. [Google Scholar] [CrossRef]
  32. Sun, Q.; Xu, S.; Zhu, S. Distribution network planning considering DG timing characteristics and EV spatiotemporal characteristics. Electr. Power Autom. Equip. 2020, 40, 30–38. [Google Scholar]
  33. Wang, H.; Li, X.Y.; Wang, B.Q.; Wang, Y.F.; Fang, H.; Jin, Z.R. Reliability evaluation of distribution network with distributed generation and electric vehicle. J. Chongqing Univ. 2022, in press.
  34. Zhang, D.; Kang, Y.X.; Ji, L.; Shi, R.F.; Jia, L.M. Coevolution and evaluation of electric vehicles and power grids based on complex networks. Sustainability 2022, 14, 7052. [Google Scholar] [CrossRef]
  35. Fu, Q.; Montoya, F.L.; Solanki, A.; Nasiri, A.; Bhavaraju, V.; Abdallah, T.; Yu, D.C. Microgrid generation capacity design with renewables and energy storage addressing power quality and surety. IEEE Trans. Smart Grid 2012, 3, 2019–2027. [Google Scholar] [CrossRef]
  36. Wang, C.S.; Zhang, T.Y.; Luo, F.Z.; Li, F.X.; Liu, Y.Z. Impacts of cyber system on microgrid operational reliability. IEEE Trans. Smart Grid 2019, 10, 105–115. [Google Scholar] [CrossRef]
Figure 1. Time-of-Use (TOU) pricing and TOU periods at the Shijingshan charging stations.
Electronics 12 04876 g001
Figure 2. Flow chart of elite genetic algorithm (EGA).
Electronics 12 04876 g002
Figure 3. The microgrid system with a microturbine (MT), wind turbine generator (WTG), photovoltaics (PVs), electric vehicles (EVs), an energy storage system (ESS), and loads.
Electronics 12 04876 g003
Figure 4. Microgrid base load curve and load curve of different numbers of EVs in one day.
Electronics 12 04876 g004
Figure 5. Total load curve of disorderly charging and orderly charging.
Electronics 12 04876 g005
Figure 6. Comparison of average service availability index (ASAI) before and after electricity price guidance.
Electronics 12 04876 g006
Table 1. Basic parameters of EV model [21,22,23].
ParametersNumerical ValueParametersNumerical ValueParametersNumerical Value
Battery
capacity
60 kWhFast charging power20 kWStandard deviation of leave home, σ d 3.24 h
100 km of electricity consumption13 kWhExpect to arrive home, μ i 17.6 hDaily mileage expectations, μ D 3.2 km
Driving range480 kmStandard deviation of arrive home, σ i 3.4 hStandard deviation of daily mileage, σ D 0.88 km
Conventional charging power7 kWExpect to leave home, μ d 8 h//
Table 2. Comparison of optimization results before and after electricity price guidance with 100 EVs.
ModePeak Load/MWValley Load/MWPeak–Valley Difference/MWPeak–
Valley Difference Ratio/%
Total EV Charging Costs/CNY
Before
Guidance
1.900.861.0354.636562.54
After
Guidance
1.710.990.7241.925525.76
Table 3. Comparison of optimization results before and after electricity price guidance with 300 EVs.
ModePeak Load/MWValley Load/MWPeak–Valley Difference/MWPeak–Valley Difference Ratio/%Total EV Charging Costs/CNY
Before
Guidance
2.590.961.6362.9419,687.63
After
Guidance
2.281.101.1851.7214,893.20
Table 4. Comparison of optimization results before and after electricity price guidance with 500 EVs.
ModePeak Load/MWValley Load/MWPeak–Valley Difference/MWPeak–Valley Difference Ratio/%Total EV Charging Costs/CNY
Before
Guidance
3.291.062.2367.7632,812.71
After
Guidance
2.891.101.7861.7924,232.05
Table 5. Comparison of optimization results before and after electricity price guidance with 1000 EVs.
ModePeak Load/MWValley Load/MWPeak–Valley Difference/MWPeak–Valley Difference Ratio/%Total EV Charging Costs/CNY
Before
Guidance
5.041.253.7975.1762,625.43
After
Guidance
3.841.102.7471.3239,421.48
Table 6. Comparison of reliability indicators before and after electricity price guidance with 100 EVs.
ModeLOLP
/(%)
CAIDI/(h/
Customer
Interruption)
SAIFI/
(Interruption/
Customer·yr)
SAIDI
/(h/Customer·yr)
ASAI
/(%)
Before
Guidance
0.0175.001.232.5799.97
After
Guidance
0.0052.001.161.6699.98
Disclaimer/Publisher’s Note: The statements, opinions and data contained in all publications are solely those of the individual author(s) and contributor(s) and not of MDPI and/or the editor(s). MDPI and/or the editor(s) disclaim responsibility for any injury to people or property resulting from any ideas, methods, instructions or products referred to in the content.

