Abstract
Crown segmentation is a pivotal process in the acquisition of tree parameters. In light of the high expenses associated with satellite remote sensing and LiDAR technologies, our study leverages the cost-effective and efficient UAV remote sensing technology for capturing crown images. In addition, considering the expense and sensitivity associated with labeling data for supervised learning and its implications on model generalization and label quality, this paper introduces an innovative unsupervised learning framework based on convolutional neural networks (CNN). To address the limited receptive field of CNN, we have introduced a novel hybrid attention module following each CNN module. This enhancement ensures the integrity of the segmentation results and the coherence of the boundaries. Furthermore, in response to the growing need for user interaction, we have incorporated a scribble interaction function. Through the semantic segmentation of the collected crown images, our proposed method attains remarkable results, achieving an accuracy of 98.15%, an F1_score of 97.01%, and an mIoU of 95.58%. Additionally, we have conducted a comparative analysis of our proposed method with two clustering algorithms, namely K-Means and GMM, and two CNN models, DeepLab and U-Net. The results reveal that our segmentation structures outperform other methods significantly. The experimental findings demonstrate the immense application potential of this method in diverse fields, including forestry management, environmental protection, and ecosystem monitoring.
1. Introduction
Information about tree parameters, such as tree height, diameter at breast height (DBH), crown width, and health status [1], plays a crucial role in forest resource surveys. These parameters serve as key indicators for evaluating the overall health and diversity of forest ecosystems. Accurate measurement and analysis of these parameters provide a more comprehensive understanding of forest growth conditions, biodiversity, and the ability of forest ecosystems to adapt to environmental changes. Of particular significance is the acquisition of crown parameters, which is essential for accurately assessing tree growth conditions, predicting forest productivity, and determining health status. The segmentation of crown images is a vital step in obtaining crown parameters, which include details related to the tree canopy, such as crown area and crown height. Researchers commonly employ crown image segmentation techniques to differentiate the crown from the background in images.
Traditionally, advanced technologies like satellites [2] and LiDAR [3] are utilized for capturing tree canopy images. However, these methods often entail high costs and challenging acquisition processes. Satellite imagery requires high-resolution sensors and equipment and is susceptible to cloud cover and obstructions [4]. LiDAR, on the other hand, necessitates specialized equipment and complex aerial laser scanning operations, making it expensive and intricate to operate [5]. Unmanned Aerial Vehicles (UAV) [6] provide a compelling alternative, offering advantages such as low flight altitudes, operational flexibility, and cost-effectiveness. UAVs can capture image data with centimeter-level accuracy, serving as a reliable data source for canopy parameter research. In a study by [7], the application of forest RGB images captured by UAV was investigated for addressing various forestry issues, including individual tree detection, tree species classification, and forest anomaly detection.
For vegetation segmentation tasks, researchers have proposed various methods, primarily color index-based segmentation [8], threshold-based segmentation [9], and learning-based segmentation [10]. The color index-based segmentation method distinguishes vegetated from non-vegetated areas based on vegetation’s spectral characteristics. Han et al. [11] examined the use of NDVI-based indices to describe spatial patterns in vegetative landscapes and applied them to rule sets to enhance the accuracy of object-oriented classification. Jothiaruna et al. [12] introduced a method that uses advanced composite color features (ACCF) and region-growing techniques to segment diseased leaf spots captured under real field conditions. Threshold-based segmentation categorizes pixels into vegetative and non-vegetative classes by setting a threshold. Huang and colleagues [5] achieved single tree crown segmentation and extracted structural parameters like tree count, tree height, and crown projected area using a marker-controlled watershed segmentation algorithm. Jing and others [13] proposed a new method based on multi-scale filtering to address over-segmentation issues in the watershed segmentation algorithm. Although these methods have matured, they still encounter challenges when dealing with complex vegetation types and intricate background conditions, often necessitating extensive refinement or simplification.
Deep learning (DL) is a technology that addresses the shortcomings of both color index-based segmentation and threshold-based segmentation [14]. Deep learning methods can be categorized into supervised and unsupervised learning [15]. In supervised learning, a vegetation segmentation model is trained by learning feature representations and segmentation patterns from a large amount of labeled training data. For instance, Chen et al. [16] proposed a citrus tree segmentation method based on monocular machine vision technology and the support vector machine (SVM) algorithm, achieving precise segmentation of citrus trees under various weed cover and brightness conditions. Martins et al. [17] investigated the performance of deep learning methods in urban tree segmentation tasks. They evaluated five state-of-the-art architectures, namely the fully convolutional network, U-Net, SegNet, dynamic dilated convolution network, and DeepLabV3+, demonstrating their effectiveness. Guérin and others [18] used the Swin Transformer to perform semantic segmentation on the IGN public dataset, dividing satellite images into six categories: sparse forest, dense forest, moor, herbaceous formation, building, and road. In comparison to unsupervised learning, supervised learning incurs high data labeling costs, has weaker model generalization capabilities, and is sensitive to label quality. Given these challenges, an increasing number of researchers are exploring unsupervised learning methods to tackle vegetation segmentation tasks. For example, Lu et al. [10] introduced an unsupervised fruit tree image segmentation algorithm based on the ensemble OCC-K (Optimal Color Channel-K-means). Moreover, to mitigate the impact of tree crown shadows, they utilized a shadow region luminance compensation method (SRLCM) for image preprocessing. Wang et al. [19] proposed an unsupervised pipeline based on the superpixel graph structure, which can simultaneously perform the two tasks of single tree isolation and leaf segmentation.
The segmentation of canopy images continues to encounter substantial challenges. Notably, the intricacy of existing models imposes high hardware requirements, and the segmentation of tree crowns against complex backgrounds often results in ambiguous boundaries. Furthermore, the insufficient addressing of user interaction needs exacerbates these challenges. In light of these issues, this work makes the following contributions:
- This paper introduces a lightweight unsupervised learning framework based on a convolutional neural network (CNN), wherein unsupervised learning is accomplished through backpropagation [20]. The incorporation of unsupervised learning in our proposed method has led to considerable savings in terms of labor costs. Additionally, the introduced network is lightweight, comprising approximately 105K parameters. This substantial reduction in parameter count, compared to many deep learning networks, not only mitigates computational burdens but also enhances the efficiency of image processing.
- CNNs, owing to their limited receptive fields, often lack the capacity for a global understanding of contextual information. However, for image segmentation tasks, accurately comprehending the entire semantic structure of an image is crucial [21]. To address this, this paper proposes the integration of a hybrid attention module (HAM) after each CNN module. The HAM directs the network to focus more on the representation of the tree crown, thereby improving its ability to capture target boundaries and local details effectively [22].
- To tackle the issue of unclear segmentation boundaries in tree crown segmentation, a spatial continuity loss function is introduced. This innovative approach significantly mitigates the limitations associated with traditional fixed segmentation boundaries. By employing the spatial continuity loss function, the model can more accurately capture the details and variations in tree crown boundaries, providing more precise and continuous results for the segmentation task.
- In response to user interaction needs, a scribble module [23] is introduced. Specifically, both the colored RGB image and its corresponding simple scribble are input into the network to obtain superior segmentation results. The innovative inclusion of the scribble module allows users to actively participate in the segmentation process, thereby enhancing the quality of segmentation results and overall user experience.
The structure of the paper is as follows: Section 2 offers a detailed overview of the entire network architecture, encompassing the convolutional neural network module, hybrid attention module, loss functions, and scribble interaction. It further elaborates on how the network accomplishes unsupervised learning through backpropagation. Section 3 introduces the dataset used in this study and describes the experimental environment configuration. Section 4 presents the experimental results, including evaluation metrics, ablation studies, and comparisons with other segmentation methods. Section 5 discusses the conclusions and outlines directions for future research.
2. Methods
2.1. Overview
This section delineates the comprehensive structure of the proposed semantic segmentation framework, which is an unsupervised learning network founded on convolutional neural networks and hybrid attention mechanisms.
This paper introduces a lightweight network that combines CNN and attention mechanisms for the purpose of segmenting tree crown images captured by UAV, as illustrated in Figure 1. The input image initially undergoes four consecutive convolutional neural network modules and hybrid attention modules. The intermediate output is then passed through a linear classifier to obtain a response map. Subsequently, the map undergoes batch normalization, and the maximum value for each dimension is used as pseudo-labels. The loss function is computed, and to minimize the loss value, parameters are updated through backpropagation. After several forward-backward iterations, the prediction with the smallest loss is obtained. Finally, the image is binarized using a threshold function, which produces the segmentation results.
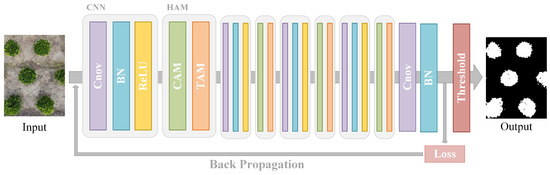
Figure 1.
Overview of the proposed unsupervised semantic segmentation structure.
2.2. Convolutional Neural Network Module
Each CNN module consists of a 2D convolution layer, a batch normalization function, and a ReLU activation function. This module involves two convolutional operations: one employing a kernel with 64 output channels, and another using a kernel with 32 output channels. Considering the reduction ratio of the Channel Attention Module is set to 16, the output channel numbers have been configured to be multiples of 16. This choice also balances the model’s parameter count and accuracy. Within the network architecture, the kernel convolution is applied first, followed by the kernel convolution, and this sequence of operations alternates [24]. The utilization of the kernel convolution serves the purpose of extracting local features from the images. Sliding the convolutional kernel within a smaller receptive field allows us to capture a wealth of local feature information within the images. This meticulous operation enables the detection of subtle textures and local details in the images, thus deepening our understanding of the local structures within them. On the other hand, the kernel convolution (, 32) is primarily designed for channel reduction and feature fusion. By applying a kernel size in the channel dimension, high-dimensional features are mapped to a lower-dimensional space. The primary objective is to reduce computational demands and model parameters while preserving essential feature information. This process not only simplifies the model but also improves computational efficiency. Additionally, it enhances our ability to capture relationships between different features, leading to a more comprehensive understanding of the overall image structure.
2.3. Hybrid Attention Module
This paper suggests the incorporation of a hybrid attention module following each CNN module. This guides the network to allocate more attention to the feature representation of the tree canopy, enabling a better capture of crucial information such as target boundaries and local details. With the inclusion of the hybrid attention mechanism, the model can more effectively focus on pertinent features, thereby enhancing its ability to discern tree canopy targets and gain a deeper understanding of the intricate tree canopy structure and other critical information. The hybrid attention module plays a pivotal role in augmenting the network’s feature learning capabilities, enabling the network to more effectively capture intricate spatial and contextual details within the target area.
The hybrid attention module comprises the channel attention module and the triplet attention module.
2.3.1. Channel Attention Module
In the pursuit of enhancing feature representation and optimizing information flow within neural networks, the channel attention module (CAM) assumes a pivotal role. This section delves into the intricacies of CAM, a mechanism meticulously designed to dynamically recalibrate channel-wise feature responses, accentuating the importance of specific channels in the intricate process of feature extraction.
As shown in Figure 2, represents the feature map outputted from the CNN module. In it, C and , respectively, represent the channel and size of the feature map. The feature map F is input into the channel attention mechanism. In order to aggregate spatial information, global average pooling and global max pooling are performed along the spatial direction, resulting in and . The average pooling operation preserves overall feature information for each channel, whereas the max pooling operation efficiently extracts the most prominent feature from each channel. Subsequently, the feature maps obtained from global average pooling and global max pooling are fed into a shared fully connected module. In this module, the channel count is first reduced to 1/r of the original count and then expanded back to its original size. Here, ’r’ represents the reduction ratio. According to reference [25], for a balance between accuracy and complexity, setting ’r’ to 16 is considered the most appropriate choice. After passing through the shared module, the output feature maps are combined using element-wise summation. After applying the sigmoid activation function to it, it is then element-wise multiplied with the input feature map F, ultimately producing the output feature map from the channel attention mechanism.
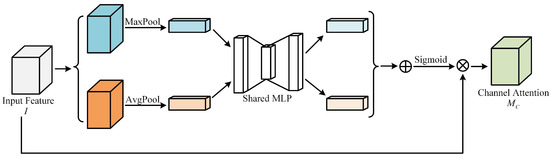
Figure 2.
Overview of channel attention module.
Given the information provided, the formula for the channel attention mechanism can be summarized as:
where represents the sigmoid function, , . It is important to note that a ReLU activation function should be added after .
2.3.2. Triplet Attention Module
This section unveils the intricacies of TAM, a specialized mechanism crafted to leverage the interplay between three distinct attention components, thereby enhancing the model’s capacity to capture nuanced relationships within the data.
Due to the global pooling operation in the channel attention mechanism, there is a loss of positional information in the image. To address this, CBAM [26] introduced a spatial attention mechanism as a complementary module. However, in the CBAM computation module, the channel attention mechanism and the spatial attention mechanism are independent and calculated separately. While the channel attention mechanism primarily focuses on the importance of feature channels, the spatial attention mechanism is concerned with the importance of different spatial positions in the feature map. This independent computation method results in a lack of interdependence between the channel and spatial dimensions.
To overcome this issue and draw inspiration from the structure of the spatial attention mechanism, this paper introduces a triplet attention module. In this approach, we incorporate cross-dimensional interactions into three branches, which, respectively, capture the interdependencies between the , , and dimensions of the input features. By enabling interaction across different dimensions, we achieve information transmission and fusion across channels and spatial extents. This triplet attention module allows features from different dimensions to influence each other, thereby better capturing the intricate relationships and characteristics of the input features.
, , and represent pooling layers in the channel, height, and width dimensions, respectively. The design of these layers allows for a reduction in depth while preserving the rich feature expression of the actual tensor, thereby reducing computational complexity. Taking as an example, this pooling layer performs both max pooling and average pooling on the input tensor along the channel dimension and then concatenates them to form a tensor with a channel size of 2. The computation formula can be expressed as:
where, for the input feature map , after the pooling layer operation, is obtained.
As shown in Figure 3, the triplet attention module consists of three branches. In the first branch, we reduce the channel number of the input feature to 2 using the layer. Then, we process the pooled features through an convolutional layer and batch normalization to further extract information from the features. Next, we generate attention weights of shape through the sigmoid activation function. These weights represent the importance of the input features in both the height and width dimensions. Finally, we allocate these weights to the original input feature tensor. This branch represents the spatial attention mechanism.
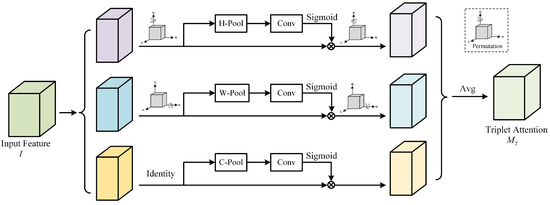
Figure 3.
Overview of triplet attention module.
In the second branch, the input feature map first undergoes the permute function, transforming the input feature map from to . It then passes through the layer, which interacts and fuses information across the height and width dimensions of the input feature. Subsequent operations include convolution, batch normalization, and activation, resulting in an intermediate feature map with the allocated weights. Finally, it goes through the permute function again to return the shape to its initial state, obtaining the feature map for the height dimension .
In the third branch, a permutation is also conducted initially, changing the input feature map from to . It then proceeds through the layer, convolutional layer, batch normalization, activation layer, and weight allocation. Finally, it undergoes the permute transformation again to obtain the feature map for the width dimension .
After the calculations in all three branches are completed, the feature maps from the three dimensions are weighted equally to obtain the final output feature map of the triplet attention module. This can be represented by the following formula:
where, , and , respectively, represent , and . , , , and , respectively, represent convolution operation, batch normalization, sigmoid activation function, and permute function. , , and represent the feature maps output from the first, second, and third branches, respectively. represents the feature map output from the entire triplet attention mechanism.
2.4. Loss Function
Assuming an input RGB image , after reading the image, it is normalized to bring the pixel values within the range. First, initialize the CNN module and HAM module . After passing through several convolutional modules and hybrid attention modules, a feature map with p dimensions is obtained. Subsequently, a response map is obtained through a linear classifier, where . The response map is then normalized to obtain . The maximum value in each dimension is taken as the cluster label for each pixel, thus classifying all pixels into q categories. This type of classification is known as argmax classification. The ith group can be represented as:
The loss function consists of two parts, which constrain similarity and spatial continuity, respectively. It can be represented as:
2.4.1. Feature Similarity
The aforementioned will be used as pseudo-labels. The constraint on similarity refers to assigning pixels with similar features to the same label. The cross-entropy loss function computed between and serves as the constraint for similarity. It can be expressed mathematically as:
where
The purpose of this loss function is to enhance the similarity among similar features by minimizing the distance between them. In the process of clustering image pixels, feature vectors are segregated into different clusters. Our objective is to minimize the distance between feature vectors within the same cluster while maximizing the distance between feature vectors in different clusters. By minimizing this loss function, the model’s weights will be updated, allowing feature vectors to cluster more closely together, thus improving their ability to represent similar features and to distinguish different feature groups during the clustering process. This operation enables the model to extract more effective and discriminative clustering features, ultimately leading to better performance and representation in tasks such as image segmentation.
2.4.2. Spatial Continuity
In image segmentation, our objective is for pixel clusters to exhibit similarity not only in terms of features but also in spatial continuity. To achieve this, we introduce a spatial continuity loss function, which ensures that the clustering labels remain as consistent as possible with the labels of adjacent pixels.
Inspired by reference [27], this paper uses the function as the loss function, calculating the horizontal and vertical differences of the response map . The continuity loss function is defined as follows:
where, W and H represent the width and height of the input image, respectively, and denotes the pixel value at location in the response map .
The purpose of this constraint is to ensure that clustered pixels create continuous regions in the image rather than appearing scattered. By enforcing that adjacent pixel labels are identical, we can improve the spatial continuity of image segmentation results. This, in turn, leads to more distinct and coherent boundaries within the image. Such an approach enhances the accuracy and visual aesthetics of image segmentation, rendering the results more natural and logically structured.
2.5. Scribble Interaction
With the growing demand for user interaction, many researchers have turned their attention to methods that incorporate user interaction information in image semantic segmentation tasks [28]. This involves the integration of various types of user input, such as bounding boxes [29], scribbles [30,31], points [32], and other forms of weak labels. In this study, we introduce scribbles as a user input to enhance the network’s performance in completing the segmentation task. However, users have the freedom to decide whether or not to provide scribbles for interaction, as the network should be capable of performing the segmentation task effectively regardless of the presence of scribbles.
When scribbles are provided as input to the network, adjustments need to be made to the loss function, which is defined as follows:
The specific definition of is as follows:
where
where, when the nth pixel is a scribble pixel, equals 1; otherwise, it is 0. represents the scribble label for each pixel. The coefficient associated with was determined through a series of experiments, and a coefficient of yielded the best segmentation results.
Since the scribble labels are applied within the object, they may lead to imprecise segmentation along the object boundaries. effectively mitigates this drawback. Thus, in theory, the loss function we have proposed is highly comprehensive. For a more detailed experimental validation, please refer to Section 4.2.2.
2.6. Back Propagation
In this study, we employ unsupervised learning via backpropagation. When the input image I is fed into the network, a forward propagation process is initially executed. By utilizing parameters initialized with the Xavier initialization method [33], features are progressively extracted, leading to the generation of an initial prediction. Subsequently, the loss function L is computed based on the generated pseudo-labels and predicted labels. This calculated loss is then employed to further update the parameters of the CNN module, HAM module, and the classifier . For this purpose, the Adam optimizer is utilized to facilitate parameter updates. After undergoing the forward-backward process T times, the final prediction value for the clustering label , which minimizes the loss function, is obtained. Algorithm 1 illustrates the workflow of the entire algorithm.
| Algorithm 1 Unsupervised semantic segmentation |
|
3. Datasets and Network Training
3.1. Datasets
In this study, ethical considerations took precedence in our utilization of UAVs for data collection. To protect personal privacy, we are dedicated to minimizing the inclusion of individuals in our imagery. Furthermore, the chosen dataset exclusively comprises images where individuals are absent. Flight plans were meticulously crafted to reduce environmental impact, with special attention to respecting no-fly zones near sensitive habitats. Our commitment to transparency involves sharing methodologies and addressing any ethical concerns that may arise during the study and subsequent publications.
The dataset utilized in this study was collected at the Xiaxi Flower and Plant Cultivation Base, situated in the Wujin District of Changzhou City, Jiangsu Province, China (119°46′34 E and 31°4257 N). This region falls under the subtropical monsoon climate category. Owing to the seasonal variations and the distribution of precipitation, such climatic zones typically showcase a high degree of vegetation diversity. This diversity in vegetation resources provided an ample pool of samples for our research. Figure 4 illustrates the precise location and the geographical characteristics of the study area.
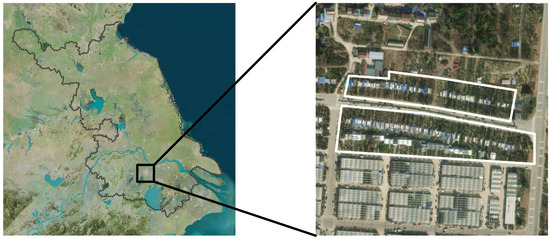
Figure 4.
Location and geographical environment of our experiment area.
The dataset for this study was obtained using a DJI Mavic Air 2 drone, which is manufactured by DJI in Shenzhen, China. The capture altitude ranged from 10 to 15 m, and the shooting angle was set at 90 degrees from a top-down perspective. Detailed parameters of the UAV and its camera can be located in Table 1.

Table 1.
Parameters of UAV and its camera.
The dataset comprises 300 images, with a primary focus on four distinct tree species: Hybrida Vicary Privet, Syzygium buxifolium, Podocarpus macrophyllus, and Loropetalum chinense var. Rubrum.
Hybrida Vicary Privet exhibits a canopy diameter spanning from 0.6 to 1.4 m and a height ranging between 0.3 to 0.8 m. It is characterized by its round-shaped canopy. Syzygium buxifolium boasts a canopy diameter ranging from 0.8 to 1.6 m and a height varying from 0.4 to 1 m, with a canopy shape that is round. Podocarpus macrophyllus showcases a canopy diameter that extends from 1.6 to 2.5 m and a height between 3 to 4 m. Its canopy is distinctive for its broad ovate shape. Loropetalum chinense var. Rubrum possesses a canopy diameter that falls within the range of 1.3 to 2.5 m and a height between 2.5 to 3 m, featuring a round-shaped canopy.
3.2. Experimental Settings
In this study, we employed the Adam optimizer to update the parameters of our neural network model. The hyperparameters were configured with their default values, including a learning rate of 0.1. We conducted training for a total of 1000 epochs. The implementation of our neural network was carried out using the PyTorch framework. The computational environment was set up on the Ubuntu 22.04 operating system, utilizing the Python 3.9 programming language. The hardware setup comprised an Intel Core i7-13700KF processor running at 5.4 GHz (with 32 GB of RAM) and an NVIDIA RTX 4080 GPU.
4. Experimental Results
4.1. Evaluation Metrics
To evaluate the segmentation performance of the network, the following five metrics are introduced: precision [34], recall [35], accuracy [36], F1_score [37], and mIoU [38]. The calculations of these five metrics all involve the confusion matrix. For binary classification tasks, the foreground is referred to as Positive, and the background as Negative. Correct predictions are labeled True, and incorrect ones as False. Thus, we have four scenarios: (True Positive), (True Negative), (False Positive), and (False Negative). The computation of the evaluation metrics is as follows:
The larger the values of the above five metrics, the better the segmentation performance of the model.
4.2. Ablation Study
Ablation experiments will be carried out at two levels: one to conduct ablation studies on the network structure, and the other to investigate the loss function.
4.2.1. Architecture Ablation
In this study, the neural network is comprised of two main modules: CNN modules and HAM modules. The HAM module, in turn, encompasses both CAM and TAM components. In this section, we conduct ablation experiments separately for these two attention mechanisms.
Table 2 displays the results of the architecture ablation. Firstly, when we completely remove the hybrid attention module, we observe a decrease in accuracy from 98.15% to 97.75%, a drop in F1_score from 97.01% to 96.61%, and a decrease in mIoU from 95.58% to 94.79%. Notably, there is a significant decline across all these metrics.
Table 2.
Quantitative evaluation of architecture ablation.
Subsequently, we performed experiments to individually assess the roles of CAM and TAM. As seen in the table, adding either CAM or TAM on top of the CNN module leads to performance improvement in both scenarios. However, it is worth noting that all metrics for TAM outperform those for CAM, indicating that TAM plays a more substantial role. This highlights that by capturing dependencies across height, width, and channels, TAM provides a more accurate representation of image features, consequently enhancing the model’s performance.
Furthermore, since TAM requires almost no additional parameters, its computational overhead can be considered negligible. Consequently, TAM demands very little computational time. In comparison to CNN + CAM, which takes 37.75 s, CNN + TAM only requires 28.03 s.
Figure 5 illustrates the segmentation results of ground truth, CNN, CNN + CAM, CNN + TAM, and CNN + HAM, respectively. In the second sample image, our proposed network demonstrates the ability to distinguish between the tree crown and the weeds next to the tree effectively. It accurately separates the tree crown from the surrounding weeds. However, in the fourth sample image, we observed instances where our network struggled to differentiate between the tree crown and flower pots. Nevertheless, when comparing these images, it becomes evident that image segmentation with only CNN results in relatively coarse outcomes. Yet, with the introduction of attention mechanisms, the edge segmentation of the tree crown becomes significantly more precise, capturing gaps and details within the tree crown more effectively. This observation further confirms that incorporating attention mechanisms can substantially enhance the precision and performance of image segmentation.
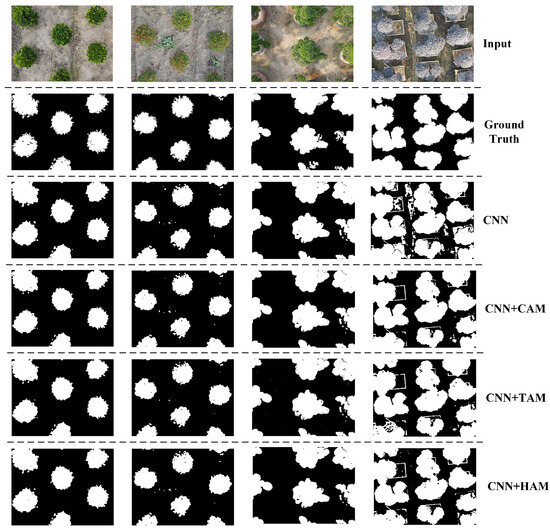
Figure 5.
Visualization of architecture ablation.
In Figure 6a, we present the evolution of loss values during the initial 100 epochs in the architecture ablation process. From the figure, it can be observed that the loss converges very quickly, starting to converge around the 20th epoch and ultimately trending towards 0.
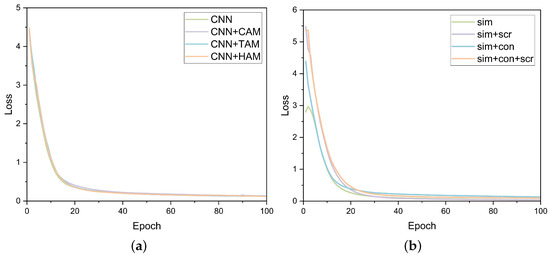
Figure 6.
Loss value: (a) change in loss values during the first 100 epochs in the architecture ablation process; (b) change in loss values during the first 100 epochs in the loss function ablation process.
4.2.2. Loss Function Ablation
The loss function in our model encompasses three key components: feature similarity, spatial continuity, and scribble information. Feature similarity, which is the cross-entropy loss between predicted values and pseudo-labels, serves as the fundamental loss function. In this section, we primarily focus on conducting ablation experiments concerning spatial continuity and scribble information to illustrate the effectiveness of these two components.
Table 3 displays the results of our experiments conducted with different loss function settings. As shown in the table, when using only the basic loss function, the segmentation model achieved an accuracy of 84.92%, an F1_score of 79.87%, and an mIoU value of 73.29%. However, upon introducing the spatial continuity loss function, the accuracy significantly improved to 91.81%, the F1_score increased to 88.62%, and the mIoU value also rose to 85.15%. This outcome underscores the significance of the spatial continuity loss function. It plays a pivotal role in adjusting the labels of neighboring pixels in the segmentation results, ensuring greater consistency among labels in adjacent areas. This constraint effectively maintains the boundary continuity in the image segmentation results, thereby preventing disjointed segmentation lines or edges. This demonstrates the effectiveness of the spatial continuity loss function in enhancing the segmentation model’s performance.
Table 3.
Quantitative evaluation of loss function ablation.
Furthermore, we expanded our approach by incorporating user-provided scribbles as weak labels. This extension resulted in an improvement in the model’s accuracy to 94.58% from the previous value, while the F1_score and mIoU values also increased to 91.83% and 87.92%, respectively. This highlights the substantial positive impact of introducing simple user-provided scribbles into the network as weak labels on the performance of the segmentation task.
Figure 7 illustrates the segmentation results under various conditions, specifically sim, sim+con, sim+scr, and sim+con+scr. Upon observation, it becomes evident that when using sim alone, the segmentation results for the tree crown lack completeness and continuity. The addition of scr leads to a notable improvement in segmenting the tree crown comprehensively, although it tends to misclassify pixels around the tree crown boundary as foreground. However, this issue is substantially mitigated by the introduction of con, where adjacent pixels are assigned to the same label, resulting in a more precise segmentation boundary. Figure 6b depicts the change in loss values during the initial 100 epochs in the loss function ablation process.
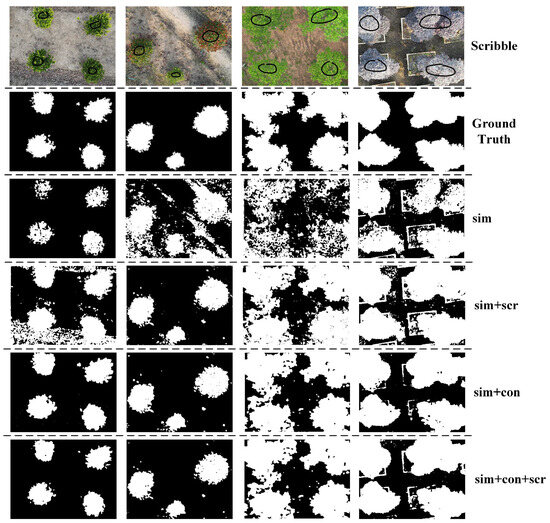
Figure 7.
Visualization of loss function ablation.
4.3. Comparison with State-of-the-Art Segmentation Methods
4.3.1. Clustering Algorithms
Clustering algorithms, as traditional unsupervised learning methods, have found extensive applications in the field of semantic segmentation. These algorithms analyze the similarity and measure the distance between features in images or data, automatically grouping them into distinct clusters or categories. They play a crucial role in semantic segmentation tasks [39]. In this article, we compare the proposed model with two clustering algorithms, K-Means [40] and Gaussian Mixed Model (GMM) [41]. Data from Table 4 reveals that the segmentation results obtained using K-Means and GMM are not particularly satisfactory. When employing the K-Means method, the accuracy, F1_score, and mIoU are 79.32%, 70.76%, and 64.09%, respectively. Using the GMM method, the accuracy, F1_score, and mIoU are 82.91%, 77.92%, and 69.99%, respectively. However, both of these methods significantly underperform when compared to the proposed model.
Table 4.
Quantitative evaluation of comparison experiments.
Upon examining Figure 8, it becomes evident that when using clustering algorithms for segmentation, the results lack coherence and continuity. In the segmentation results of the K-Means clustering, there is an inherent issue where the algorithm may misclassify pixels that belong to the tree canopy as background, and vice versa. This is because clustering algorithms typically process each pixel independently, without leveraging contextual information. As a result, there is a blending of tree canopy and background pixels, making the segmentation boundaries less smooth and coherent. Turning our attention to the results obtained from GMM, it is clear that almost all the pixels belonging to the tree canopy are correctly classified. This makes GMM more accurate than the K-Means algorithm, although the segmentation boundaries still appear somewhat blurred. It is worth noting that GMM requires more computational resources than K-Means, which leads to longer processing times.
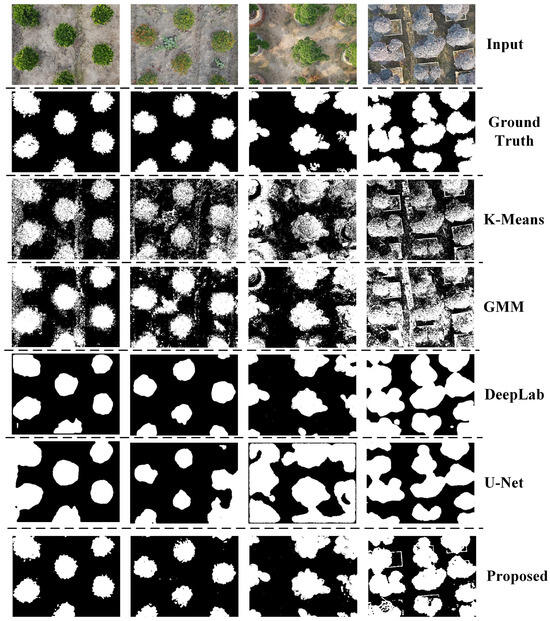
Figure 8.
Visualization of comparison experiments.
4.3.2. CNN Model
In addition to clustering algorithms, this study also compares the proposed method with two state-of-the-art semantic segmentation models: DeepLab [42] and U-Net [43]. Both models segment input images under the same unsupervised learning conditions. Table 4 reveals that the results for DeepLab and U-Net are quite similar. DeepLab achieves an accuracy of 87.51%, an F1 score of 81.49%, and an mIoU of 75.49%, while U-Net attains an accuracy of 86.57%, an F1 score of 80.20%, and an mIoU of 73.87%. Overall, DeepLab slightly outperforms U-Net. However, it is worth noting that DeepLab has a significantly larger number of parameters and requires more time for processing than the other four methods. Even so, when compared to the proposed method, both models exhibit a gap of 10% in accuracy, a gap of 15% in F1_score, and a gap of 20% in mIoU.
Figure 8 illustrates that, in comparison to the two clustering algorithms, the CNN network can effectively distinguish between the tree crown and the background without pixel overlap. U-Net tends to misclassify some pixels around the canopy as part of the tree crown, a problem absent in DeepLab. However, in contrast to the proposed model, both DeepLab and U-Net exhibit imprecise segmentation boundaries. They can merely capture the general shape of the tree crown and fail to define the leaf edges clearly. Moreover, neither DeepLab nor U-Net effectively handles gaps between the leaves, and their ability to capture fine details is limited. On the other hand, thanks to the proposed model’s incorporation of an attention mechanism, it excels in capturing intricate image details.
5. Conclusions
In this research, we present a lightweight neural network that incorporates convolutional neural networks (CNN) and an attention mechanism. Additionally, we introduce a spatial continuity loss function to complement the primary loss function, mitigating the limitations associated with fixed segmentation boundaries. To address the growing demand for user interaction, we have integrated a scribble interaction module. Our experimental results demonstrate that this approach delivers strong performance across various evaluation metrics, rendering it competitive when compared to other segmentation methods. Its key advantages are as follows:
- Leveraging unsupervised learning, it obviates the necessity of manually annotating a substantial volume of images, thereby reducing labor costs.
- By incorporating the hybrid attention module, it adeptly extracts semantic information from images, thus enhancing segmentation accuracy.
- By introducing the spatial continuity loss function and utilizing scribble labels, it effectively resolves issues concerning incomplete segmentation results and imprecise segmentation boundaries.
On one hand, precise semantic segmentation of tree crown images enables us to capture detailed morphology and spatial distribution for each tree. This provides more comprehensive data for computing key parameters such as Leaf Area Index (LAI) and Normalized Difference Vegetation Index (NDVI). This not only facilitates an accurate assessment of vegetation coverage but also offers profound insights into the health, growth trends, and resource management of forest ecosystems. On the other hand, integrating this algorithm into image acquisition sensors presents significant potential advantages. Embedding the algorithm into the sensor system allows for the direct generation of segmented images immediately after capturing RGB images. This streamlines post-processing workflows, enhances real-time performance, and improves operational efficiency.
Given the exceptional performance of our method across diverse metrics, we believe it holds promise for further research and development. In the future, we aim to explore the following directions:
- With the widespread adoption of Transformer models across various domains, including notable success in natural language processing, a growing number of researchers are actively exploring the integration of self-attention mechanisms into computer vision. In this context, our focus lies in a thorough investigation of whether the self-attention mechanism can yield more pronounced performance improvements for the proposed model.
- In practical measurement tasks, not every tree crown necessitates segmentation. To facilitate the selection of specific targets for segmentation by personnel, we plan to introduce alternative forms of weak labels, such as bounding boxes and points. This approach not only addresses interactive demands but also holds the potential to enhance segmentation effectiveness.
- Endeavor to segment tree crowns in more complex scenes and backgrounds to further enhance the model’s generalization capabilities.
Author Contributions
J.L. devised the programs and drafted the initial manuscript. H.Z. helped with data collection and data analysis. H.W. designed the project and revised the manuscript. Y.W. revised the manuscript and provided guidance to the team. All authors have read and agreed to the published version of the manuscript.
Funding
This work was supported in part by the National Science Foundation of China (NSFC) under Grant No. 32171788, No. 31700478; Jiangsu Provincial Government Scholarship for Overseas Studies under Grant JS-2018-043; Qing Lan Project of Jiangsu Colleges; Innovation and Entrepreneurship Training Program for College Students in Jiangsu Province under Grant 202210298043Z.
Data Availability Statement
Data is contained within the article.
Conflicts of Interest
The authors declare no conflict of interest.
References
- Shoda, T.; Imanishi, J.; Shibata, S. Growth characteristics and growth equations of the diameter at breast height using tree ring measurements of street trees in Kyoto City, Japan. Urban For. Urban Green. 2020, 49, 126627. [Google Scholar] [CrossRef]
- Schlerf, M.; Atzberger, C. Vegetation structure retrieval in beech and spruce forests using spectrodirectional satellite data. IEEE J. Sel. Top. Appl. Earth Obs. Remote Sens. 2012, 5, 8–17. [Google Scholar] [CrossRef]
- Whitehurst, A.S.; Swatantran, A.; Blair, J.B.; Hofton, M.A.; Dubayah, R. Characterization of canopy layering in forested ecosystems using full waveform lidar. Remote Sens. 2013, 5, 2014–2036. [Google Scholar] [CrossRef]
- Surya, S.; Rahiman, M.A. Cloud detection from satellite images based on Haar wavelet and clustering. In Proceedings of the 2017 International Conference on Nextgen Electronic Technologies: Silicon to Software (ICNETS2), Chennai, India, 23–25 March 2017; pp. 163–167. [Google Scholar]
- Huang, H.; Li, X.; Chen, C. Individual tree crown detection and delineation from very-high-resolution UAV images based on bias field and marker-controlled watershed segmentation algorithms. IEEE J. Sel. Top. Appl. Earth Obs. Remote Sens. 2018, 11, 2253–2262. [Google Scholar] [CrossRef]
- Ouyang, J.; De Bei, R.; Fuentes, S.; Collins, C. UAV and ground-based imagery analysis detects canopy structure changes after canopy management applications. OENO One 2020, 54, 1093–1103. [Google Scholar] [CrossRef]
- Diez, Y.; Kentsch, S.; Fukuda, M.; Caceres, M.L.L.; Moritake, K.; Cabezas, M. Deep learning in forestry using uav-acquired rgb data: A practical review. Remote Sens. 2021, 13, 2837. [Google Scholar] [CrossRef]
- Smith, A.R. Color gamut transform pairs. ACM Siggraph Comput. Graph. 1978, 12, 12–19. [Google Scholar] [CrossRef]
- Otsu, N. A threshold selection method from gray-level histograms. IEEE Trans. Syst. Man Cybern. 1979, 9, 62–66. [Google Scholar] [CrossRef]
- Lu, Z.; Qi, L.; Zhang, H.; Wan, J.; Zhou, J. Image Segmentation of UAV Fruit Tree Canopy in a Natural Illumination Environment. Agriculture 2022, 12, 1039. [Google Scholar] [CrossRef]
- Ning, H.; Jing, W.; Tahmassebi, A.R.S.; Xu, H.W.; Ke, W. NDVI-based lacunarity texture for improving identification of torreya using object-oriented method. Agric. Sci. China 2011, 10, 1431–1444. [Google Scholar]
- Jothiaruna, N.; Sundar, K.J.A.; Karthikeyan, B. A segmentation method for disease spot images incorporating chrominance in comprehensive color feature and region growing. Comput. Electron. Agric. 2019, 165, 104934. [Google Scholar] [CrossRef]
- Jing, L.; Hu, B.; Noland, T.; Li, J. An individual tree crown delineation method based on multi-scale segmentation of imagery. ISPRS J. Photogramm. Remote Sens. 2012, 70, 88–98. [Google Scholar] [CrossRef]
- Minaee, S.; Boykov, Y.; Porikli, F.; Plaza, A.; Kehtarnavaz, N.; Terzopoulos, D. Image segmentation using deep learning: A survey. IEEE Trans. Pattern Anal. Mach. Intell. 2021, 44, 3523–3542. [Google Scholar] [CrossRef] [PubMed]
- Debener, J.; Heinke, V.; Kriebel, J. Detecting insurance fraud using supervised and unsupervised machine learning. J. Risk Insur. 2023, 90, 743–768. [Google Scholar] [CrossRef]
- Chen, Y.; Hou, C.; Tang, Y.; Zhuang, J.; Lin, J.; He, Y.; Guo, Q.; Zhong, Z.; Lei, H.; Luo, S. Citrus tree segmentation from UAV images based on monocular machine vision in a natural orchard environment. Sensors 2019, 19, 5558. [Google Scholar] [CrossRef]
- Martins, J.A.C.; Nogueira, K.; Osco, L.P.; Gomes, F.D.G.; Furuya, D.E.G.; Gonçalves, W.N.; Sant’Ana, D.A.; Ramos, A.P.M.; Liesenberg, V.; dos Santos, J.A.; et al. Semantic segmentation of tree-canopy in urban environment with pixel-wise deep learning. Remote Sens. 2021, 13, 3054. [Google Scholar] [CrossRef]
- Guérin, E.; Oechslin, K.; Wolf, C.; Martinez, B. Satellite image semantic segmentation. arXiv 2021, arXiv:2110.05812. [Google Scholar]
- Wang, D. Unsupervised semantic and instance segmentation of forest point clouds. ISPRS J. Photogramm. Remote Sens. 2020, 165, 86–97. [Google Scholar] [CrossRef]
- Kanezaki, A. Unsupervised image segmentation by backpropagation. In Proceedings of the 2018 IEEE International Conference on Acoustics, Speech and Signal Processing (ICASSP), Calgary, AB, Canada, 15–20 April 2018; pp. 1543–1547. [Google Scholar]
- Chao, J.; Xiaoxiao, Y.; Xiaohai, W. Algorithm of Double Threshold Image Segmentation Combined QGA with Two-Dimensional Otsu. In Proceedings of the 2020 5th International Conference on Mechanical, Control and Computer Engineering (ICMCCE), Harbin, China, 25–27 December 2020; pp. 2219–2223. [Google Scholar]
- Zhang, Z.; Fu, H.; Dai, H.; Shen, J.; Pang, Y.; Shao, L. Et-net: A generic edge-attention guidance network for medical image segmentation. In Medical Image Computing and Computer Assisted Intervention—MICCAI 2019: Proceedings of the 22nd International Conference, Shenzhen, China, 13–17 October 2019; Springer: Cham, Switzerland, 2019; pp. 442–450. [Google Scholar]
- Lin, D.; Dai, J.; Jia, J.; He, K.; Sun, J. Scribblesup: Scribble-supervised convolutional networks for semantic segmentation. In Proceedings of the IEEE Conference on Computer Vision and Pattern Recognition, Las Vegas, NV, USA, 27–30 June 2016; pp. 3159–3167. [Google Scholar]
- Sandler, M.; Howard, A.; Zhu, M.; Zhmoginov, A.; Chen, L.C. Mobilenetv2: Inverted residuals and linear bottlenecks. In Proceedings of the IEEE Conference on Computer Vision and Pattern Recognition, Salt Lake City, UT, USA, 18–23 June 2018; pp. 4510–4520. [Google Scholar]
- Hu, J.; Shen, L.; Sun, G. Squeeze-and-excitation networks. In Proceedings of the IEEE Conference on Computer Vision and Pattern Recognition, Salt Lake City, UT, USA, 18–23 June 2018; pp. 7132–7141. [Google Scholar]
- Woo, S.; Park, J.; Lee, J.Y.; Kweon, I.S. Cbam: Convolutional block attention module. In Proceedings of the European Conference on Computer Vision (ECCV), Munich, Germany, 8–14 September 2018; pp. 3–19. [Google Scholar]
- Shibata, T.; Tanaka, M.; Okutomi, M. Misalignment-robust joint filter for cross-modal image pairs. In Proceedings of the IEEE International Conference on Computer Vision, Munich, Germany, 8–14 September 2017; pp. 3295–3304. [Google Scholar]
- Kirillov, A.; Mintun, E.; Ravi, N.; Mao, H.; Rolland, C.; Gustafson, L.; Xiao, T.; Whitehead, S.; Berg, A.C.; Lo, W.Y.; et al. Segment anything. arXiv 2023, arXiv:2304.02643. [Google Scholar]
- Redekop, E.; Chernyavskiy, A. Medical image segmentation with imperfect 3D bounding boxes. In Deep Generative Models, and Data Augmentation, Labelling, and Imperfections: Proceedings of the First Workshop, DGM4MICCAI 2021, and First Workshop, DALI 2021, Held in Conjunction with MICCAI 2021, Strasbourg, France, 1 October 2021; Proceedings 1; Springer: Cham, Switzerland, 2021; pp. 193–200. [Google Scholar]
- Lu, W.; Gong, D.; Fu, K.; Sun, X.; Diao, W.; Liu, L. Boundarymix: Generating pseudo-training images for improving segmentation with scribble annotations. Pattern Recognit. 2021, 117, 107924. [Google Scholar] [CrossRef]
- Huang, P.; Han, J.; Liu, N.; Ren, J.; Zhang, D. Scribble-supervised video object segmentation. IEEE/CAA J. Autom. Sin. 2021, 9, 339–353. [Google Scholar] [CrossRef]
- Song, Y.; Sun, Z.; Li, Q.; Wu, Y.; Sun, Y.; Luo, S. Learning indoor point cloud semantic segmentation from image-level labels. Vis. Comput. 2022, 38, 3253–3265. [Google Scholar] [CrossRef]
- Glorot, X.; Bengio, Y. Understanding the difficulty of training deep feedforward neural networks. In Proceedings of the Thirteenth International Conference on Artificial Intelligence and Statistics, JMLR Workshop and Conference Proceedings, Sardinia, Italy, 13–15 May 2010; pp. 249–256. [Google Scholar]
- Zhang, X.; Sun, N.; Fang, C.; Liu, J.; Liu, J.; Chai, D.; Wang, J.; Chen, Z. Predoo: Precision Testing of Deep Learning Operators; Association for Computing Machinery: New York, NY, USA, 2021; pp. 400–412. [Google Scholar]
- Wang, L.; Bai, Z.; Zhang, Y.; Lu, H. Show, recall, and tell: Image captioning with recall mechanism. In Proceedings of the AAAI Conference on Artificial Intelligence, New York, NY, USA, 7–12 February 2020; Volume 34, pp. 12176–12183. [Google Scholar]
- Lee, J.H.; Kim, Y.T.; Lee, J.B.; Jeong, S.N. Deep learning improves implant classification by dental professionals: A multi-center evaluation of accuracy and efficiency. J. Periodontal Implant. Sci. 2022, 52, 220. [Google Scholar] [CrossRef] [PubMed]
- Chinchor, N.; Sundheim, B.M. MUC-5 evaluation metrics. In Proceedings of the Fifth Message Understanding Conference (MUC-5): Proceedings of a Conference, Baltimore, MD, USA, 25–27 August 1993. [Google Scholar]
- Zhang, Y.; Qiu, Z.; Yao, T.; Liu, D.; Mei, T. Fully convolutional adaptation networks for semantic segmentation. In Proceedings of the IEEE Conference on Computer Vision and Pattern Recognition, Salt Lake City, UT, USA, 18–22 June 2018; pp. 6810–6818. [Google Scholar]
- Ajay, P.; Nagaraj, B.; Kumar, R.A.; Huang, R.; Ananthi, P. Unsupervised hyperspectral microscopic image segmentation using deep embedded clustering algorithm. Scanning 2022, 2022, 1200860. [Google Scholar] [CrossRef]
- Sinaga, K.P.; Yang, M.S. Unsupervised K-means clustering algorithm. IEEE Access 2020, 8, 80716–80727. [Google Scholar] [CrossRef]
- Li, X.; Li, B.; Liu, F.; Yin, H.; Zhou, F. Segmentation of pulmonary nodules using a GMM fuzzy C-means algorithm. IEEE Access 2020, 8, 37541–37556. [Google Scholar] [CrossRef]
- Chen, L.C.; Papandreou, G.; Kokkinos, I.; Murphy, K.; Yuille, A.L. Deeplab: Semantic image segmentation with deep convolutional nets, atrous convolution, and fully connected crfs. IEEE Trans. Pattern Anal. Mach. Intell. 2017, 40, 834–848. [Google Scholar] [CrossRef]
- Ronneberger, O.; Fischer, P.; Brox, T. U-net: Convolutional networks for biomedical image segmentation. In Medical Image Computing and Computer-Assisted Intervention–MICCAI 2015: Proceedings of the 18th International Conference, Munich, Germany, 5–9 October 2015; Proceedings, Part III 18; Springer: Cham, Switzerland, 2015; pp. 234–241. [Google Scholar]
Disclaimer/Publisher’s Note: The statements, opinions and data contained in all publications are solely those of the individual author(s) and contributor(s) and not of MDPI and/or the editor(s). MDPI and/or the editor(s) disclaim responsibility for any injury to people or property resulting from any ideas, methods, instructions or products referred to in the content. |
© 2023 by the authors. Licensee MDPI, Basel, Switzerland. This article is an open access article distributed under the terms and conditions of the Creative Commons Attribution (CC BY) license (https://creativecommons.org/licenses/by/4.0/).