1. Introduction
Inverse synthetic aperture radar (ISAR) [
1,
2,
3,
4,
5] is a microwave sensing technology. Thanks to its advantages such as detecting targets from a distance, at any time of day and in any weather, and so on, it is widely used in national defense and other fields. Through ISAR technology, some information about targets, e.g., size and structure, can be accurately obtained from its reflected echoes, followed by further classification and identification.
For cooperative space targets, their motion is moderate, and thus their attitude remains stabilized during coherent accumulation time. As a result, high-quality ISAR images are generated by using existing imaging methods, e.g., the Range Doppler (RD) algorithm [
6,
7], thanks to the high signal-to-noise ratio (SNR) echoes with simple Doppler frequency. However, the movement posture of non-cooperative targets is often uncontrollable. Meanwhile, their motion is always accompanied by time-varying characteristics, resulting in complex Doppler frequencies, which make existing ISAR imaging methods more challenging to employ. Furthermore, the resulting ISAR images are usually polluted by noise due to the low SNRs.
To obtain high-quality ISAR images for non-cooperative targets, many methods have recently been developed, and they can be broadly divided into two categories. The former is the parameter-estimation-based approach. The main principle of this approach is that the echoes in the azimuth dimension are modeled as multi-component polynomial phase signals (MCPPSs) after finishing the range migration correction. Further, the coefficients of the signal are estimated with parameter-estimation-based approaches, such as the high-order ambiguity function (HAF) [
8], product high-order matched-phase transform (PHMT) [
9], generalized CPF (GCPF) [
10], chirp rate–quadratic chirp rate distribution (CRQCRD) [
11], product GCPF (PGCPF) [
12], integrated parametric cubic phase function (IPCPF) [
13], coherent integrated smoothed GCPF (CISGCPF) [
14], etc. These methods can obtain high-quality ISAR images for non-cooperative space targets under certain conditions. However, the model mismatch problem of the Doppler signal is inevitable, resulting in defocusing in the azimuth dimension. Meanwhile, the signal of all range bins should be reconstructed, which is time-consuming.
The second method is the time–frequency analysis (TFA)-based imaging approach. The classical methods, e.g., short-time Fourier transform (STFT) [
15] and wavelet transform (WT) [
16], are applied to ISAR imaging. STFT-based and WT-based imaging approaches are essentially types of linear transformation approaches with no cross-term interference. However, the time–frequency resolution of those methods is low compared with that of the nonlinear transformation methods. Naturally, a TFA based on nonlinear transformation is utilized to image non-cooperative space targets. As a representative of the nonlinear transformation method, the Wigner–Ville distribution (WVD) method [
17,
18] provides a higher time–frequency resolution. Nevertheless, due to its nonlinear characteristics, the cross-term interference is serious when processing multi-component mixed signals, which deteriorates the ISAR images. To overcome the problem of cross-term interference, the extended WVD approach, e.g., the smoothed pseudo WVD (SPWVD) method [
19,
20] and the class L polynomial WVD transform (LPWVD) method [
21], is introduced to imaging for non-cooperative space targets. However, its performance when suppressing the cross-term interference and the time-frequency resolution should have a trade-off in actuality. In addition, the S-transform (ST) [
22] and synchrosqueezing transform (SST)-based [
23] ISAR imaging approaches are proposed to suppress the cross-term interference. However, human participation is involved in the process of ISAR imaging. In summary, extended TFA-based methods should be designed for the ISAR imaging of non-cooperative space targets with complex motion.
To generate high-quality ISAR images for non-cooperative space targets with complex motion, this paper proposes an ISAR imaging approach combined high-order synchrosqueezing transform with the modified multi-scale retinex method (HSTMMSR) for non-cooperative space targets. First, to reasonably describe the mobility of a non-cooperative space target, the imaging geometry and signal model for non-cooperative space targets with complex motion are established. Second, the translational motion is compensated using the standard method. Meanwhile, the echoes are modeled as MCPPSs in each range bin. Third, using the HoSST method, the MCPPSs can be transformed into the range–time–Doppler domain, where a coarse ISAR image is obtained with the quality indicator, e.g., image entropy, followed by the MMSR to enhance the result. Finally, several numerical experiments using simulated data and measured data are conducted to demonstrate the validity of the proposed approach.
The rest of this article is organized as follows. In
Section 2, the ISAR imaging geometry and signal model for non-cooperative space targets are presented to prepare for the subsequent algorithm development. The proposed method is developed in
Section 3, including the ISAR imaging principle of HSTMMSR, the procedure of the proposed algorithm, and some additional considerations. Experimental results and analysis are provided in
Section 4 to verify the effectiveness of the proposed method, and some conclusions are summarized in
Section 5.
2. Imaging Geometry and Signal Model for Non-Cooperative Space Targets
In this subsection, the ISAR imaging geometry for non-cooperative space targets is presented for the subsequent algorithm development. The standard ISAR imaging geometry model is depicted in
Figure 1, where the Cartesian coordinate
is established in the target body, the origin
is the rotating center of the targets, and the unit vector of the radar line-of-sight (LOS) and the three-dimensional angular speed of targets are denoted by the vectors
and
, respectively. According to the theorem of vector decomposition, the vector
can be divided into components that are parallel to and perpendicular to
, which, respectively, can be represented as
and
. In general, because
does not contribute to the imaging, the effective rotating velocity can be denoted as
.
Signal Model of Non-Cooperative Targets with Complex Motion
Suppose the space coordinate for the arbitrary scatterer
in the target body is
,
denotes the rotating radius of the scatterer
, and
denotes the translational velocity of the target. Therefore, the Doppler frequency of the scatterer
is
where
and
, respectively, denote the outer and inner product, and
denotes the wavelength of the transmitted signal.
As described above, the translational vector
and effective rotation vector
of the non-cooperative space targets are time-varying during the coherence integration interval. Without loss of generality, in this study, the translational vector
and effective rotation vector
can be modeled as
where
,
, and
denote the radial velocity, acceleration, and acceleration rate, respectively.
,
, and
represent the coefficients of the constant, first, and second term of
, respectively, and
denotes the slow time. By substituting (2) into (1), we obtain
Based on the relationship between the Doppler frequency and the instantaneous slant range, the instantaneous slant range
of the scatterer
can be expressed as
In this work, suppose that the radar transmits a linear frequency-modulated (LFM) signal, given by
where
,
denote the fast time, slow time, carrier frequency, frequency modulation rate, and pulse width, respectively;
denotes the full time; and
represents the total number of received pulses.
By transmitting the LFM signal, the echoes reflected from the scatterer
satisfy
where
denote the reflection coefficient of the scatterer
, the speed of light, and the coherent integration time, respectively.
After baseband demodulation and range compression, the received echoes can be written as
where
denotes the bandwidth of the transmitted signal and
represents the azimuth envelope.
It is worth noting that, from (7), the envelope term
in SINC [*] causes the range migration, e.g., translational migration and migration, through range cells (MTRCs). It is well-known that the translational motion term in (7) can be compensated for by utilizing standard translational motion compensation algorithms, e.g., envelope correlation [
24], global range alignment [
25], the image entropy-based method [
26], the image contrast-based method [
27], and so on. Furthermore, the keystone transform (KT) technique [
28] can be adopted to compensate for the MTRCs term. In conclusion, the range migration term can be easily corrected compared with the phase modulation term in (7). It is worth mentioning that the phase modulation term is time-varying due to the time-varying characteristic of non-cooperative targets. Meanwhile, the phase distribution of each scatterer is different on the effect of different rotating centers for different scatterers, invaliding existing ISAR imaging algorithms.
We assume the energies of all scatterers are concentrated into the right range bins after conducting the range migration correction operation. Therefore, the signals in a range bin can be modeled using multi-component quadratic frequency modulation (MCQFM), and the analytical expression of the signal in the
range cell can be expressed as
where
,
,
, and
represent the amplitude, center frequency, chirp rate, and derivative of the chirp rate, respectively.
denotes the additive complex white Gaussian noise with zero mean and variance of
. As a result, to produce well-focused ISAR images for non-cooperative targets, the time-varying phase term and the additive complex white Gaussian noise in (8) caused by non-cooperative motion need to be precisely compensated for.
3. Proposed Imaging Method
As described above, existing ISAR imaging methods based on TFA are invalid for non-cooperative space targets. There are two possible reasons. The first is that the Doppler frequency of the non-cooperative space targets cannot be described in a uniform way, and the second is that the applicability of the TFA is limited. Therefore, due to the coupling effect of these reasons, obtaining high-quality ISAR images for non-cooperative space targets is challenging. In this section, by considering these issues, we primary focus on the ISAR imaging approach for non-cooperative space targets based on HSTMMSR approaches, which consist of two steps.
3.1. Coarse ISAR Imaging with High-Order Synchrosqueezing Transform
As a high-resolution time–frequency analysis method, HoSST [
29,
30] is a new extension of the synchrosqueezing transform (SST) method that can extract the instantaneous time-varying frequency of a signal accurately.
Now, we address the signals in the
range bin, the STFT of which can be expressed as
where
represents a window function and
denotes the complex conjugate of
.
The general STFT-based SST can be defined as
where
denotes the pre-set threshold,
stands for the Dirac distribution, and
denotes the instantaneous frequency estimated at time
and frequency
, defined by
where
represents the real-value part of the complex number
and
denotes the partial derivative of
.
It is noteworthy that, from (9) to (11), the instantaneous frequency of the signal is determined by a low-order term, which is effective to describe space targets with moderate motion. However, for non-cooperative space targets with complex motion, the instantaneous Doppler frequency is intricate; thus, it cannot be accurately presented. Therefore, to precisely extract the complex instantaneous Doppler frequency from the echoes of non-cooperative space targets, the instantaneous Doppler frequency can be modeled as a high-order term.
For high-order SST (HoSST), the instantaneous Doppler frequency is defined using a high-order Taylor expansion for both the amplitude and phase, which means that the Taylor expansion of the signal
in (8) can be expressed as
where
represents the
derivative in terms of
at time
. Therefore, (10) can be rewritten as
According to (13), the local instantaneous frequency
can be rewritten as
The frequency modulation operator
can be defined as
In addition, the
-order local complex instantaneous frequency
at time
and frequency
can be given by
As a result, the
can be replaced by
in (10), given by
Additionally, the signal with complex instantaneous frequency can be reconstructed, given by
Therefore, compared with the conventional STFT method, the instantaneous frequency with HoSST is more appropriate for non-cooperative space targets because the local instantaneous frequency is modeled as a high-order polynomial, which is consistent with the nature of highly complex motion. As a consequence, the high-resolution two-dimensional time–frequency analysis result can be obtained. Inspired by the high-resolution time–frequency characteristic of HoSST, in this work, a coarse ISAR image can be produced using the HoSST-based time–frequency analysis method.
Using HoSST to process the signals in each range bin, the range–time–Doppler matrix is obtained, where different frequencies correspond to different ISAR images. Therefore, the entropy is adopted as an image quality indicator to extract the optimal ISAR images, given by
where
represents the maximum value in terms of the Doppler frequency
,
denotes the optimal ISAR images, and
denotes the pixel coordinate.
3.2. Fine ISAR Imaging with Modified Multi-Scale Retinex
It is well known that the electromagnetic scattering characteristic of targets determines whether the ISAR images are accompanied by significant sparse features, resulting in large scattering intensity differences and low visualization of weak component in the ISAR images, which is not conductive for the interpretation of the images or for the analysis of the morphological structure of the targets. Furthermore, due to the highly complex motion characteristic of non-cooperative targets, the SNR of the echoes is low and the ISAR images are polluted by noise. To overcome the obstacle above, in this study, the modified multi-scale retinex (MMSR) method is adopted to conduct the enhancement operation for the ISAR images of non-cooperative space targets.
Based on the retinex theory, the arbitrary pixel value
of ISAR images can be obtained using the following expression:
where
denotes the illuminated intensity component and
represents the reflected component.
In reality, the single-scale retinex (SSR) method is utilized to enhance the ISAR images. However, trade-offs need to be made between detail enhancement and contrast enhancement, among other factors, which increases the difficulty of the operations. Inspired by the advantage of the multiple-scale parameter for SSR, the MMSR is utilized to complete the above tasks, given by
where
denotes the base of the logarithm, which is related to the log in (22) and
represents the enhancement factor of the ISAR images, given by
where
and
, respectively, denote the weighting coefficient of the
n-th scale parameter and the Gaussian distribution function, given by
where
denotes the scale parameter,
N denotes the number of the scale parameter, and
denotes the normalization factor, given by
3.3. ISAR Imaging of the Proposed Method
Based on the excellent time–frequency analysis performance, a novelty ISAR imaging approach that combines HOSST with MMSR is proposed for non-cooperative space targets with complex motion. The detailed implementation process is summarized below.
Conduct range compression operation for raw echoes;
Initialize iteration as 1 and complete the time–frequency analysis operation using the HOSST approach along the azimuth dimension;
Let and repeat the complete time–frequency analysis based on HOSST until , where denotes the number of range cells;
Rearrange the time series and extract the coarse ISAR image based on the image indicator, e.g., image entropy or image contrast;
Enhance the coarse ISAR images by using the MMSR;
- 2.
Output the fine ISAR images of non-cooperative space targets.
To summarize, the flowchart of the entire ISAR imaging approach is presented in
Figure 2.
3.4. Some Considerations for the Application
3.4.1. Numerical Analysis and Performance Comparison
To further illustrate the effectiveness of the proposed method, MCS including chirp frequency modulation, polynomial phase frequency modulation, and sinusoidal frequency modulation was processed using WVD, STFT, SST, and HoSST.
The time–frequency analysis results using simulated data with 1024 samples are presented in
Figure 3; the time-domain characteristic of the MCS is shown in
Figure 3a. It can be seen that the MCS is chaotic. It is clear from
Figure 3b that the MCS is composed of three signals with different frequencies. The time–frequency result of WVD for MCS is shown in
Figure 3c. It is noteworthy that the clustering characteristic is poor, which seriously affects the ISAR imaging performance for non-cooperative space targets. It is worth noting that, as seen in
Figure 3d, the time–frequency result of STFT has no cross-term interference. Nevertheless, the time–frequency resolution is low. The time–frequency result of SST is presented in
Figure 3e. It should be noted that its time–frequency resolution is higher than those of WVD and STFT. Meanwhile, cross-terms interference is absent. However, the time–frequency resolution of the sinusoidal frequency modulation signal is limited. In contrast, the high-quality time–frequency signal is reconstructed using the HoSST, as shown in
Figure 3f. In addition, thanks to the robustness and focusing performance, the signals reconstructed from
Figure 3a are consistent with the instantaneous frequency distribution of
Figure 3b. As a result, compared with WVD, STFT, and SST, the HoSST has an outstanding time–frequency focusing characteristic, providing a novel method for the design of ISAR imaging algorithms.
3.4.2. Computational Complexity Analysis
In this subsection, the computational complexities of RD, WVD, STFT, SST, and the proposed method are theoretically analyzed. Generally, some procedures with low computational complexity in the algorithm implementation process are not included in calculating the computational complexity. Furthermore, floating-point operations (FLOPs) are required in order to conduct the operation of Fourier transform (FT) or inverse Fourier transform (IFT) for N-point data, and N FLOPs are required to execute one-time complex multiplications for N-point data. Now, suppose the size of the echoes in this work is .
In general, the procedure of RD consists of a range compression procedure and an azimuth compression step with two-time FFT operations, one-time multiplication, and one-time IFFT. Thus, the computational complexity is
The procedure of the WVD method is composed of range compression and time–frequency analysis in the azimuth dimension. The computational complexity of the range compression is
, and the computational cost for
-point data during the time–frequency analysis of the WVD method is
. Hence, the computational complexity of the WVD approach is
Based on the analysis mentioned in Ref. [
18], after the range compress operation, the echoes are iteratively time–frequency analyzed in each range bin using the STFT method along azimuth dimension. Meanwhile, the length of the processing core for STFT is
. The computational complexity with STFT processing for
-point data is
. Therefore, the computational complexity using the STFT method for
echoes is
For the SST method, based on the analysis in Ref. [
23], a Gaussian window function is adopted, the implementation procedure of which consists of three steps, namely, the parameters calculation, SST processing for the time–frequency signal, and the signal component extraction. The total computational cost for the corresponding parameters calculation, SST processing for the time–frequency signal, and the signal component extraction is
. Therefore, the computational cost of the SST method for
echoes is
In this work, the implementation procedure of the proposed method is the corresponding parameters calculation, the estimations of the frequency modulation, the reassignment step, and image enhancement. The total computational cost of the corresponding parameters calculation, the estimations of the frequency modulation, and the reassignment step for
data is
. The cost of image enhancement is determined by the size of the ISAR images. Suppose the size of this work is
; thus, the cost is
. Therefore, the total computational complexity of the proposed method for
echoes is
In conclusion, based on the analysis mentioned above, all methods have a range compression operation; thus, the comparison for the computational cost of those methods is determined by the time consumption in the azimuthal dimensional. The computational cost of the RD method is the lowest of those five methods. Compared with the time–frequency analysis method for WVD and STFT, the computational complexity of the proposed approach is a burden because the high-order local instantaneous frequency modulation should be obtained, which is consistent with the analysis mentioned in
Section 3.1. Furthermore, the computational complexity of SST is higher than that of the proposed method.
4. Experimental Results and Analysis
In this section, the simulated and measured data are adopted to verify the validity of the proposed method. Meanwhile, some typical time–frequency analysis methods including RD, WVD, STFT, and SST are performed for comparison.
4.1. ISAR Imaging with Simulated Experiments
In this subsection, the simulated data are generated using the radar system parameters and motion parameters presented in
Table 1, and the structure of a non-cooperative space target composed of 42 scatterers is presented in
Figure 4.
To verify the anti-noise performance of those methods, white Gaussian noise is added to the echoes (after range compression), and the analytic expression of SNR can be defined as
The ISAR imaging results of the RD method [
5], the WVD method [
15], the STFT method [
18], the SST method [
23], and the proposed method under SNRs of 5 dB and –5 dB, respectively, are presented in
Figure 5,
Figure 6,
Figure 7,
Figure 8 and
Figure 9. As seen in
Figure 5a, due to the non-cooperative characteristics, the ISAR image obtained with the RD method is seriously defocused in the azimuth dimension. The ISAR imaging results using the WVD method are provided in
Figure 6. Due to the influence of cross-term interference, the structure of the airplane is hard to observe, especially under the –5 dB condition. The ISAR imaging results obtained with STFT are provided in
Figure 7. The results are seriously defocused under the SNR = 5 dB and SNR = –5 dB conditions. The ISAR imaging results using SST and the proposed method are presented in
Figure 8 and
Figure 9, respectively. It is clear that the proposed method obtains a well-focused and clear target image. In addition, it should be pointed out that, from
Figure 5,
Figure 6,
Figure 7,
Figure 8 and
Figure 9, compared with the other four methods, the proposed approach presents a better anti-noise performance, shown in
Figure 5b,
Figure 6b,
Figure 7b,
Figure 8b and
Figure 9b. Therefore, the proposed approach has advantages in ISAR imaging performance for non-cooperative space targets.
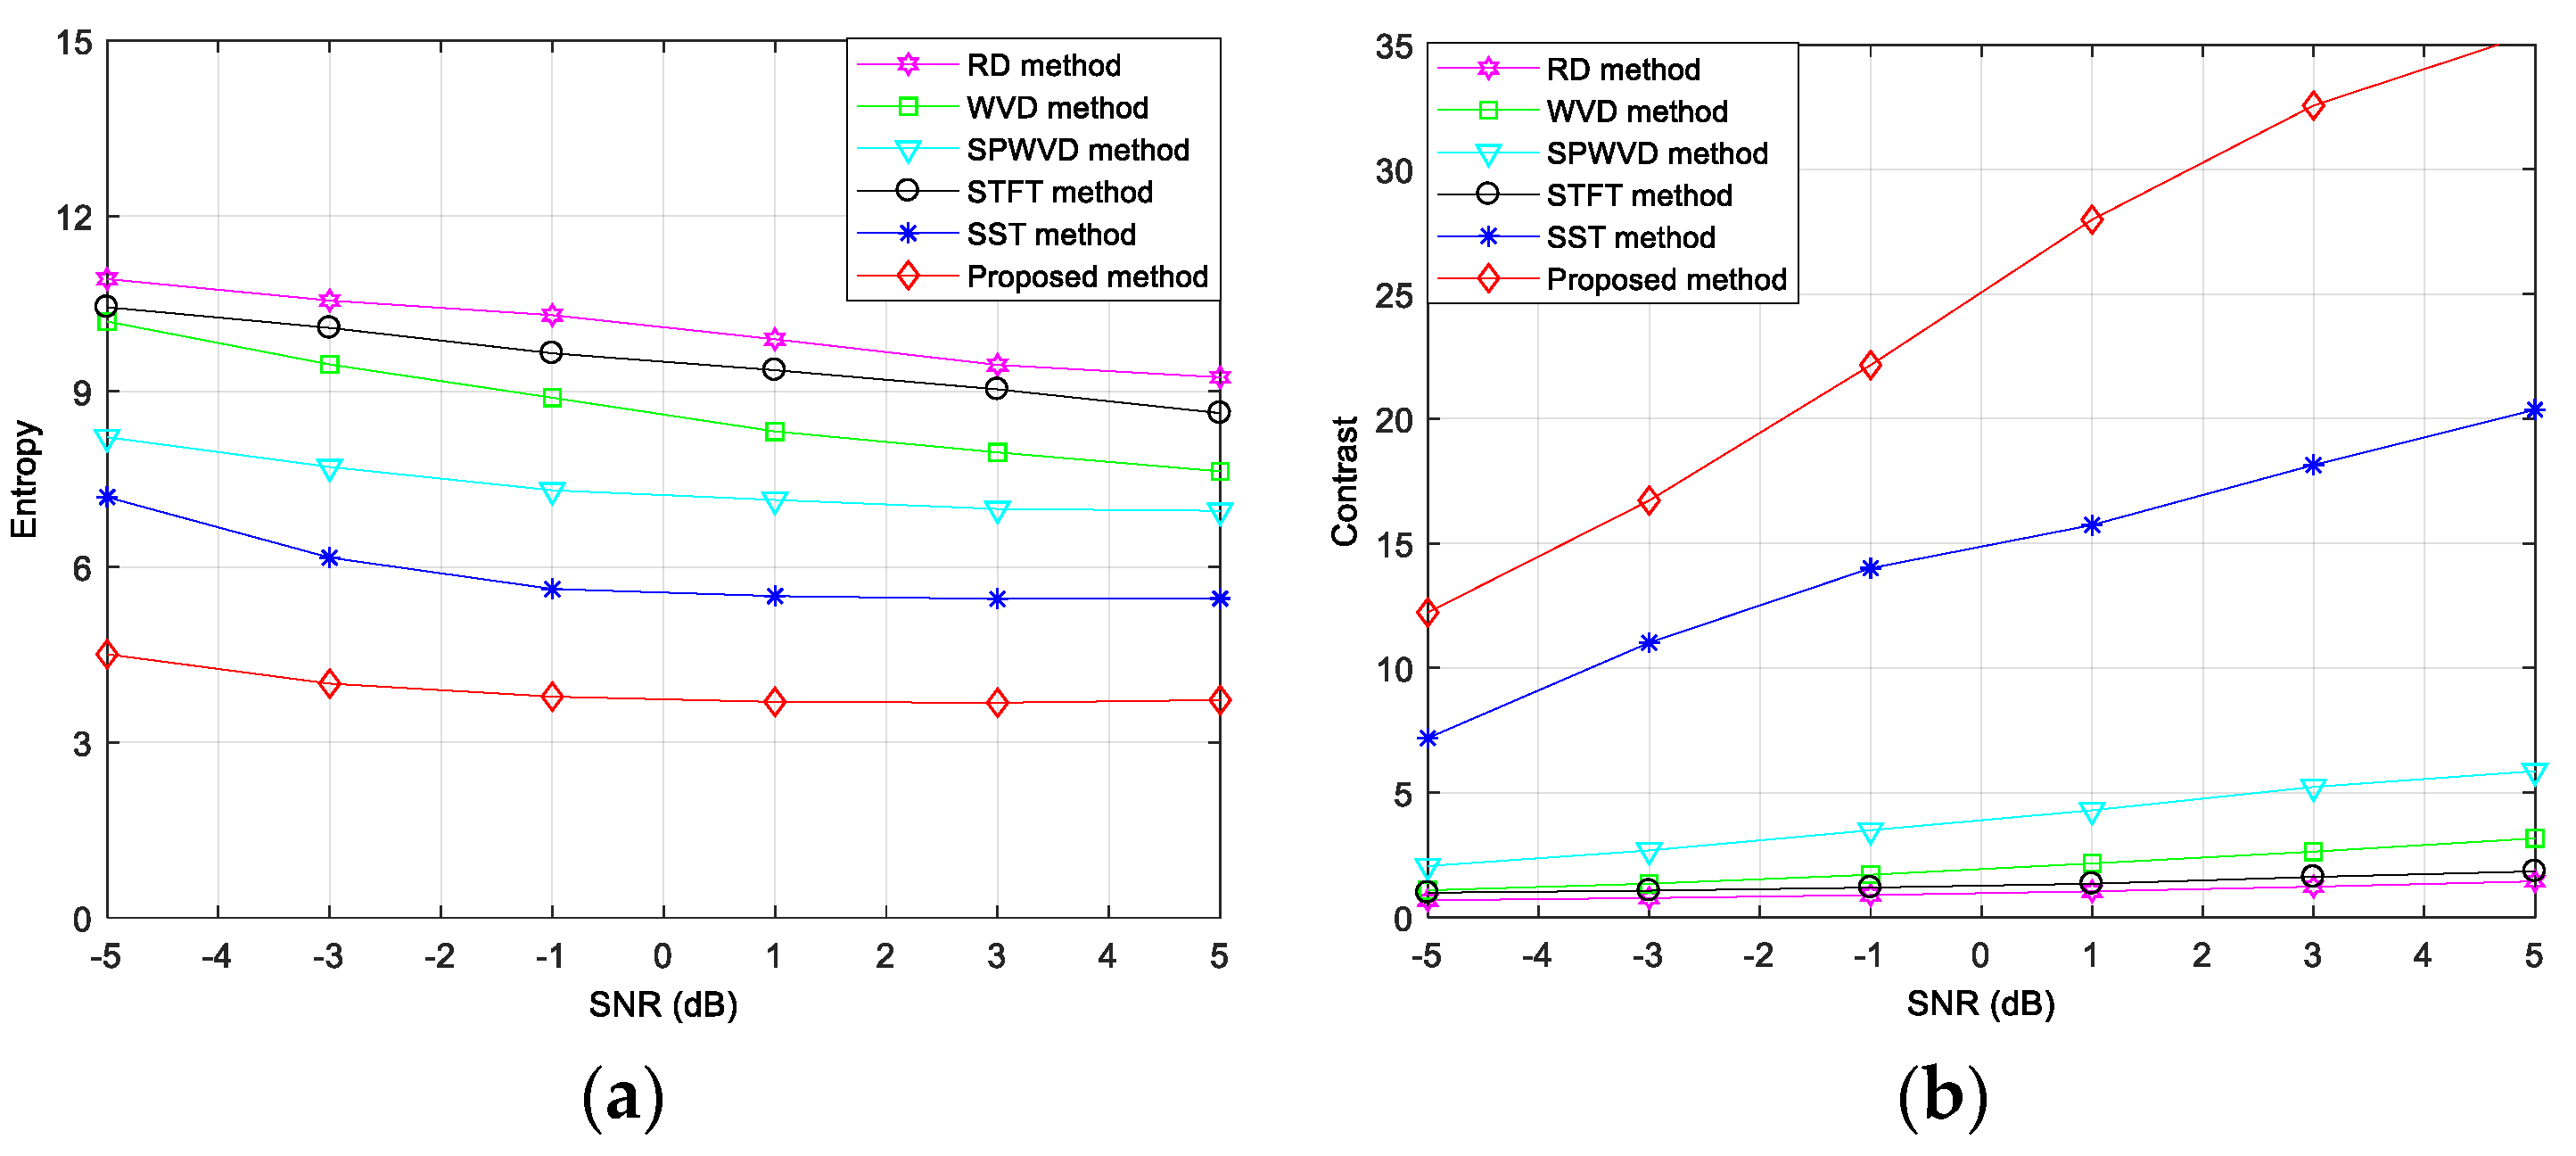
In addition to the quantitative analysis of the ISAR imaging performance of the different approaches, the image entropy
[
31,
32] and image contrast
[
33,
34,
35] were adopted as criteria to evaluate the images’ quality, and they are, respectively, defined below. First:
where
;
represents the number of azimuth pulses; and
denotes the number of range cells. Second:
where
denotes the expectation operator.
The image entropy and image contrast of each ISAR imaging results, obtained using the RD, STFT, WVD, and SST methods and the proposed method with different SNRs, are provided in
Figure 10, where the 100-time Monte Carlo experiments conducted are shown. According to the curve of the image entropy and contrast, the proposed method has a better imaging performance than that of the other methods. Moreover, with the decrease in SNR, the advantage of the proposed method becomes more obvious, illustrating the anti-noise performance of the proposed method.
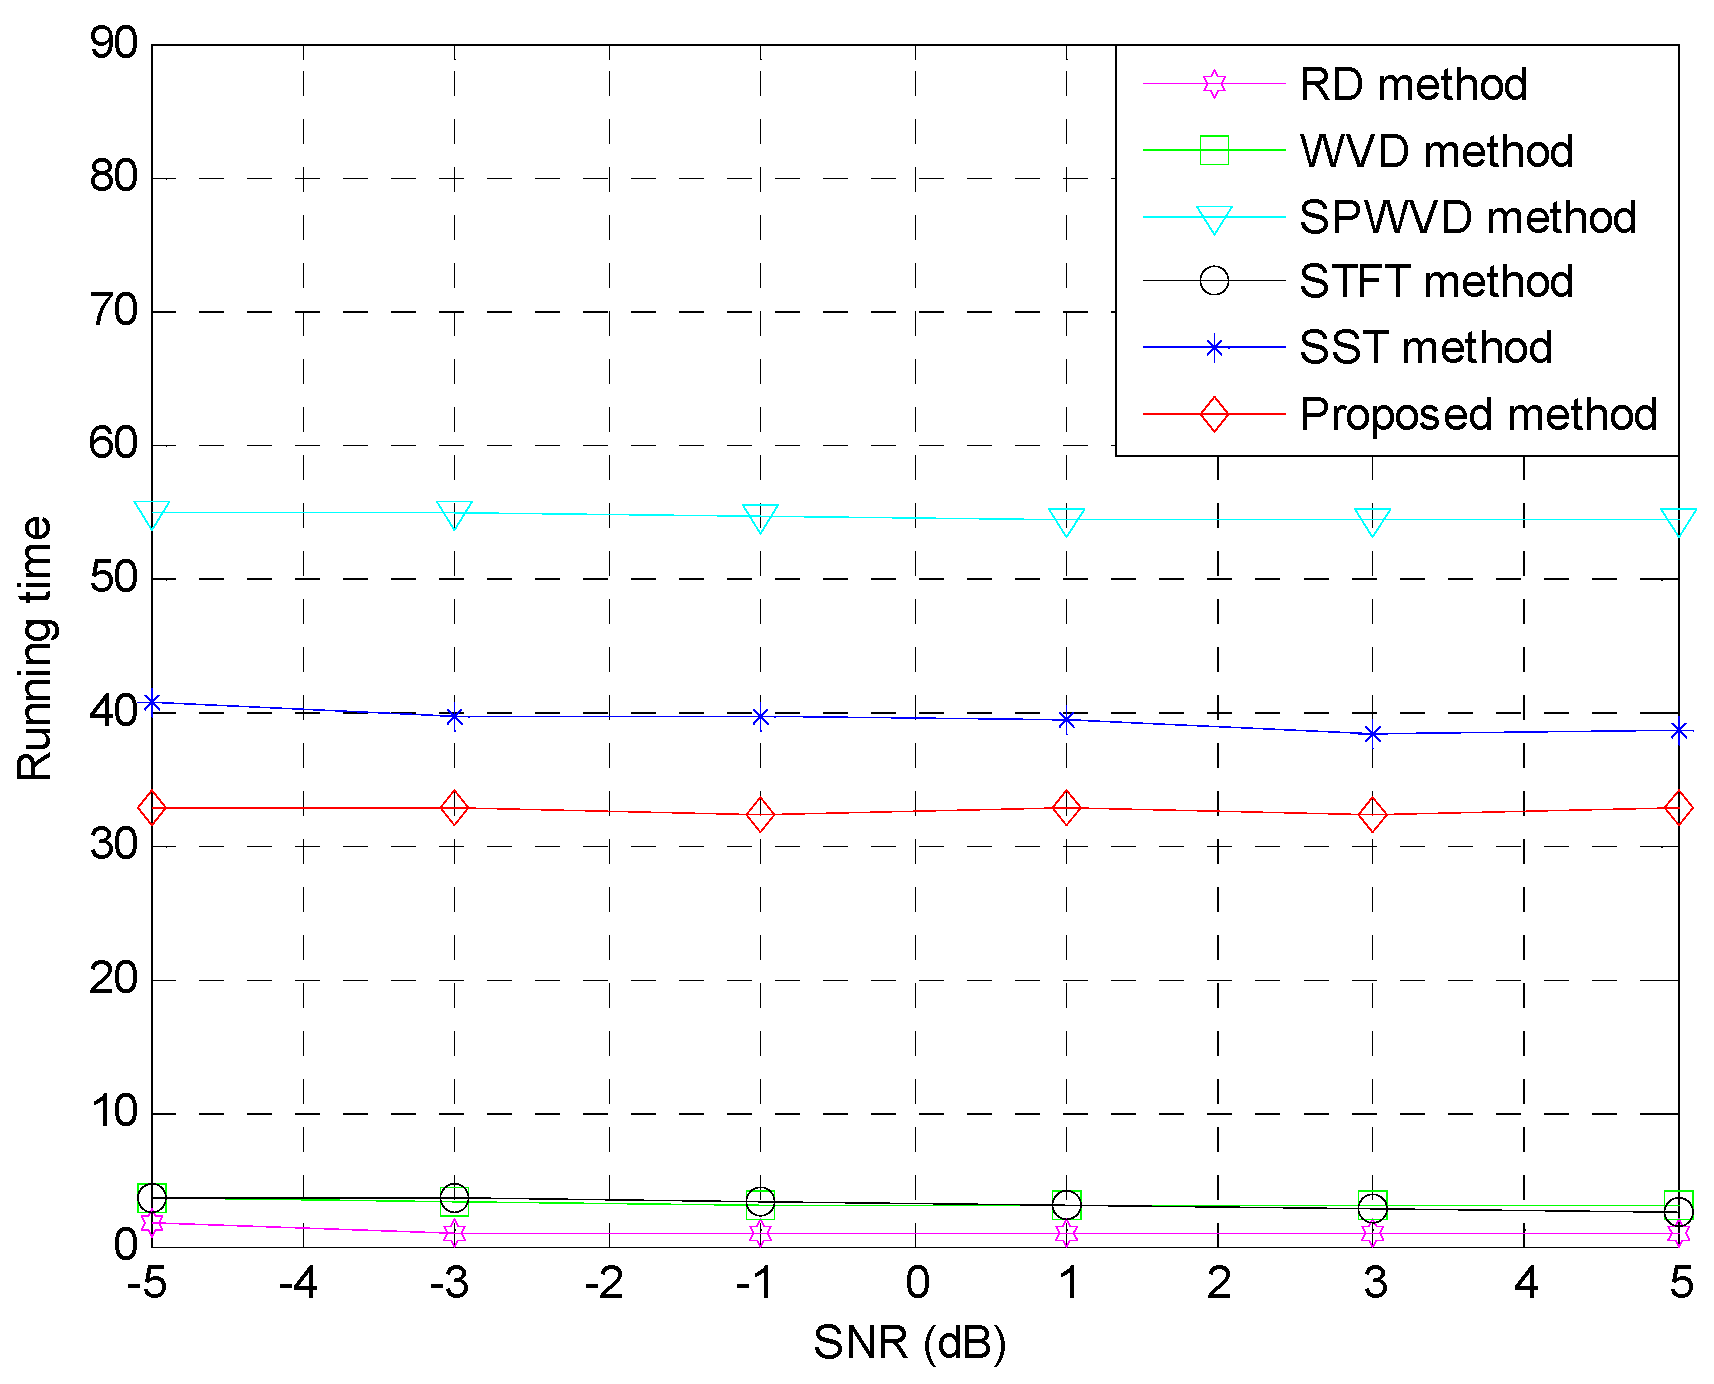
The ISAR imaging cost of the different approaches is provided in
Figure 11. The running time of the RD method is the lowest for all the different SNRs, followed by the WVD method and the STFT method. In addition, compared with the SPWVD method and the SST method, the proposed method takes less time, which is consistent with the theory analysis mentioned above. Therefore, by accepting a trade-off between computational complexity and ISAR imaging performance, the proposed method is a promising imaging method for non-cooperative space targets.
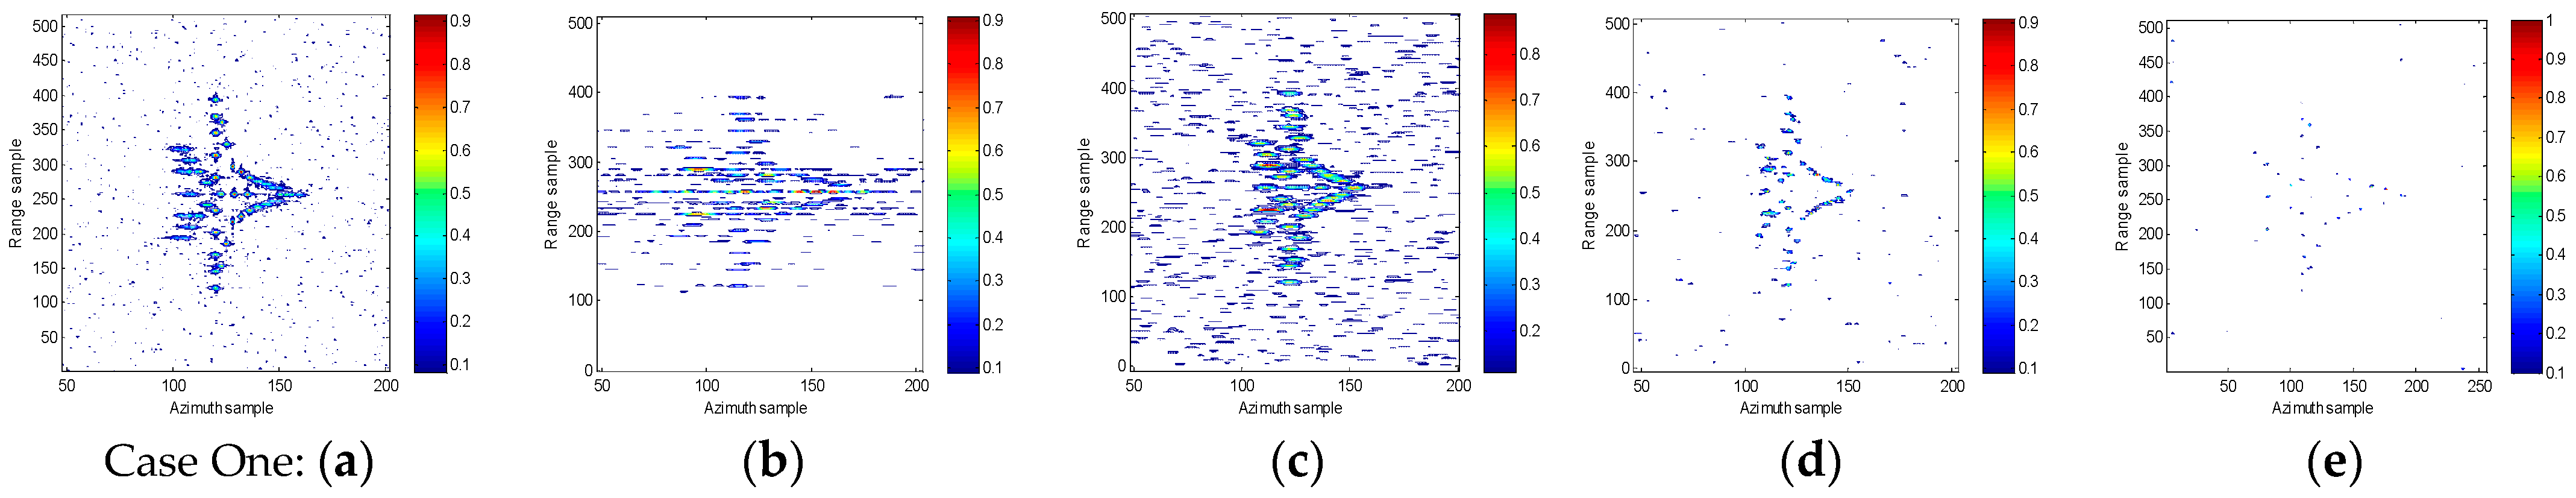
4.2. ISAR Imaging under Different Motion Parameters
In this subsection, to verify the validity of the studied methods under different motion conditions, three motion parameters are presented (
Table 2), where the model is as shown in
Figure 4 and the SNR, added in echoes (after range compression), is –3 dB. The ISAR imaging results of the different methods are provided in
Figure 12. It is noteworthy that, as seen in
Figure 12, the defocusing of the imaging results with the RD method is clear under different motion parameters, shown in Case One, Case Two and Case Three in
Figure 12a,b. In addition, the structure of the airplane is submerged in the interference of the noise. Furthermore, the defocusing of the imaging results using the STFT method and the SST method is also serious, shown in Case one, Case Two and Case Three in
Figure 12c,d. Moreover, to quantitatively analyze the imaging results, the entropy and contrast under three cases for the different imaging approaches are determined, provided in
Table 3. It is worth noting that, as seen in
Table 3, the entropy and contrast for the imaging results of the proposed method are the best compared with those of the RD, WVD, STFT, and SST methods, which indicates the effectiveness of the imaging performance of the proposed method. Therefore, on this basis, we can draw the conclusion that the proposed approach has robustness for non-cooperative space targets under different motion parameters.
4.3. ISAR Imaging under Inhomogeneous Condition
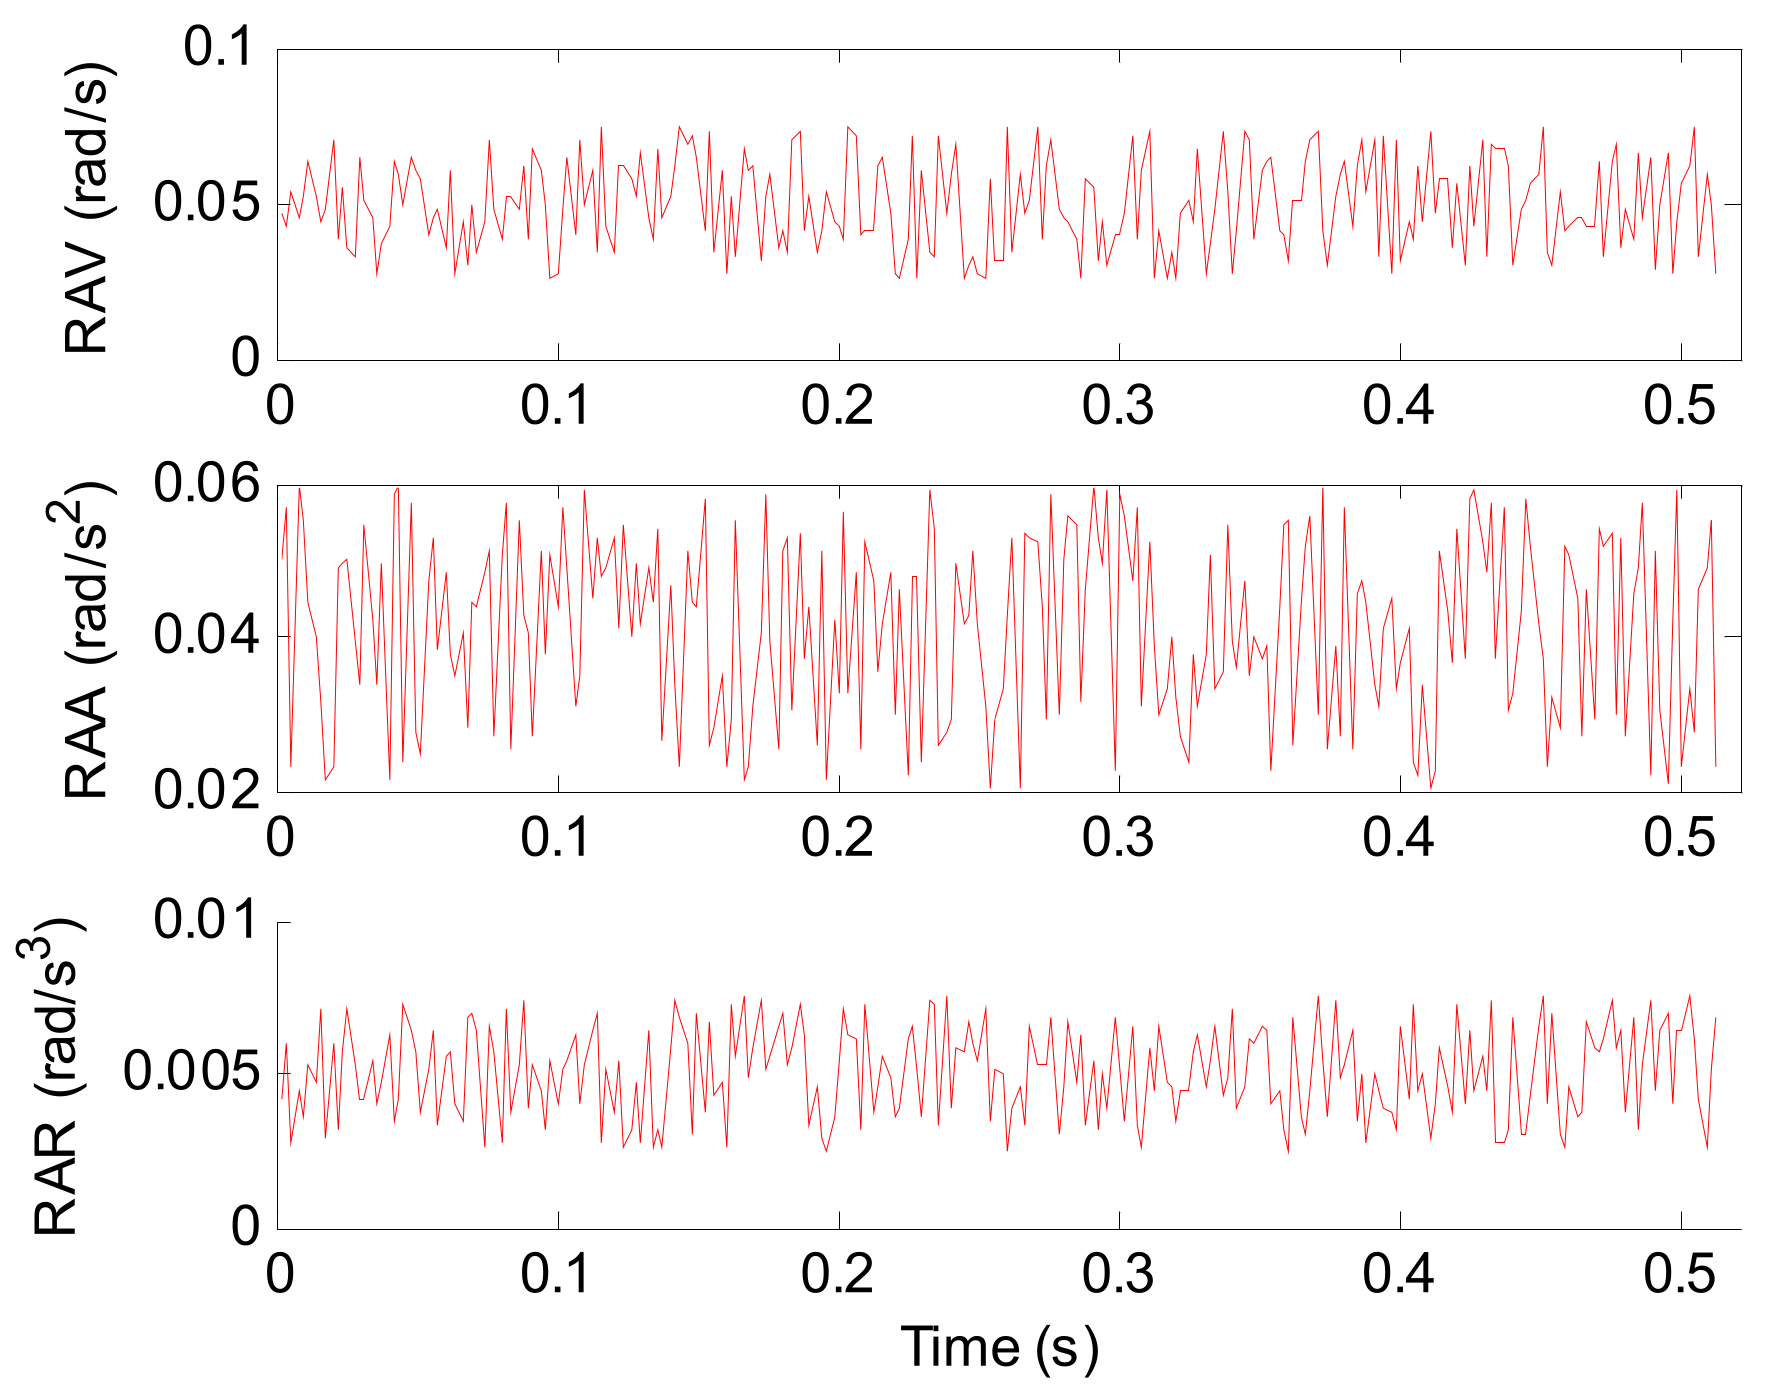
In this subsection, we describe the experiment conducted on the rotation of the targets, which was not completed, but rather limited to a given variable angle. Considering that the rotation is related to the rotational angular velocity (RAV), rotational angular acceleration (RAA), and rotational angular acceleration rate (RAR), the RAV, RAA, and RAR for this experiment are provided in
Figure 13, where the values vary randomly within a certain range. The horizontal axis denotes the coherence processing time, and the vertical coordinates represent the corresponding values.
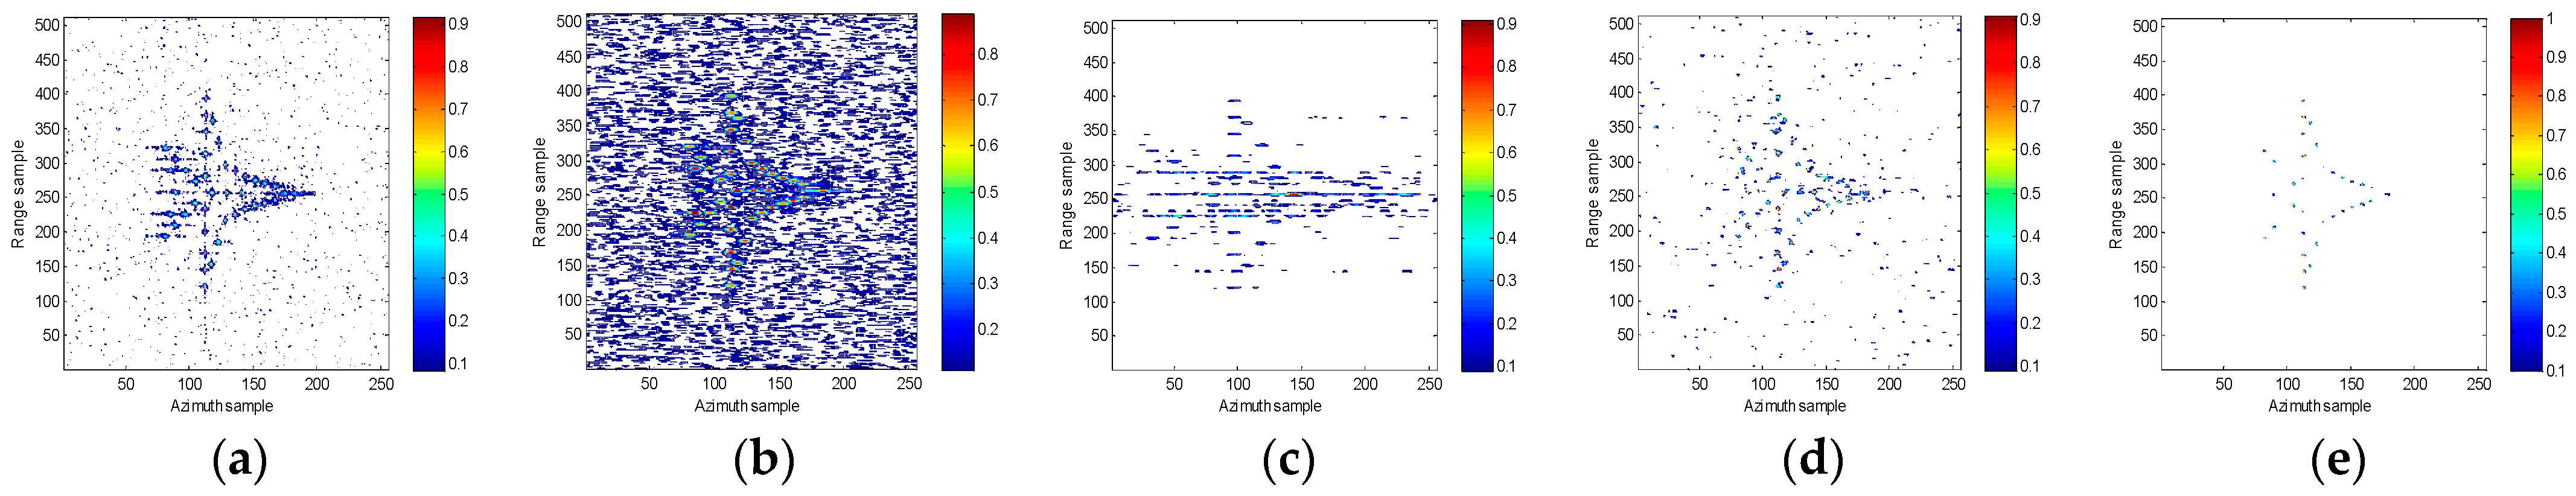
In addition, the imaging results from using the RD, WVD, STFT, and SST methods and the proposed method are presented in
Figure 14, where –3 dB white Gaussian noise is added into the echoes. It is noteworthy that the imaging performance of the proposed method is superior to that of the conventional imaging approach, shown in
Figure 2a–e. Furthermore, the entropy and contrast are introduced in
Table 1 to quantitatively analyze the imaging results. It is worth pointing out that, as seen in
Table 4, compared with the other methods, the entropy of the imaging result from the proposed method is the smallest and the contrast of the imaging results from the proposed method is maximal.
4.4. ISAR Imaging under Shadowing Condition
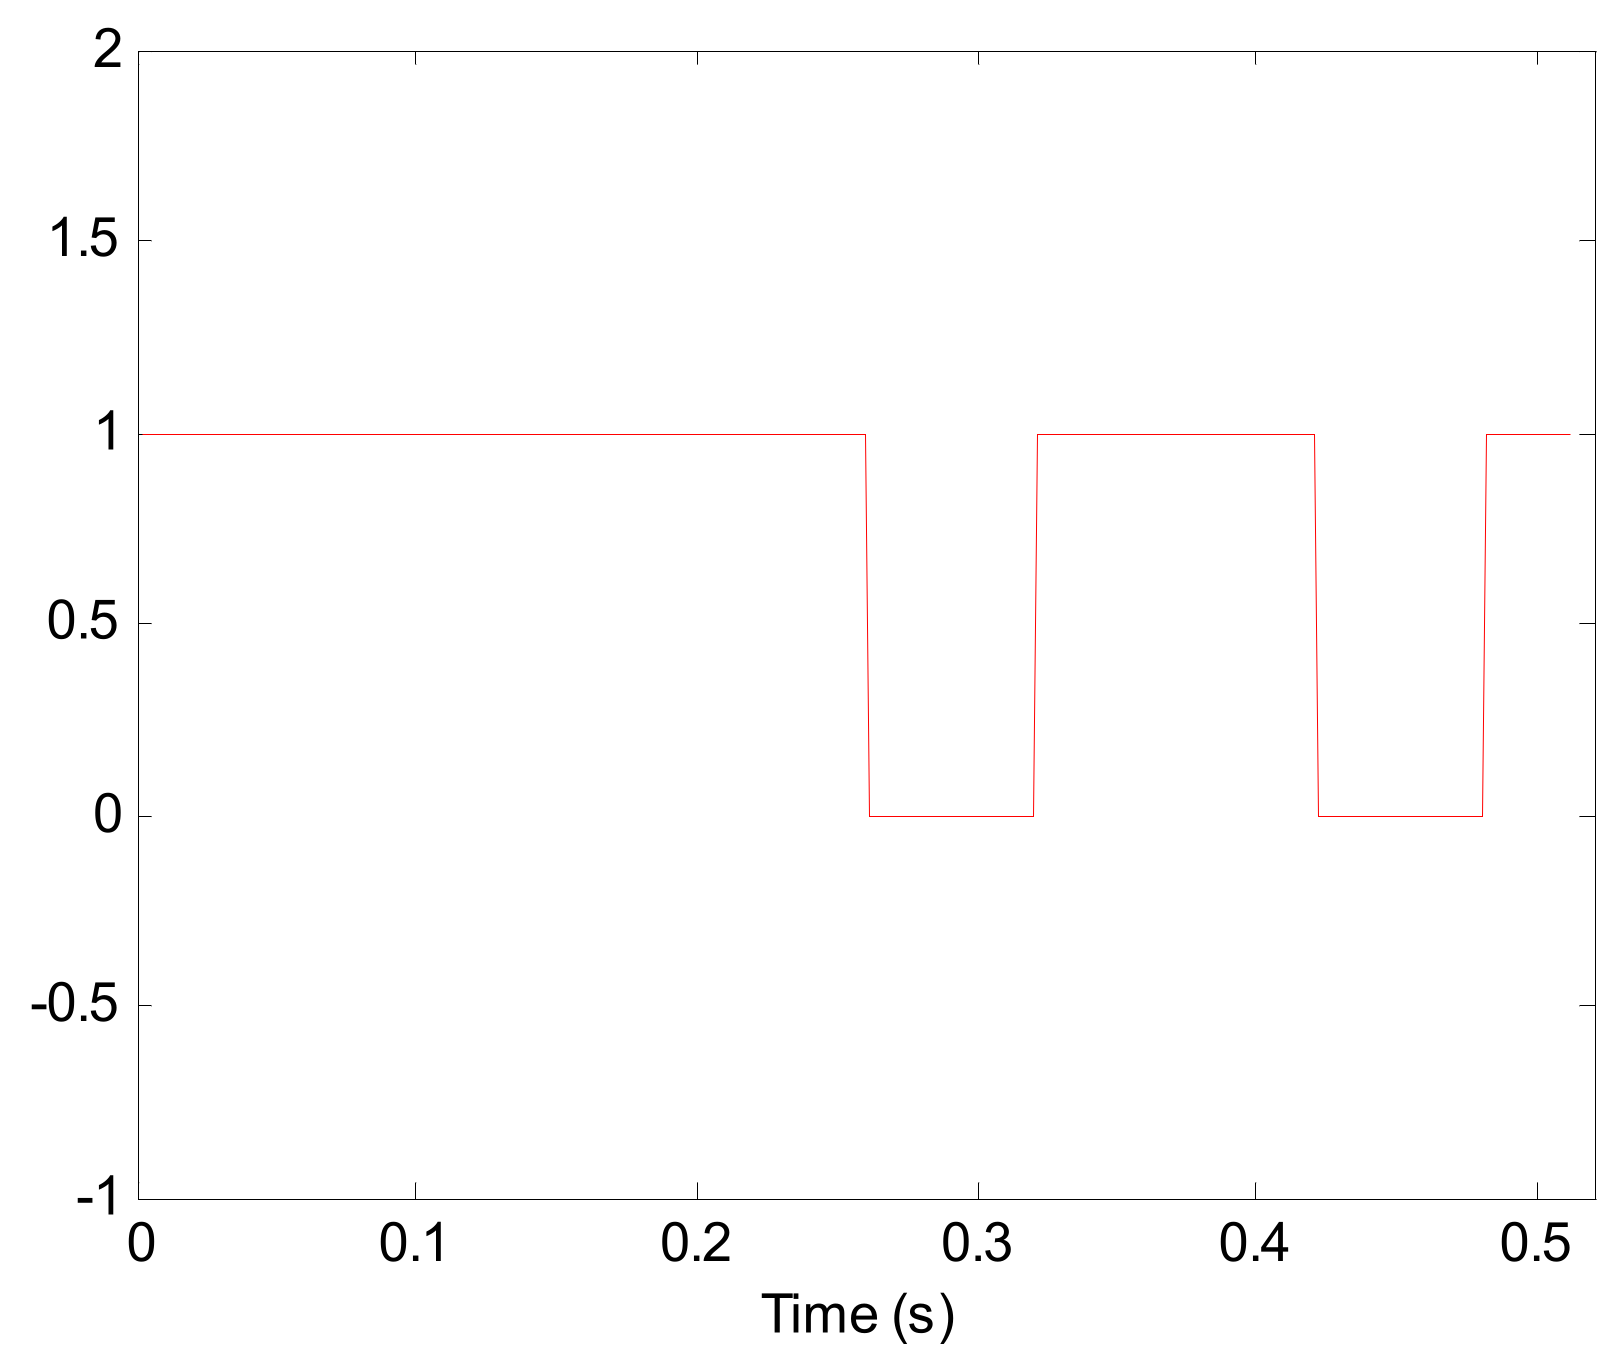
To further verify the imaging performance under a shadowing condition, in this subsection, the tail of targets is shielded from 0.26 s to 0.32 s, and the wing of targets is shielded from 0.42 s to 0.48 s. The method is shown in
Figure 15, where 0 and 1, respectively, represent shadowing and not shadowing.
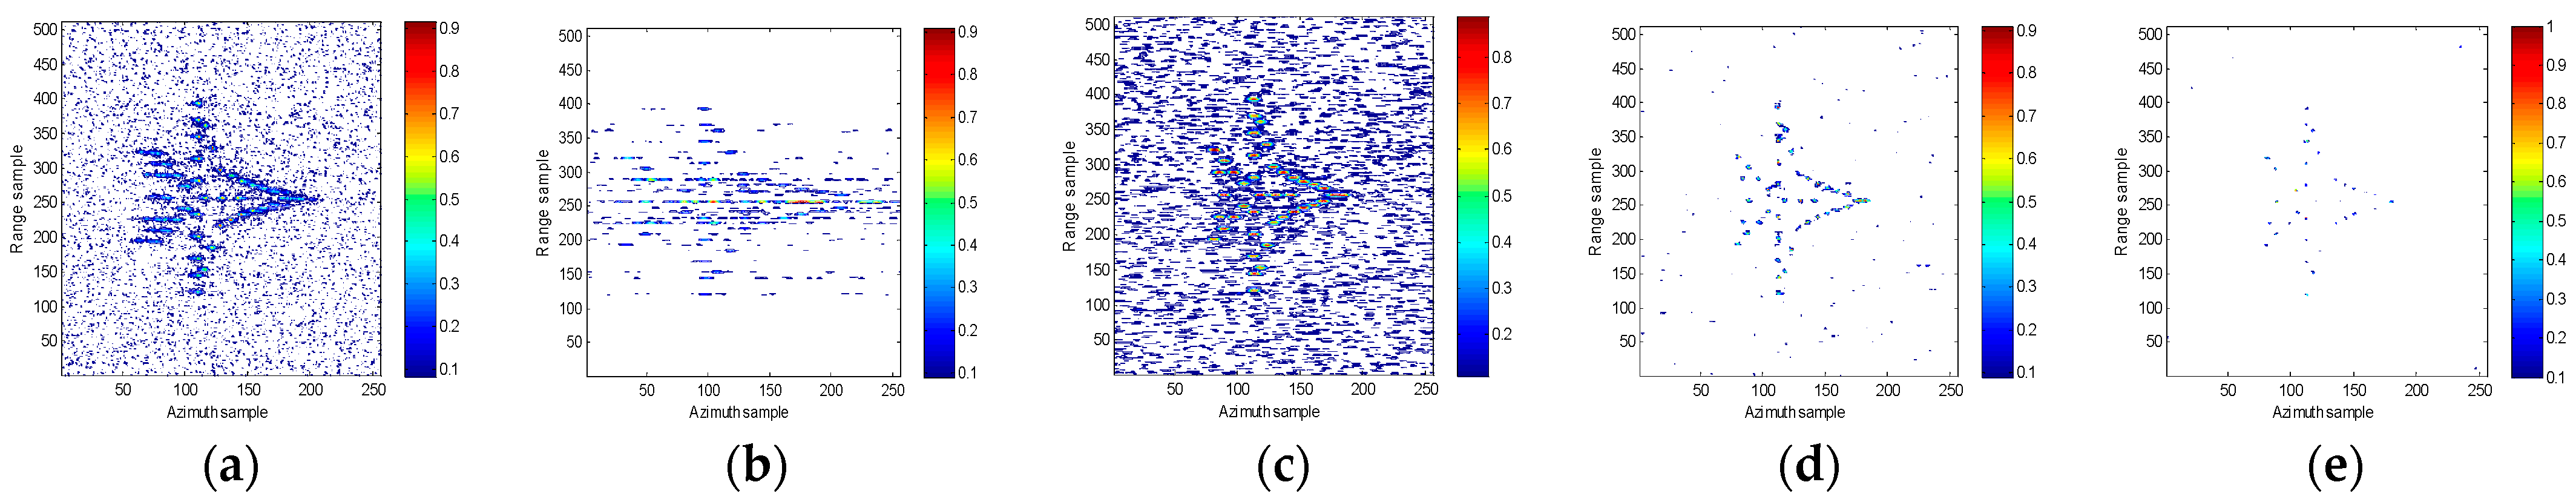
The imaging results are provided in
Figure 16. In addition, –3 dB white Gaussian noise was added into the echoes. It is worth noting that the proposed method can clearly reconstruct the outline of the targets, as shown in
Figure 16. Meanwhile, the imaging performance of the proposed method is superior to that of the other methods. In addition, the entropy and contrast of each method are presented in
Table 5; it is clear that the entropy of the imaging result from the proposed method is the smallest, and the contrast of the imaging results from the proposed method is maximal, proving that the proposed approach is a good candidate in the context of missing data.
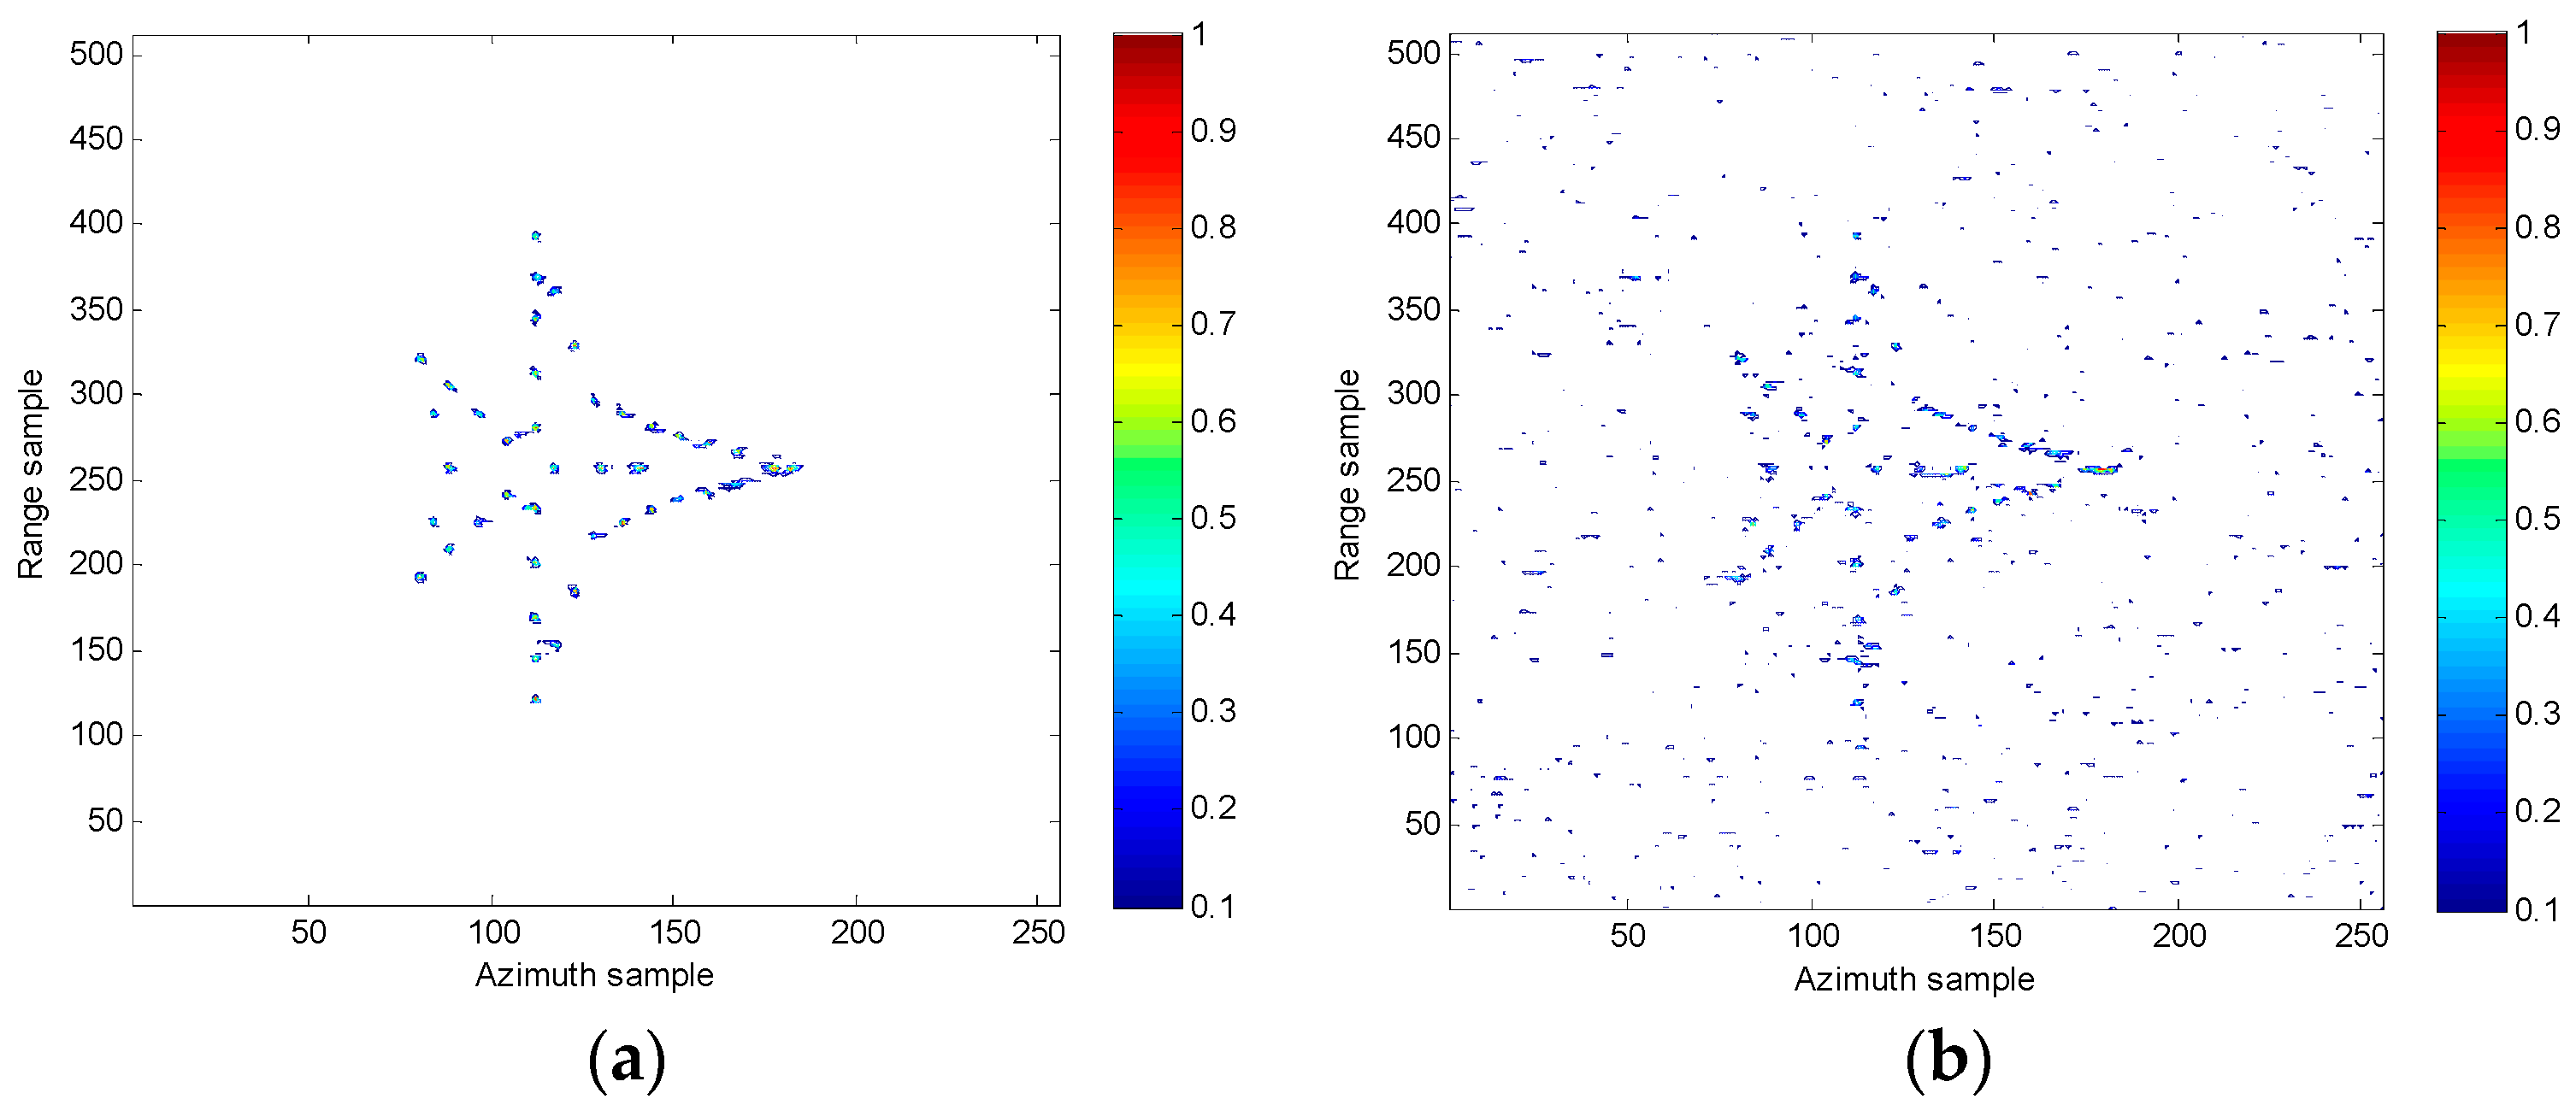
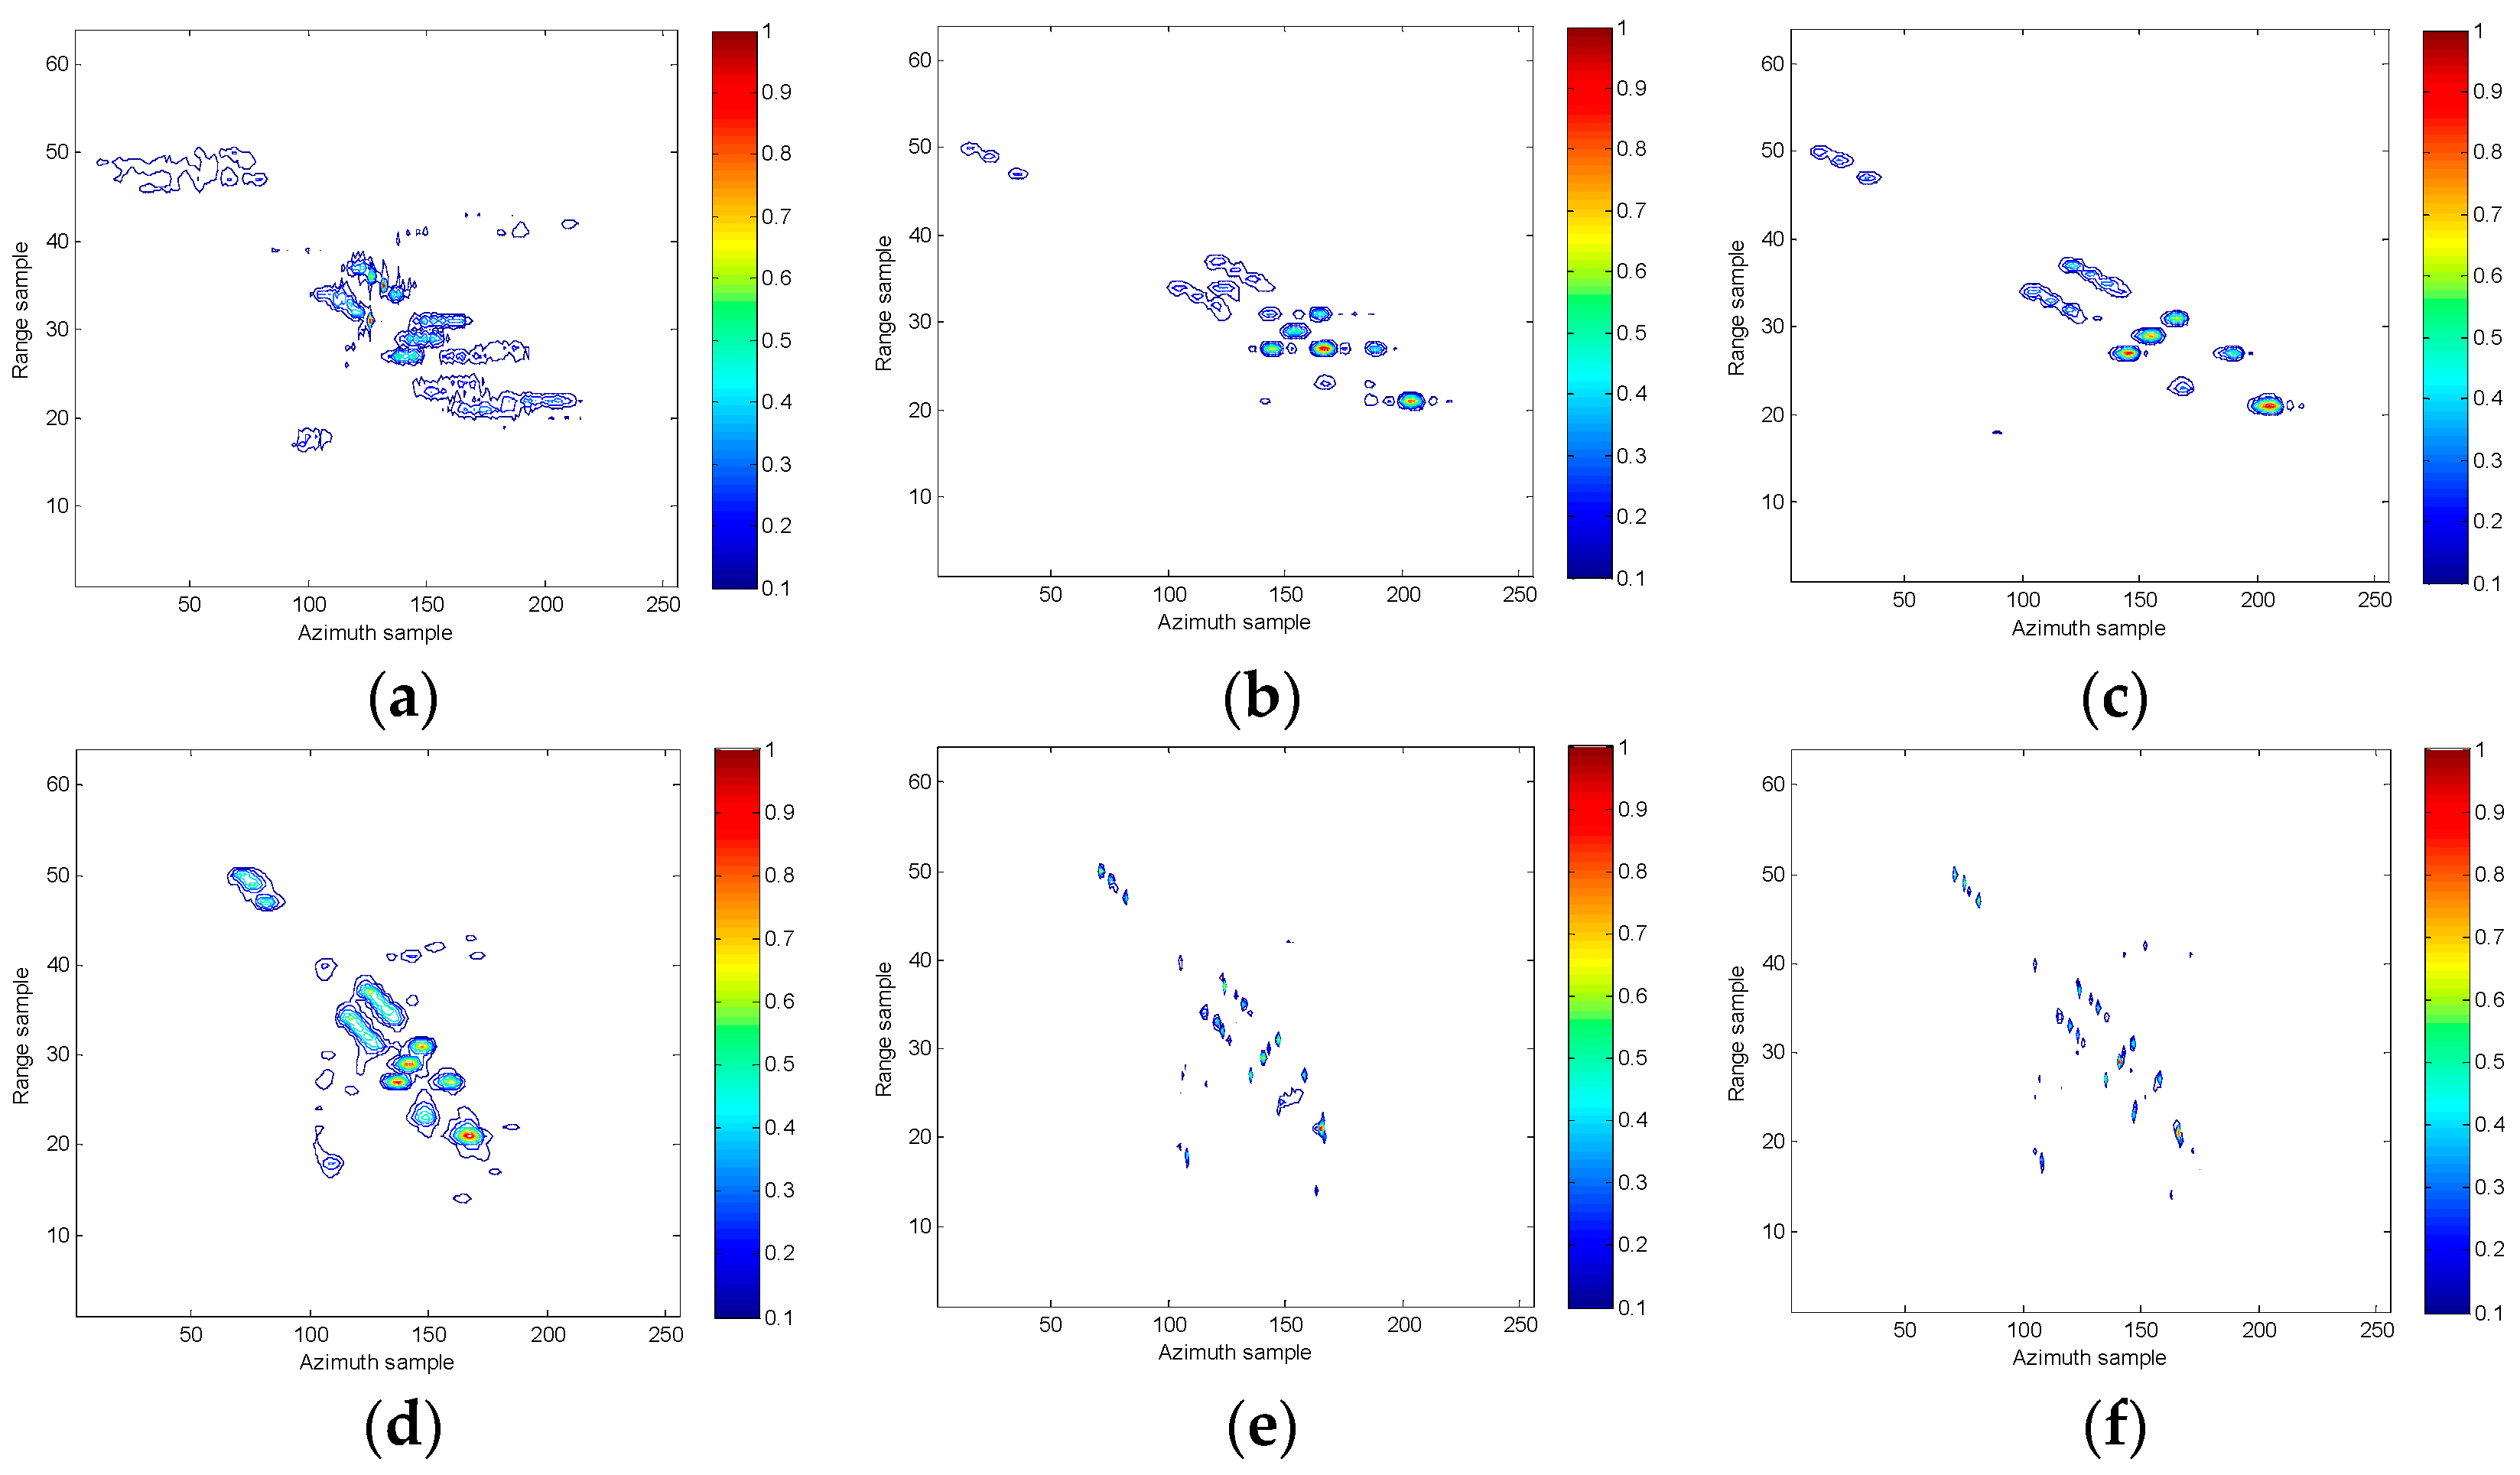
4.5. ISAR Imaging with Measured Data
In this subsection, the real data of a Boeing B727 airplane provided by the U.S. Naval Research Laboratory [
36,
37] are utilized to verify the validity of the proposed method. The range samples, azimuth samples, carrier, and bandwidth, respectively, are 64, 256, and 9 GHz, and 150 MHz. Now, suppose the range migration has been ideally corrected. The imaging result from the RD method is shown in
Figure 17a, in which the image is seriously defocused in the azimuth dimension. The imaging result from WVD is shown in
Figure 17b. It is clear that the ISAR image is smeared severely due to the impact of cross-terms and false values, providing less information for the structure of the non-cooperative space target. The ISAR imaging results based on SPWVD are presented in
Figure 17c. Here, some weak scatterers disappear, especially the wing and the tail of the airplane. Therefore, it is difficult to reconstruct the structure of the non-cooperative space accurately. The ISAR imaging results based on the STFT method have low resolution, as shown in
Figure 17d. Furthermore, in addition to the loss of some structural information, e.g., the wing information, the SST method can basically reconstruct the attitude of the targets, as presented in
Figure 17e. Finally, the ISAR imaging results of the proposed method are shown in
Figure 17f, where the structure of the target is clear compared with those in the RD, WVD, SPWVD, STFT, and SST results. To further quantitatively analyze the imaging quality, the image entropy, contrast, and imaging time are listed in
Table 6, respectively, where it is clear that the entropy of the ISAR images with the proposed method is relatively smaller and its contrast is relatively larger, indicating that the proposed approach may be more suitable for non-cooperative space target imaging. In addition, taking the trade-off between imaging performance and computational complexity into consideration, the proposed approach can be characterized as a more attractive candidate for non-cooperative space ISAR imaging in real applications.
5. Discussion
ISAR technology is a vital method for remote sensing thanks to its all-day, all-weather, and remote sensing abilities, and so on, which mean that it can obtain the two-dimensional or three-dimensional structures of targets, resulting in improved recognition and classification performance.
For cooperative targets with moderate motion, their Doppler frequencies are simple, so they can be estimated with conventional approaches, followed by high-resolution ISAR images. However, for non-cooperative targets with complex motion, their motion is accompanied by the characteristic of time-varying, e.g., an airplane with three-dimensional rotational motion. Therefore, the Doppler frequencies cannot be described and fitted with traditional linear characteristics, especially under low-SNR conditions, resulting in defocusing.
To obtain high-resolution ISAR images for non-cooperative targets under low-SNR conditions, the recovery of the corresponding time-varying Doppler frequencies is of great significance. Inspired by this characteristic, in this work, time–frequency analysis methods are adopted to retrieve the time-varying Doppler frequencies, and to generate high-quality ISAR images. However, for classical time–frequency analysis methods, e.g., short-time Fourier transform (STFT), WVD, and so on, the Doppler frequencies are modeled as low-order signals, resulting in some imperfections in the ISAR images, such as cross-term interference or low-resolution characteristics.
In this work, to retrieve the structure of non-cooperative targets with time-varying characteristics, an efficient ISAR imaging approach combining HoSST with MMSR is proposed. First, the geometry and signal models of non-cooperative space targets with complex motion are established. Second, the echoes in each range bin are modeled as multi-component phase signals after correcting the translational migration and migration through range cells (MTRCs). Additionally, the time–frequency analysis (TFA) method based on HoSST is utilized to obtain the time–frequency signal along the azimuth dimension, where the coarse ISAR image is obtained, followed by an enhancement of the image using the MMSR method. Finally, both simulated and measured data experiments are used to validate the effectiveness and robustness of the proposed method.
Up to now, the two-dimensional ISAR images of targets can be obtained. However, the structure information of two-dimensional ISAR images is deficient compared with that of three-dimensional ISAR images. In addition, the generation of two-dimensional images is heavily dependent on the radar line of sight, which is inconvenient in real applications. Therefore, as a promising research direction, three-dimensional ISAR imaging approach designs for non-cooperative targets under low-SNR conditions will receive increasing attention. As a continuation of this work, in the future, three-dimensional ISAR imaging for non-cooperative space targets is urgent.
6. Conclusions
In this paper, an effective ISAR imaging method for non-cooperative space targets based on high-order synchrosqueezing transform (HoSST) and MMSR is proposed. First, the geometry and signal model of non-cooperative space targets are established. Second, the echoes in each range bin are modeled as multi-component polynomial phase signals (MCPPSs) after conducting a translational compensation operation. Additionally, the time–frequency analysis (TFA) method based on HoSST is utilized to obtain the time–frequency signal along the azimuth direction, where the coarse ISAR image is obtained based on the quality indicator, followed by an enhancement of the image using MMSR. Finally, both simulated and real measured data are utilized to verify the effectiveness of the proposed approach.
Author Contributions
Conceptualization, Z.Y.; Methodology, Z.Y.; Software, D.L.; Validation, C.Z.; Formal analysis, Z.Y. and X.X.; Investigation, Z.Y., C.Z. and D.L.; Data curation, Z.Y. and D.L.; Writing—original draft, Z.Y.; Writing—review & editing, C.Z. and X.X.; Visualization, D.L. and X.X.; Supervision, C.Z. and D.L.; Project administration, C.Z.; Funding acquisition, X.X. All authors have read and agreed to the published version of the manuscript.
Funding
This work was supported in part by the Natural Science Foundation of Chongqing, China, grant No. CSTB2022NSCQ-BHX0713; in part by the National Key Research and Development Program of China under Grant 2021YFC3001903; in part by the National Natural Science Foundation of China under Grants U2133217 and 61971037; in part by the Foundation of China State Construction Engineering Corporation (CSCEC-2022-Z-4); and by the National Natural Science Foundation of China (62101036).
Institutional Review Board Statement
Not applicable.
Informed Consent Statement
Not applicable.
Data Availability Statement
Not applicable.
Conflicts of Interest
The authors declare no conflict of interest.
References
- Lazarov, A.; Minchev, C. ISAR geometry, signal model, and image processing algorithms. IET Radar Sonar Navig. 2017, 11, 1425–1434. [Google Scholar] [CrossRef]
- Yang, Z.; Li, D.; Tan, X.; Liu, H.; Liu, Y.; Liao, G. ISAR Imaging for Maneuvering Targets with Complex Motion Based on Generalized Radon-Fourier Transform and Gradient-Based Descent under Low SNR. Remote Sens. 2021, 13, 2198. [Google Scholar] [CrossRef]
- Bai, X.; Tao, R.; Wang, Z.; Wang, Y. ISAR Imaging of a Ship Target Based on Parameter Estimation of Multicomponent Quadratic Frequency-Modulated Signals. IEEE Trans. Geosci. Remote Sens. 2014, 52, 1418–1429. [Google Scholar] [CrossRef]
- Wang, B.; Cha, H.; Zhou, Z.; Tang, H.; Sun, L.; Du, B.; Zuo, L. An Iterative Phase Autofocus Approach for ISAR Imaging of Maneuvering Targets. Electronics 2021, 10, 2100. [Google Scholar] [CrossRef]
- Yang, Z.; Li, D.; Tan, X.; Liu, H.; Xu, L.; Liao, G. An Efficient ISAR Imaging Approach for Highly Maneuvering Targets Based on Subarray Averaging and Image Entropy. IEEE Trans. Geosci. Remote Sens. 2022, 60, 5102113. [Google Scholar] [CrossRef]
- Chen, C.-C.; Andrews, H.C. Target-Motion-Induced Radar Imaging. IEEE Trans. Aerosp. Electron. Syst. 1980, AES-16, 2–14. [Google Scholar] [CrossRef]
- Chen, V.C.; Miceli, W.J. Time-varying spectral analysis for radar imaging of manoeuvring targets. IEE Proc. Radar Sonar Navig. 1998, 145, 262–268. [Google Scholar] [CrossRef]
- Wang, Y.; Kang, J.; Jiang, Y. ISAR Imaging of Maneuvering Target Based on the Local Polynomial Wigner Distribution and Integrated High-Order Ambiguity Function for Cubic Phase Signal Model. IEEE J. Sel. Top. Appl. Earth Obs. Remote Sens. 2014, 7, 2971–2991. [Google Scholar] [CrossRef]
- Wang, Y.; Jiang, Y. ISAR Imaging of a Ship Target Using Product High-Order Matched-Phase Transform. IEEE Geosci. Remote Sens. Lett. 2009, 6, 658–661. [Google Scholar] [CrossRef]
- O’Shea, P.; Wiltshire, R.A. A New Class of Multilinear Functions for Polynomial Phase Signal Analysis. IEEE Trans. Signal Process. 2009, 57, 2096–2109. [Google Scholar] [CrossRef]
- Zheng, J.; Su, T.; Zhang, L.; Zhu, W.; Liu, Q.H. ISAR Imaging of Targets With Complex Motion Based on the Chirp Rate–Quadratic Chirp Rate Distribution. IEEE Trans. Geosci. Remote Sens. 2014, 52, 7276–7289. [Google Scholar] [CrossRef]
- Wang, Y.; Jiang, Y. Inverse Synthetic Aperture Radar Imaging of Maneuvering Target Based on the Product Generalized Cubic Phase Function. IEEE Geosci. Remote Sens. Lett. 2011, 8, 958–962. [Google Scholar] [CrossRef]
- Lv, Q.; Su, T.; He, X. An ISAR Imaging Algorithm for Nonuniformly Rotating Targets With Low SNR Based on Modified Bilinear Parameter Estimation of Cubic Phase Signal. IEEE Trans. Aerosp. Electron. Syst. 2018, 54, 3108–3124. [Google Scholar] [CrossRef]
- Du, Y.; Jiang, Y.; Wang, Y.; Zhou, W.; Liu, Z. ISAR Imaging for Low-Earth-Orbit Target Based on Coherent Integrated Smoothed Generalized Cubic Phase Function. IEEE Trans. Geosci. Remote Sens. 2020, 58, 1205–1220. [Google Scholar] [CrossRef]
- Xia, X.-G.; Wang, G.; Chen, V.C. Quantitative SNR analysis for ISAR imaging using joint time-frequency analysis-Short time Fourier transform. IEEE Trans. Aerosp. Electron. Syst. 2002, 38, 649–659. [Google Scholar] [CrossRef]
- Kim, K.T.; Choi, I.S.; Kim, H.T. Efficient radar target classification using adaptive joint time-frequency processing. IEEE Trans. Antennas Propag. 2000, 48, 1789–1801. [Google Scholar] [CrossRef]
- Thayaparan, T.; Brinkman, W.; Lampropoulos, G. Inverse synthetic aperture radar image focusing using fast adaptive joint time-frequency and three-dimensional motion detection on experimental radar data. IET Signal Process 2010, 4, 382–394. [Google Scholar] [CrossRef]
- Xing, M.D.; Wu, R.; Li, Y.; Bao, Z. New ISAR imaging algorithm based on modified Wigner-Ville distribution. IET Radar Sonar Navigat. 2009, 3, 70–80. [Google Scholar] [CrossRef]
- Zheng, B.; Sun, C.; Xing, M. Time-frequency approaches to ISAR imaging of maneuvering targets and their limitations. IEEE Trans. Aerosp. Electron. Syst. 2001, 37, 1091–1099. [Google Scholar] [CrossRef]
- Wu, Y.; Munson, D.C. Wide-angle ISAR passive imaging using smoothed pseudo Wigner-Ville distribution. In Proceedings of the 2001 IEEE Radar Conference (Cat. No.01CH37200), Atlanta, GA, USA, 3 May 2001; pp. 363–368. [Google Scholar] [CrossRef]
- Wang, Y.; Jiang, Y. ISAR Imaging of Maneuvering Target Based on the L-Class of Fourth-Order Complex-Lag PWVD. IEEE Trans. Geosci. Remote Sens. 2010, 48, 1518–1527. [Google Scholar] [CrossRef]
- Zang, B.; Zhu, M.; Zhou, X.; Zhong, L. Application of S-Transform in ISAR Imaging. Electronics 2019, 8, 676. [Google Scholar] [CrossRef]
- Li, D.; Liu, H.; Gui, X.; Zhang, X. An Efficient ISAR Imaging Method for Maneuvering Target Based on Synchrosqueezing Transform. IEEE Antennas Wirel. Propag. Lett. 2016, 15, 1317–1320. [Google Scholar] [CrossRef]
- Kong, L.; Zhang, W.; Zhang, S.; Zhou, B. Radon transform and the modified envelope correlation method for ISAR imaging of multi-target. In Proceedings of the 2010 IEEE Radar Conference, Arlington, VA, USA, 10–14 May 2010; pp. 637–641. [Google Scholar] [CrossRef]
- Wang, J.; Kasilingam, D. Global range alignment for ISAR. IEEE Trans. Aerosp. Electron. Syst. 2003, 39, 351–357. [Google Scholar] [CrossRef]
- Li, X.; Liu, G.; Ni, J. Autofocusing of ISAR images based on entropy minimization. IEEE Trans. Aerosp. Electron. Syst. 1999, 35, 1240–1252. [Google Scholar] [CrossRef]
- Cai, J.; Martorella, M.; Chang, S.; Liu, Q.; Ding, Z.; Long, T. Efficient Nonparametric ISAR Autofocus Algorithm Based on Contrast Maximization and Newton’s Method. IEEE Sens. J. 2021, 21, 4474–4487. [Google Scholar] [CrossRef]
- Perry, R.P.; DiPietro, R.C.; Fante, R.L. SAR imaging of moving targets. IEEE Trans. Aerosp. Electron. Syst. 1999, 35, 188–200. [Google Scholar] [CrossRef]
- Pham, D.-H.; Meignen, S. High-Order Synchrosqueezing Transform for Multicomponent Signals Analysis—With an Application to Gravitational-Wave Signal. IEEE Trans. Signal Process. 2017, 65, 3168–3178. [Google Scholar] [CrossRef]
- Liu, W.; Cao, S.; Wang, Z.; Jiang, K.; Zhang, Q.; Chen, Y. A Novel Approach for Seismic Time-Frequency Analysis Based on High-Order Synchrosqueezing Transform. IEEE Geosci. Remote Sens. Lett. 2018, 15, 1159–1163. [Google Scholar] [CrossRef]
- Noviello, C.; Fornaro, G.; Braca, P.; Martorella, M. Fast and Accurate ISAR Focusing Based on a Doppler Parameter Estimation Algorithm. IEEE Geosci. Remote Sens. Lett. 2017, 14, 349–353. [Google Scholar] [CrossRef]
- Wang, J.; Kasilingam, D.; Liu, X.; Zhou, Z. ISAR minimum-entropy phase adjustment. In Proceedings of the 2004 IEEE Radar Conference (IEEE Cat. No.04CH37509), Philadelphia, PA, USA, 29 April 2004; pp. 197–200. [Google Scholar] [CrossRef]
- Martorella, M.; Berizzi, F.; Haywood, B. Contrast maximization based technique for 2-D ISAR autofocusing. IEE Proc. Radar Sonar Navigat. 2005, 152, 253–262. [Google Scholar] [CrossRef]
- Liu, L.; Zhou, F.; Tao, M.L.; Sun, P.; Zhang, Z.J. Adaptive translational motion compensation method for ISAR imaging under low SNR based on particle swarm optimization. IEEE J. Sel. Topics Appl. Earth Observ. Remote Sens. 2015, 8, 5146–5157. [Google Scholar] [CrossRef]
- Wang, B.B.; Xu, S.Y.; Wu, W.Z.; Hu, P.J.; Chen, Z.P. Adaptive ISAR imaging of maneuvering targets based on a modified Fourier transform. Sensors 2018, 18, 1370. [Google Scholar] [CrossRef] [PubMed]
- Lv, Y.; Wu, Y.; Wang, H.; Qiu, L.; Jiang, J.; Sun, Y. An Inverse Synthetic Aperture Ladar Imaging Algorithm of Maneuvering Target Based on Integral Cubic Phase Function-Fractional Fourier Transform. Electronics 2018, 7, 148. [Google Scholar] [CrossRef]
- Ruan, H.; Wu, Y.; Jia, X.; Ye, W. Novel ISAR Imaging Algorithm for Maneuvering Targets Based on a Modified Keystone Transform. IEEE Geosci. Remote Sens. Lett. 2014, 11, 128–132. [Google Scholar] [CrossRef]
Figure 1.
General geometry model for a ship target with complex motion.
Figure 1.
General geometry model for a ship target with complex motion.
Figure 2.
Flowchart of the proposed method.
Figure 2.
Flowchart of the proposed method.
Figure 3.
Time–frequency diagram of mixed signals. (a) Time domain characteristics of mixed signals. (b) Instantaneous frequency characteristics of mixed signals. (c) WVD method. (d) STFT method. (e) SST method. (f) HoSST method.
Figure 3.
Time–frequency diagram of mixed signals. (a) Time domain characteristics of mixed signals. (b) Instantaneous frequency characteristics of mixed signals. (c) WVD method. (d) STFT method. (e) SST method. (f) HoSST method.
Figure 4.
Space target scatter model of ISAR imaging.
Figure 4.
Space target scatter model of ISAR imaging.
Figure 5.
RD-method ISAR imaging results: (a) SNR = 5 dB; (b) SNR = –5 dB.
Figure 5.
RD-method ISAR imaging results: (a) SNR = 5 dB; (b) SNR = –5 dB.
Figure 6.
WVD-method ISAR imaging results: (a) SNR = 5 dB; (b) SNR = –5 dB.
Figure 6.
WVD-method ISAR imaging results: (a) SNR = 5 dB; (b) SNR = –5 dB.
Figure 7.
STFT-method ISAR imaging results: (a) SNR = 5 dB; (b) SNR = –5 dB.
Figure 7.
STFT-method ISAR imaging results: (a) SNR = 5 dB; (b) SNR = –5 dB.
Figure 8.
SST-method ISAR imaging results: (a) SNR = 5 dB; (b) SNR = –5 dB.
Figure 8.
SST-method ISAR imaging results: (a) SNR = 5 dB; (b) SNR = –5 dB.
Figure 9.
The ISAR imaging results obtained using the proposed method: (a) SNR = 5 dB; (b) SNR = –5 dB.
Figure 9.
The ISAR imaging results obtained using the proposed method: (a) SNR = 5 dB; (b) SNR = –5 dB.
Figure 10.
Performance comparison. (a) Image entropy results of different imaging methods versus SNR. (b) Image contrast of different imaging methods versus SNR.
Figure 10.
Performance comparison. (a) Image entropy results of different imaging methods versus SNR. (b) Image contrast of different imaging methods versus SNR.
Figure 11.
Computational complexity of different methods against SNR.
Figure 11.
Computational complexity of different methods against SNR.
Figure 12.
ISAR imaging results with the RD, WVD, STFT, and SST methods and the proposed method in the three cases.
Figure 12.
ISAR imaging results with the RD, WVD, STFT, and SST methods and the proposed method in the three cases.
Figure 13.
RAV, RAA, and RAR under different coherence processing intervals.
Figure 13.
RAV, RAA, and RAR under different coherence processing intervals.
Figure 14.
Imaging results of different methods against velocity. (a) RD method. (b) WVD method. (c) STFT method. (d) SST method. (e) Proposed method.
Figure 14.
Imaging results of different methods against velocity. (a) RD method. (b) WVD method. (c) STFT method. (d) SST method. (e) Proposed method.
Figure 15.
Shadowing and not shadowing time.
Figure 15.
Shadowing and not shadowing time.
Figure 16.
Imaging results of different methods under shadowing condition. (a) RD method. (b) WVD method. (c) STFT method. (d) SST method. (e) Proposed method.
Figure 16.
Imaging results of different methods under shadowing condition. (a) RD method. (b) WVD method. (c) STFT method. (d) SST method. (e) Proposed method.
Figure 17.
The image results of B727. (a) ISAR image based on RD. (b) ISAR image based on WVD. (c) ISAR image based on SPWVD. (d) ISAR image based on STFT. (e) ISAR image based on SST. (f) ISAR image based on HOSST.
Figure 17.
The image results of B727. (a) ISAR image based on RD. (b) ISAR image based on WVD. (c) ISAR image based on SPWVD. (d) ISAR image based on STFT. (e) ISAR image based on SST. (f) ISAR image based on HOSST.
Table 1.
Radar system and target motion parameters.
Table 1.
Radar system and target motion parameters.
| Parameter Name | Value |
|---|
| Carrier frequency | 10 GHz |
| Transmit bandwidth | 200 MHz |
| Pulse repetition | 300 Hz |
| Range sample frequency | 300 MHz |
| Effective echo pluses | 256 |
| Rotational angular velocity | 0.022 rad/s |
| Rotational angular acceleration | 0.012 rad/s2 |
| Rotational angular acceleration rate | 0.015 rad/s3 |
Table 2.
Different motion parameters against the three cases.
Table 2.
Different motion parameters against the three cases.
| | Velocity | Rotational Angular Velocity
(rad/s) | Rotational Angular Acceleration
(rad/s2) | Rotational Angular Acceleration Rate
(rad/s3) |
|---|
| Case | |
|---|
| Case One | 0.05 | 0.05 | 0.015 |
| Case Two | 0.04 | 0.02 | 0.01 |
| Case Three | 0.04 | 0.05 | 0.01 |
Table 3.
Entropy and contrast in the three cases.
Table 3.
Entropy and contrast in the three cases.
| Method | Case One | Case Two | Case Three |
|---|
| Entropy | Contrast | Entropy | Contrast | Entropy | Contrast |
|---|
| RD | 10.634 | 0.758 | 10.704 | 0.742 | 10.87 | 0.745 |
| WVD | 9.474 | 1.352 | 9.612 | 1.327 | 9.458 | 1.376 |
| STFT | 10.657 | 0.777 | 10.677 | 0.776 | 10.671 | 0.776 |
| SST | 6.053 | 12.532 | 6.12 | 12.186 | 6.095 | 12.378 |
| Proposed method | 4.197 | 16.362 | 3.897 | 17.317 | 3.91 | 16.68 |
Table 4.
Entropy and contrast of the different results.
Table 4.
Entropy and contrast of the different results.
| Method | Entropy | Contrast |
|---|
| RD method | 10.4461 | 0.7979 |
| WVD method | 9.4833 | 1.3691 |
| STFT method | 10.7457 | 0.7540 |
| SST method | 6.1907 | 11.7239 |
| Proposed method | 4.283 | 15.890 |
Table 5.
The entropy and contrast of different methods.
Table 5.
The entropy and contrast of different methods.
| Method | Entropy | Contrast |
|---|
| RD method | 10.6857 | 0.7644 |
| WVD method | 9.1565 | 1.5103 |
| STFT method | 10.5491 | 0.8204 |
SST
method | 5.8319 | 14.5779 |
| HOSST method | 4.1358 | 16.378 |
Table 6.
Image entropy and contrast of different methods.
Table 6.
Image entropy and contrast of different methods.
| Method | Entropy | Contrast | Time(s) |
|---|
| RD method | 6.6428 | 2.3968 | 0.668 |
WVD
method | 5.2811 | 4.4691 | 0.764 |
| SPWVD method | 4.9003 | 6.8133 | 6.822 |
STFT
method | 5.8855 | 3.6353 | 0.716 |
SST
method | 3.8223 | 10.5464 | 4.541 |
| Proposed method | 3.4621 | 11.7636 | 4.045 |
| Disclaimer/Publisher’s Note: The statements, opinions and data contained in all publications are solely those of the individual author(s) and contributor(s) and not of MDPI and/or the editor(s). MDPI and/or the editor(s) disclaim responsibility for any injury to people or property resulting from any ideas, methods, instructions or products referred to in the content. |
© 2023 by the authors. Licensee MDPI, Basel, Switzerland. This article is an open access article distributed under the terms and conditions of the Creative Commons Attribution (CC BY) license (https://creativecommons.org/licenses/by/4.0/).


