Article

Analysis of Electromagnetic Interference for Anti-Medal UHF RFID Temperature Tag in High Power Electronic Equipment

1
State Grid Hunan Electric Power Co., Ltd., Changsha 410004, China
2
Three Gorges Intelligent Industrial Control Technology Co., Ltd., Wuhan 430070, China
3
School of Automation, Wuhan University of Technology, Wuhan 430070, China
*
Author to whom correspondence should be addressed.
Electronics 2023, 12(17), 3577; https://doi.org/10.3390/electronics12173577
Submission received: 30 June 2023 / Revised: 3 August 2023 / Accepted: 5 August 2023 / Published: 24 August 2023

Abstract

:
Being inches from the rapid development of new energy technology, the capacity of high-power power electronic equipment is increasing rapidly, and the requirements for its safe and reliable operation are also rising. As a result, the demand for online temperature monitoring of such equipment is becoming increasingly urgent. RFID temperature measurement technology can be used for real-time monitoring of the temperature of powered operation equipment. However, the operation of high-power electronic equipment generates strong electromagnetic interference, which can seriously affect the normal operation of RFID temperature measurement systems. For applications involving the internal temperature measurement of high-power power electronic equipment, this paper employs an RFID anti-metal temperature tag antenna with a short-circuit cutoff structure. This structure was tested in an excitation switchgear cabinet. During the low-power operation of the cabinet, the temperature tag functioned normally. By combining an RFID antenna model with an electromagnetic interference simulation model of the main circuit of the excitation switchgear cabinet, this paper establishes an electromagnetic interference simulation model for an RFID temperature tag. It analyzes how the tag’s antenna performance parameters change when subjected to interference. Through simulation, the failure mechanism of the RFID temperature tag during the high-power operation of the excitation switchgear cabinet is clarified. The analysis found that there are both conductive electromagnetic interference and radiated electromagnetic interference in the excitation switchgear cabinet, with the conductive electromagnetic interference having a more significant effect. Conductive electromagnetic interference can seriously impact the performance of RFID temperature tags in the excitation switchgear cabinet, significantly degrading their performance. In contrast, the effect of radiated electromagnetic interference on the tags is relatively small. Therefore, this paper employs anti-metal RFID temperature tags and simulates and analyzes their electromagnetic interference characteristics.

1. Introduction

When RFID technology is used for online temperature monitoring of power equipment, it is critical to ensure that the performance of each component of the RFID temperature measurement system remains within normal ranges. This includes factors such as the communication distance between the RFID temperature measurement tag and the reader, as well as the signal power transmitted and received [1]. However, the main factors affecting the communication distance and signal power of an RFID temperature measurement system are the degree of impedance matching between the RFID tag antenna and chip, the signal strength of the RFID tag and reader, and the radiation efficiency of the RFID tag [2]. The vast majority of power equipment in power systems is made of metal. When RFID RF signals encounter metal during transmission, they experience shielding effects such as reflection and attenuation, generating interference signals. When interference signals are superimposed on RFID RF signals, temperature measurement signal transmission can fail. Metal power equipment can also couple with RFID tags, damaging the impedance matching between the RFID tag antenna and chip. Therefore, power equipment can impact the normal operation of RFID temperature measurement systems. In addition, when an RFID temperature measurement system operates in a high-current, high-voltage environment with strong electromagnetic fields, such as in a power system, the complex radiation interference generated by power equipment at various frequencies can interfere with the RF signals of the RFID temperature measurement system. The conductive interference generated by power equipment containing parasitic parameters can also affect the impedance matching of the RFID temperature measurement system [3]. Therefore, studying the effects of electromagnetic interference from high-power power electronic equipment on the performance of RFID temperature measurement systems is of great significance for applying RFID temperature measurement systems to power equipment.
At present, improving and optimizing most RFID temperature measurement systems often requires modifying hardware circuits, which not only increases the costs of RFID temperature measurement systems but also hinders their widespread application. Wang X et al. designed a remote temperature measurement system based on commercial RFID tags named RF thermometer, as shown in Figure 1 [4]. This system uses tensor complementation to reconstruct missing phases and a Gaussian process model to construct a phase-temperature map. When the system is online, an unknown temperature is predicted using a greedy algorithm based on dynamic time warping (DTW). The RFID temperature measurement system using this method greatly improves temperature measurement accuracy [5].
Wang L et al. researchers proposed a fast segmentation algorithm adapted to the time slot state and RFID security authentication protocol for monitoring the temperature and fault state of distribution equipment such as high-voltage switchgear, high-voltage ring-net cabinets, and capacitor banks during temperature monitoring of distribution equipment, which improved the RFID temperature measurement system for distribution equipment monitoring efficiency and reliability [6]. Zhang Y et al. researchers based on RFID temperature online monitoring system, through anti-interference technology and automatic control technology, etc., to achieve real-time online monitoring of smart grid equipment temperature, completely solved the problem of acoustic surface wave temperature measurement and misinterpretation of the same frequency and the interference problem of acoustic surface wave temperature detection, as well as the problem of change and false alarm [7]. A self-powered RFID temperature sensor tag was designed to measure and process the temperature of high-voltage equipment in substations for online temperature monitoring applications and then for wireless data transmission, achieving a maximum communication distance of 11.8 m [8]. Similarly, a foreign researcher proposed an ultra-high frequency (UHF) passive sensing tag for grid and substation temperature monitoring, which achieved a sensitivity of −12.3 dBm and good metal resistance [9]. In China, Wei Zhou et al. used RFID temperature measurement technology to achieve passive wireless temperature monitoring of hollow reactors, and the signal shielding, eddy current temperature rise, and electromagnetic interference of the hollow reactor to the RFID system were fused with simulation and test, and the final test showed that the RFID temperature monitoring system installed inside the reactor can effectively perform temperature monitoring work, and itself is not affected by various interference of the reactor [10]. Wu Xiang et al. combined the surface acoustic wave (SAW) technology with RFID technology to form an online temperature monitoring system based on SAW-RFID technology, and also conducted temperature measurement tests on XLPE cables based on this system, and their test results were consistent with those of thermocouples [11]. Xu Changying et al. similarly carried out the design of online temperature monitoring of high-voltage switchgear based on SAW-RFID technology, which improved the means of temperature monitoring of high-voltage switchgear and ensured the safe and stable operation of the switchgear [12]. Yu Jianyang and other researchers realized the passive wireless temperature measurement of primary equipment based on RFID temperature measurement technology [13]. Thus, it can be seen that RFID temperature measurement technology is widely used in online temperature monitoring of power equipment at home and abroad.
The performance of RFID systems depends on the ability of RFID readers to accurately decode the RF signals backscattered from RFID tags [14]. However, RFID systems have their own weaknesses: (1) limited tuning capability of RFID tags; (2) backscattered signals are weakened more compared to energized signals, and these defects lead to higher sensitivity to interference. Therefore, when RFID technology is applied to the temperature online monitoring of power equipment, the complex environment in which the power equipment is located also makes the RFID temperature measurement system highly susceptible to electromagnetic interference, metal interference [15], and collision conflict [16] and other uncertain factors interference, thus making the performance of the RFID temperature measurement system degrade or even suffer damage. Foreign scholars have pointed out in the literature that the high-speed switch of the electronic ballast-driven fluorescent lamp (EBFL) modulates and reflects the incident signal in a similar way to the modulated backscattered link signal and it also has a half dipole mode similar to the UHF RFID tag, while the spectrum of the EBFL modulated backscattered signal falls within the frequency band of the RFID tag signal, forming a strong source of interference, at which time it not only interferes with the RFID system’s backscatter link, but also will affect the reception of the backscattered signal by the RFID reader [17,18]. Currently, most of the unattended power stations and other production areas where RFID temperature measurement systems are installed have different forms of reflected interference to affect the normal work of RFID temperature measurement systems. Ryoma Take et al. designed a new microwave absorber for improving the working environment of RFID systems and suppressing the effects of electromagnetic interference on RFID systems [19,20].
A new foreign PIFA RFID anti-metal tag, which was applied to different metal plates, worked well and effectively suppressed the skin-collecting and standing wave effects of electromagnetic waves on metal conductors [21]. In China, the monitoring system of substation equipment node temperature also uses radio frequency identification (RFID) temperature measurement technology, which integrates the temperature sensor of the ceramic substrate and RFID technology to solve the power supply and communication problems caused by the electromagnetic interference of temperature monitoring equipment inside the substation [22]. Domestic researchers have also studied and designed UHF_RFID anti-metal tag antennas [23], explored the anti-collision problem of RFID system links, and effectively solved the collision problem of RFID tags [24]. The various problems encountered during the monitoring of power equipment by the above RFID temperature measurement system urgently need more attention and solutions, and the anti-collision technology of the RFID system will surely become the focus of future development.
The electromagnetic interference and interaction generated by the high current and high voltage of power equipment and various switching frequencies of high-power power electronic equipment make the power system a strong electromagnetic environment with a dense distribution of strong and weak power equipment [25]. With the increasing number of high-power power electronic equipment and the rapid improvement of equipment performance, the resulting electromagnetic interference becomes more and more serious, which also makes the electromagnetic interference and electromagnetic compatibility problems of power systems receive more and more attention and attention [26]. The problem of electromagnetic interference was first proposed in 1881 by the British scientist Heaviside, usually high-power power electronic equipment radiation electromagnetic interference generated by its own special structure or radiation body, may cause electronic or communication devices, equipment, or system performance degradation or even failure, but also may cause damage to other living or non-living tissue [27] when high-power power electronic equipment working in the low-frequency band The electromagnetic interference is mainly conducted electromagnetic interference [28]. Researchers in Japan have studied and analyzed the electromagnetic interference in DC-DC power converters, and found that the very high voltage variation dv/dt in the switching devices is prone to common mode interference, the parasitic capacitance formed between the switching device and the ground plane provides a conduction path for common mode interference, and the structure of some switching devices also determines the size of the parasitic capacitance [29].
The higher switching frequencies in wireless power transfer (WPT) systems for electric vehicles (EVs) also provide a source of electromagnetic interference from surrounding devices [30]. Mississippi State University (MSU) analyzed system-level EMI-common mode electromagnetic interference (EMI) from wide-bandgap (WB) power switching in medium-voltage power electronics applications and effectively reduced EMI effects with new circuit configurations and mitigation techniques [31]. European researchers have studied and analyzed the electromagnetic interference of heatsinks on printed circuit boards (PCBs), and the literature states that the shape and size of a heatsink made of metal allows it to generate near-field and far-field radiation such as an antenna and that heatsinks of different shapes and sizes generate radiated electromagnetic interference at different frequencies, which in turn affects the operating performance of the electronic circuits or communication systems around it [32].
With the emergence of the domestic semiconductor industry, the power level of devices has increased and the switching speed has accelerated, and the electromagnetic interference caused by the switching process has become more and more prominent. Based on this, Jia Shengyu et al. of Tsinghua University modeled and studied the electromagnetic pulse in power electronic systems, the distribution and variation of the electromagnetic field in power devices, and space during switching transients from the perspective of energy pulse and electromagnetic field transient processes [33]. Cao, Haiyang, et al. designed an EMI filter for a high-power dual three-level inverter speed control system, which resulted in a significant reduction of electromagnetic interference through detailed analysis of high-frequency interference and common-mode conducted interference in the circuit [34]. The research team of Huazhong University of Science and Technology proposed a method for suppressing EMI between equipment based on heatsink floating ground, which effectively solves the problem of conducted EMI between the equipment and its resulting resonance, based on the characteristic that the EMI generated by the inverter in DC power supply system under different operating conditions will interact with that of another inverter [35]. Thus, it can be seen that the electromagnetic interference problem of high-power power electronic equipment in power systems cannot be ignored, and how to carry out the suppression and protection of electromagnetic interference of high-power power electronic equipment will be an important research direction in the field of electromagnetic compatibility in the future.

2. RFID Temperature Measurement Tags with Metal-Resistant Design

2.1. The Metal Effect of RFID Temperature Measurement Tags

In power equipment condition monitoring, RFID temperature tags are generally attached to the surface of power equipment for temperature measurement, and these power equipment are good conductors of electricity (σ/ωε ≫ 1). In metal conductors, the displacement current has little effect, and the main role is played by the conduction current. There is
α β ω μ σ 2
where α is the attenuation constant, β is the phase constant, ω is the angular frequency of the electromagnetic wave, σ is the dielectric conductivity, μ is the dielectric permeability, and ε is the dielectric permittivity. It can be seen that the attenuation constant α of electromagnetic waves in a good conductor will become larger with the increase of the angular frequency ω, dielectric permittivity σ, and dielectric permeability μ, which will lead to the decay of UHF electromagnetic waves in a good conductor quite fast, and almost all of them will be decayed after a certain distance, which will lead to the skin effect of electromagnetic waves on the metal surface.
As shown in Figure 2, when the RFID temperature measurement system works in a metal environment, the RFID reader will be attached to the metal surface of the RFID temperature tag to send ultra-high frequency electromagnetic waves. Due to the skin effect, electromagnetic waves will not be able to pass through the metal surface, so the electromagnetic waves reaching the metal surface will all be reflected back to form a reflected wave, at this time the incident wave and the reflected wave will produce interference between the phenomenon, the formation of standing waves between the RFID temperature tag and RFID reader, thus seriously affecting the reception of the signal RFID temperature tag.
In addition to the skin effect of the metal, the surface impedance of the metal conductor may also produce a mutual coupling effect with the impedance of the RFID tag antenna, which will cause the antenna to produce coupling impedance, change the original impedance of the antenna, so that the original impedance matching of the antenna is out of tune, which will largely affect the performance of the antenna.
In summary, the RFID temperature tag attached to the metal plane work, the RFID temperature measurement system emitted by the electromagnetic wave encountered metal, the skin effect, the RFID temperature tag, and the metal surface mutual coupling effect will be collectively referred to as the RFID temperature tag metal effect.

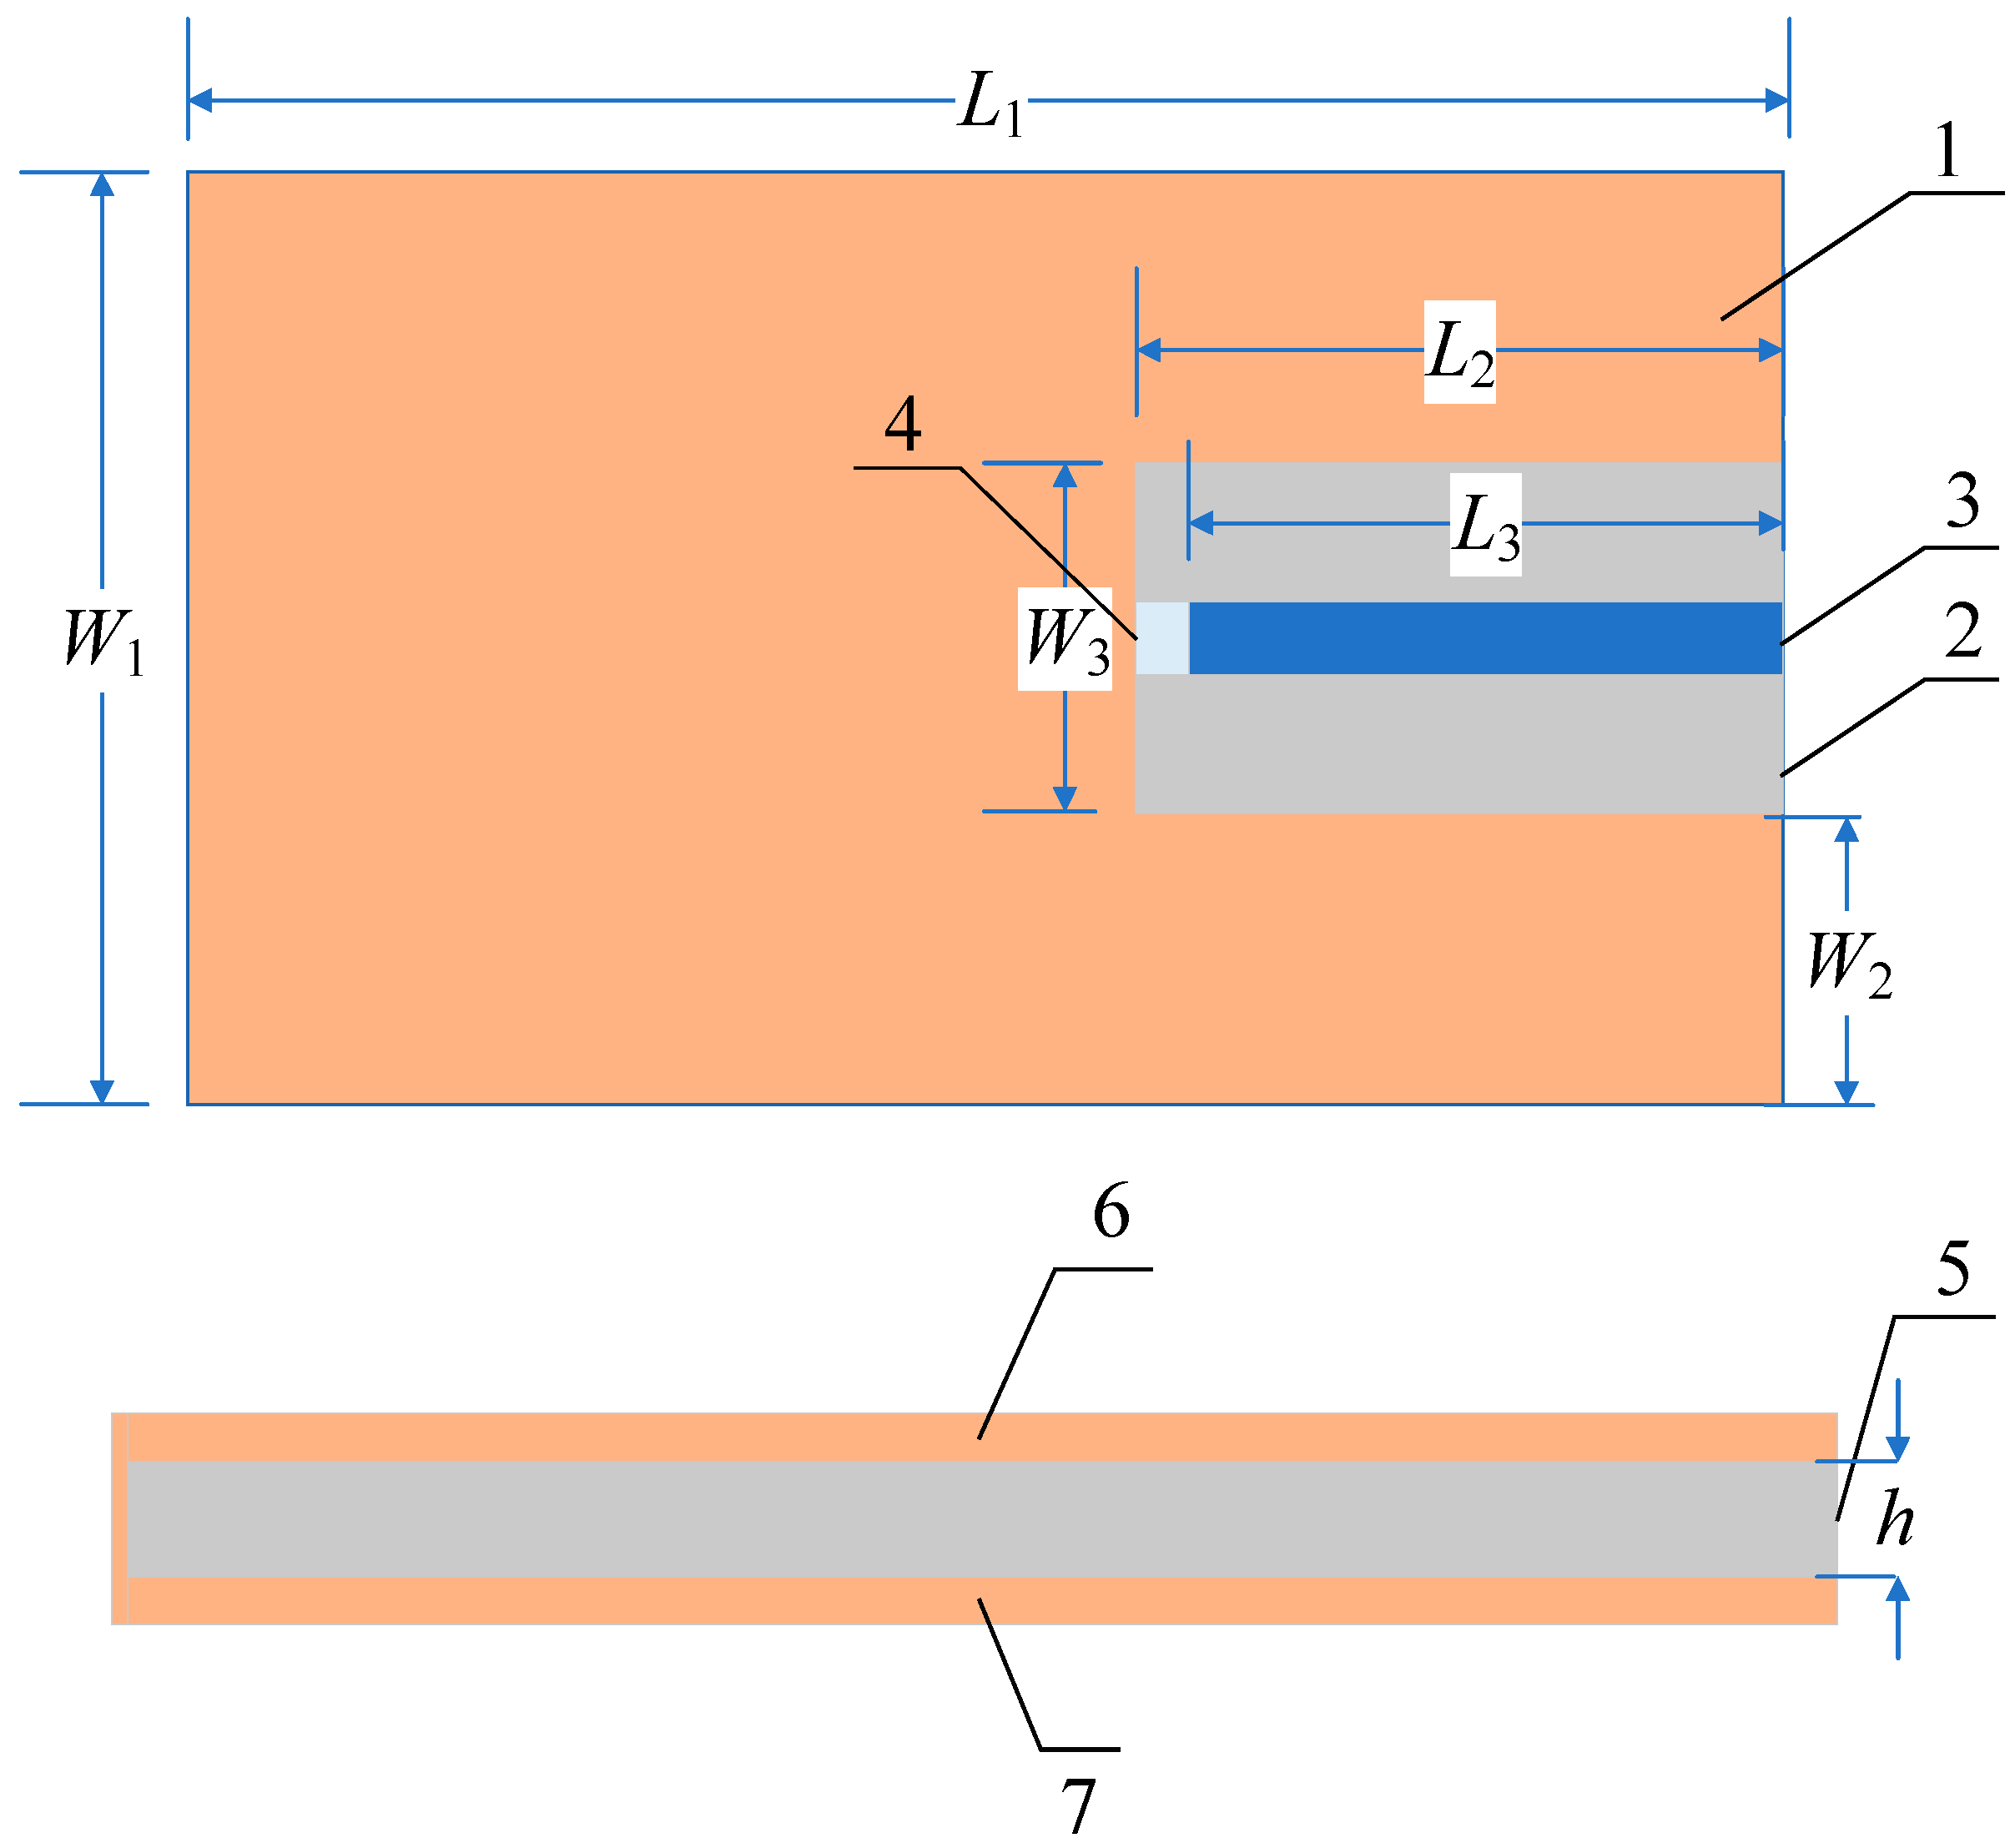
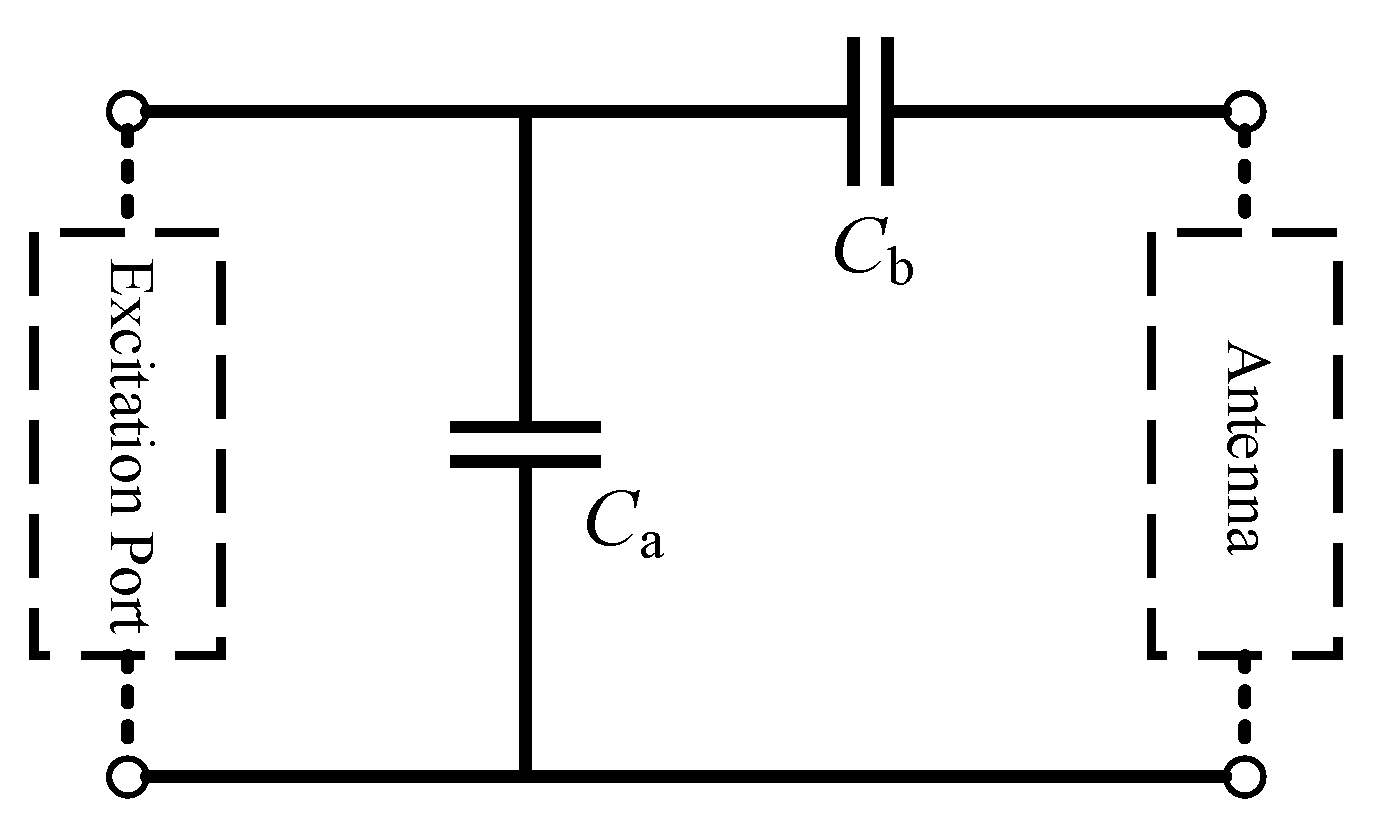
2.2. Design of RFID Anti-Metal Tag

According to the mechanism of RFID temperature tag interference by metal effect, this paper designs a new anti-metal RFID tag antenna based on short-circuit short-cut wire structure, as shown in Figure 3, the antenna adopts the planar rectangular patch scheme, with a planar microstrip line as the antenna feed, using copper as the conductor material of antenna radiation, and choosing 1.6 mm thick double-sided copper-clad FR4 board as the dielectric substrate; where, 1 and 6 are antenna patch, 2 and 5 are FR4 dielectric substrate, 3 is microstrip line, 4 is planar microstrip feed, and 7 is metal ground; antenna size L1 is 87.4 mm, L2 is 25 mm, L3 is 24 mm, W1 is 38 mm, W2 is 10.75 mm, W3 is 16.5 mm, and h is 1.6 mm.

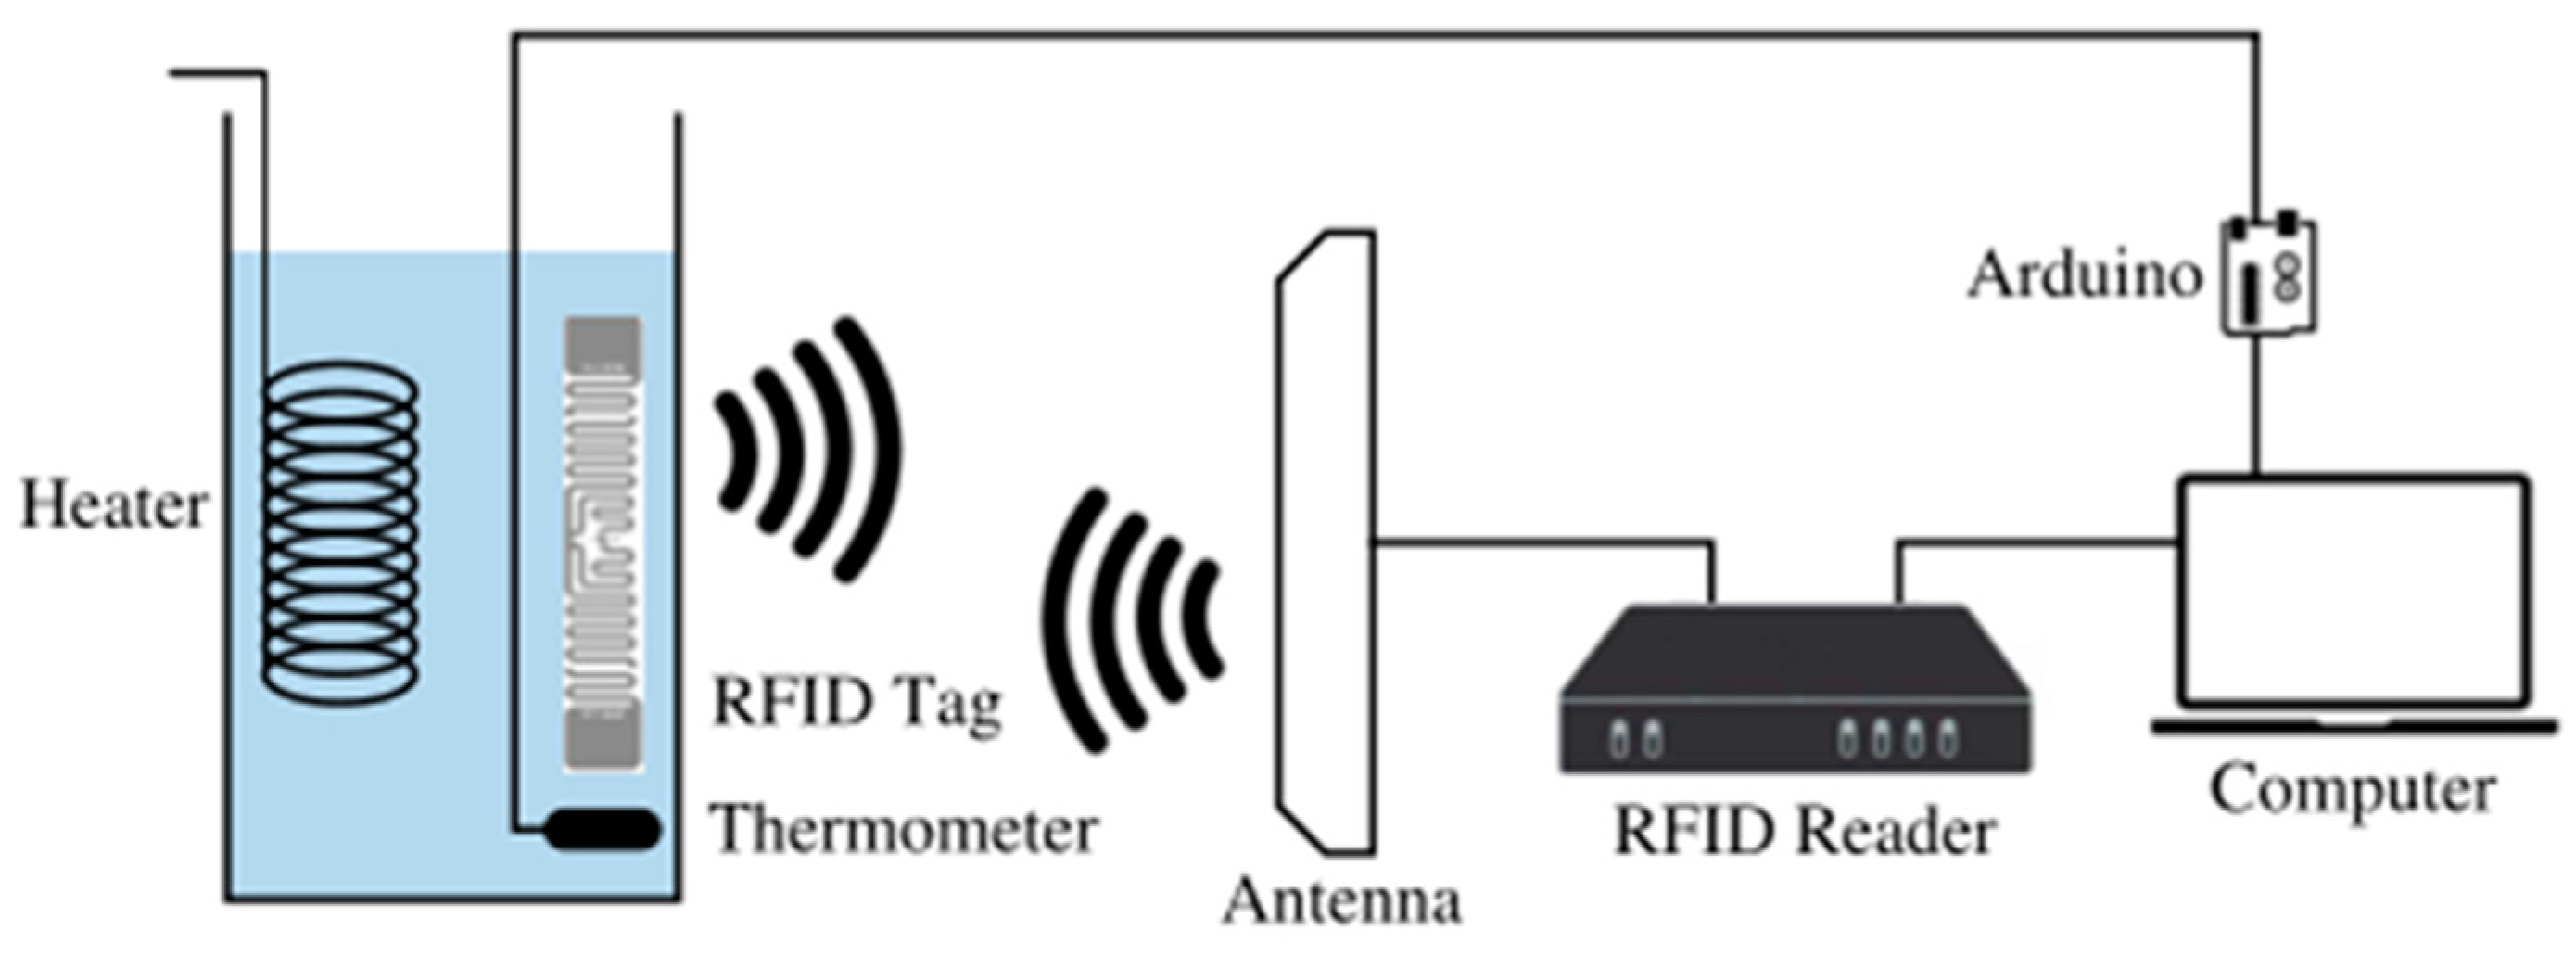
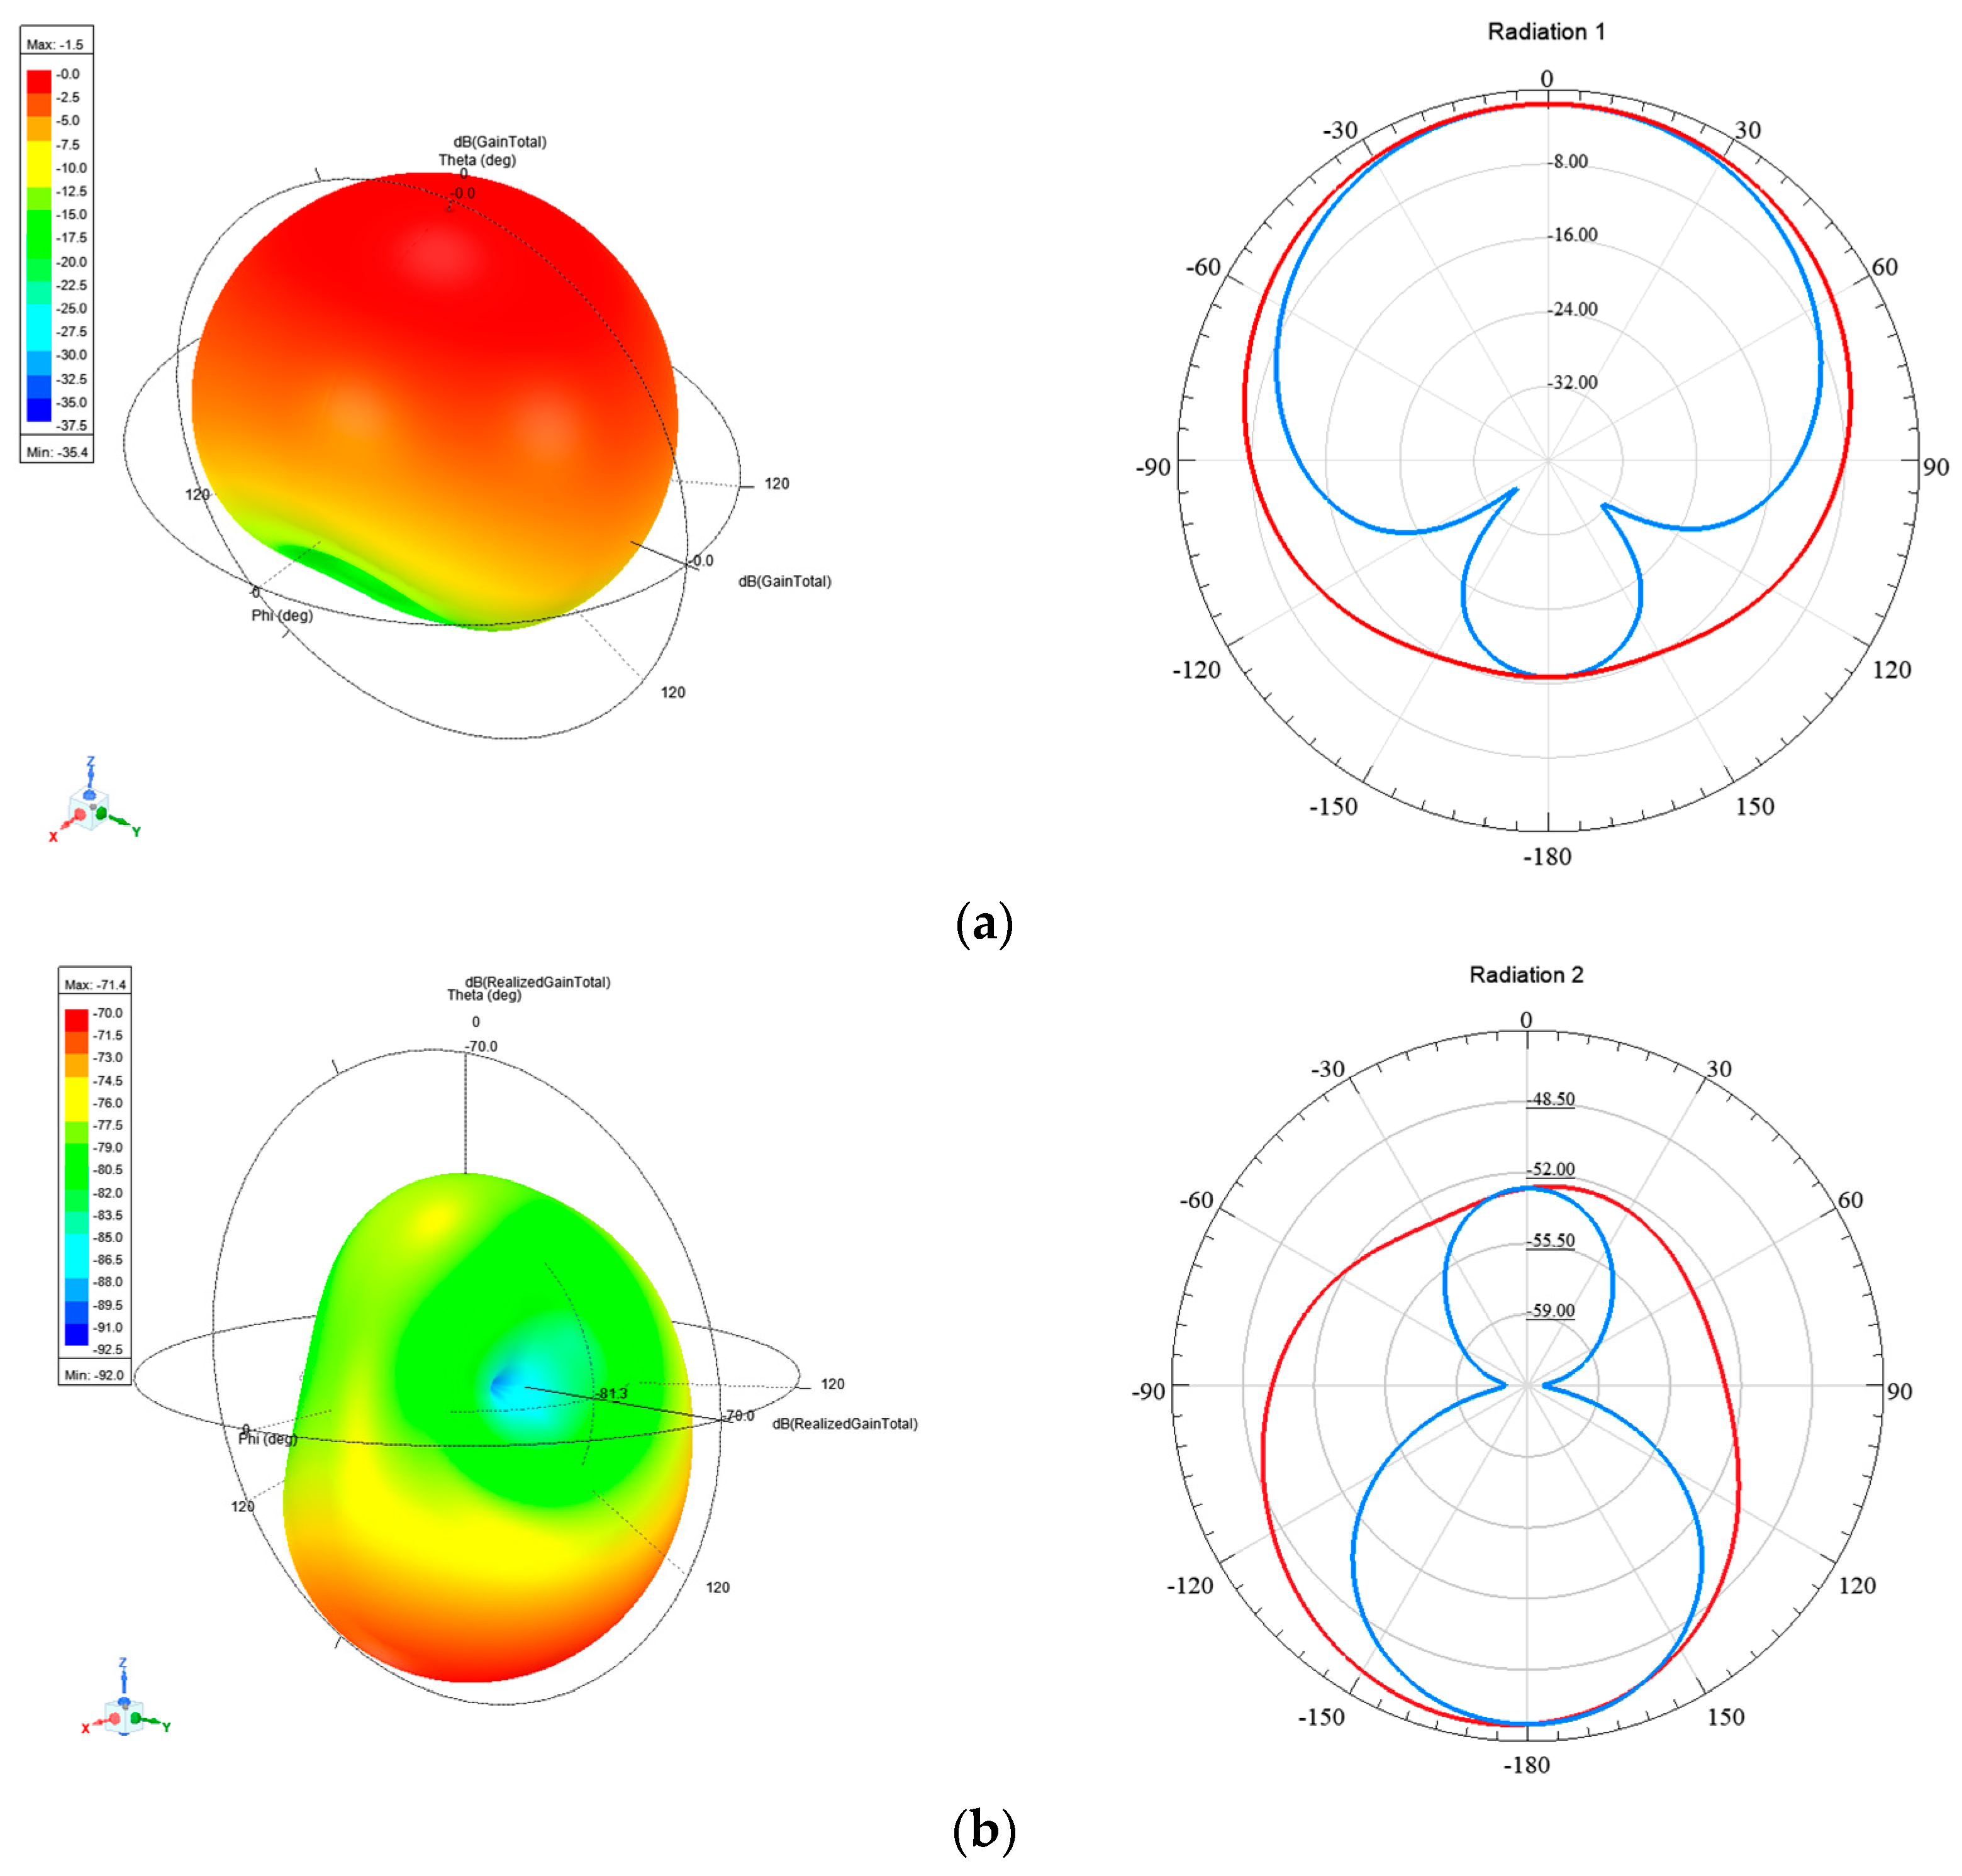
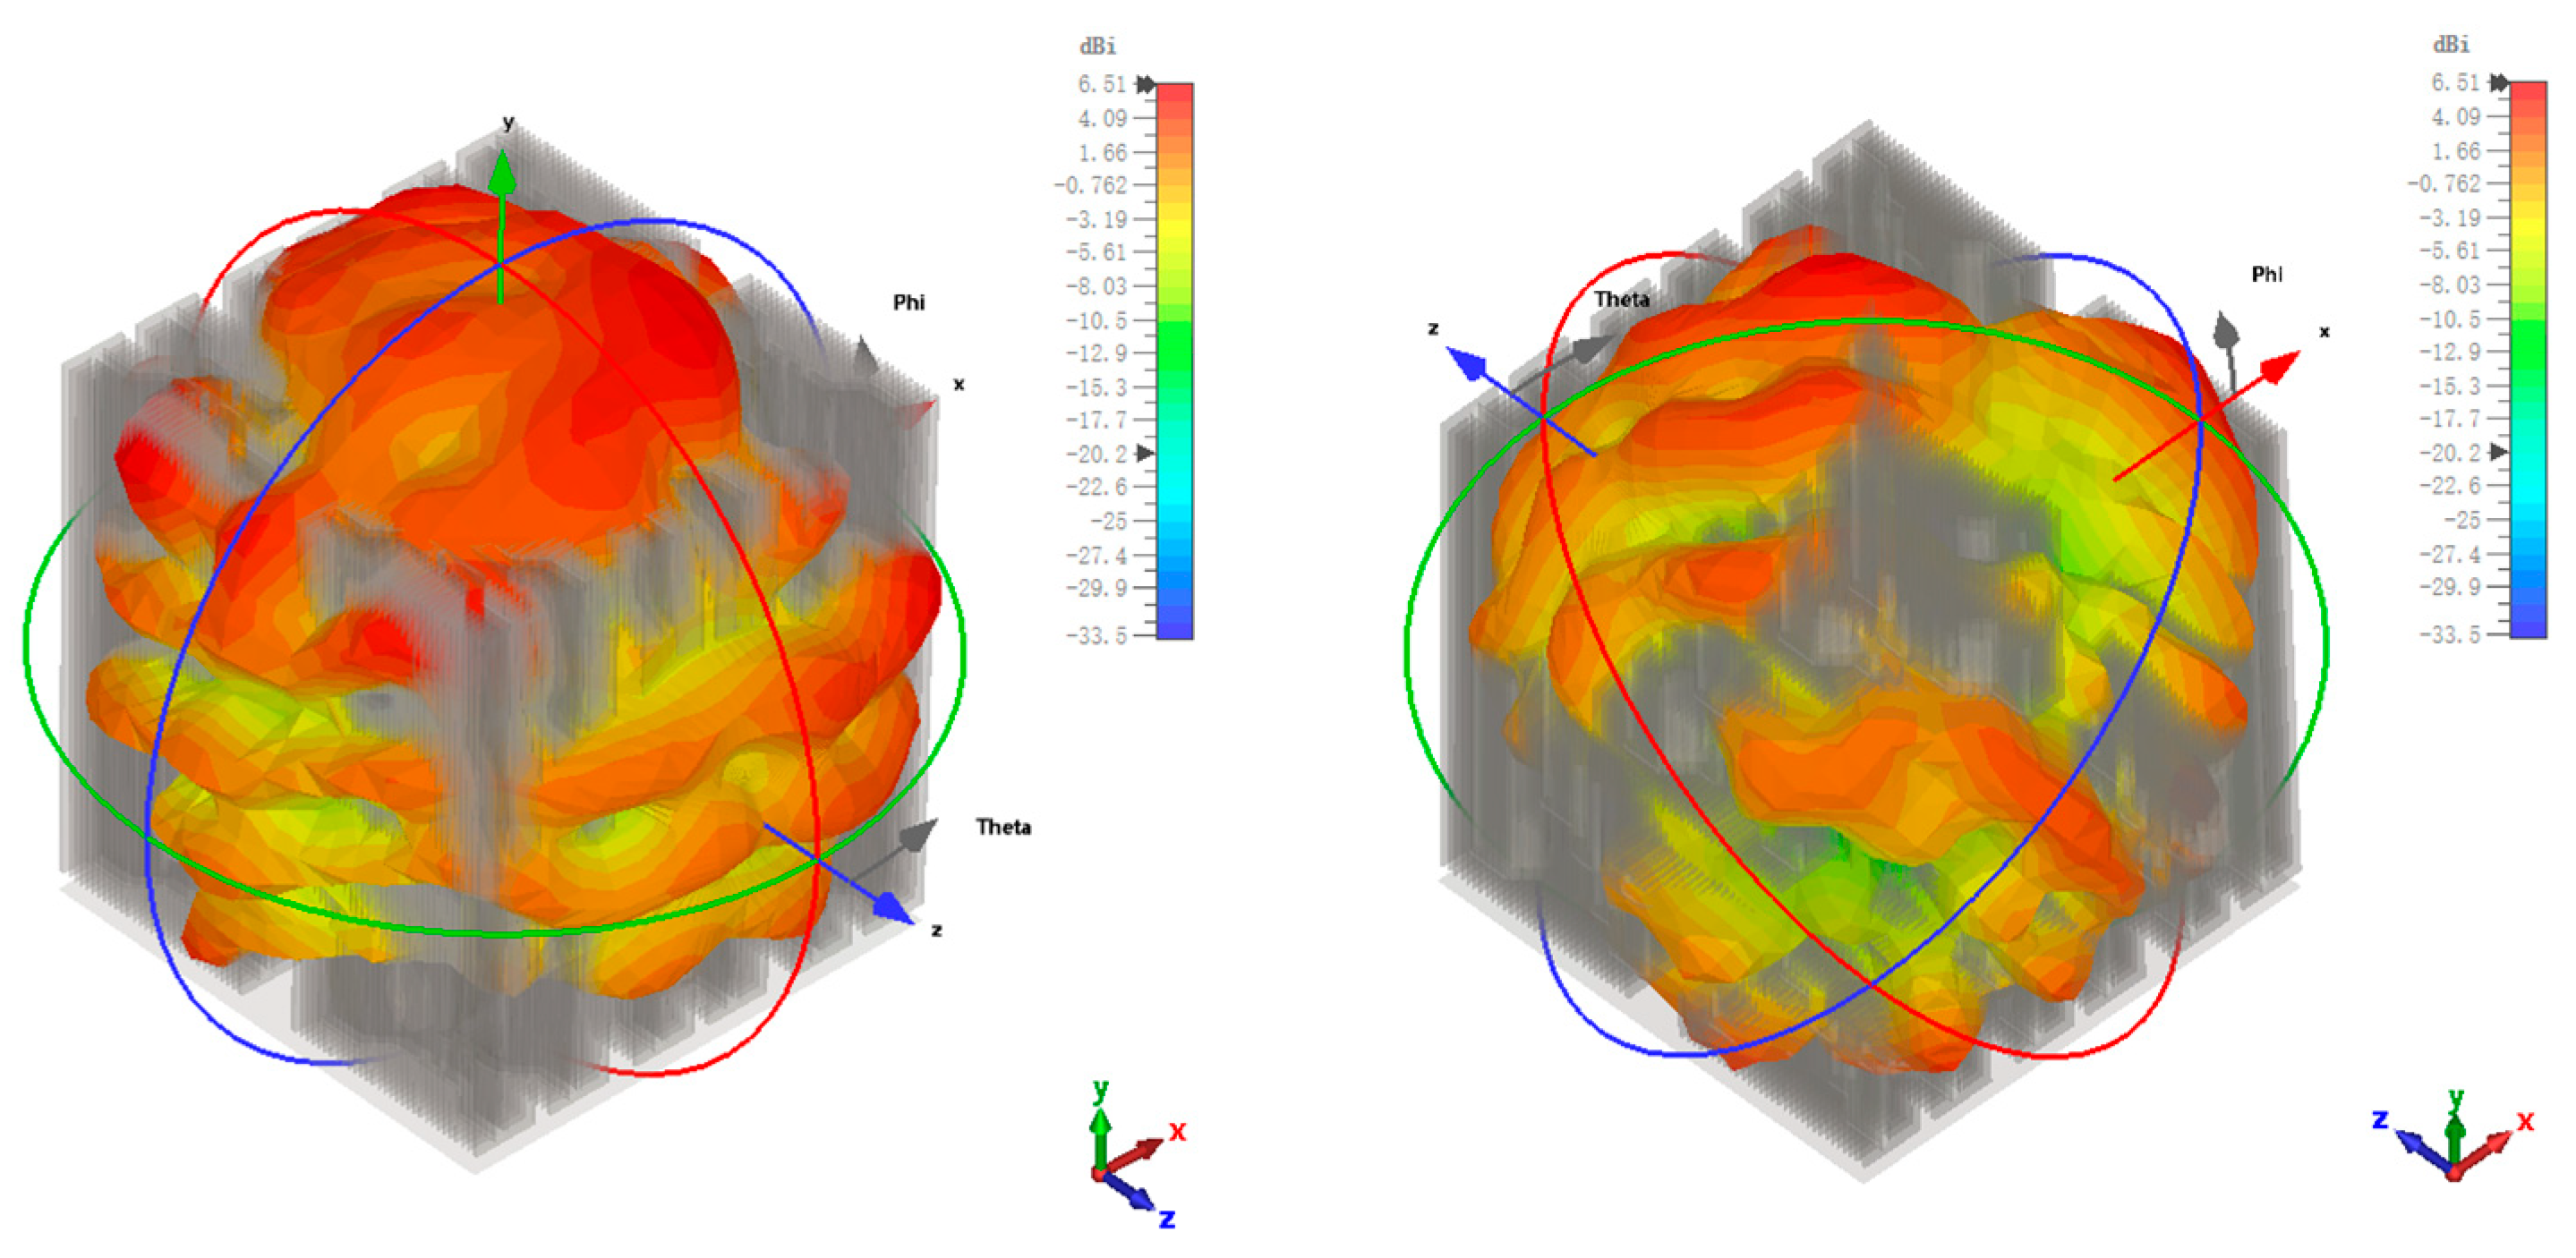
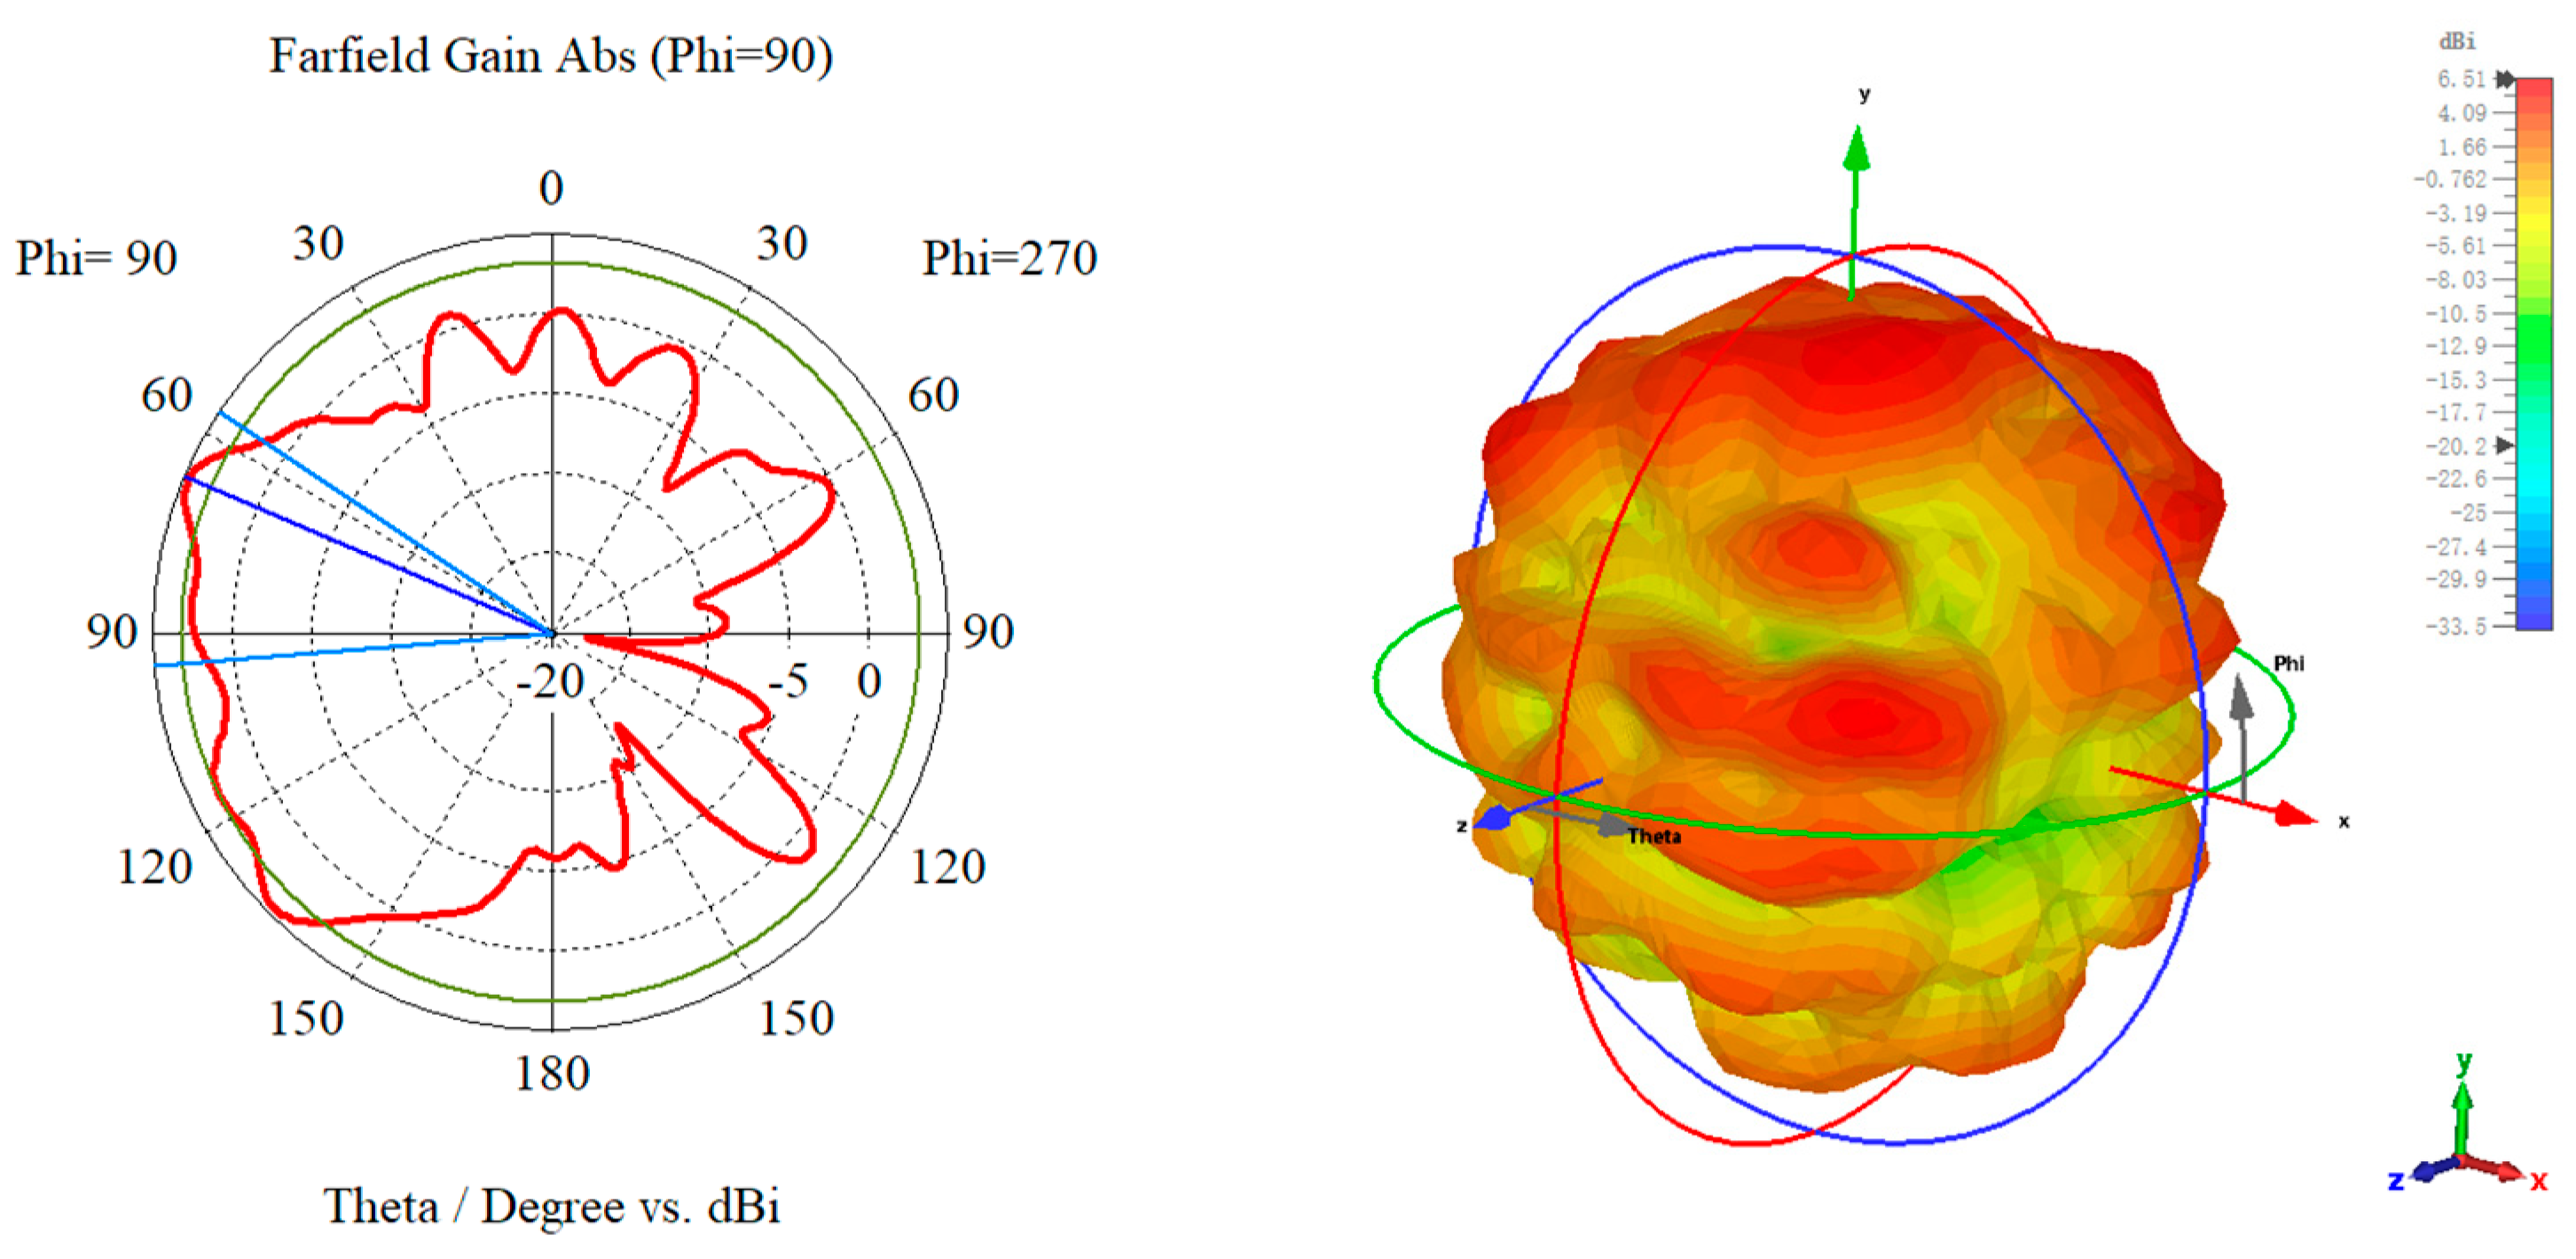
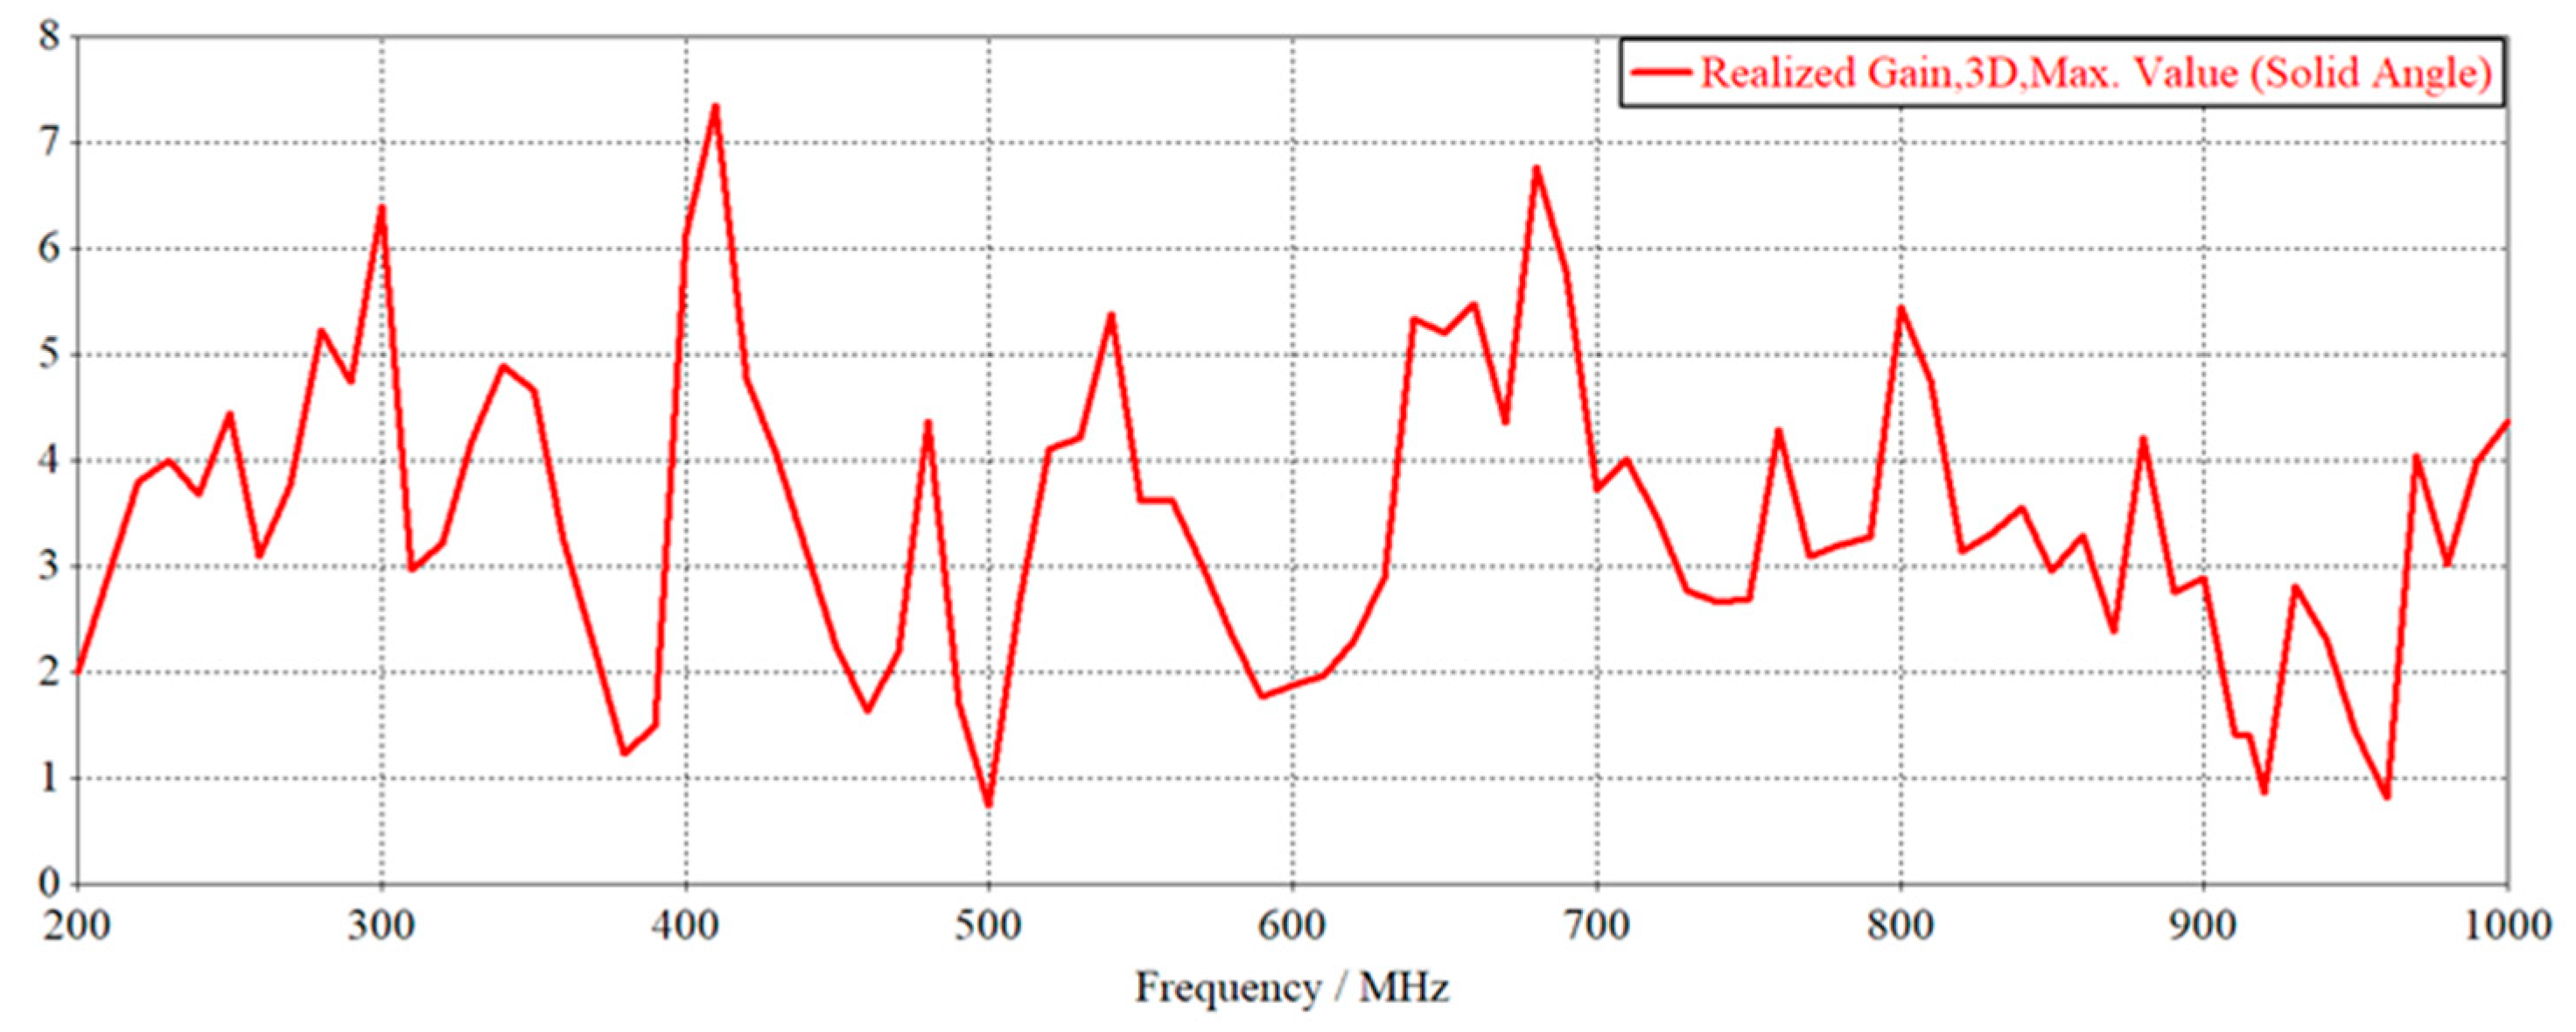
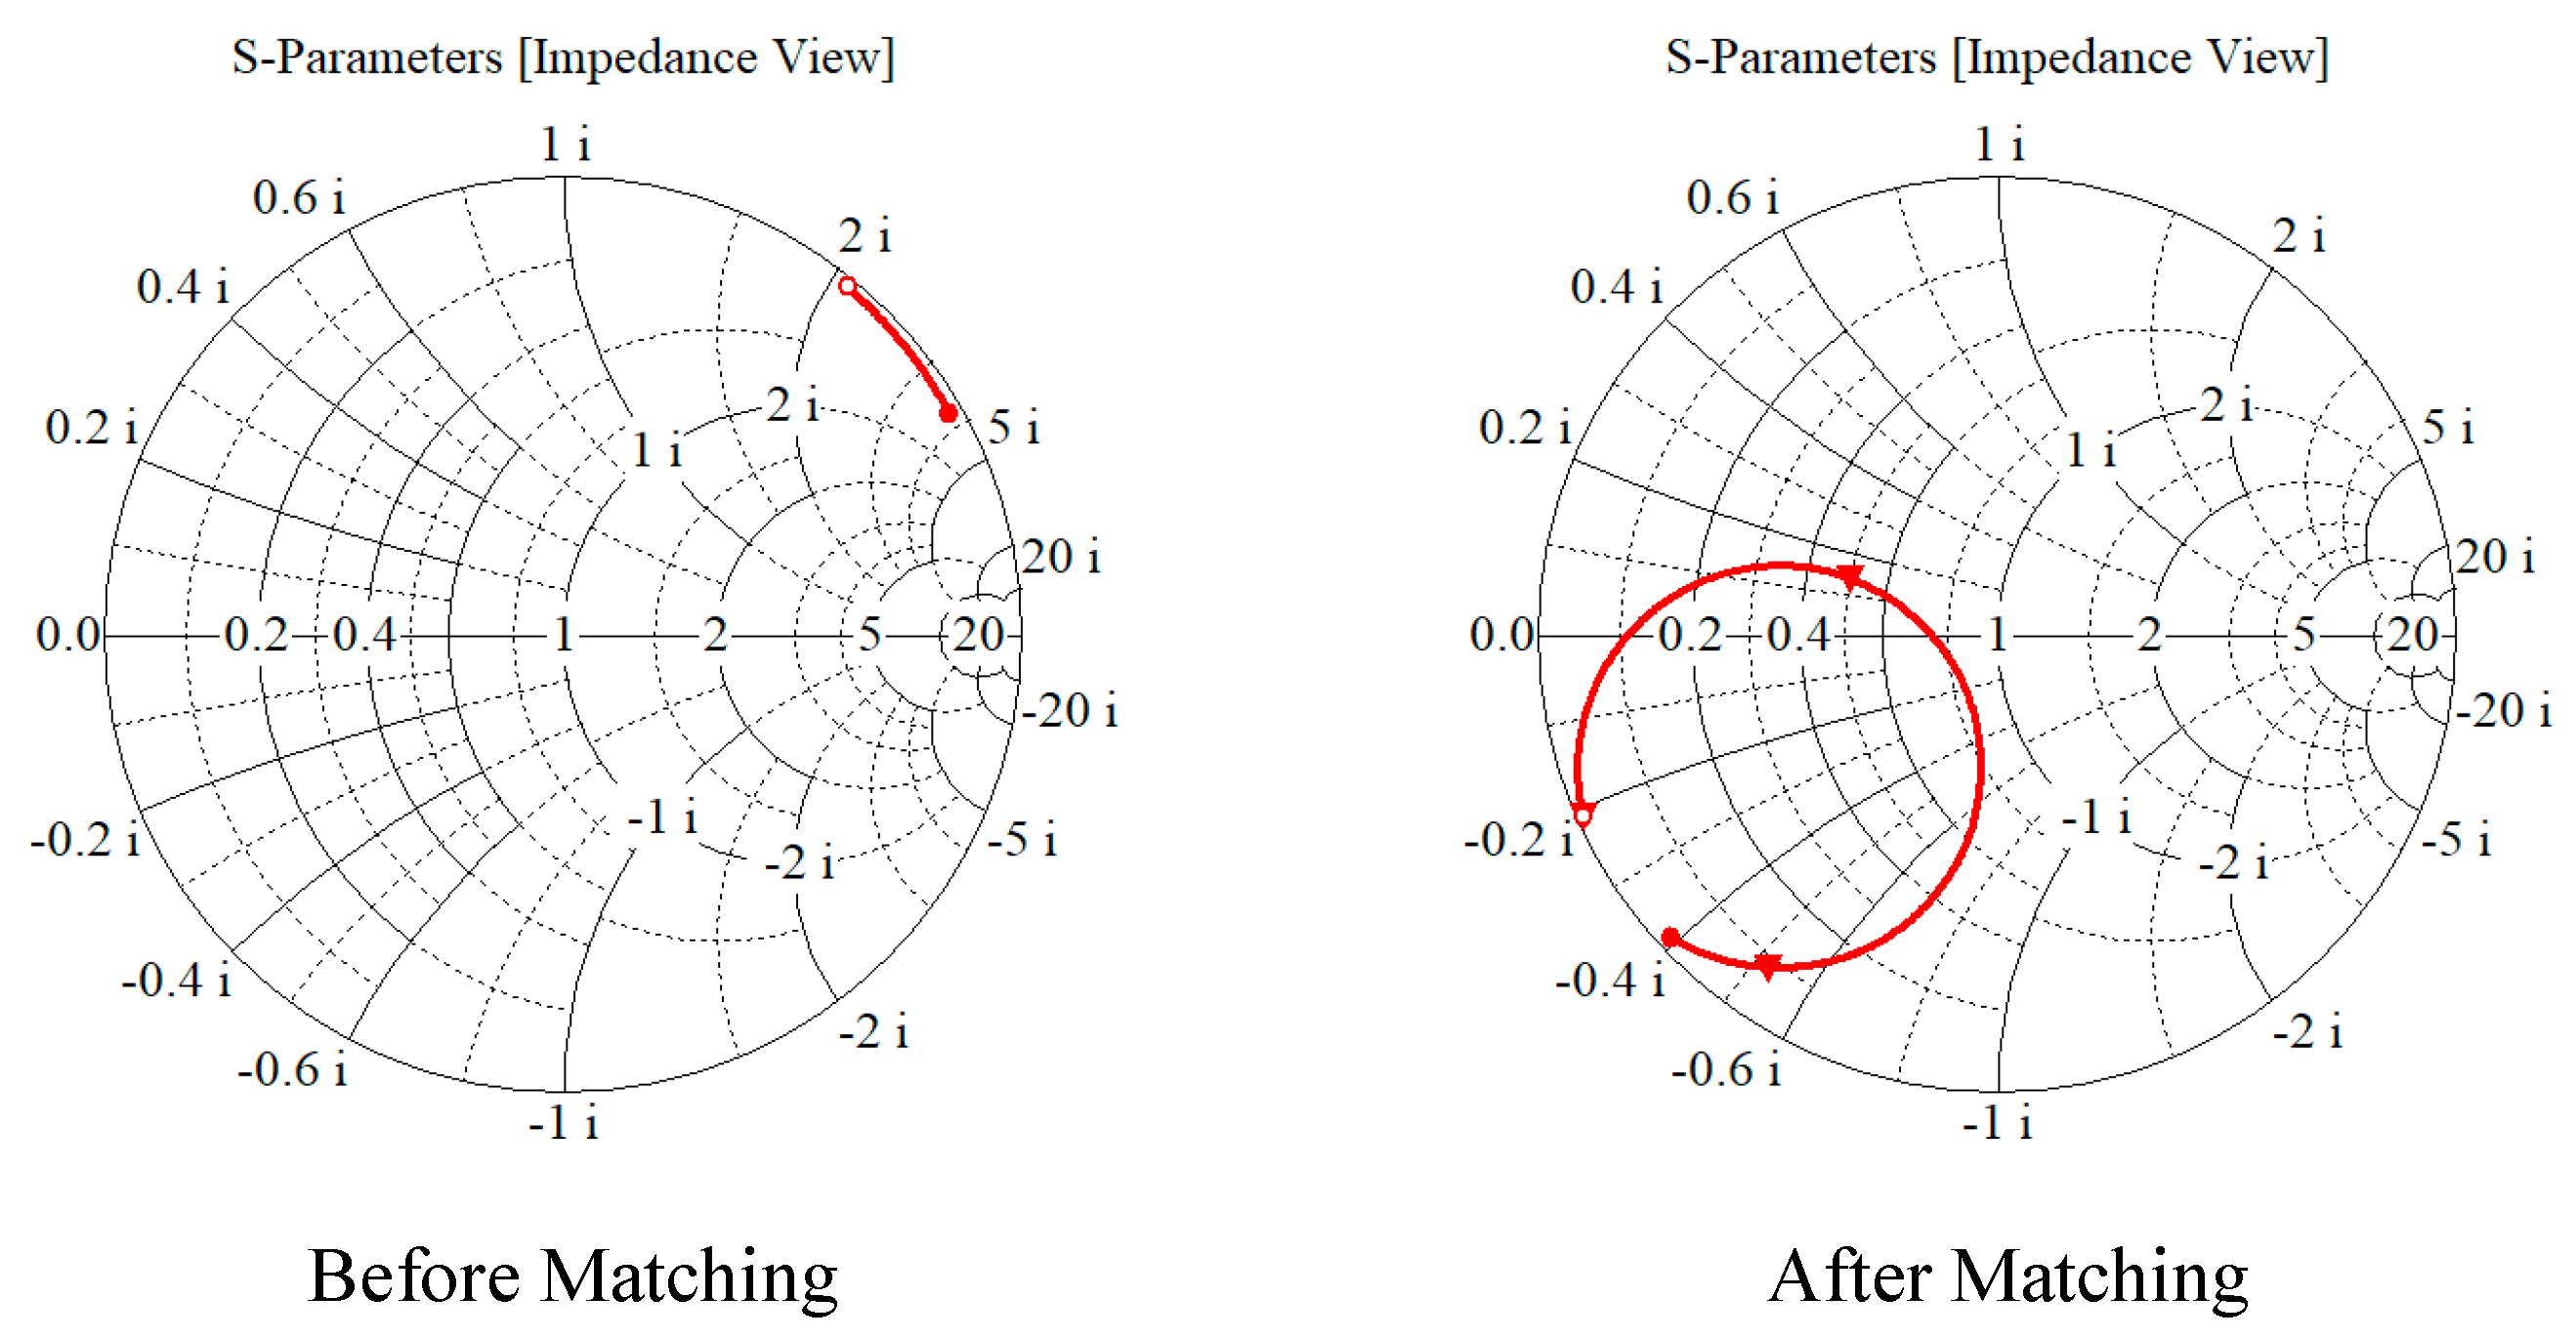
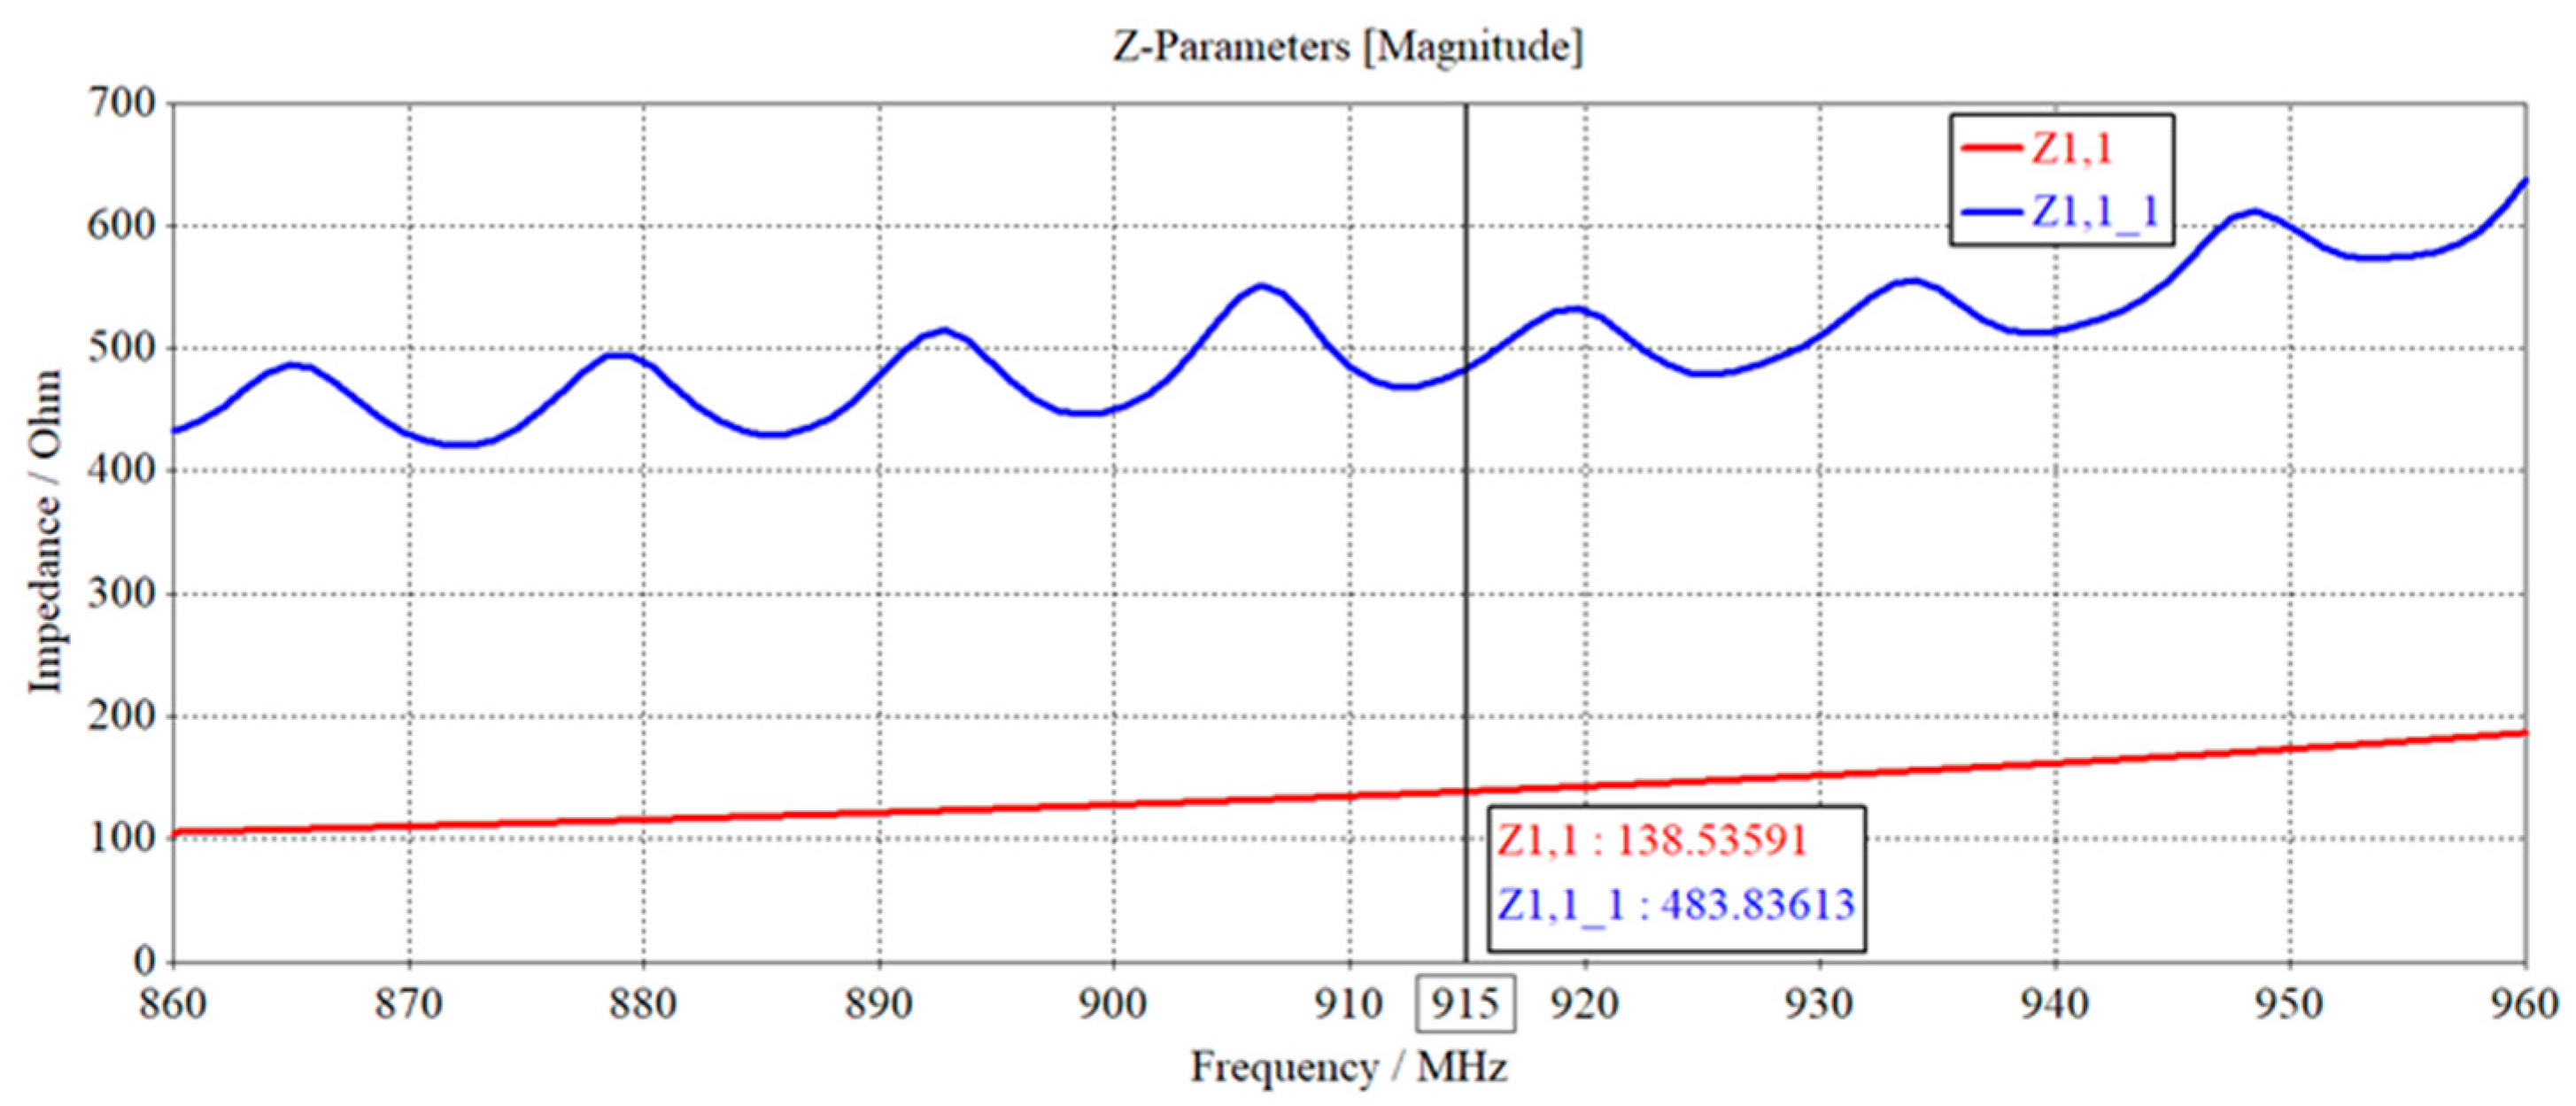
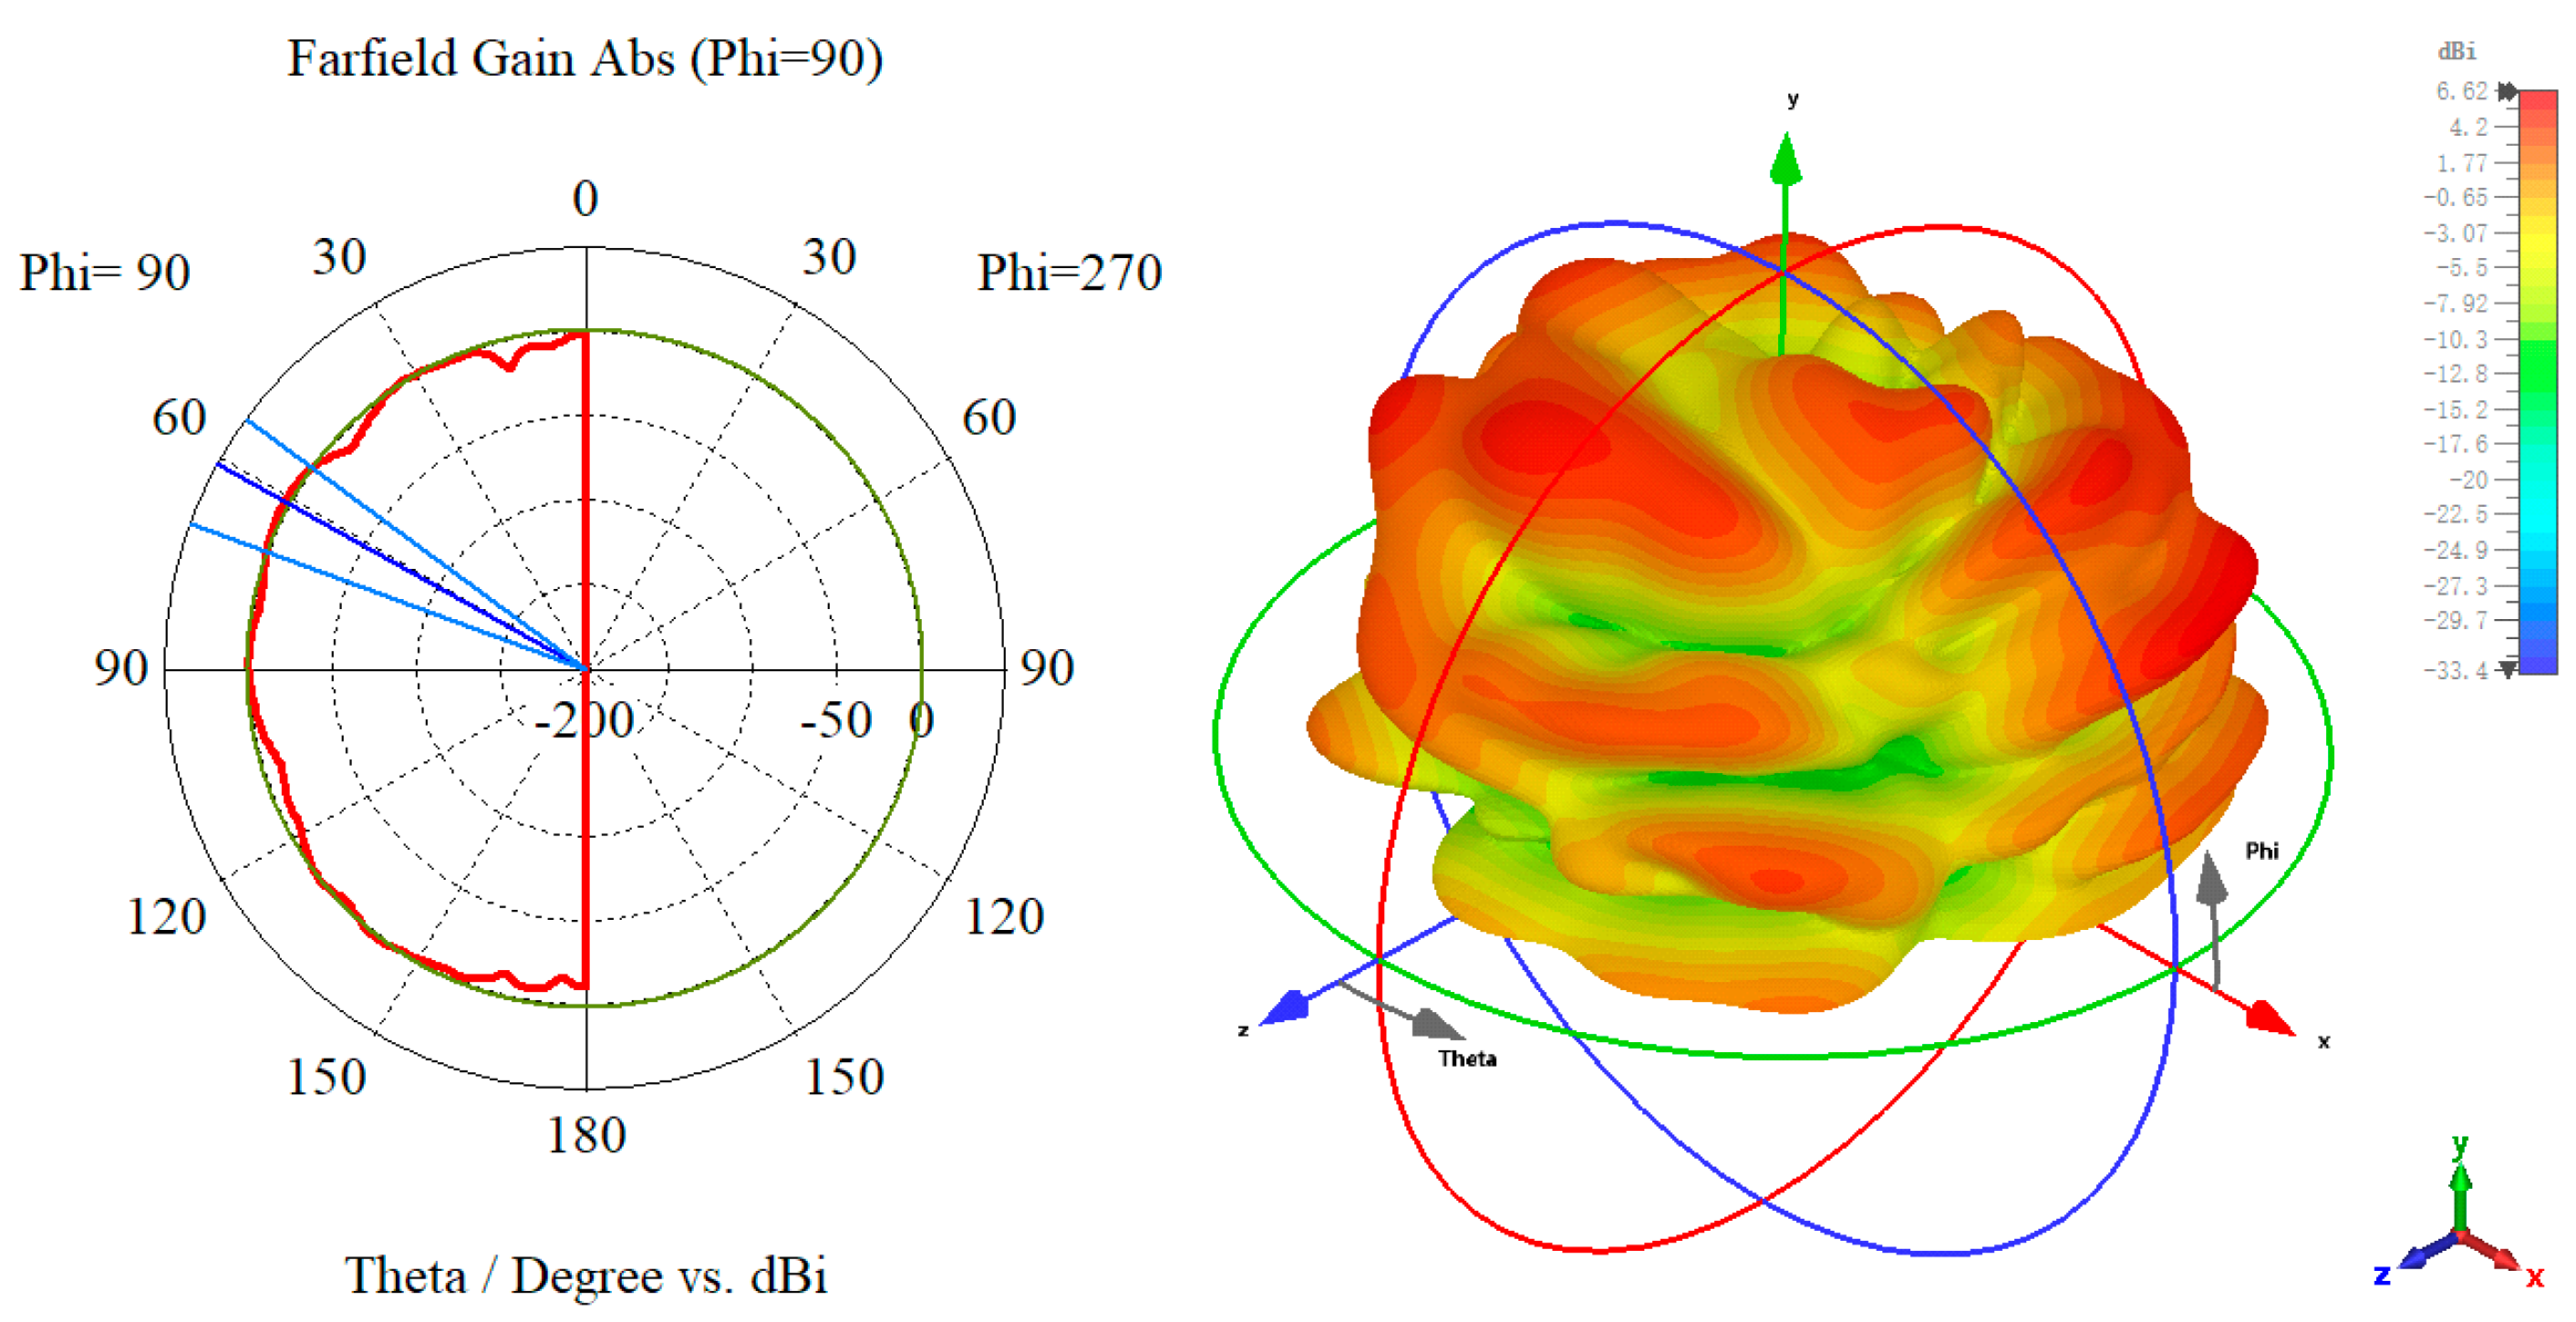
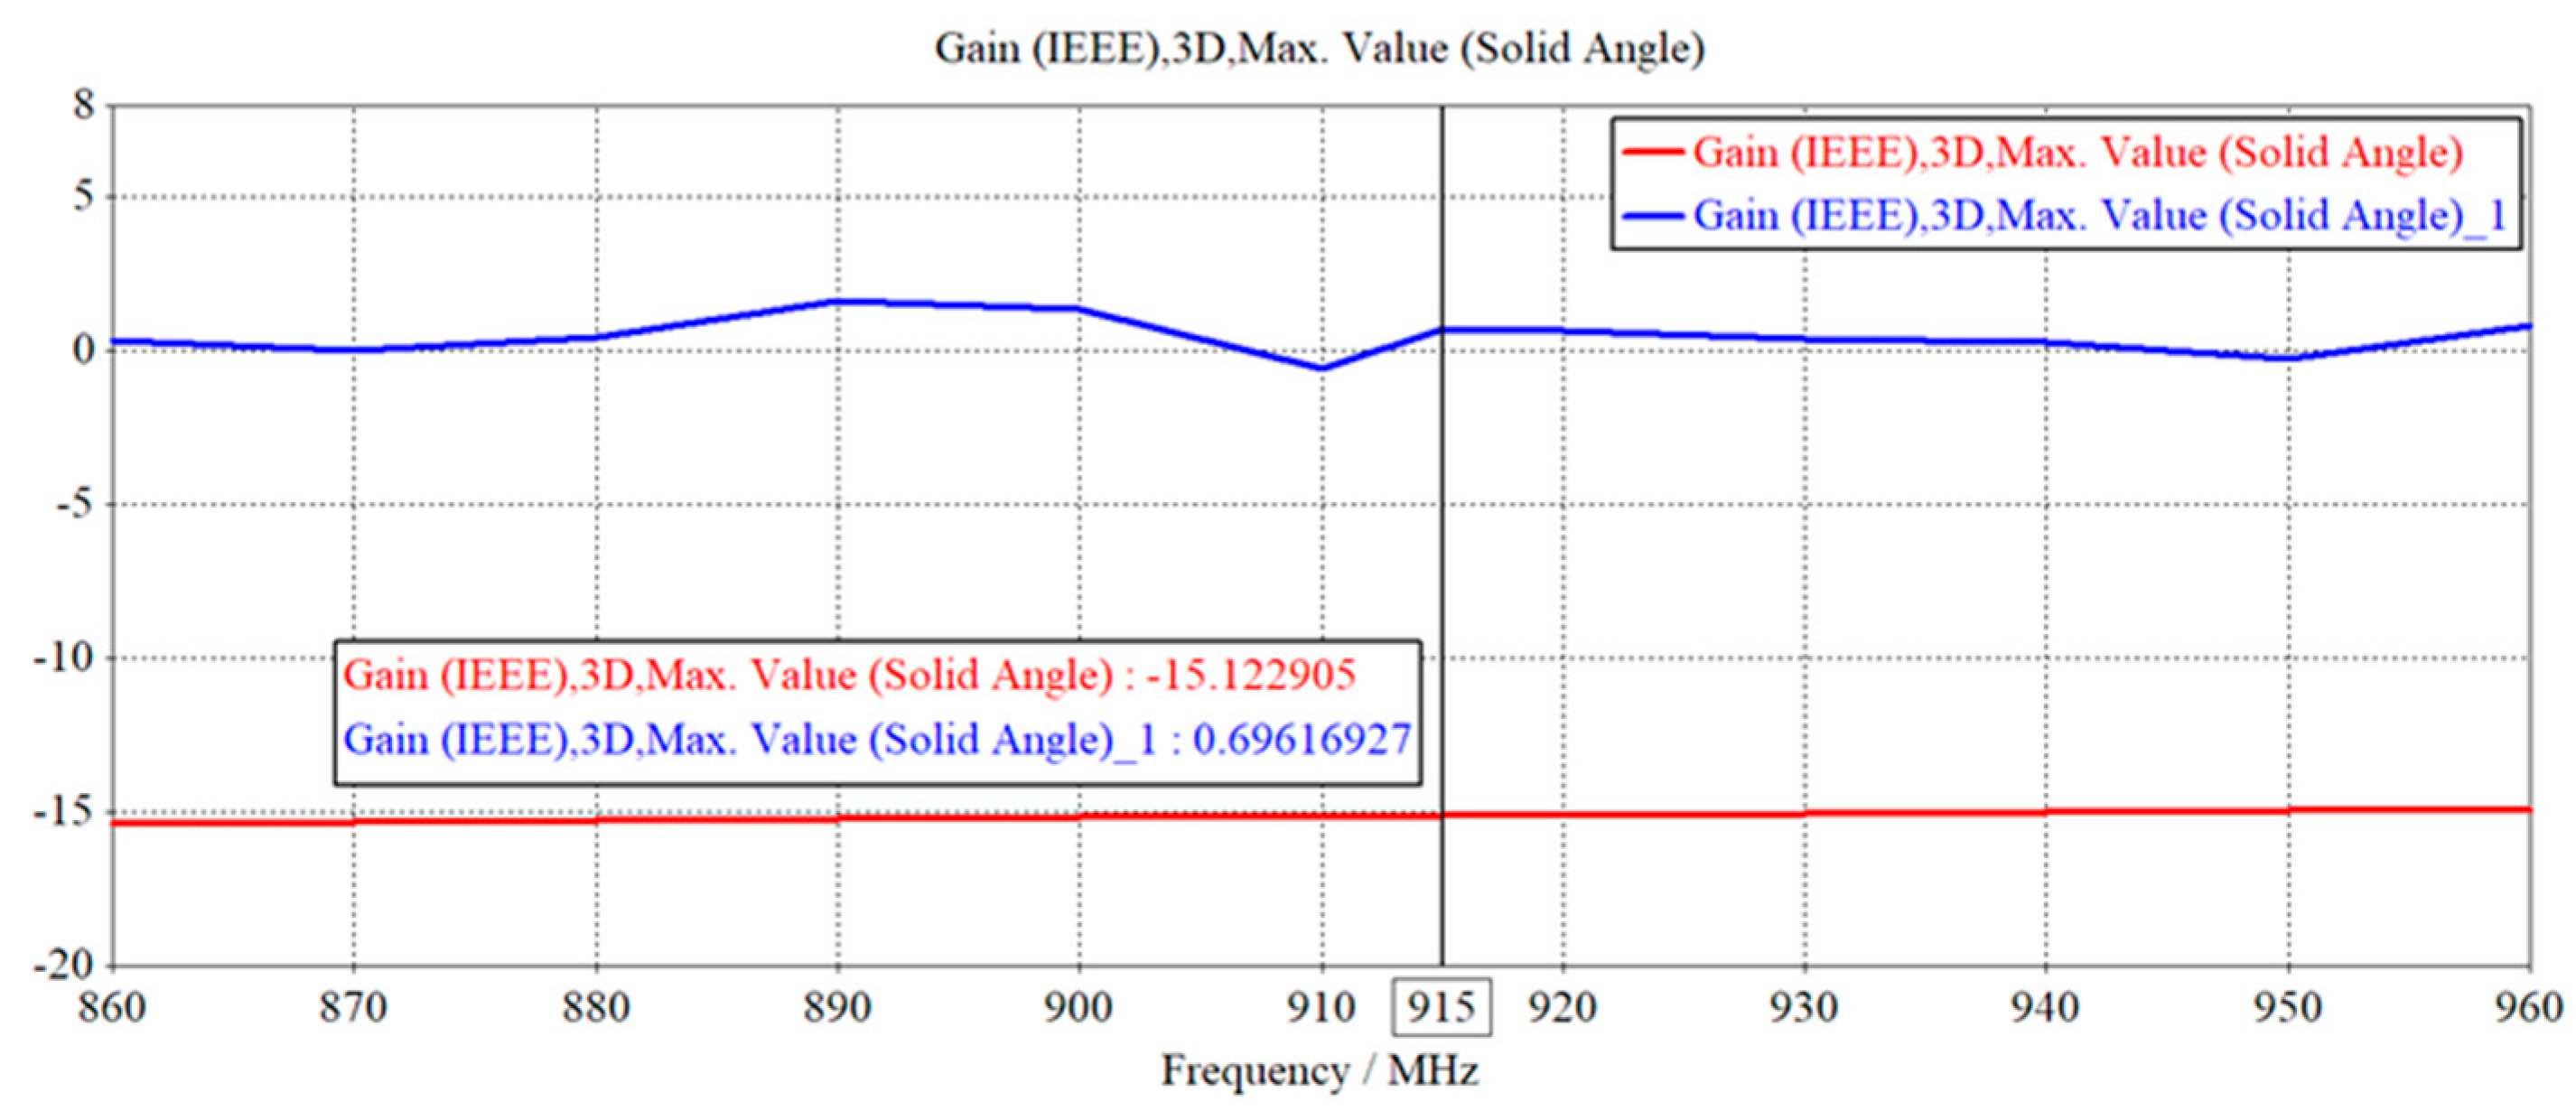
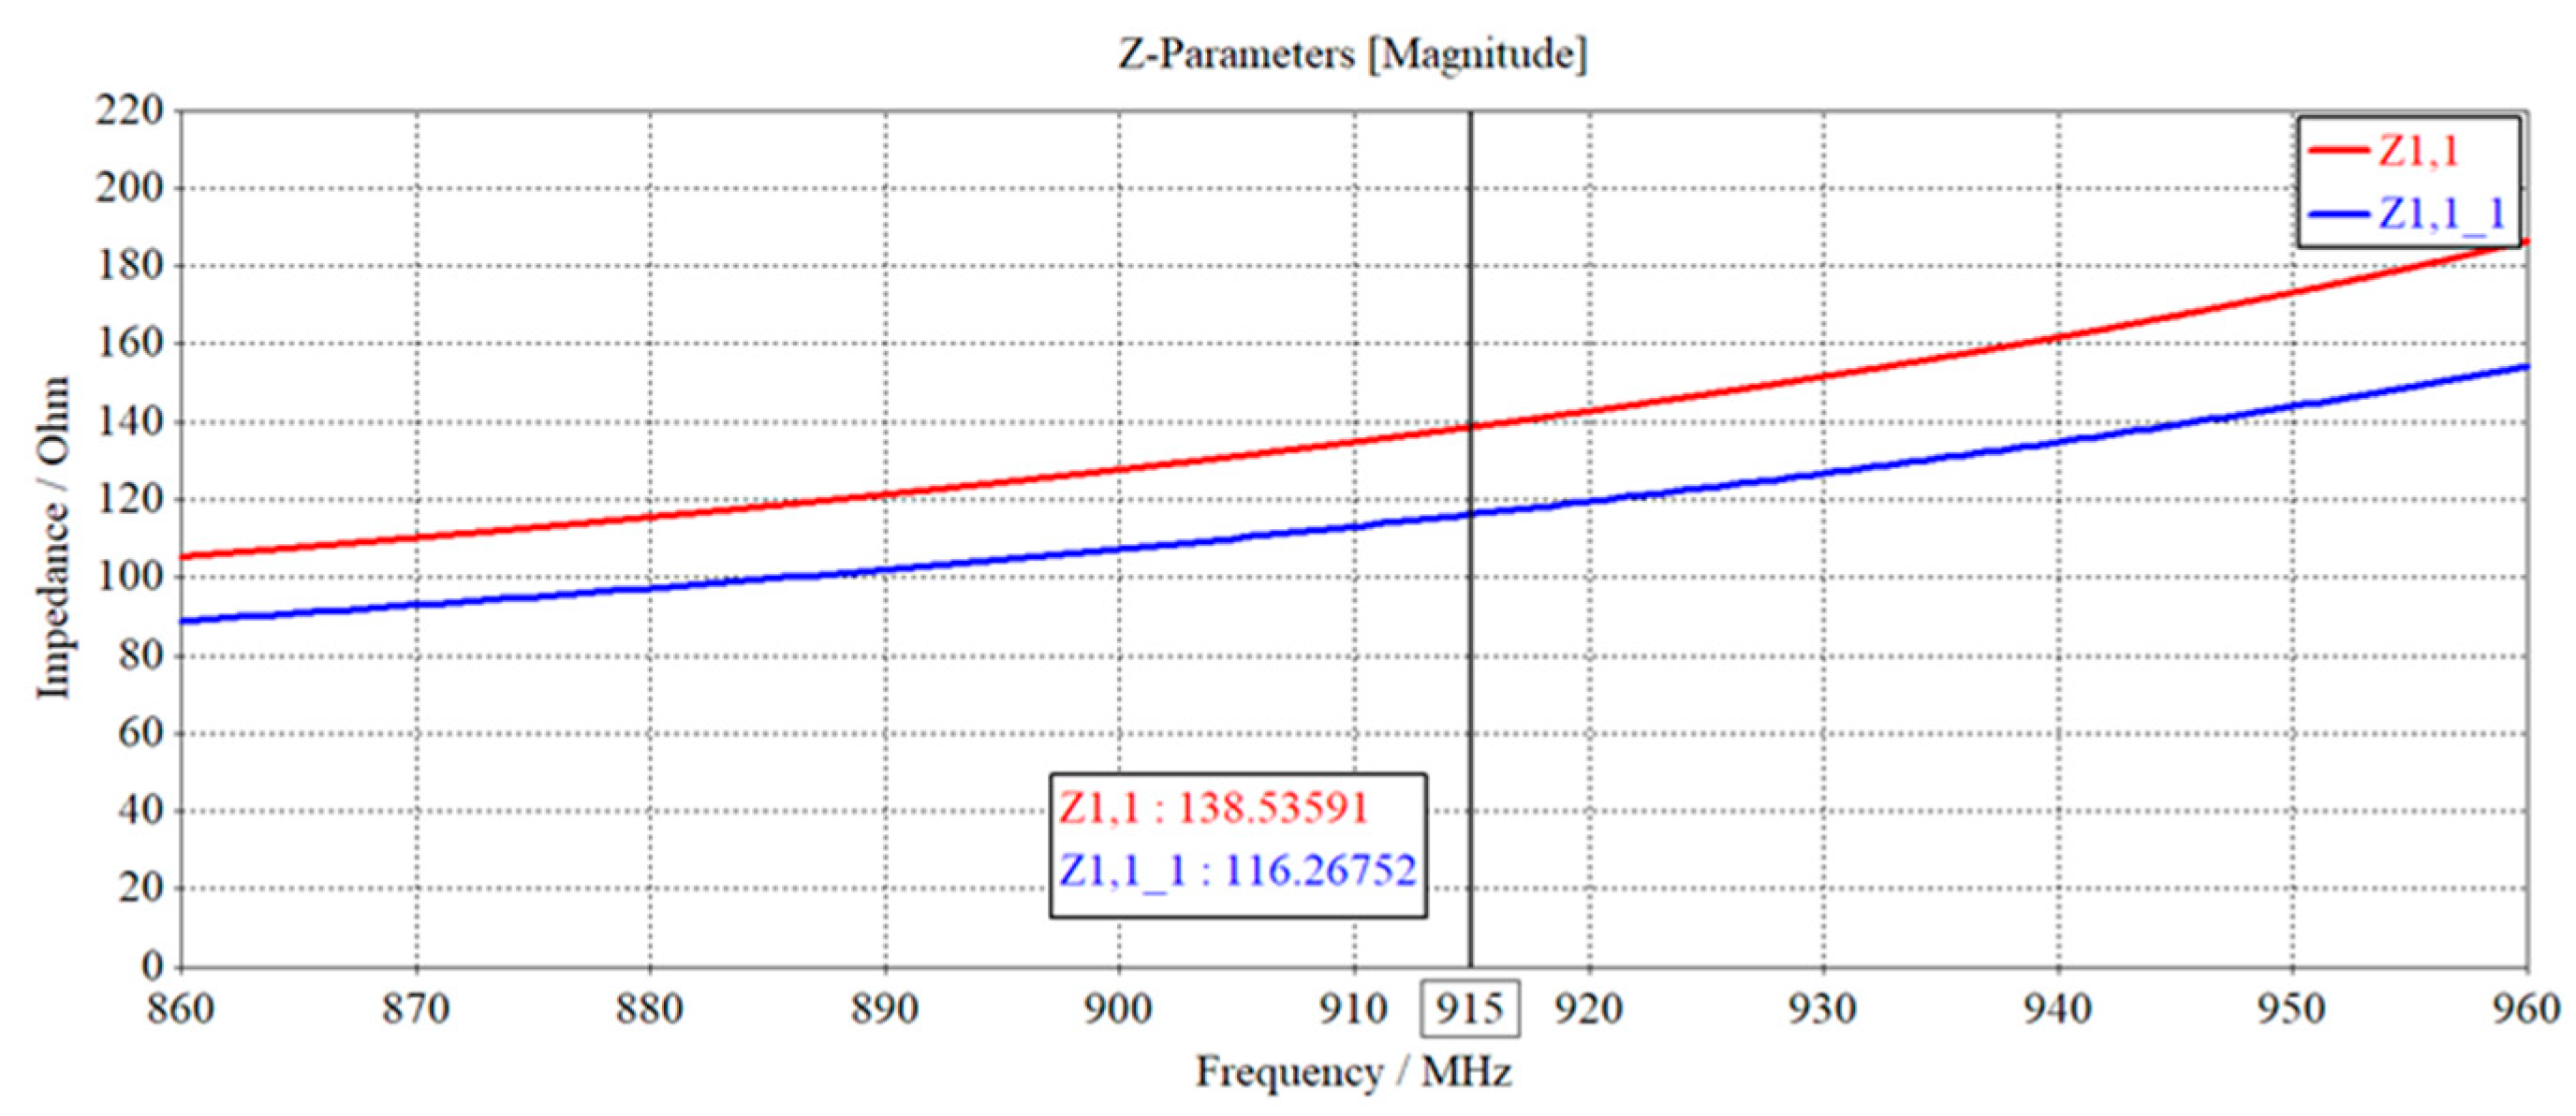
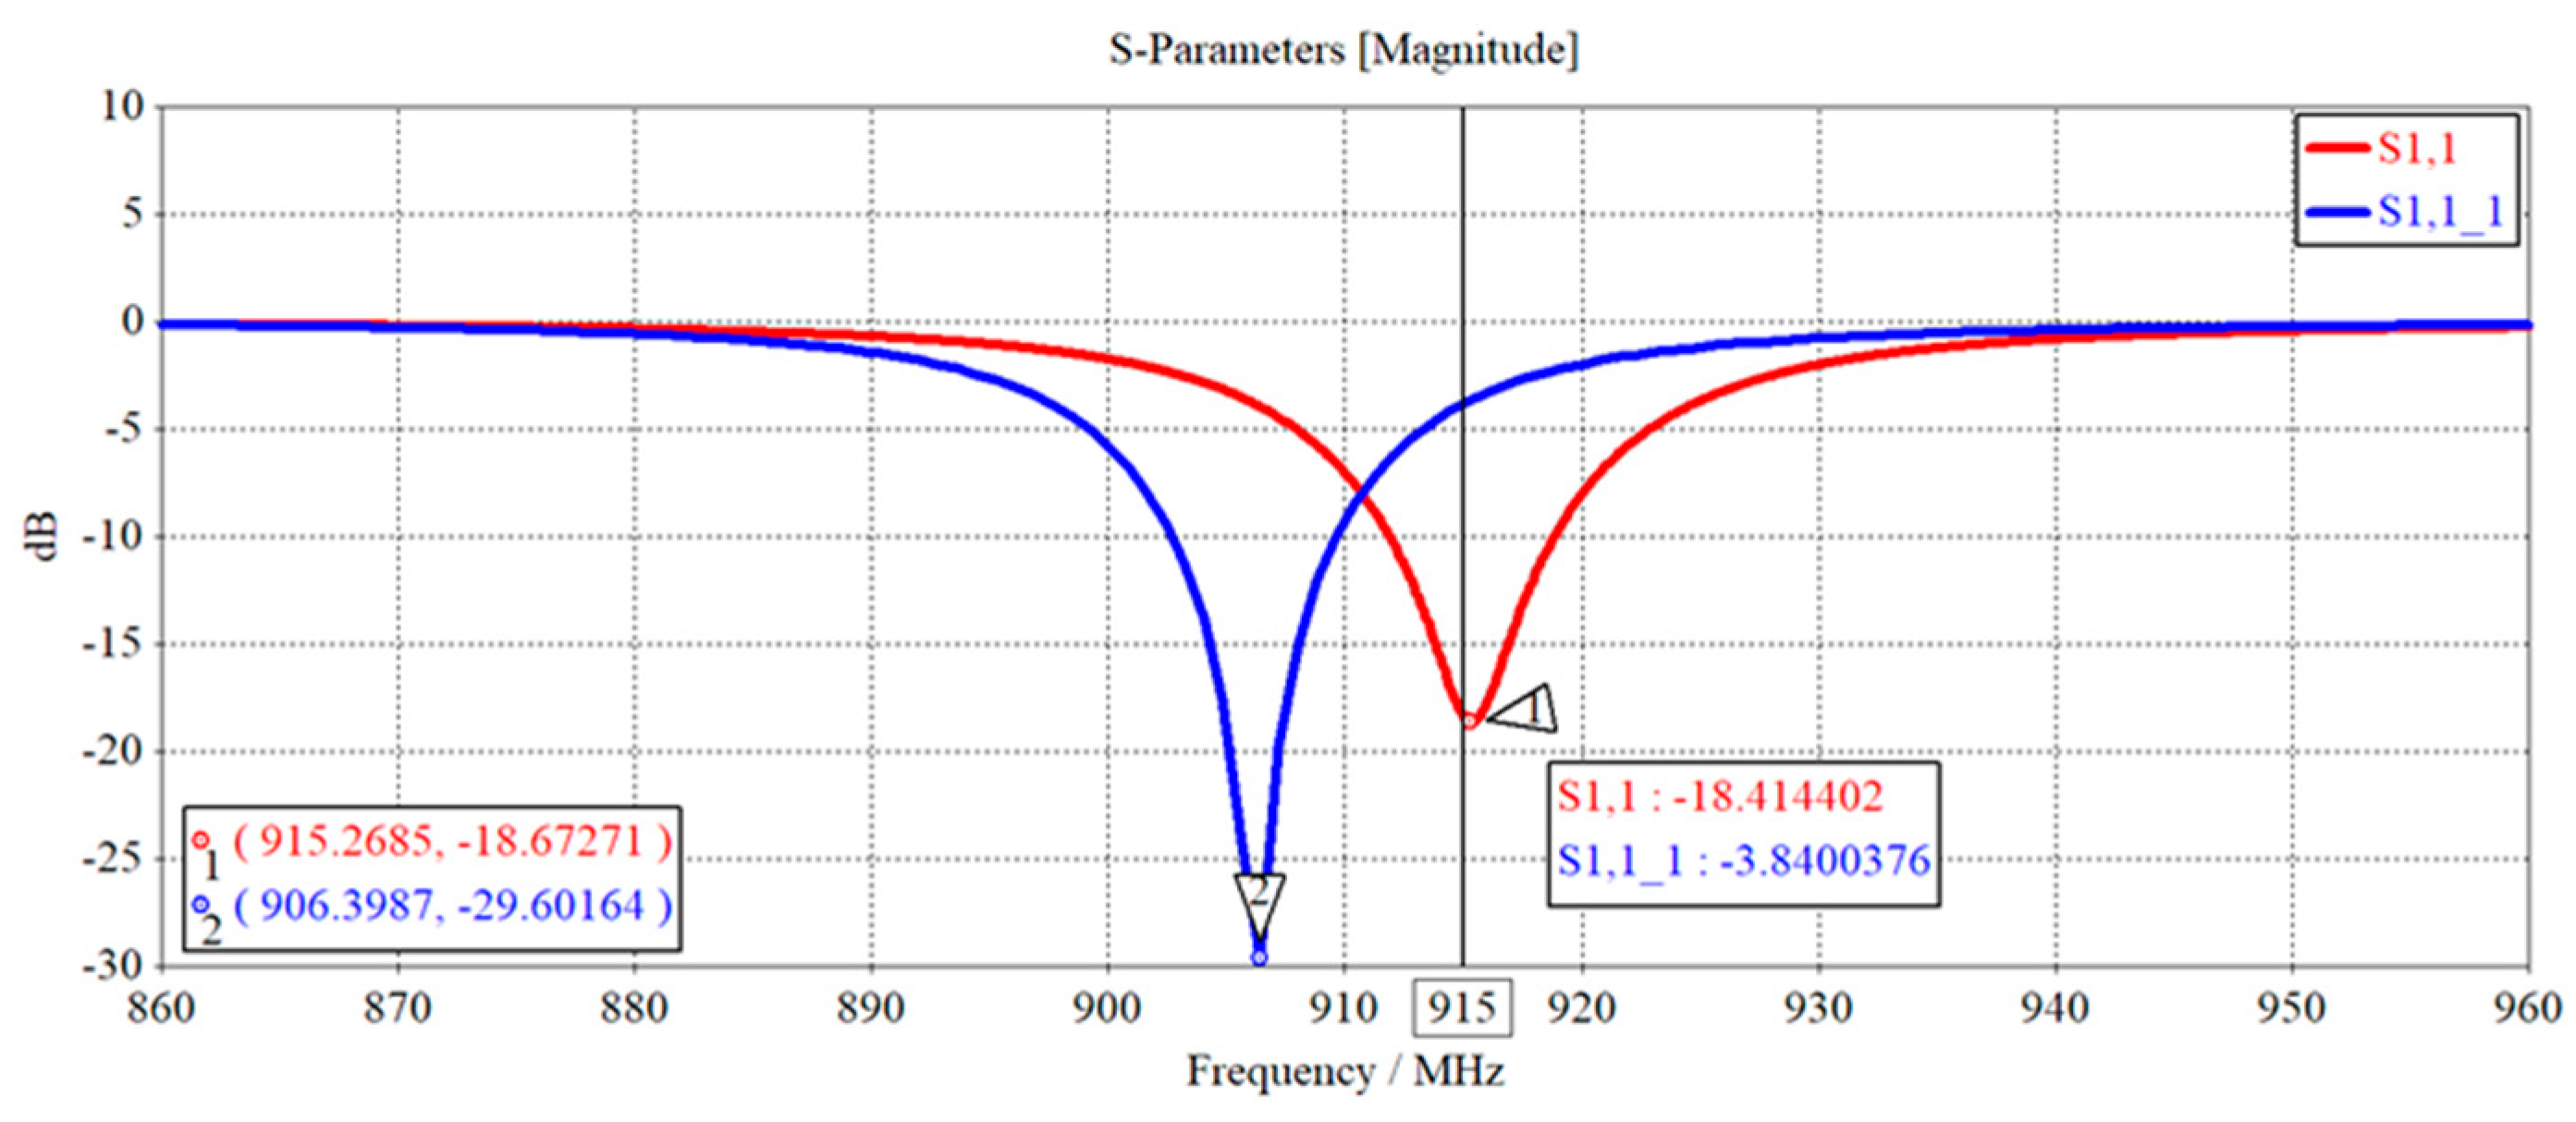
2.3. Simulation Analysis of RFID Anti-Metal Tag

The designed new metal-resistant RFID tag antenna was modeled by finite element analysis method in Ansys HFSS simulation software and simulated together with the traditional RFID temperature measurement tag antenna for comparative analysis in a metal environment.
Figure 4a,b indicates the 1D/3D radiation direction diagram of the designed anti-metal tag antenna and the 1D/3D radiation direction diagram of the traditional non-metal tag antenna, respectively. As can be seen in Figure 4a, the anti-metal tag antenna in the metal conductor plane has a high peak gain; and the antenna radiation direction are facing the metal plane above, in the metal plane above with better omnidirectional and larger gain, to meet the antenna omnidirectional requirements, can make the reader in all directions to read and write to the tag. In Figure 4b, the traditional, nonresistant-to-metal tag antenna is affected by the metal plane, and the gain is seriously reduced because the metal influence makes its radiation direction located below the tag; overall, the performance declines significantly.
Figure 5a,b represent the designed anti-metal tag antenna S11 parameter curve and the traditional non-metal tag antenna S11 parameter curve, respectively. From Figure 5a, it can be seen that the minimum value of anti-metal tag antenna S11 parameters is about −21.6 dB, which is located at the center frequency point of 915 MHz, and the −10 dB bandwidth is about 907.9 MHz~922.5 MHz, which meets the performance requirements. In addition, its radiation main flap bandwidth (−3 dB) range is about 892.3 MHz~938 MHz, with a width of about 46 MHz, which fully meets the band range of 902 MHz ~928 MHz commonly used in EPC Gen2 standard, and the tag performance is quite excellent under the international standard. As can be seen from Figure 5b, the traditional non-metal resistant tag antenna S11 parameters gradually increase between 902 MHz~960 MHz, and the −10 dB bandwidth and radiation main flap bandwidth do not meet the performance requirements.
Through the comparison analysis of simulation, it can be seen that the designed new RFID anti-metal temperature tag antenna based on short circuit short cut-off structure has good anti-metal performance, and the design of this tag follows the national standards of GB 9254-2008, GB/T 29768-2013, GB/T 17618-1998 and AIMC 0002-2006 China Automatic Identification Technology Association standard, Figure 6 shows the physical diagram of the RFID anti-metal temperature tag designed in this paper.

3. Simulation Analysis of Electromagnetic Interference of High Power Rectifier Heatsink

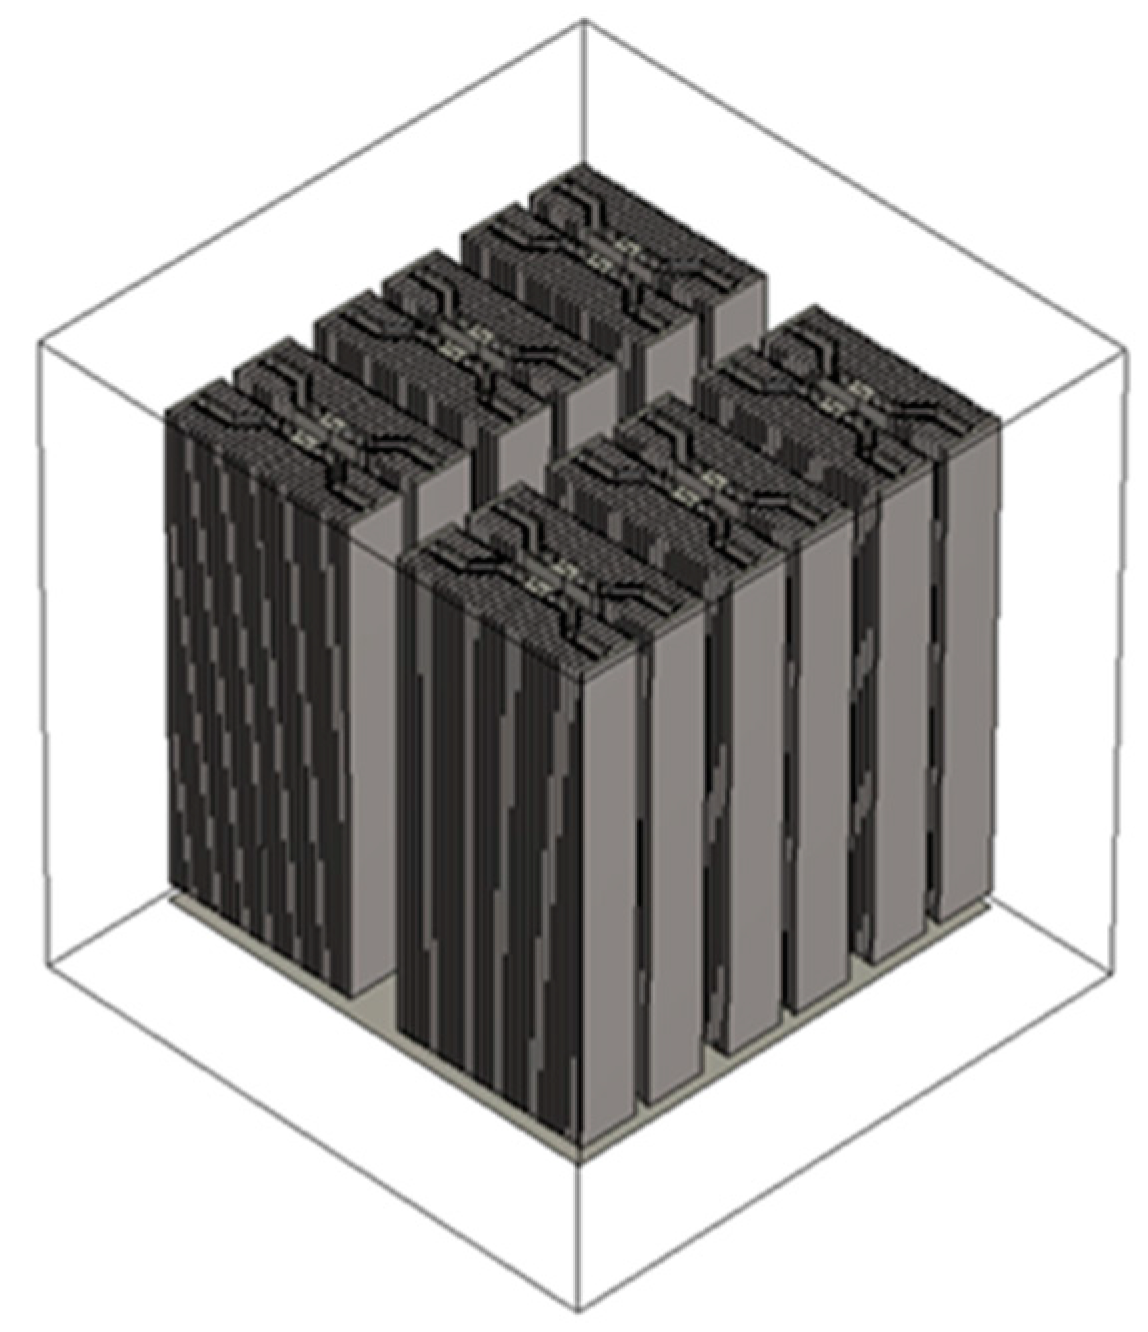
3.1. High Power Rectifier Power Supply Heatsink

Nowadays, the development of power electronics technology and its manufacturing process has made great progress, and the high-power rectifier power supply composed of independent thyristor components has been widely used. The rectifier power supply adopts the ring heat pipe cooling technology, and its cooling method adopts an aluminum heatsink for forced air-cooled cooling, which can realize complete self-cooling operation. The main circuit of the high-power rectifier is shown in Figure 7, which consists of six sets of independent thyristor components and forms a three-phase bridge-type fully controlled rectifier circuit with the three-phase AC inlet and DC outlet lines.
The two finned heatsinks made of aluminum profiles containing the heatsink and condensing cavity form a ring heat pipe heatsink and are connected to the anode and cathode of the thyristor respectively, which together form a rectifier circuit, Figure 3 shows the main circuit of the excitation power cabinet.
Two pieces of aluminum fins containing a heatsink and condensing cavity form a ring heat pipe heatsink, and are connected to the anode and cathode of the thyristor, together forming a rectifier circuit, Figure 8 shows that the electromagnetic simulation model of high-power rectifier power heatsink.

3.2. Electromagnetic Interference Simulation Modeling

In this subsection, a conduction loop of thyristor VT1—thyristor VT2 is taken on the basis of the electromagnetic simulation model for simulation analysis. As shown in Figure 9, a parasitic capacitor C11, a parasitic capacitor C1 connected in parallel to the incoming line L1, and a parasitic capacitor C12 are set on the anode heatsink of thyristor VT1; a parasitic capacitor C21, a parasitic capacitor C3 connected in parallel to the incoming line L3, and a parasitic capacitor C22 is set on the cathode heatsink of thyristor VT2, and the cabinet is used as the ground plane so that it is the common terminal for conducted interference.
As shown in Figure 10, after the heatsink parasitic capacitance is set, the EMI circuit is built in the CST software to establish the EMI simulation model of the excitation power cabinet.

3.3. Conducted Electromagnetic Interference Simulation Analysis

Through the simulation model of the main circuit of the excitation power cabinet in the previous subsection, the conduction current curves shown in Figure 11 are obtained for the cathode heatsink of thyristor VT1 and the parasitic capacitor C12, and the conduction currents range from 46.8 dB to 47.1 dB in the frequency band of 860 MHz~960 MHz, and the current size at 915 MHz is about 47 dB, indicating that the excitation power cabinet during the operation of the heatsink in the 860 MHz~960 MHz band has high-frequency common mode conduction current generation, common mode current size has exceeded GB 9254-2008, GB/T 29768-2013, GB/T 17618-1998 and other national standards and AIMC 0002-2006 China Automatic Identification Technology Association RFID anti-metal tag immunity range in the standard, there is conducted interference generation, and the parasitic capacitance of the heatsink provides a pathway for common mode conduction current.
Figure 12 shows that the conduction voltage curve generated on the heatsink when the conduction current flows through the thyristor VT1 cathode heatsink is obtained through simulation, and the magnitude of the voltage to ground is between 101 dB and 107 dB in the 860 MHz~960 MHz band, and the magnitude of the voltage at 915 MHz frequency is 104 dB, indicating that the excitation power cabinet during the operation of the heatsink in 860 MHz~960 MHz frequency band has high-frequency voltage generation, common mode conducted voltage size has exceeded GB 9254-2008, GB/T 29768-2013, GB/T 17618-1998 and other national standards and AIMC 0002-2006 China Association of Automatic Identification Technology standard of RFID anti-metal tag immunity range, there is conducted interference generation, and this high-frequency voltage is also an important reason for the generation of parasitic capacitance.
The electric field curve generated on the cathode heatsink when the conduction current flows through the thyristor VT1 cathode heatsink is obtained by simulation as shown in Figure 13. The electric field intensity of the thyristor VT1 cathode heatsink ranges from 54.5 dB to 65.4 dB in the 860 MHz~960 MHz band, and 62.6 dB at the 915 MHz frequency, indicating that the excitation power cabinet in During operation, the electric field generated by the heatsink in the 860 MHz~960 MHz band is quite large enough to produce electric field interference with objects on the heatsink.
The magnetic field curves generated on the cathode heatsink of thyristor VT1 when the conduction current flows through the cathode heatsink are obtained by simulation as shown in Figure 14. The magnetic field strength of the thyristor VT1 cathode heatsink ranges from 50.5 dB to 64.7 dB in the 860 MHz~960 MHz band, and the magnetic field strength is about 59.3 dB at the 915 MHz frequency, indicating that the excitation power cabinet during the operation of the heatsink generates a considerable magnetic field in the 860 MHz~960 MHz band, which can produce magnetic field interference to the objects on the heatsink.
Through the above parameter curve analysis, it can be seen that the excitation power cabinet in operation can produce considerable conducted electromagnetic interference, heatsink at the high-frequency voltage generated, heatsink and its parasitic capacitance for the excitation power cabinet common mode conduction current provides a pathway, and power cabinet heatsink in the conduction interference generated high-frequency electromagnetic field, can have an impact on the RFID anti-metal temperature tag.

3.4. Simulation Analysis of Radiated Electromagnetic Interference

After simulation, Figure 15 shows the radiator at 915 MHz frequency 3D radiation direction chart, the chart shows that the maximum radiation direction appears above the radiator, the radiator bottom radiation energy is the smallest, the maximum radiation gain of 6.5 dBi, and the six sides of the radiator are radiated energy outward, the radiator as a whole present irregular radiation.
Figure 16 shows the radiator 1D/3D radiation direction diagram, a radiation frequency of 915 MHz. From the figure, it can be seen that the radiator radiation surface as a whole is irregular, the radiation energy main flap is mainly concentrated in the x-o-z surface above, the maximum radiation angle of 67°, the main flap width of 38.3°, and the main flap maximum radiation gain of 4.66 dBi, indicating that the radiator during the operation of the radiator can be radiated outward energy during operation, which may have an effect on objects attached to the radiator surface.
Figure 17 shows the radiation gain curve of the heatsink, the gain sweep range of 200 MHz~1000 MHz. From the figure, it can be seen that the maximum gain of the heatsink concentrated between 300 MHz~700 MHz and 860 MHz~960 MHz band radiation gain is quite small.
Figure 18 shows the radiator radiation S11 parameter curve, the curve is in the 200 MHz~1000 MHz band to do the full-band simulation. From the figure, it can be seen that the resonance point of the radiator radiation in 339.2 MHz, S11 < −10 dB frequency band concentrated in 333 MHz~345 MHz and 410 MHz~414 MHz range, in the 860 MHz~960 MHz band S11 parameter values in −5 dB~0 dB, indicating that the radiator as a radiation body, in the 860 MHz~960 MHz band on the RFID temperature measurement tag radiation interference degree is small.
Through the above radiation map and curve analysis, it can be seen that the excitation power cabinet in the operation radiator can produce radiation electromagnetic interference. Radiator radiation is mainly concentrated in the 333 MHz~345 MHz and 410 MHz~414 MHz range; the 860 MHz~960 MHz band radiation interference is smaller, and the impact of the RFID anti-metal temperature tag produced less.

4. Perturbation Analysis of Electromagnetic Interference of RFID Temperature Tag

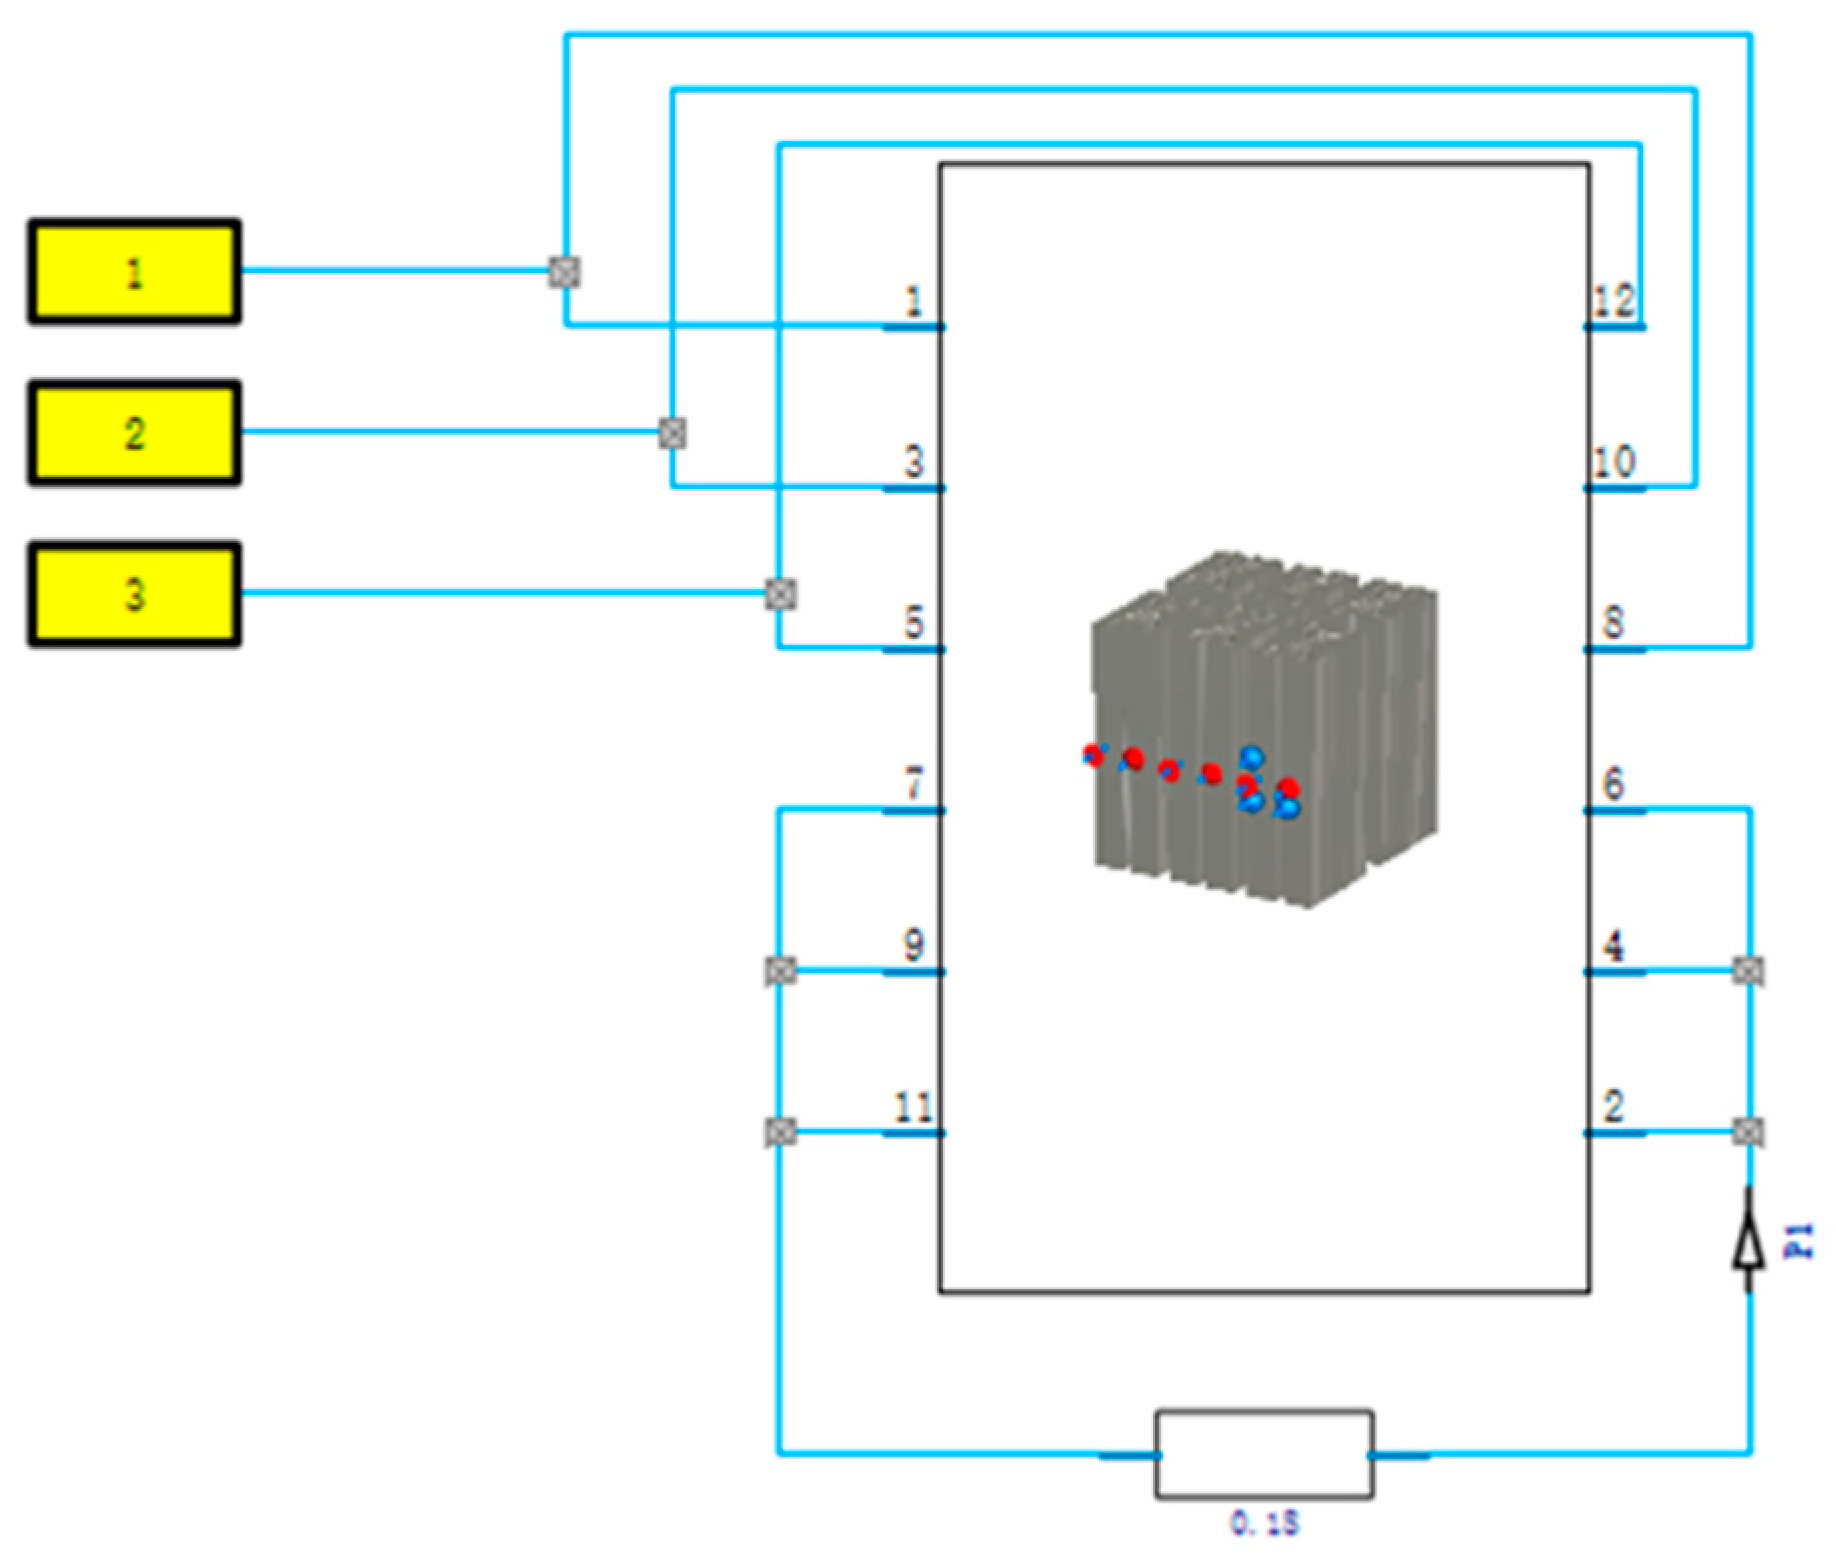
4.1. Simulation Modeling of Electromagnetic Disturbance of RFID Temperature Tag

RFID temperature measurement tag in the CST software for simulation, the tag antenna port impedance matching is required. As shown in Figure 19, after matching the antenna impedance with the port impedance by the Smith circle diagram, the matched capacitance topology between the antenna and the port can be obtained, as shown in Figure 20, where Ca = 12.3 pF and Cb = 1.8 pF.
As shown in Figure 21, after the impedance matching of the RFID temperature tag antenna is completed, the electromagnetic interference simulation model of the RFID temperature tag antenna can be combined with the electromagnetic interference simulation model of the excitation power cabinet through the CST software to jointly establish the electromagnetic interference simulation model of the RFID temperature tag.

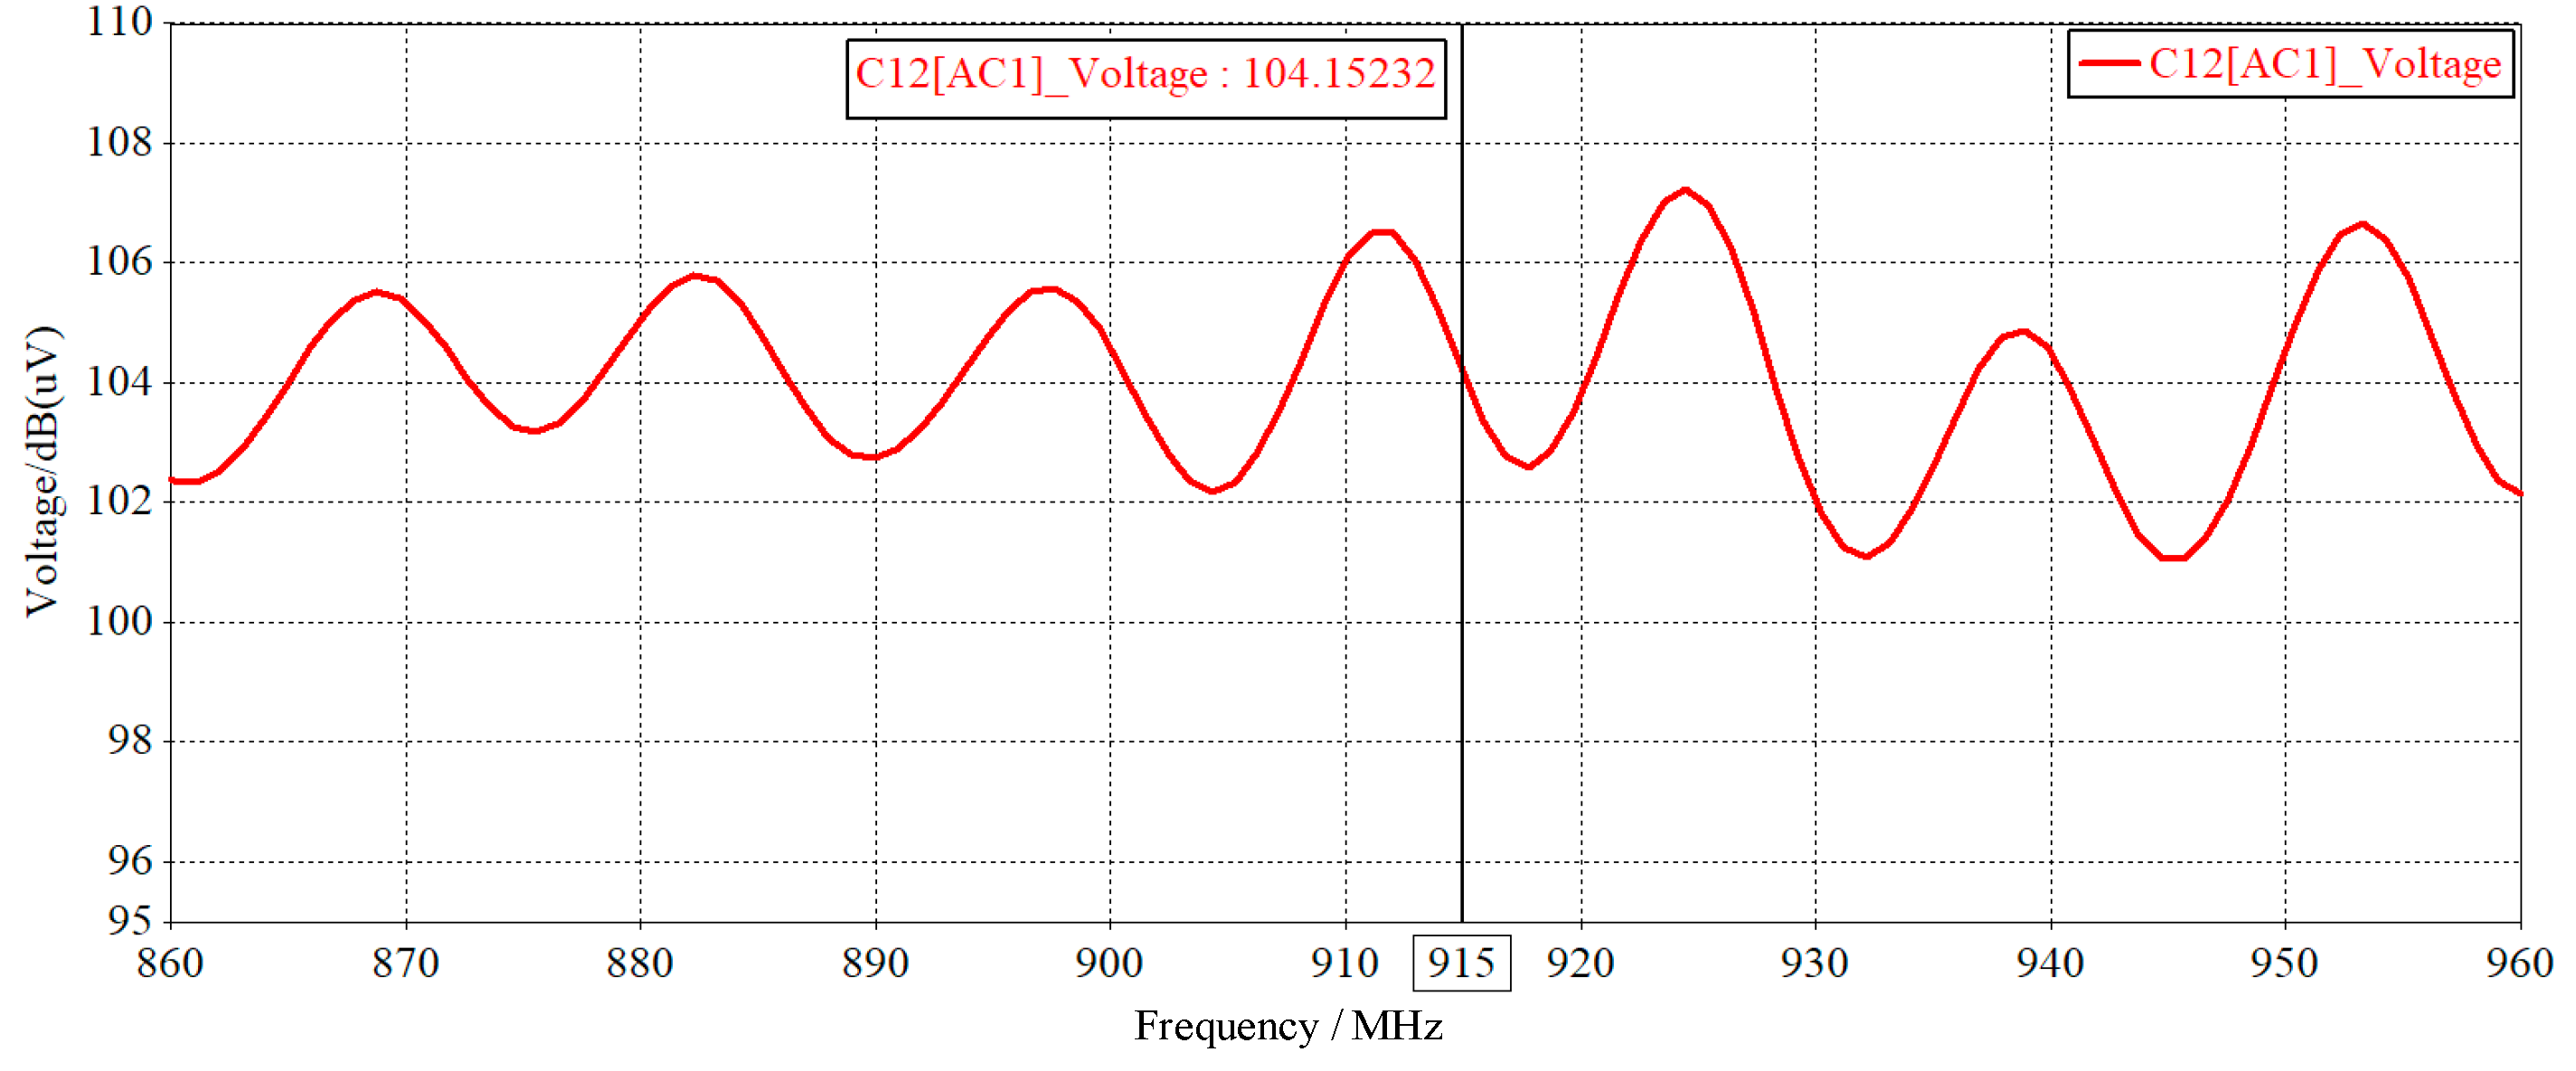
4.2. Simulation Analysis of RFID Temperature Tag Subject to Conducted Interference

Figure 22 shows the antenna by the conducted interference 1D/3D radiation direction chart. However, from this figure, it can be seen that the antenna radiation surface distortion, the maximum radiation angle, the width of the main flap, etc., have changed; the antenna's original 3D radiation direction chart in the radiation surface is similar to the car tire shape, antenna front radiation is more full, and the antenna by interference radiation deformation is more serious, the antenna radiation direction has changed, cannot meet the original directional requirements of the antenna.
Figure 23 shows the gain curve comparison of the antenna by conduction interference, the red curve is the gain curve of the antenna under normal conditions and the blue curve is the gain curve of the antenna after conduction interference. From the figure, it can be seen that the antenna by the excitation power cabinet conduction interference, antenna gain in 860 MHz~960 MHz between the obvious change, in the 915 MHz center frequency point, disturbed antenna gain than the original gain increased by nearly 26 dBi, combined with Figure 23 can be known that this is due to conduction interference makes the antenna radiation direction change, and make the antenna in each frequency point of a certain direction of radiation becomes great, some direction radiation becomes very small, and finally lead to the distortion of the antenna space radiation surface.
Figure 24 shows the antenna impedance curve comparison; the red curve for the antenna under normal conditions and the blue curve for the antenna after the conducted interference impedance curve. From the figure, the antenna by conduction interference can be seen in the 860 MHz~960 MHz band; the antenna impedance upward shift, in the center frequency point antenna impedance from the original 138.5 Ω increased to 483.8 Ω; the change amplitude reached 249.3%, increasing more than twice; that the antenna in the high-power excitation rectifier cabinet conduction interference; the impedance change is larger; the antenna impedance matching is out of tune; and antenna performance will be reduced.
Figure 25 shows the comparison of the S11 parameter curve of the antenna with conducted interference. The red curve is the S11 parameter curve of the antenna under normal conditions, and the blue curve is the S11 parameter curve of the antenna after conducting interference. It can be seen from the figure that the center frequency of the antenna after the interference has shifted significantly, from 915 MHz to 930 MHz, and S11 = −1.2 dB > −10 dB at 915 MHz frequency, and the bandwidth of S11 < −10 dB also has a certain degree of Narrowing, the bandwidth drop to 15%, EPC Gen2 standard most commonly used band 902 MHz~928 MHz S11 value is all greater than −10 dB, indicating that the antenna by the excitation power cabinet conduction interference has been unable to work normally under the original working frequency, RFID temperature measurement system will appear abnormal work, and antenna performance is reduced.
Through the simulation analysis of the antenna disturbed by the conducted electromagnetic interference of the excitation power cabinet, it can be seen that the antenna radiation direction, radiation gain, input impedance, and S11 parameters of the antenna are changed greatly, the antenna radiation surface produces distortion, the peak gain of each frequency point becomes larger, impedance mismatch, the center frequency point shift, the S11 parameters in the working band become larger, etc., which indicates that the antenna performance decreases after the conducted interference and cannot work in the standard frequency band, which is the cause of the data loss phenomenon.

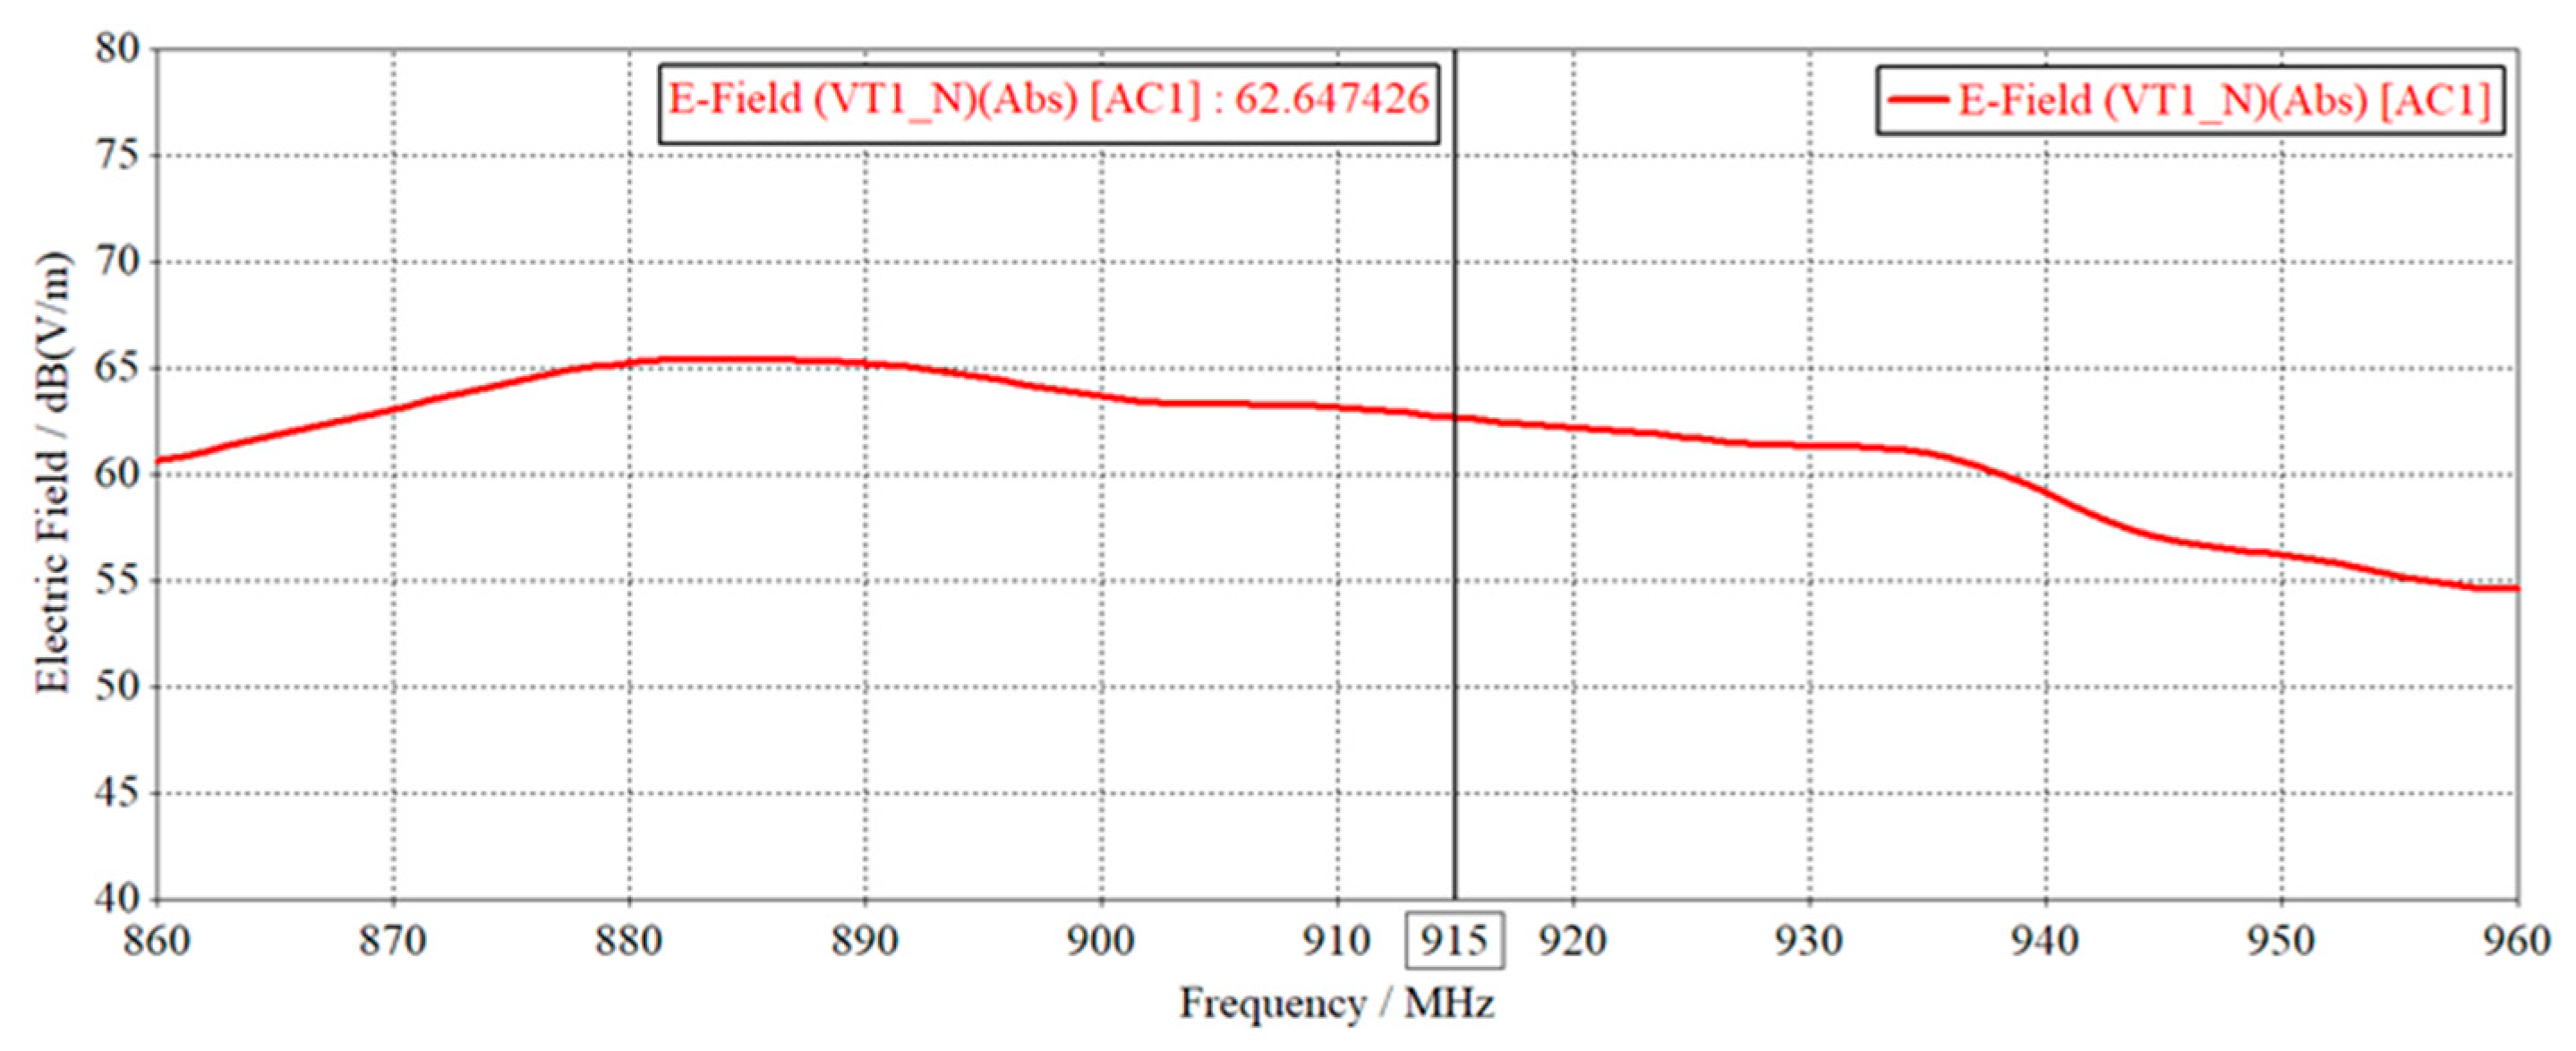
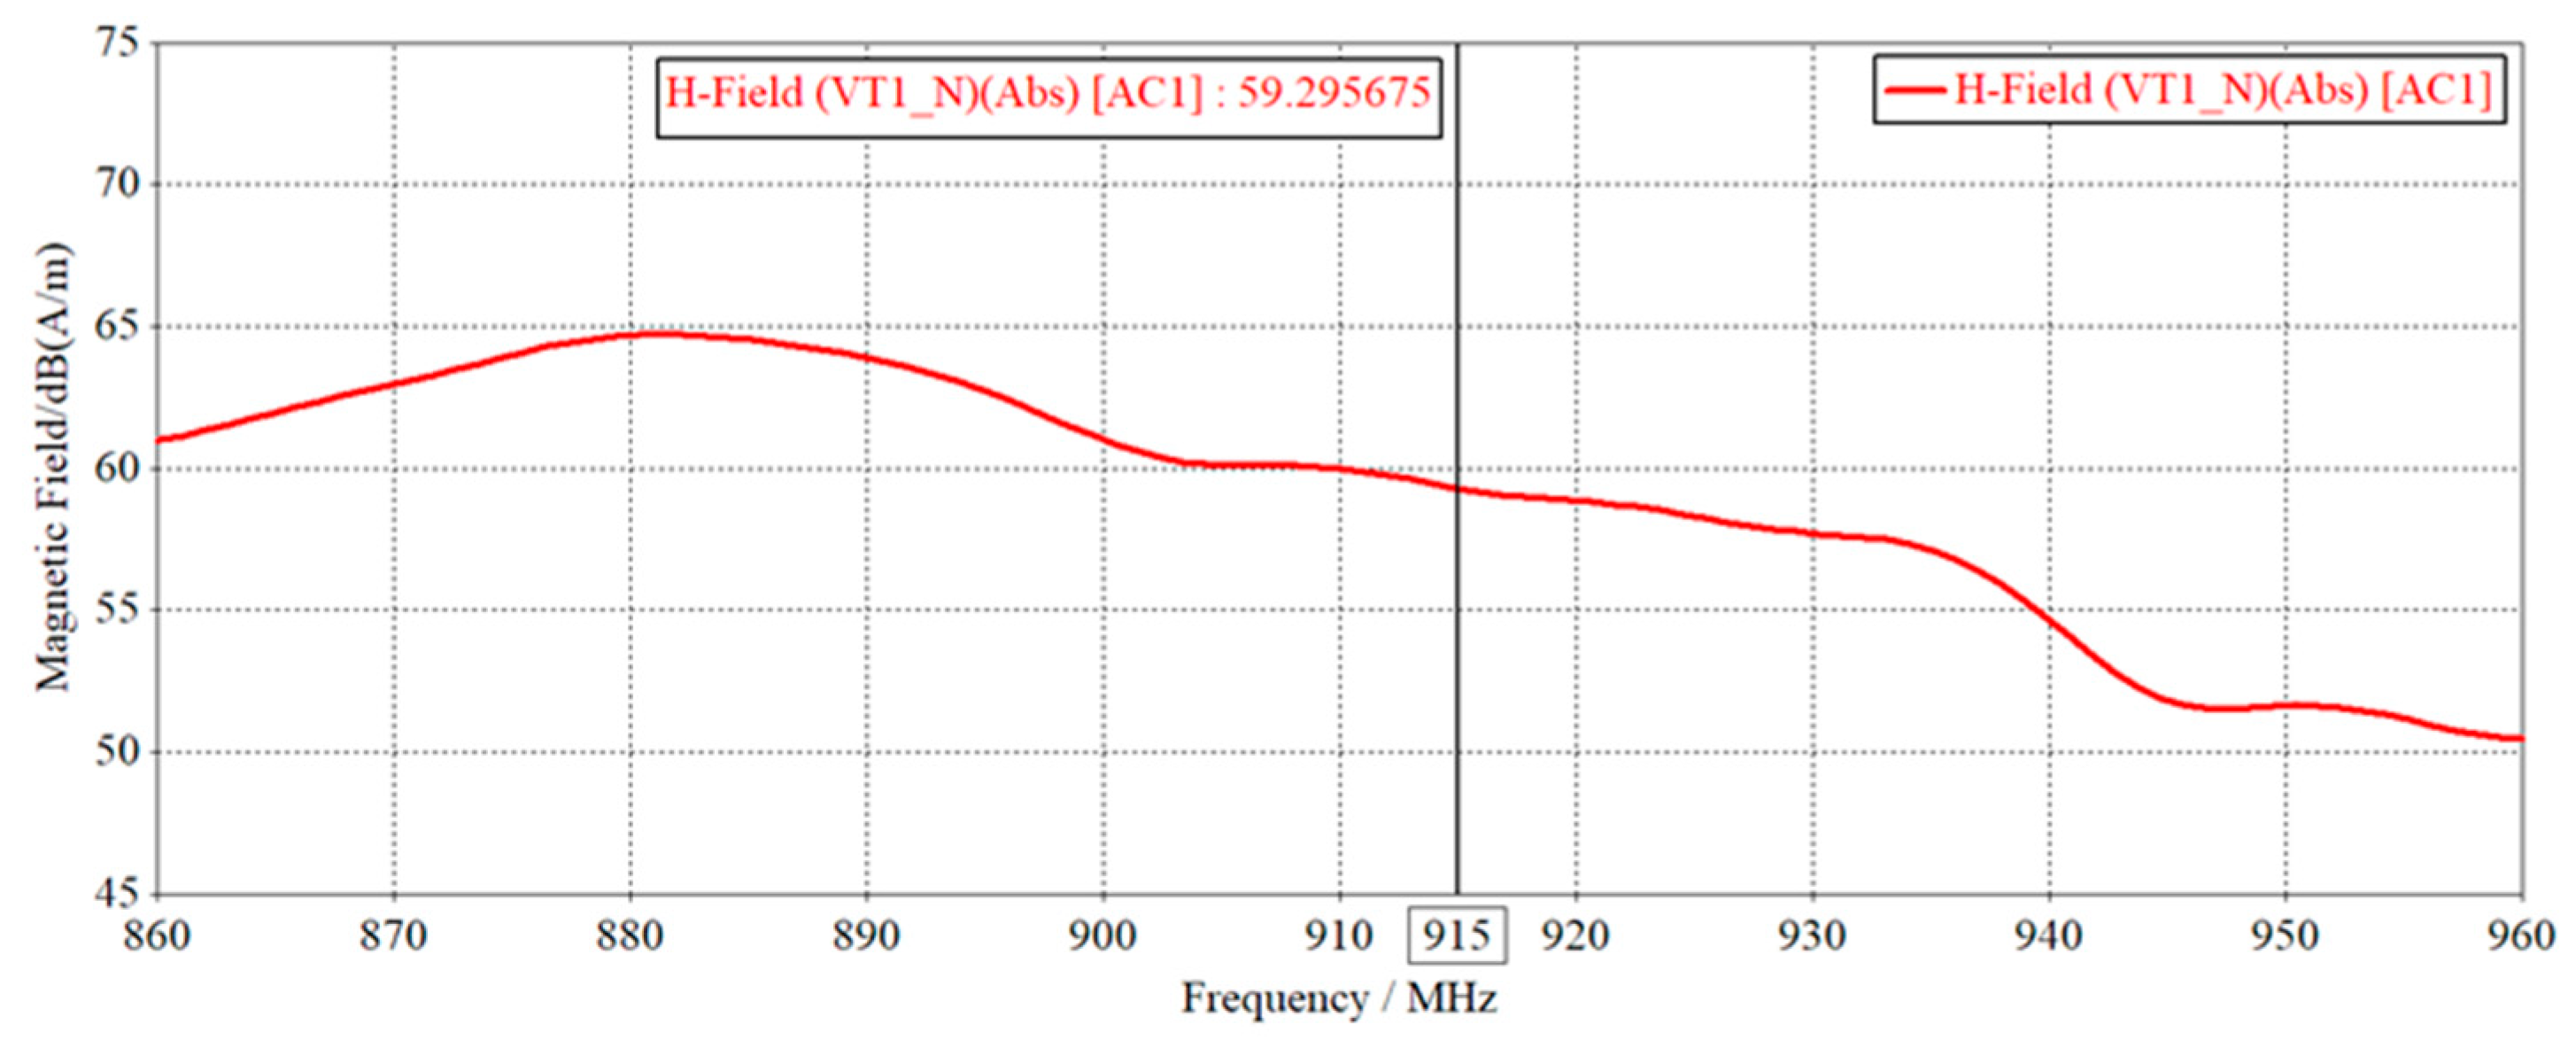
4.3. Simulation Analysis of RFID Temperature Tag Subject to Radiation Interference

Figure 26 shows the antenna by radiation interference 1D/3D radiation direction chart. However, from this figure, can be seen that the antenna radiation surface still produced distortion, and the maximum radiation angle, the width of the main flap, etc., has changed. The antenna's original 3D radiation direction chart in the radiation surface is similar to the car tire shape, the antenna front radiation is more full, and the antenna by interference radiation deformation is more serious, which is also related to the installation position of the antenna on the radiator. The change in the antenna radiation direction shows that the antenna is still affected by the excitation power cabinet radiator radiation interference.
Figure 27 shows the line by radiation interference antenna gain curve comparison. The red curve in the figure is the gain curve of the antenna under normal conditions, the blue curve is the gain curve of the antenna after the radiation interference. From the figure can be seen, the antenna by the excitation power cabinet radiation interference, antenna gain in 860 MHz~960 MHz between the change, but the change amplitude is not as large as the impact of conducted interference. At the 915 MHz center frequency point, the antenna gain disturbed the original gain increased by about 15.8 dBi. Combined with Figure 4, Figure 5, Figure 6, Figure 7, Figure 8, Figure 9, Figure 10, Figure 11, Figure 12, Figure 13, Figure 14, Figure 15, Figure 16, Figure 17, Figure 18, Figure 19, Figure 20, Figure 21 and Figure 22, it can be seen that this is due to radiation interference, making the antenna radiation direction change, and making the antenna in each frequency point a certain direction where some directions the radiation becomes larger, some directions of radiation becomes smaller, and finally, lead to the distortion of the antenna space radiation surface.
Figure 28 shows the antenna by radiation interference, the antenna impedance curve comparison, the red curve for the antenna under normal conditions, and the blue curve for the antenna by radiation interference impedance curve. From the figure, it can be seen that the antenna by radiation interference is in the 860 MHz~960 MHz band; the antenna impedance overall downward shift, in the center frequency point antenna impedance from the original 138.5 Ω reduced to 116.3 Ω, the change amplitude of about 19.1%, indicating that the antenna in the radiator radiation interference, impedance change, and the antenna impedance matching also changed; the antenna’s performance will be affected.
Figure 29 shows the S11 parameter curve comparison of the antenna by conducted interference. The red curve is the S11 parameter curve of the antenna under normal conditions, and the blue curve is the S11 parameter curve of the antenna after radiation interference. It can be seen from the figure that the center frequency point of the antenna is shifted after the interference, from 915 MHz to 906 MHz, and the S11 = −3.8 dB > −10 dB at 915 MHz frequency. The bandwidth of S11 < −10 dB is also slightly narrowed, but the bandwidth of S11 < −10 dB also has a slight narrowing, but the band still all fall in the most common band of EPC Gen2 standard 902 MHz~928 MHz, indicating that the antenna is affected by the radiation interference from the radiator, but the radiation interference has a small impact on the antenna, and the working performance of the antenna is limited.
Through the high-power excitation rectifier cabinet, radiation electromagnetic interference on the antenna by the simulation analysis can be seen, the antenna radiation direction, radiation gain, input impedance, and antenna S11 parameters are changed, the antenna radiation surface distortion, the peak gain of each frequency point becomes large, impedance mismatch, the center frequency point shift, but the change amplitude are small, far from seriously affect the antenna performance, indicating that the antenna by the radiator radiation interference after the performance of the impact, but the impact is small, the antenna can still work in the standard frequency band.

5. Conclusions

This paper proposes the following:
First, a short-circuit cutoff wire structure-based RFID antenna is designed for high-power rectifier heatsink temperature monitoring.
Second, a simulation model of high-power rectifier heatsink electromagnetic interference and RFID temperature tag electromagnetic interference is established to address the electromagnetic interference issues of high-power rectifier heatsinks.
Third, the electromagnetic interference characteristics of the excitation power cabinet and the RFID temperature tag are simulated and studied.
After simulations and analysis, the following conclusions are drawn:
(1)
The designed common RFID anti-metal temperature measurement tag antenna based on a short-circuit shortcut structure has good anti-metal performance, as verified through simulations.
(2)
The established simulation model of electromagnetic interference of high-power rectifier power heatsinks shows that high-power rectifier power heatsinks will generate significant conductive electromagnetic interference and minor radiative electromagnetic interference.
(3)
Based on the electromagnetic interference simulation model, an electromagnetic interference simulation model of the RFID temperature tag is established and its electromagnetic interference characteristics are simulated and analyzed.
In summary, the designed RFID antenna has good anti-metal performance, making it suitable for high-power rectifier heatsink temperature monitoring. The electromagnetic interference simulation models help analyze the electromagnetic interference characteristics of both the high-power rectifier heatsink and RFID temperature tag.

Author Contributions

Methodology, J.L.; Software, Z.Z.; Validation, W.G.; Investigation, Z.X.; Resources, Z.L.; Writing—original draft, H.L.; Supervision, X.D.; Project administration, L.S. All authors have read and agreed to the published version of the manuscript.

Funding

This work was supported by the consulting project of State Grid Hunan Electric Power Company Limited under Grant [B616A2230002].

Conflicts of Interest

The authors declare no conflict of interest.

References

  1. Fujisaki, K. Evaluation of 13.56 MHz RFID system performance considering communication distance between reader and tag. J. High Speed Netw. 2019, 25, 61–71. [Google Scholar] [CrossRef]
  2. Inserra, D.; Wen, G. Low profile metal tolerant UHF RFID tag with lumped elements for post-manufacturing frequency tuning. IEEE Trans. Antennas Propag. 2021, 69, 7953–7958. [Google Scholar] [CrossRef]
  3. Abdulhadi, A.E.; Mandev, S.; Abhari, R. Signal integrity and EMI evaluations of an RFID-Sensor tag for internet-of-things applications. In Proceedings of the 2015 IEEE Symposium on Electromagnetic Compatibility and Signal Integrity, Santa Clara, CA, USA, 15–21 March 2015; pp. 128–132. [Google Scholar]
  4. Zhang, G.; Dai, Y.; Zhang, X.; Lv, Y.J. Adaptive impedance matching system for downlink of passive semi-ultra wideband ultra-high frequency radio frequency identification tag. Int. J. Adapt. Control. Signal Process. 2012, 26, 530–540. [Google Scholar] [CrossRef]
  5. Wang, X.; Zhang, J.; Yu, Z.; Mao, S.; Periaswamy, S.C.; Patton, J. On remote temperature sensing using commercial UHF RFID tags. IEEE Internet Things J. 2019, 6, 10715–10727. [Google Scholar] [CrossRef]
  6. Wang, L.; Xing, H.; Qian, X.; Kwong, J.C.T.; Oppus, C.M. Temperature Sensing and Detecting Technology of Distribution Equipment Based on RFID. In Proceedings of the 2020 5th International Conference on Control and Robotics Engineering (ICCRE), Osaka, Japan, 24–26 April 2020; pp. 130–134. [Google Scholar]
  7. Zhang, Y.; Liu, F.; Pang, H.; Li, X.; Liu, Z.; He, Y. A RFID-based temperature measurement system for smart substation. In Proceedings of the 2018 International Conference on Electronics and Electrical Engineering Technology, Tianjin, China, 19–21 September 2018; pp. 57–61. [Google Scholar]
  8. Chen, Z.; Deng, F.; He, Y.; Liang, Z.; Fu, Z.; Zhang, C. A self-powered RFID sensor tag for long-term temperature monitoring in substation. J. Electr. Eng. Technol. 2018, 13, 501–512. [Google Scholar]
  9. Wang, B.; Law, M.K.; Yi, J.; Tsui, C.Y.; Bermak, A. A −12.3 dBm UHF passive RFID sense tag for grid thermal monitoring. IEEE Trans. Ind. Electron. 2019, 66, 8811–8820. [Google Scholar] [CrossRef]
  10. Zhou, W.; Lei, Y.; Dong, Q.; Li, H.; Zhang, D.; Ren, X.; Zhou, J. Fusion design and experiment of RFID passive wireless temperature sensor and hollow reactor. High Volt. Electr. Appl. 2021, 57, 144–153. [Google Scholar]
  11. Wu, X.; He, Y.; Deng, F.; Su, Y.; Fu, Z. Research on online temperature monitoring technology for power cables based on SAW-RFID. Instrum. Tech. Sens. 2018, 425, 113–117. [Google Scholar]
  12. Xu, C.; Wang, H.; Deng, F. Research on online temperature monitoring technology for high-voltage switchgear based on SAW-RFID. Instrum. Tech. Sens. 2016, 406, 42–45. [Google Scholar]
  13. Yu, J.; Yang, Z.; Jiang, C.; Li, S.; Tan, Z. Design and realization of primary equipment's passive temperature measurement system based on RFID. J. Cent. China Norm. Univ. (Nat. Sci.) 2015, 49, 532–537. [Google Scholar]
  14. Muralter, F.; Arjona, L.; Landaluce, H.; Perallos, A. A passive computational UHF RFID platform using vector backscatter modulation. IEEE Sens. J. 2022, 22, 6145–6149. [Google Scholar] [CrossRef]
  15. Tang, X. Design and Investigation of Novel UHF Metal-Mountable RFID Tag Antenna; Wuhan University of Technology: Wuhan, China, 2020. [Google Scholar]
  16. Wang, C.; Shao, X.; Meng, Y.; Gao, J. A physical layer network coding based tag anti-collision algorithm for rfid system. CMC-Comput. Mater. Contin. 2021, 66, 931–945. [Google Scholar] [CrossRef]
  17. Ibrahim, G.; Plytage, A. UHF RFID systems; Their susceptibility to backscattered signals induced by electronic ballast driven fluorescent lamps. IEEE Trans. Antennas Propag. 2010, 58, 2473–2478. [Google Scholar] [CrossRef]
  18. Xianren, H.; Dongyan, Z.; Xiaoke, T.; Dejian, L.; Xi, F.; Hongwei, S. A uhf rfid communication link rate adjustment strategy and implementation. In Proceedings of the 2020 IEEE 3rd International Conference on Electronics and Communication Engineering (ICECE), Xi’an, China, 14–16 December 2020; pp. 22–25. [Google Scholar]
  19. Take, R.; Okano, Y.; Noda, K. Absorption evaluation of electromagnetic wave absorbers in practical environments. In Proceedings of the 2020 International Symposium on Antennas and Propagation (ISAP), Osaka, Japan, 25–28 January 2021; pp. 415–416. [Google Scholar]
  20. Li, J.; Tian, Y.; Zhang, C. Intelligent Online Monitoring Technology of Green Power Transmission and Transformation Equipment Based on Internet of Things. Mob. Inf. Syst. 2022, 2022, 3679898. [Google Scholar] [CrossRef]
  21. Sarr, P.W.; Dioum, I.; Diallo, K.; Sané, L.; Ba, D. Miniaturized PIFA RFID UHF Tag Antenna for Metal Surface Applications. In Proceedings of the 2022 Microwave Mediterranean Symposium (MMS), Pizzo Calabro, Italy, 9–13 May 2022; pp. 1–5. [Google Scholar]
  22. Lin, S.; Zhao, M.; Ren, X.; Zhou, X.; Yang, Z.; Wang, H.; Zhao, P. Research on temperature measuring equipment for Substation and Its EMC Performance. Autom. Instrum. 2021, 42, 25–28. [Google Scholar]
  23. Tang, X.; Zhang, B.; Zhang, J.; He, D.; Wu, Z.; Liu, C. Design of miniaturized low profile UHF RFID anti metal tag antenna. Piezoelectricity Acousto Opt. 2020, 42, 418–422. [Google Scholar]
  24. Xiang, X.; Zhang, P.; Yuan, Q.; Li, R.; Pei, Y. Application method of collision prevention detection and warning model in RFID identification. Appl. Microcontroller Embed. Syst. 2021, 21, 70–73+78. [Google Scholar]
  25. Shimin, W.; Degui, Y. Measurements and Analysis of Electromagnetic Environment of High-voltage Converter Station. In Proceedings of the 2008 International Conference on High Voltage Engineering and Application, Chongqing, China, 9–12 November 2008; pp. 301–304. [Google Scholar]
  26. Redl, R. Electromagnetic environmental impact of power electronics equipment. Proc. IEEE 2001, 89, 926–938. [Google Scholar] [CrossRef]
  27. Li, M.; Zhao, Y.; Zhang, M.; Jiang, S.; Farooq, A.; Liu, L.; Ge, A.; Liu, L. Recent progress in the application of cellulose in electromagnetic interference shielding materials. Macromol. Mater. Eng. 2022, 307, 2100899. [Google Scholar] [CrossRef]
  28. Luo, X.; Liu, W.; Li, J. On-Load Electromagnetic Compatibility Test and Simulation Closed-Loop of the Electric Drive System of New Energy Vehicles. Int. Trans. Electr. Energy Syst. 2022, 2022, 9256401. [Google Scholar] [CrossRef]
  29. Sasaki, M.; Imaoka, J.; Yamamoto, M. An Investigation on the Relationship between CM Noise and Distribution of Parasitic Capacitance. In Proceedings of the 2022 International Power Electronics Conference (IPEC-Himeji 2022-ECCE Asia), Himeji, Japan, 15–19 May 2022; pp. 753–758. [Google Scholar]
  30. Burkert, A.; Schmuelling, B. Comparison of Two Power Factor Correction Topologies on Conducted Emissions in Wireless Power Transfer Systems for Electric Vehicles. In Proceedings of the 2021 IEEE Vehicle Power and Propulsion Conference (VPPC), Gijon, Spain, 25–28 October 2021; pp. 1–6. [Google Scholar]
  31. Amin, A.; Choi, S. A review on recent characterization effort of CM EMI in power electronics system with emerging wide band gap switch. In Proceedings of the 2019 IEEE Electric Ship Technologies Symposium (ESTS), Washington, DC, USA, 14–16 August 2019; pp. 241–248. [Google Scholar]
  32. Basyigit, I.B.; Genc, A.; Dogan, H.; Helhel, S. The effect of fin types of the heatsinks on radiated emission on the printed circuit board at S-C band. Microw. Opt. Technol. Lett. 2020, 62, 3099–3106. [Google Scholar] [CrossRef]
  33. Jia, S.; Zhao, Z.; Shi, B.; Zhu, Y. Numerical modeling and analysis of electromagnetic interference in power electronic systems. Trans. China Electrotech. Soc. 2021, 36, 2383–2393+2423. [Google Scholar]
  34. Cao, H.; Jiang, Z.; Shen, J.; Li, B. Research on common mode electromagnetic interference in high power dual three level variable frequency speed control system. Trans. China Electrotech. Soc. 2016, 31, 17–25. [Google Scholar]
  35. Zhou, P.; Pei, X.; Zhang, K.; Shan, Y. Analysis, modeling, and suppression of the interaction mechanism of conducted electromagnetic interference between equipment in DC power supply systems. Proceeding CSEE 2022, 42, 4727–4738. [Google Scholar]
Figure 1. RF thermometer remote temperature measurement system.
Electronics 12 03577 g001
Figure 2. RFID temperature measurement system electromagnetic wave interference.
Electronics 12 03577 g002
Figure 3. New anti-metal RFID tag structure diagram.
Electronics 12 03577 g003
Figure 4. Tag antenna 1D/3D radiation direction chart. (a) Anti−metal tag antenna 1D/3D radiation direction diagram, (b) traditional non−anti−metal tag antenna 1D/3D radiation direction diagram. The red line is gain curve when phi is 90°, and blue line is gain curve when phi is 0°.
Electronics 12 03577 g004
Figure 5. Tag antenna S11 parameter curve. (a) Anti–metal tag antenna S11 parameter curve, (b) Common non–anti–metal tag antenna S11 parameter curve.
Electronics 12 03577 g005
Figure 6. Physical RFID anti-metal temperature tag code.
Electronics 12 03577 g006
Figure 7. The main circuit of the excitation power cabinet.
Electronics 12 03577 g007
Figure 8. The electromagnetic simulation model of high-power rectifier power heatsink.
Electronics 12 03577 g008
Figure 9. Heatsink parasitic capacitance settings.
Electronics 12 03577 g009
Figure 10. Electromagnetic interference simulation model.
Electronics 12 03577 g010
Figure 11. Conducted current.
Electronics 12 03577 g011
Figure 12. Conducted voltage.
Electronics 12 03577 g012
Figure 13. Thyristor VT1 cathode heatsink electric field.
Electronics 12 03577 g013
Figure 14. The magnetic field of thyristor VT1 cathode heatsink.
Electronics 12 03577 g014
Figure 15. Heatsink 3D radiation direction diagram.
Electronics 12 03577 g015
Figure 16. Heatsink 1D/3D radiation direction diagram.
Electronics 12 03577 g016
Figure 17. Heatsink radiation gain curve.
Electronics 12 03577 g017
Figure 18. Heatsink radiation S11 parameter curve.
Electronics 12 03577 g018
Figure 19. Port matching using Smith’s circle diagram.
Electronics 12 03577 g019
Figure 20. Port Matching Capacitor Topology.
Electronics 12 03577 g020
Figure 21. RFID temperature tag electromagnetic interference simulation model.
Electronics 12 03577 g021
Figure 22. Antenna by conducted interference 1D/3D radiation direction diagram.
Electronics 12 03577 g022
Figure 23. Comparison of antenna gain curve by conducted interference antenna.
Electronics 12 03577 g023
Figure 24. Comparison of antenna impedance curves for antennas subject to conducted interference.
Electronics 12 03577 g024
Figure 25. Comparison of S11 parameter curves for antennas subject to conducted interference.
Electronics 12 03577 g025
Figure 26. Antenna by radiation interference 1D/3D radiation direction diagram.
Electronics 12 03577 g026
Figure 27. Comparison of antenna gain curve by radiation interference antenna.
Electronics 12 03577 g027
Figure 28. Comparison of antenna impedance curves for antennas subject to radiation interference.
Electronics 12 03577 g028
Figure 29. Comparison of S11 parameter curves for antennas subject to radiation interference.
Electronics 12 03577 g029
Disclaimer/Publisher’s Note: The statements, opinions and data contained in all publications are solely those of the individual author(s) and contributor(s) and not of MDPI and/or the editor(s). MDPI and/or the editor(s) disclaim responsibility for any injury to people or property resulting from any ideas, methods, instructions or products referred to in the content.

