Article

A New Approach for the Incorporation of the End-User’s Smart Power–Electronic Interface in Voltage Support Application

by
Reza Etemad
1,
Mohammad Sadegh Ghazizadeh
1,
Mehrdad Ahmadi Kamarposhti
2,*,
Ilhami Colak
3 and
Kei Eguchi
4
1
Faculty of Electrical Engineering, Shahid Beheshti University, Tehran 1983969411, Iran
2
Department of Electrical Engineering, Jouybar Branch, Islamic Azad University, Jouybar, Iran
3
Department of Electrical and Electronics Engineering, Faculty of Engineering and Architectures, Nisantasi University, Istanbul, Turkey
4
Department of Information Electronics, Fukuoka Institute of Technology, Fukuoka 811-0295, Japan
*
Author to whom correspondence should be addressed.
Electronics 2022, 11(5), 765; https://doi.org/10.3390/electronics11050765
Submission received: 24 January 2022 / Revised: 15 February 2022 / Accepted: 23 February 2022 / Published: 2 March 2022

Abstract

:
Technology advancement in power–electronic interfaces and their evolution open an opportunity to end-users to benefit from their newfound capability. For the end-users, power–electronic interfaces can act as Distributed Energy Resources (DERs) for reactive power injection and absorption. If these power–electronic interface capabilities can be properly integrated into traditional utility system operations, they can be used as beneficial tools for distribution management and voltage profile enhancement. Considering the present distribution system, it is not possible to communicate to all DERs. In this paper, we considered two proposed residential-control and droop-control methods. The multi-criteria decision-making technique (MCDM), along with fuzzy theory, was used to prioritize candidate buses for their participation in the Volt-VAR program. In this paper, the contribution of active DERs in reactive power compensation was evaluated.

1. Introduction

In recent years, many efforts have been made to use the power–electronic interfaces of DERs as grid resources. For this aim, many researchers have worked collaboratively to develop smart inverters [1]. Rogers et al. [1] employed Responsive End-user Devices (REDs) and DERs. In the present study, a sensitivity analysis was used for the selection of candidate buses, and the loads were considered deterministic. The concept of the smart inverters was comprehensively investigated in [2]. In this research, the intelligent Volt-VAR concept was explained and extensively validated by examples. The study aimed to provide communication configuration parameters to support Volt-VAR modes and the results were evaluated. As mentioned in [3], such functions have great superiority regarding complex communication schemes, and it is possible to use the same configuration curves across many different DERs without adjusting for the local condition of each DER. In order to change the Volt-VAR mode, it is possible to use a schedule to manage which mode is in effect at any time. These emerging smart inverters allow the distribution system operator to monitor and manipulate individual end-user devices [3]. The power–electronic interface of newly designed end-user devices is highly capable; it can change their power control promptly without inherent inertia, and quickly respond to commands and residential conditions. In [4], the droop control is used in order to benefit from the electric and thermal household loads. In this paper, the air-source heat pump was modeled as dependent/independent of the grid state. Considering that the communication infrastructure for the centralizing control was very complex and not available in the present distribution network, the dependency was modeled as decentralized droop control. In this paper, all heat pumps were capable of changing their demand based on the local network state. This paper only considered the active power manipulation of the heat pumps. When the local voltage deviated 0.01 p.u from the reference voltage, the heat pump interacted to enhance the voltage profile. In [5], the effect of droop control of the distributed generation was investigated on the distribution network. In this study, by considering the distribution network characteristics, the effect of the active power variation on voltage was investigated. M. Bayat, in [6], used sensitivity analysis to determine optimal Q-C buses as the candidate buses to provide reactive power. However, the optimal choice of Q-C buses depends on many factors, such as available reactive power, network topology, etc.; however, they were not considered in this research. The Q-C buses are the distribution network buses that control their output reactive power (Q) and are expressed as Q-Controlled or Q-C buses. These buses can participate in Volt-VAR programs. Such devices can include the PHEV/EV, personal computers, appliances, elevators, UPS systems, etc. [7]. In [7], the available reactive power was considered in Q-C bus selection, but other effective factors were neglected. The control mechanisms of the Q-C buses were reviewed in this paper. Aquino-Lugo et al. in [8], following Rogers et al. [1], studied a control framework for the application of voltage support to smart grids. The control algorithms that were implemented using the proposed control algorithm had a hierarchical arrangement of realms. The results showed that the hierarchical arrangement of realms was flexible enough to handle problems in a decentralized way, instead of always in a centralized top-down manner. The load model was definitive and Q-C selection was performed by sensitivity analysis. Authors in [9] investigated the capability of inverters, and connected DERs to cooperate in a reactive power support program. This paper provided an intelligent control framework based on Incident Command System (ICS) structure. The proposed structure consisted of layers and devices, which worked together to achieve a goal. Although the proposed control framework provides a convenient way to segregate and secure communications on the smart grid, it needs a complex communication infrastructure. Rogers et al., in both [1,9], considered the effect of end-user participation in Volt-VAR programs on transmission system-level. In these papers, the candidate buses were controlled in a centralized manner, the prerequisite of which was a complex communication burden that makes it impossible in the near future. Li and et al. [10] investigated the use of DERs with regard to distributed generation to increase voltage. In [11,12,13,14], the advantages of providing Volt-VAR control over existing DERs using their electronic–power interfaces were fully discussed. The end-users with power–electronic interfaces were capable of participation in Volt-VAR programs. These types of users acted like intelligent VAR sources, and their participation was determined based on the network status and their voltage profile. Additionally, the VAR generation in usage points alleviated the network-line capacity and enhanced the total network voltage profile.
Power–electronic interfaces have many benefits regarding their characteristics. By using this type of interface, it is possible to improve the power quality of the distribution system; moreover, harmonic control is another capability of the power–electronic interface. The main option of the power–electronic interface focused on in this paper is the VAR support function and its usage for voltage enhancement in distribution systems [15]. The end-users with power–electronic interfaces act like distributed VAR sources in a distribution network. These types of VAR sources have many benefits for network stability and voltage profile regulation. Moreover, the injected/absorbed VAR in this scheme is defined based on the network status and is more beneficial with regard to static capacitor placement [16].
As discussed, all the reviewed literature used sensitivity analysis to determine the candidate buses for the Volt-VAR program. Although this criterion is an important issue for this goal, ignoring the other effective criteria undoubtedly influences the accuracy of the results. The novelty of this paper is in its consideration of the proposed residential-control and droop-control methods to solve the problem. In fact, multi-criteria technical decision making (MCDM) with fuzzy theory has been used to prioritize candidate buses to participate in the Volt-VAR program. This technique considers multiple criteria simultaneously, and it is an optimal way of prioritizing the buses and choosing the best nodes for Volt-VAR program implementation. Additionally, this technique considers experts’ decisions, which is very valuable and compatible with the network’s existing situation. The proposed method used the multi-criteria decision-making technique mixed with the fuzzy theory to provide a more accurate candidate bus selection method. Additionally, considering the present situation of the distribution system, on-line communication with all candidate buses is almost unrealistic. To fill the pre-mentioned gaps, self-controlling and residential control methods were used simultaneously to simulate a more realistic situation.
The following sections are: Section 2, in which the used models and formulation are presented; Section 3, in which a brief description of the power–electronic interface is proposed; Section 4, in which the proposed algorithm is presented; Section 5, in which the simulation and analysis of the results are presented; and Section 6, in which the results are discussed and concluded.

2. Problems Modeling and Formulation

A brief description of the used models is illustrated in this section:
The DERs are the end-user devices that use the electronic–power interface to connect to the distribution system. Electronic interfaces give new power to these devices. When a device is “ON”, most of the capacity of its electronic–power interface is occupied by the required active power, and the ability to inject reactive power in the “OFF” mode is greatly increased. The available reactive power can be obtained as follows [7]:
A v a i l a b e   r e a c t i v e   p o w e r ( i ) = P O N , i × Q O N , i a c c e s s i b l e + ( 1 P O N , i ) × Q O F F , i a c c e s s i b l e
where P O N , i , Q O N , i a c c e s s i b l e and Q O F F , i a c c e s s i b l e are the cooperation possibility and available reactive power in “ON” and “OFF” modes, respectively. One of the involved items in the selection of Q-C buses is the available reactive power.
As discussed previously, regarding the present condition of the distribution network and communication infrastructure, communication with all end-user nodes is not practical. As previously proposed by EPRI [2], the end-users can be classified into three main types based on their capabilities; the first type of end-user does not have communication capability or a sense of local condition; the second type of end-user has communication capability and responds to commands; and finally, the third type of end-user responds to the local condition solely. The goal of this paper is to investigate the interaction of these three types of end-users in a distribution-system operation and evaluate their cooperation on the distribution-system condition.
In this paper to evaluate the real condition of the distribution system, all three mentioned end-user types are considered. Thus, some nodes participate in Volt-VAR programs using the droop-control mechanism. This function provides a flexible mechanism in which a DER can manage its own VAR output. The output is changed due to local conditions. Each Volt-VAR curve is considered a “mode”. A DER can acquire multiple Volt-VAR modes, each of which has its own configuration. A DER device can be set to a pre-configured mode, and this mode can be changed by a simple command from the distribution network operator. The Volt-VAR curve is described by the percentage of the voltage and the available VAR (100% represents reference value). A calculation permits same configuration curve to be used for many different DERs. An example of a Volt-VAR curve is depicted in Figure 1 [2].
As shown in Figure 1, each array consists of a variable number of points, which together, define a piece-wise linear curve. In Figure 1, there are four nodes, denoted by P1 through P4. The Volt-VAR behavior curve includes a voltage for each point, given as the percentage of the reference voltage, and the desired VAR level, given as the percentage of available VARs. The configuration can have only one point (a horizontal line), two points (a ramp), or many points. The desired VAR level determination method is shown in Figure 2.
As depicted in Figure 2, the participation of the end-users with power–electronic interfaces is defined based on the network condition and Volt-VAR program. These types of end-users can manage their participation such that they have the best influence on network stability and voltage-profile enhancement.
As shown, the cooperation of the type-3 DERs is determined based on their associated Volt-VAR curve, which is schematically depicted in Figure 2 and formulated in Equation (2):
a 1 = QDroop / ( node 01 node 02 ) ; b 1 = node 02 × QDroop / ( node 01 node 02 ) ; a 2 = QDroop / ( node 04 node 03 ) ; b 2 = node 03 × QDroop / ( node 04 node 03 ) ; { for   i = 1 : length ( VolDev ) if   ( VolDev ( i ) < node 01 ) ,   Qfactdroop ( i ) = QDroop ( i ) ; elseif   ( VolDev ( i ) > node 01   & &   VolDev ( i ) < node 02 ) ,   Qfactdroop ( i ) = a 1 ( i ) × VolDev ( i ) + b 1 ( i ) ;   elseif   ( VolDev ( i ) > node 02   & &   VolDev ( i ) < node 03 ) ,   Qfactdroop ( i ) = 0 ; elseif   ( VolDev ( i ) > node 03   & &   VolDev ( i ) < node 04 ) ,   Qfactdroop ( i ) = a 2 ( i ) × VolDev ( i ) + b 2 ( i ) ; elseif   ( VolDev ( i ) > node 04   ) ,   Qfactdroop ( i ) = QDroop ( i ) ; end end
Until now, an end-user of type-3 has been investigated. Type-2 end-users have direct and on-line communication with the distribution system manager and participate in the Volt-VAR program based on their input commands. The remaining end-users did not participated in Volt-VAR program, which might be due to their characteristics, or it may have been their wish.

Load Flow Formulation

The Load flow is the solution that is used to find the steady-state voltage of the power system nodes at the fundamental frequency, given a certain set of generation and loading conditions. The efficiency of the load flow methods are dependent on various criteria, such as convergence rate and computationally efficiency [17]. Load flow solutions on transmission network are well developed for power system operation, control, and planning using Newton–Raphson, Gauss–Seidel and fast-decoupled load-flow methods [18]. Unlike a transmission system, a distribution system typically has radial topological structure. Unfortunately, this radial structure, with a higher resistance/reactance (R/X) ratio of the lines, makes the conventional load-flow methods unsuitable for most distribution system load-flow problems. One of the distinguishing features of the radial distribution network is that there is a unique path from a specific bus to the source, and this feature is exploited by a forward–backward sweep technique. This technique consists of two fundamental steps, which are repeatedly used to achieve convergence. The backward sweep is primarily a current or power-flow summation with possible voltage updates. The forward sweep is primarily a voltage-drop calculation with possible current or power flow updates. This paper employs the forward–backward sweep technique with two developed matrices—the bus-injection to the branch-current matrix, and the branch-current [19].

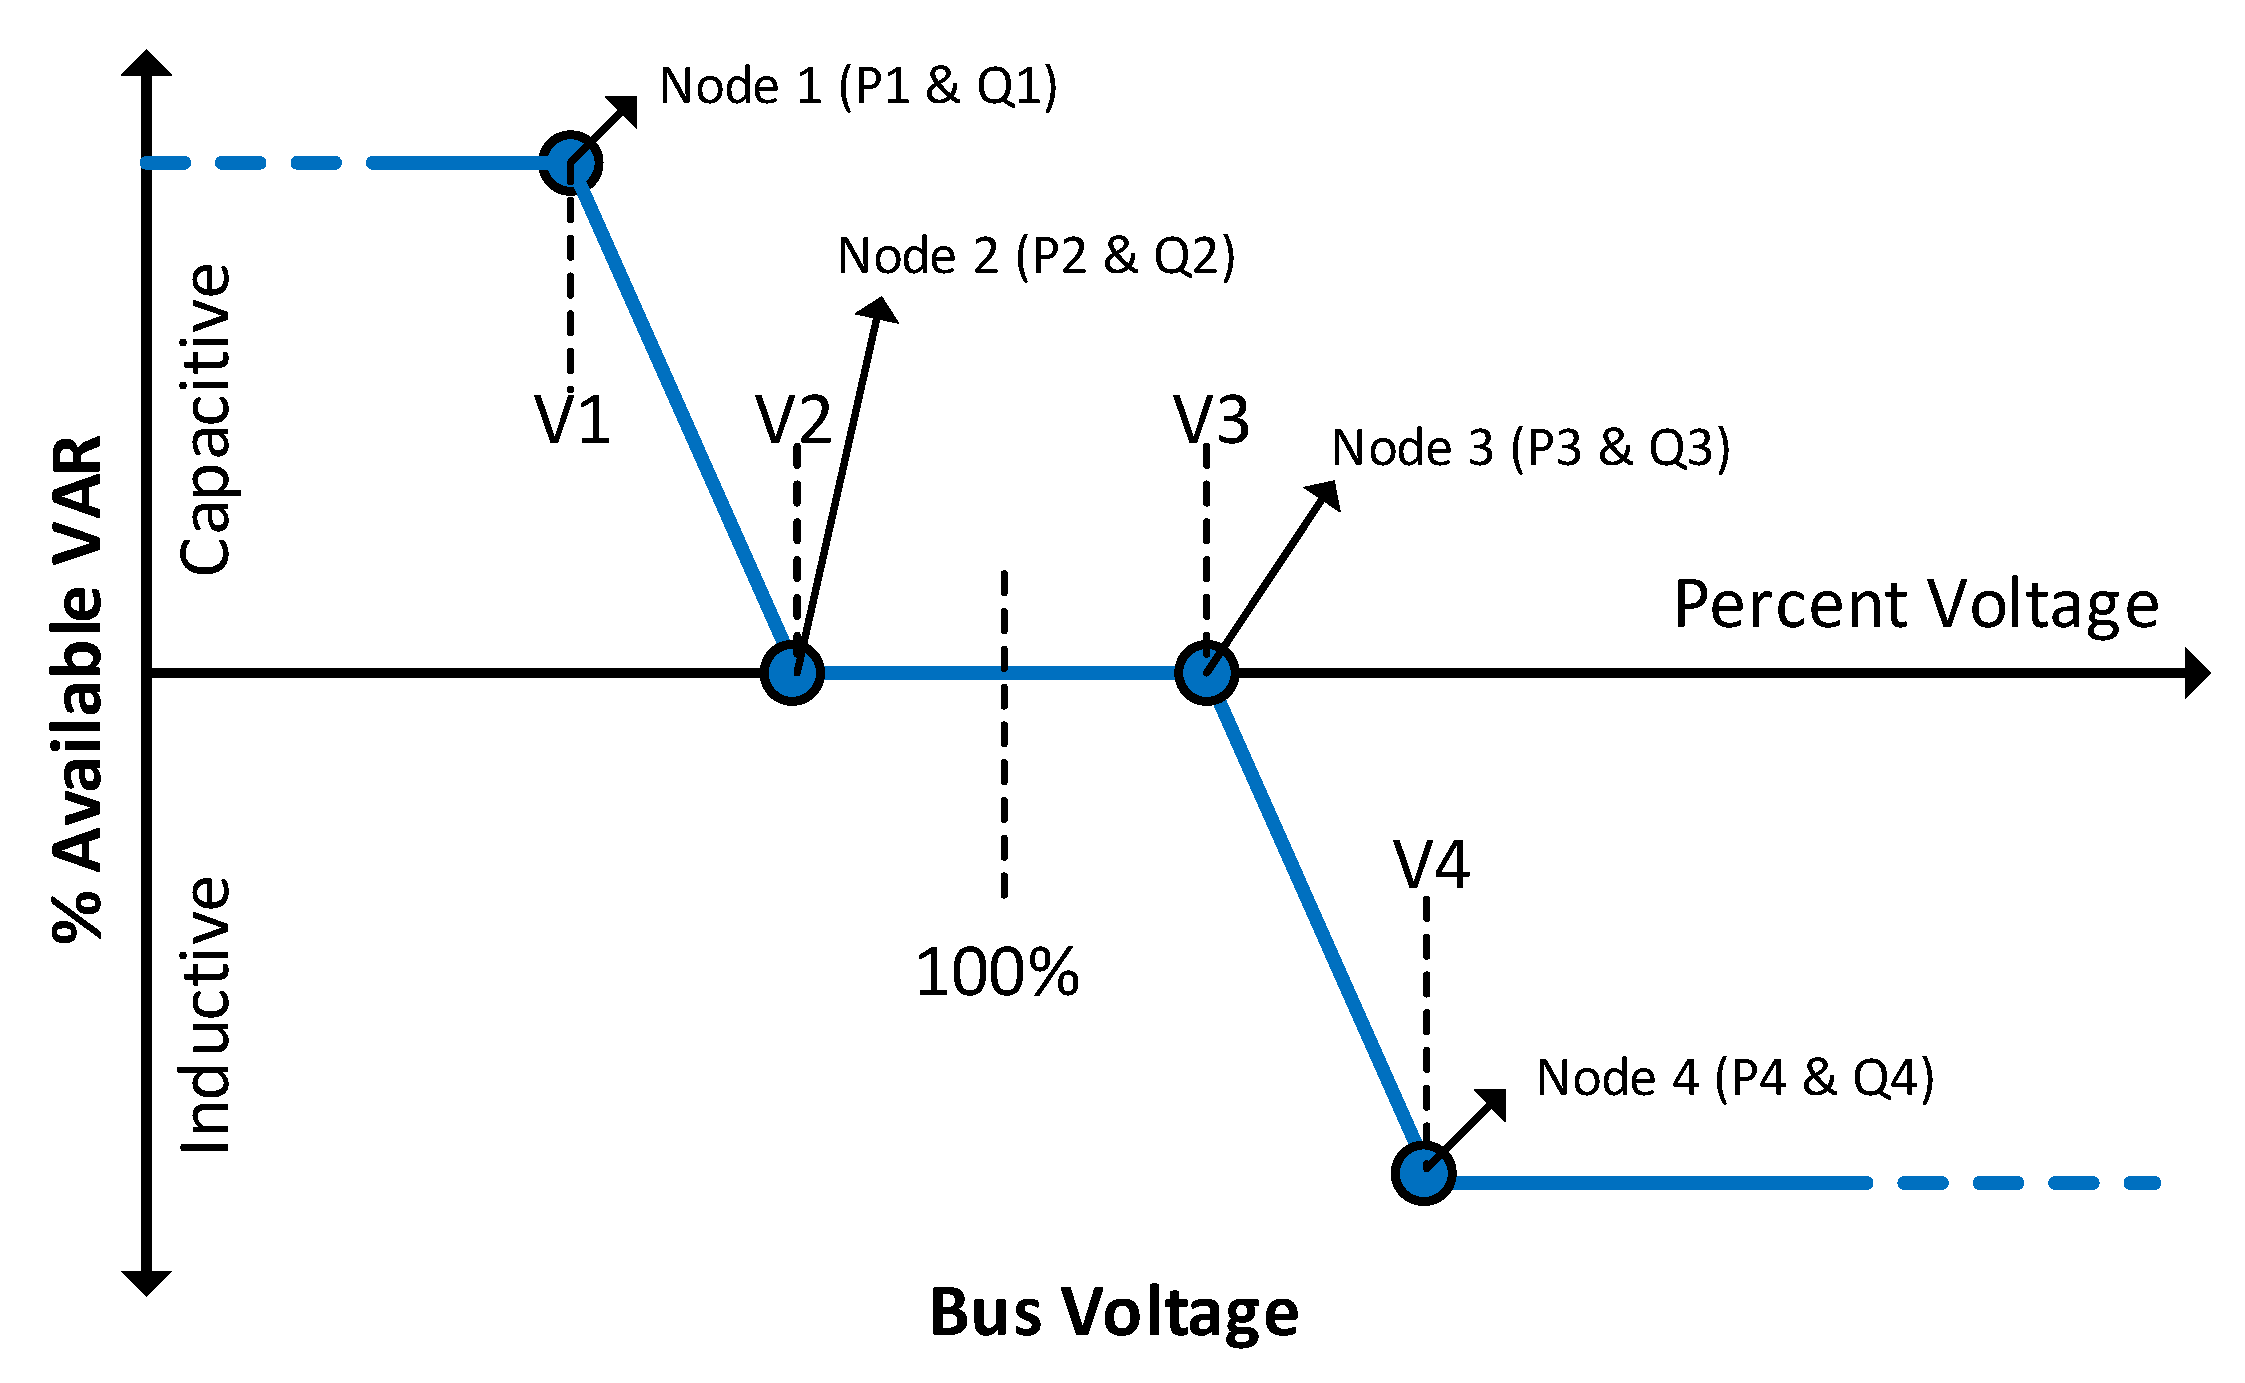
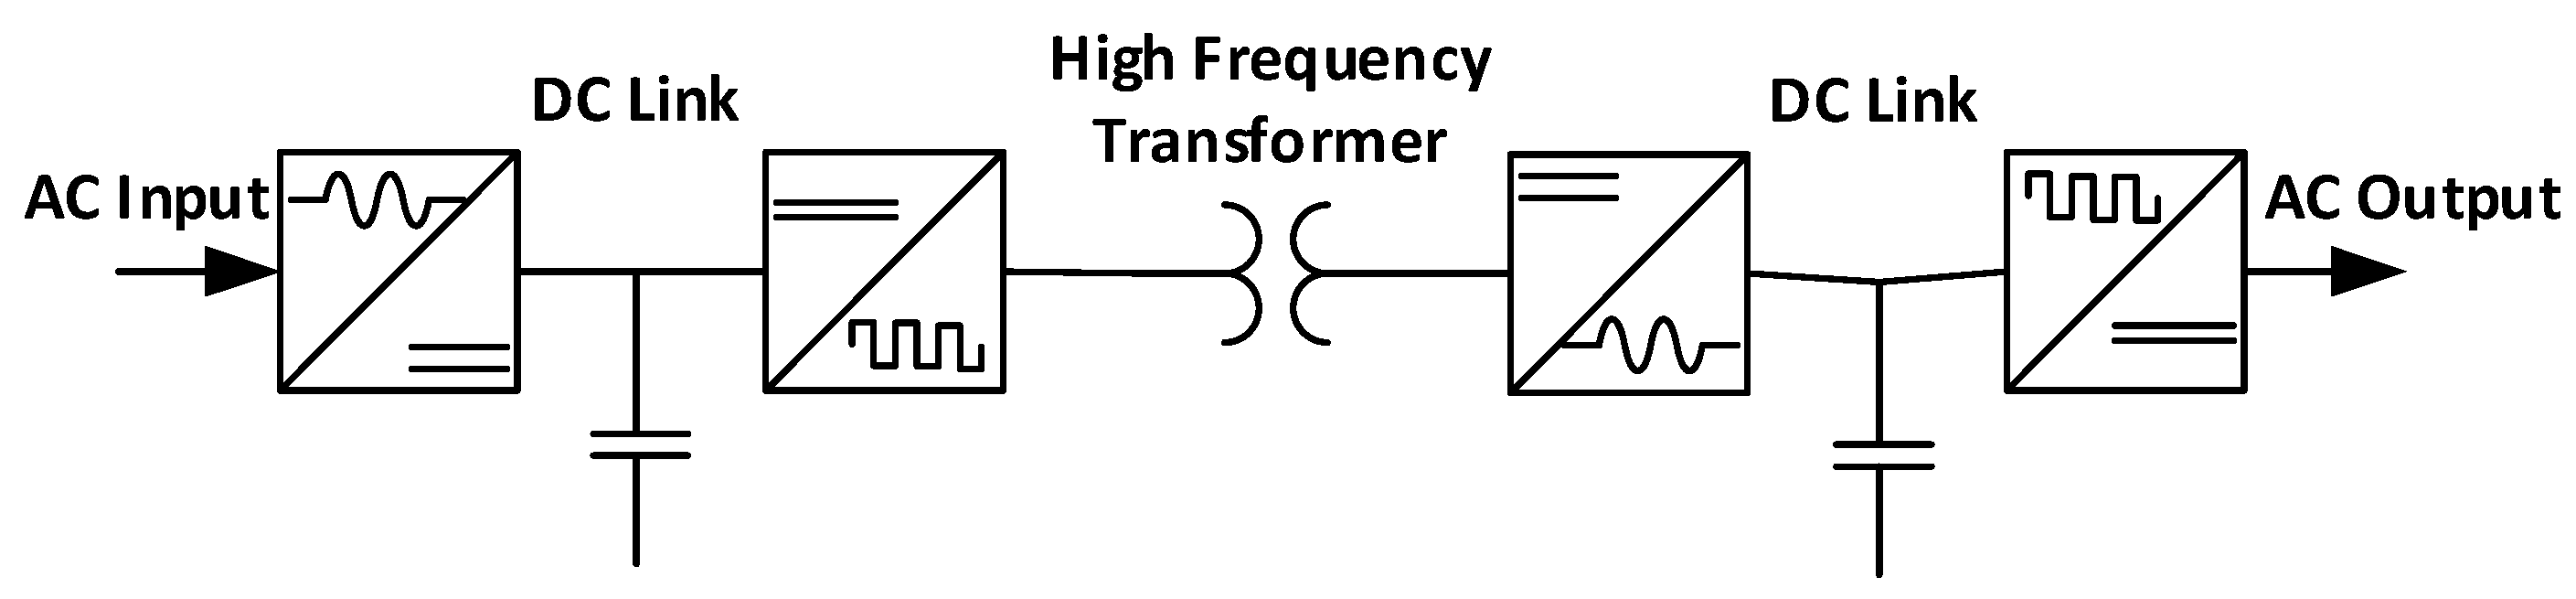
3. Power–Electronic Interface

The power–electronic interface, considering its topology, is capable of voltage regulation and electrical isolation. As a result of these capabilities, these type of devices enable end-users to participate in Volt-VAR programs and reactive power injection/absorption based on the network status. A schematic of the power–electronic interface depicted in Figure 3.

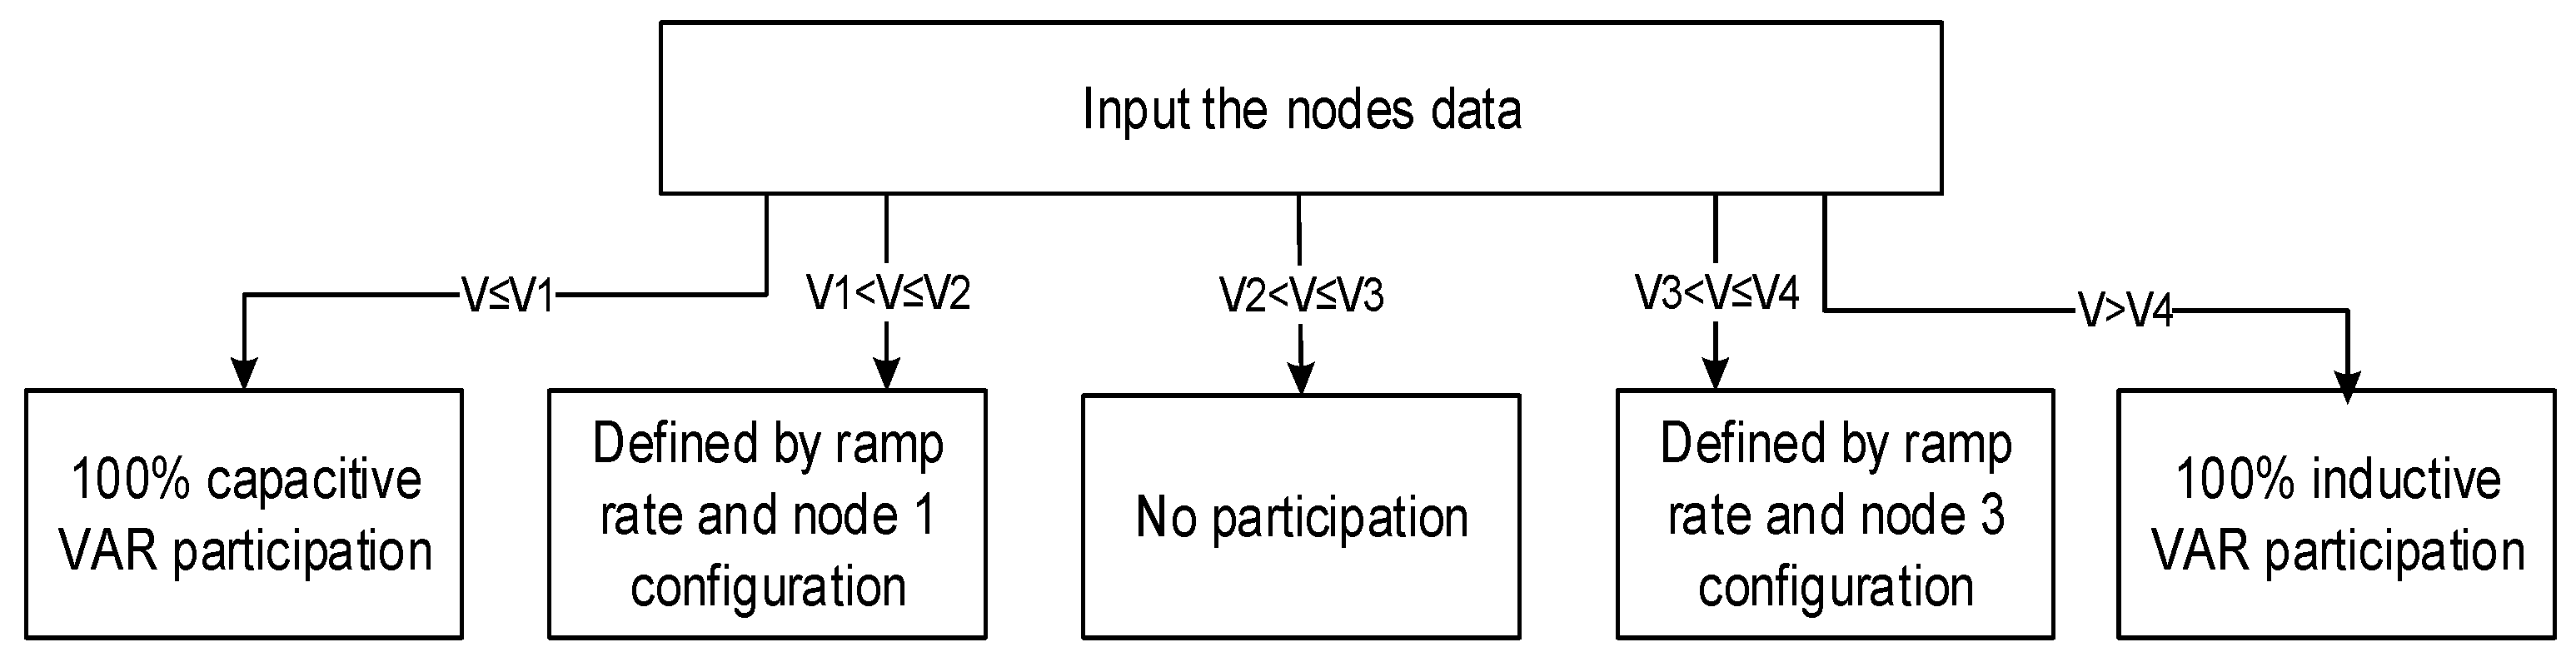
4. Proposed Algorithm

The proposed algorithm consists of three main stages, as shown in Figure 4. As shown, in the first stage, the load data and distribution network data are acquired, and type-2 and type-3 buses are determined at this stage. The FAHP method is used to rank the type-2 end-users. The selection of the most effective buses depends on different criteria. In previous studies, sensitivity analysis was used for this purpose [1,6,9]. However, for example, a bus with the highest sensitivity and limited available reactive power is not the most effective bus. The FAHP method is exploited to overcome this problem.
The final weights of the criteria are calculated by the fuzzy method in the FAHP method. Decision makers are often confronted with fuzzy sets to express the relative importance of one criterion in relation to other criteria [20].
AHP is an effective tool for dealing with complex decisions and can help the decision maker set priorities and make the best decision. AHP helps to capture the subjective and objective aspects of a decision by reducing complex decisions to a set of paired comparisons, and then combining the results.
In multi-criteria decision making, where the criteria are not quantifiable and judgmental choices should be made, FAHP is being used increasingly because the fuzzy set theory can cope with uncertainty, imprecision and vagueness. In addition, the concept of fuzzy sets provides a better model to quantify or evaluate weights when human perception is involved [21].
The use of triangular fuzzy numbers in pair-wise comparison is defined by three real numbers expressed as a triple (l, m, u), where lmu is used to describe a fuzzy event. The membership function of triangular fuzzy numbers is defined by Equation (3):
μ N ˜ ( x ) = { x l m l l < x < m u x u m m < x < u 0 o t h e r w i s e
In order to calculate the sensitivity matrices, the method presented in [22] is used.
Small load changes do not result in significant changes in the sensitivity matrix data. The sensitivity of g to reactive power is calculated by Equation (4) [7]:
g = | 2 η Λ V Q |
where η and Λ V Q are ( V i V r e f ) and the voltage sensitivity matrix, respectively. g is the sensitivity of g with respect to the reactive power injection. The data of the sensitivity matrix are one of the criteria that are used in FAHP. Power loss and voltage deviation are other criteria of available reactive power. These criteria are calculated by the base-load snapshot and used to select the optimal Q-C bus. Using the FAHP method, distribution network nodes are ranked according to their priority.
In the second stage, a PSO algorithm is used to find the optimum injected reactive power of the second type of DER. PSO is a population-based stochastic optimization originating from artificial life and evolutionary computation. PSO is motivated by the social behavior of organisms, such as bird flocks, fish schooling, and human social relations. Its properties of low constraint on the continuity of objective function and its ability to adapt to the dynamic environment make PSO one of the most important swarm-intelligence algorithms.
The objective function of the optimization problem is defined by Equation (5):
O b j e c t i v e   f u n c t i o n = ( w 1 i = 1 N b [ V i V r e f ] 2 + w 2 j = 1 M [ Δ Q j ] ) S u b j e c t   t o : V min V i V max Δ Q j   < Δ Q j a c c e s s i b l e
where V i and V r e f are the voltage of bus i and reference voltage (1 p.u.), respectively. Δ Q j is the injected reactive power of each Q-C bus, which is multiplied by a penalty factor.
To know the accessible reactive power of each bus, a detailed investigation of a load connected to each bus and their power–electronic interface capacity is needed. This investigation is beyond the scope of this paper. To evaluate the effectiveness of the proposed method, the accessible reactive power of each bus considered as below:
Q i a c c e s s i b l e = K × P i 2 + Q i 2
where K is the portion of the power–electronic interface capacity, P i is the active load, and Q i is reactive at the Q-C buses [23,24,25,26,27,28,29,30,31,32,33,34,35,36].

5. Results and Discussion

In this section, the simulation results are presented, and the performance of the proposed algorithm is assessed. The single-line diagram of a 12.66 kV, 33-bus IEEE standard test system is depicted in Figure 5. The system data are obtained from [37]. The base load of the system is 100 MVA. The total reactive load is 2300 kVAR and the total active load is 3720 kW.
To evaluate the effectiveness of the proposed method, four scenarios are generated:
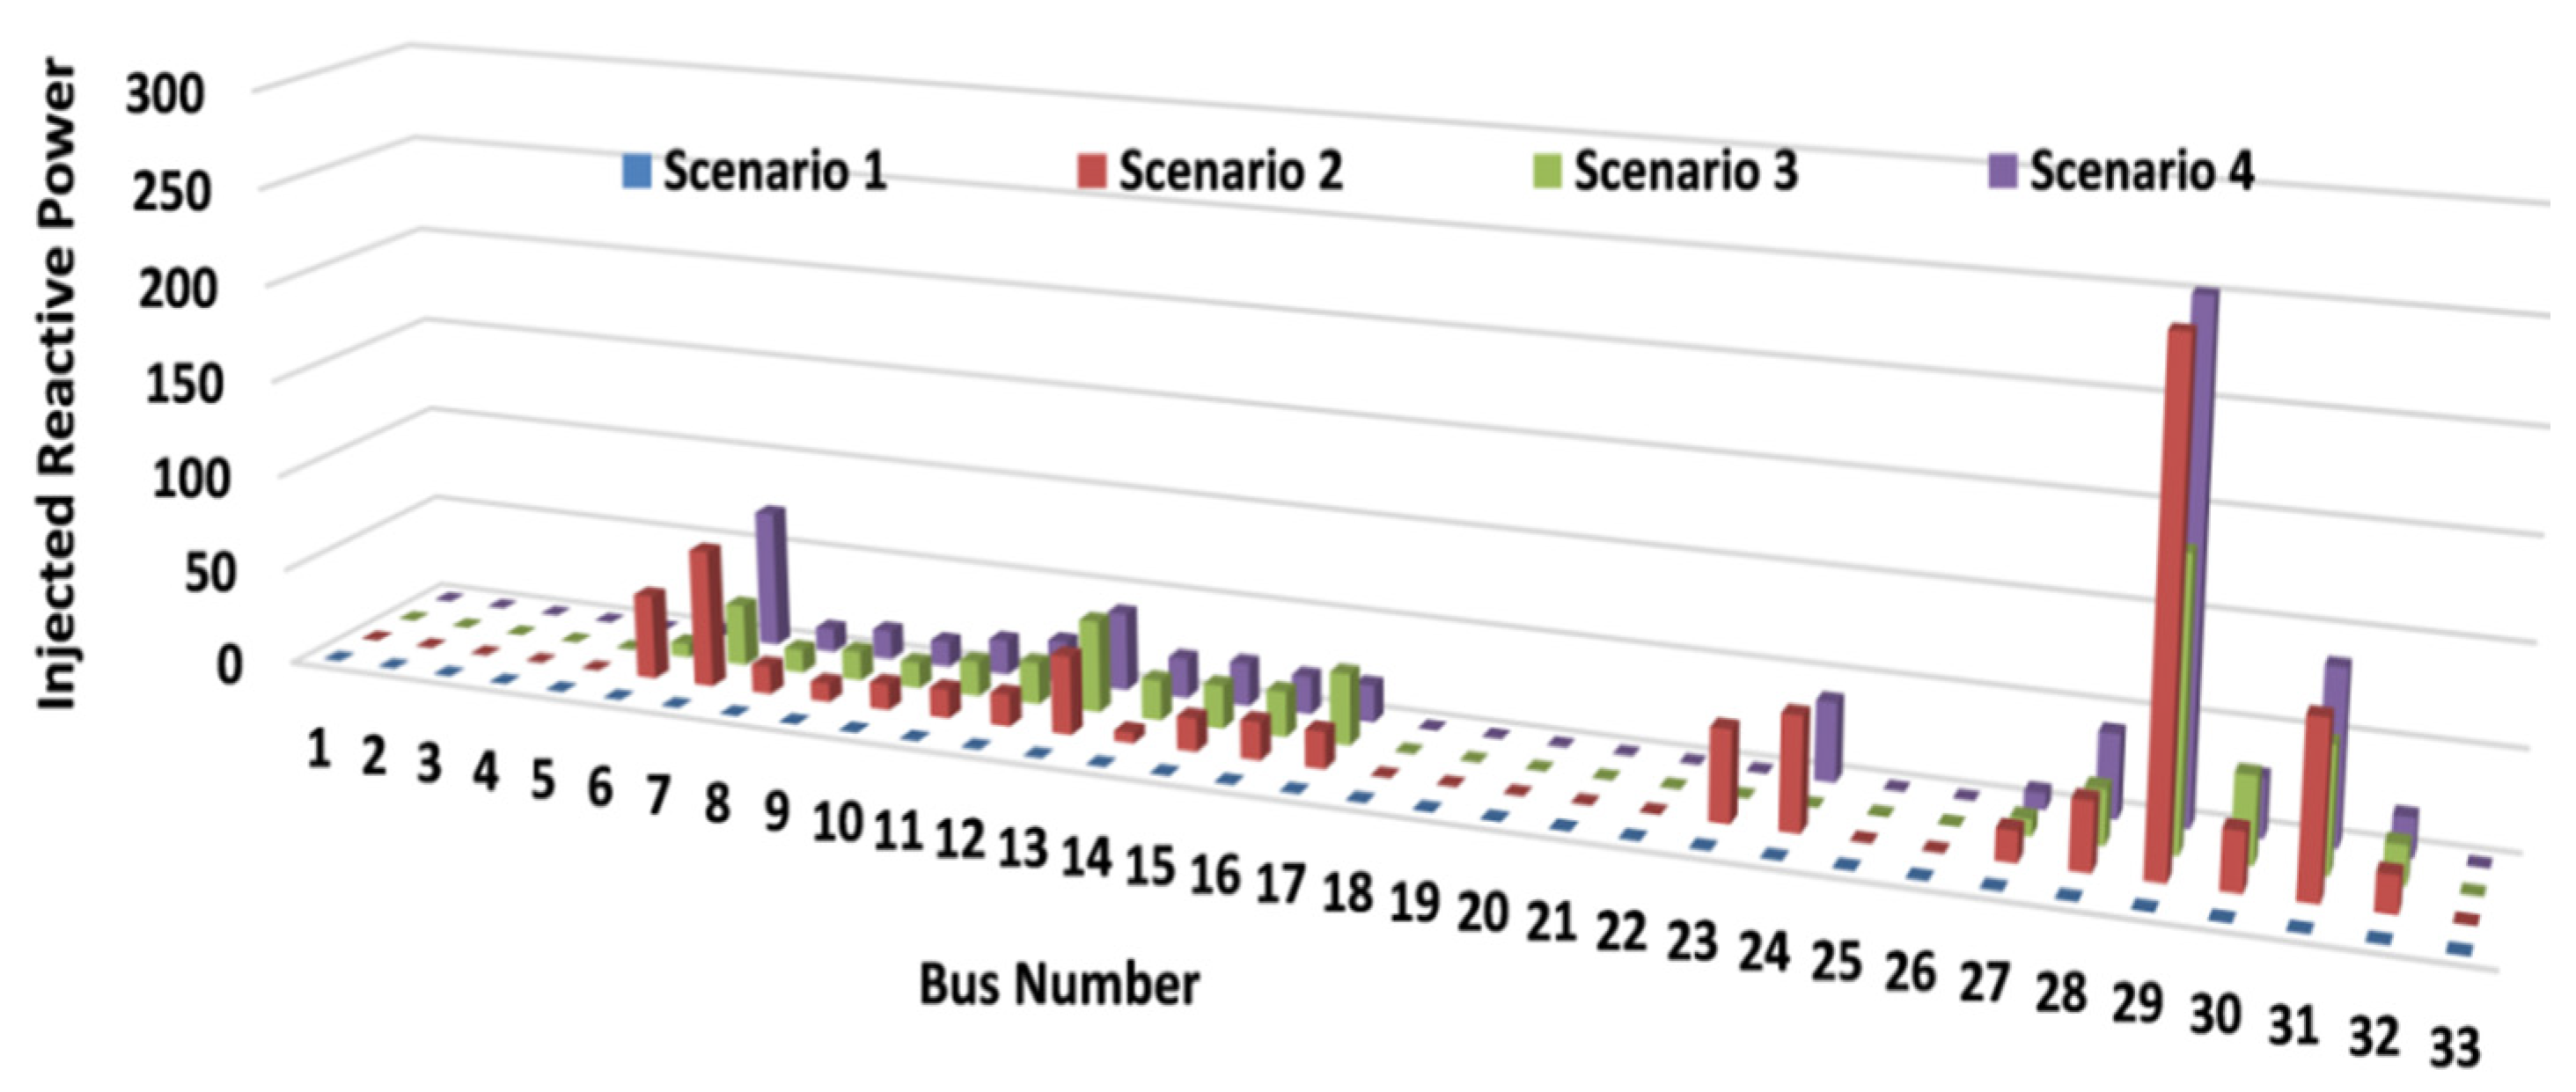
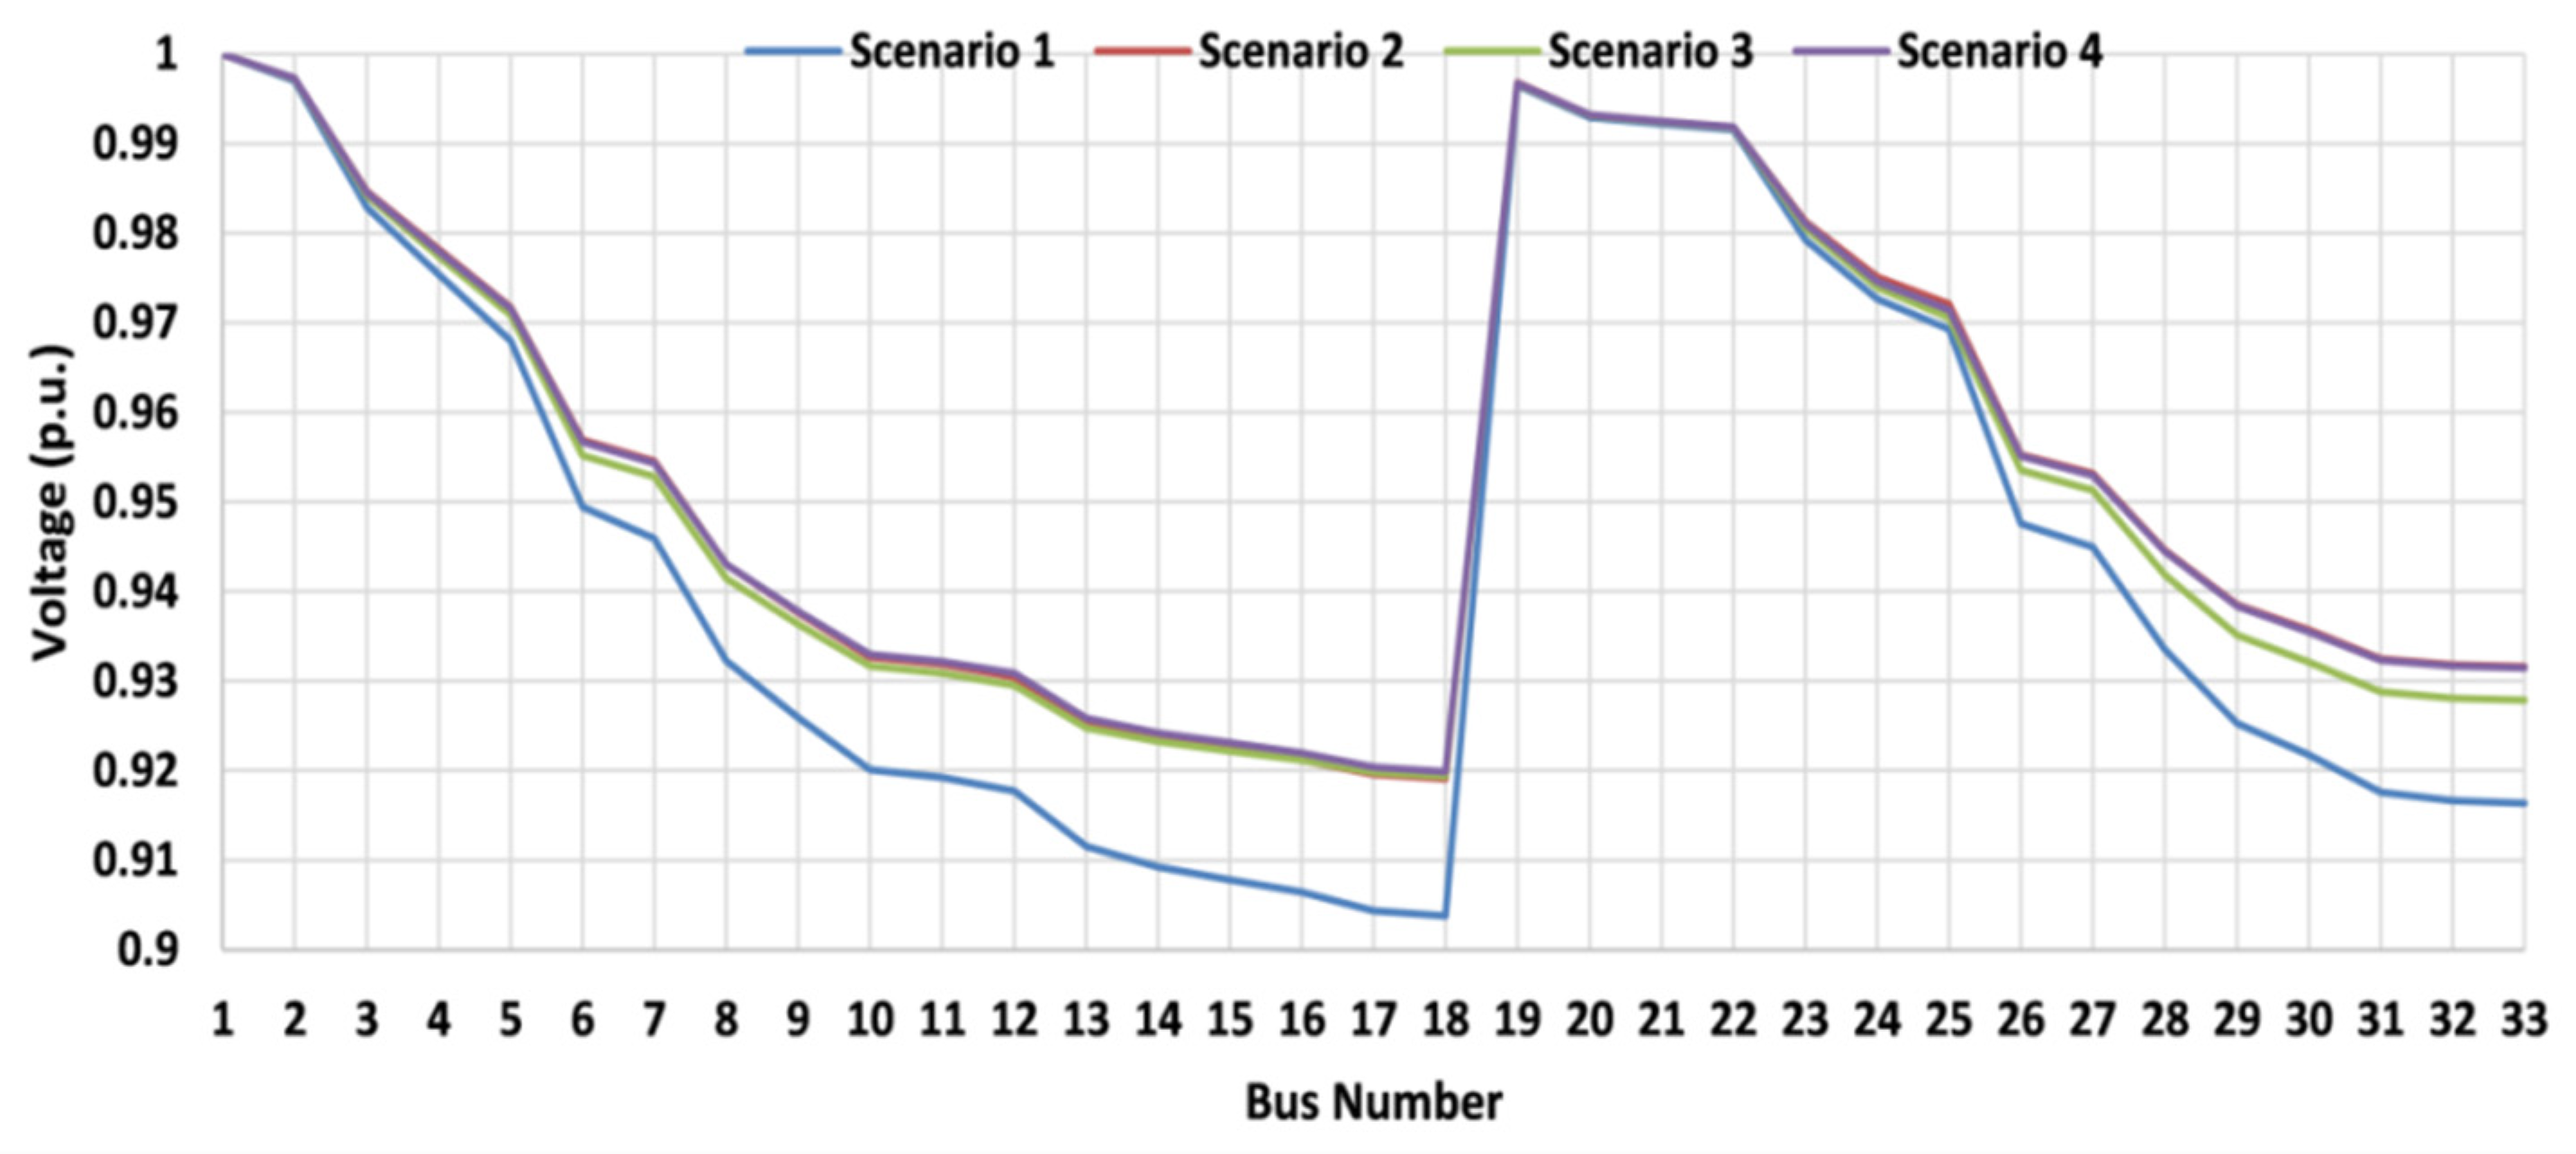
  • Scenario 1: No DER participates in the Volt-VAR program
  • Scenario 2: Twenty effective Q-C buses participate in the Volt-VAR program.
  • Scenario 3: Twenty buses are selected as type-3 DERs and their effects on the distribution network are investigated.
  • Scenario 4: Both type-2 and type-3 DERs are considered in Volt-VAR program, and their effects on the distribution network are surveyed.
As illustrated previously, the FAHP method is used to rank the type-2 end-users. The pair-wise comparison and normalized final weight of the criteria are shown in Table 1. All the arithmetic calculation is performed based on the fuzzy theory rules [20]. The final weight of each criterion is obtained by means of geometry of the pairwise comparison data. The computation of final weight and the ranking of each distribution network bus are shown in Table 2.
The distribution network bus ranks are depicted in Figure 6.
The ten and twenty most effective buses used in Scenarios 4 and 2, respectively, are shown in Table 3.
The selected buses used in Scenarios 3 and 4 are given in Table 4.
The numbers of the candidate buses can be pre-defined by a network operator, or they can be determined such that the best enhancement occurs.
The convergence curve of Scenario 2 is plotted in Figure 7 for instance. The run time is about 1.23 s for this scenario. The implementation time regarding the network size shows the superiority of the proposed algorithm compared to similar papers.
Using an illustrated algorithm, the injected reactive power of the pre-mentioned four scenarios is obtained. The reactive power injection of type two and type three DERs in all scenarios are depicted in Figure 8.
The vertical axis shows the injected reactive power in each bus in pre-defined scenarios, and bus numbers are shown by horizontal axis.
A comparison between the buses’ voltages in the aforementioned scenarios is depicted in Figure 9.
As depicted in Figure 9, the participation of end-users with power–electronic interface improves the distribution network voltage profile and enhances the network stability.
As expected, the cooperation of the DERs enhances the voltage profile. In scenario 2, the level of type-2 DER participation is determined by the PSO optimization method and the best voltage profile results. However, in this scenario, a complicated communication infrastructure between DERs and central control is necessary. Scenarios 3 and 4 are an intermediate state, some of the DERs (type-3) react to the distribution network condition, and some other DERs (type-2) obtain their VAR injection state from the residential control. The voltage profile improvement in scenarios regarding Scenario 1 resulted from the DER participation in the Volt-VAR program and benefiting from their potential capability without imposing any additional cost. The comparison of the proposed method with other methods presented in the literature ([1,6,7,8,9]), and the results are summarized in Table 5.

6. Conclusions

This study categorized DERs into three types and investigated their cooperation in the Volt-VAR program. As expected, the DER interaction in the Volt-VAR program had many benefits for the distribution network, and the smarter this interaction became, the more benefits arose from the Volt-VAR programs. Considering the current condition of the distribution network, direct communication with all DERs is impractical, and proposed DER types were introduced to overcome this issue. In this paper, three possible distribution system states were considered. In the first state, the end-user devices used conventional power supplies; hence, they did not interact with their surrounding distribution system condition. In the second state, which can be called the complete smart state, the end-user devices were equipped with smart-power electronic power supplies, which could communicate with the residential system operator to change their reactive power injection/absorption based on the system operator command. In the third state, which can be called the intermediate state, the end-users employed devices with a power–electronic interface without any on-line communication with the residential control system, and their interactions with reactive power injection/absorption were based on their sense of their surrounding condition. Regarding the current distribution network situation, the third state is more practical for implementation. As the results show, the complete smart state is an ideal state in which the system operator can completely control the DER. However, to achieve such a condition, a very complex and expensive communication infrastructure is needed. In the intermediate state, the end-users cooperate with the distribution system management based on their feedback from their surrounding condition, and as discussed in this paper, this situation is fulfilled by a mode named the droop-control mode. Considering the current state of the distribution system and the current capability of the communication systems, the interaction of the droop-and central-controlled DERs has many advantages for the distribution system. The droop control of end-users for Volt-VAR program participation is proposed in this paper as an intermediate solution for the current configuration of the distribution network. For future work related to this study, multi-objective methods can be used to solve the problem. This paper also introduced uncertainty issues, such as energy source uncertainty, load uncertainty and measuring-instrument uncertainty into the objective function of the problem.

Author Contributions

Conceptualization, R.E., M.S.G., M.A.K. and I.C.; data curation, R.E., M.S.G., M.A.K. and I.C.; formal analysis, R.E., M.S.G. and M.A.K.; funding acquisition, R.E., M.S.G., M.A.K. and I.C.; investigation, R.E. and K.E.; methodology, R.E., M.S.G., M.A.K. and K.E.; project administration, R.E., M.S.G. and M.A.K.; resources, R.E., M.A.K. and I.C.; software, R.E., M.S.G., M.A.K. and K.E.; supervision, R.E.; validation, I.C.; writing—original draft, R.E.; writing—review and editing, M.A.K., I.C. and K.E. All authors have read and agreed to the published version of the manuscript.

Funding

This research received no external funding.

Institutional Review Board Statement

Not applicable.

Informed Consent Statement

Not applicable.

Data Availability Statement

Not applicable.

Conflicts of Interest

The authors declare no conflict of interest.

Abbreviations

DERsDistributed Energy Resources
MCDMMulti-Criteria Decision Making
PEPower Electronic
DGsDistributed Generations
MPCModel Predictive Control
GDCGeneralized Droop Control
PHEVPlug-in Hybrid Electric Vehicle
EVElectric Vehicle
EPRIElectric Power Research Institute
AHPAnalytic Hierarchy Process
FAHPFuzzy Analytic Hierarchy Process
PSOParticle-Swarm Optimization
REDsResponsive End-user Devices
ICSIncident Command System

References

  1. Rogers, K.M.; Klump, R.; Khurana, H.; Overbye, T.J. Smart-Grid –enabled load and distributed generation as a reactive resource. In Proceedings of the 2010 Innovative Smart Grid Technologies (ISGT), Gaithersburg, MD, USA, 19–21 January 2010; pp. 1–8. [Google Scholar] [CrossRef] [Green Version]
  2. EPRI Report. Common Functions for Smart Inverters, Version 4; Common Functions for DER Group Management: Palo Alto, CA, USA, 2016. [Google Scholar]
  3. EPRI Report. Common Functions for DER Group Management, 3rd ed.; Common Functions for DER Group Management: Palo Alto, CA, USA, 2016. [Google Scholar]
  4. Dallmer-Zerbe, K.; Fischer, D.; Biener, W.; Wille-Haussmann, B.; Wittwer, C. Droop controlled operation of heat pumps on clustered distribution grids with high PV penetration. In Proceedings of the 2016 IEEE International Energy Conference (ENERGYCON), Leuven, Belgium, 4–8 April 2016. [Google Scholar]
  5. Seo, J.; Lee, H.; Jung, W.; Won, D. Voltage control method using modified voltage droop control in LV distribution system. In Proceedings of the 2009 IEEE Transmission and Distribution Conference and Exposition: Asia and Pacific, Seoul, Korea, 26–30 October 2009. [Google Scholar]
  6. Bayat, M.; Sheshyekani, K.; Rezazadeh, A. A unified framework for participation of responsive end-user devices in voltage and frequency control of the smart grid. IEEE Trans. Power Syst. 2015, 30, 1369–1379. [Google Scholar] [CrossRef]
  7. Abessi, A.; Vahidinasab, V.; Ghazizadeh, M.S. Centralized support distributed voltage control by using end-users as reactive power support. IEEE Trans. Smart Grid 2016, 7, 178–188. [Google Scholar] [CrossRef]
  8. Lugo, A.A.; Klump, R.; Overbye, T.J. A control framework for the smart grid for voltage support using agent-based technologies. IEEE Trans. Smart Grid 2011, 2, 173–180. [Google Scholar] [CrossRef]
  9. Rogers, K.M.; Klump, R.; Khurana, H.; Aquino-Lugo, A.A.; Overbye, T.J. An authenticated control framework for distributed voltage support on the smart grid. IEEE Trans. Smart Grid 2010, 1, 40–47. [Google Scholar] [CrossRef]
  10. Li, H.; Li, F.; Xu, Y.; Rizy, D.T.; Adhikari, S. Autonomous and adaptive voltage control using multiple distributed energy resources. IEEE Trans. Power Syst. 2013, 28, 718–730. [Google Scholar] [CrossRef]
  11. Baran, M.E.; El-Markabi, I.M. An adaptive local learning-based methodology for voltage regulation in distribution networks with dispersed generation. IEEE Trans. Power Syst. 2006, 21, 1131–1140. [Google Scholar] [CrossRef]
  12. Vovos, P.N.; Kiprakis, A.E.; Wallace, A.R.; Harrison, G.P. Centralized and distributed voltage control: Impact on distributed generation penetration. IEEE Trans. Power Syst. 2007, 22, 476–483. [Google Scholar] [CrossRef] [Green Version]
  13. Jiang, L.; Smedley, K.M. Volt/VAR Control with DERs, LTCs, and Switched Capacitors: Case Study with a Commercial Distribution System. In Proceedings of the 2019 IEEE Innovative Smart Grid Technologies-Asia (ISGT Asia), Chengdu, China, 21–24 May 2019; Volume 2019, pp. 1330–1334. [Google Scholar] [CrossRef]
  14. Herman, L.; Blazic, B.; Papic, I. Voltage profile support in LV distribution networks with distributed generation. In Proceedings of the 44th International Universities Power Engineering Conference (UPEC), Glasgow, UK, 1–4 September 2009. [Google Scholar]
  15. Kroposki, B.; Pink, C.; DeBlasio, R.; Thomas, H.; Simões, M.; Sen, P.K. Benefits of Power Electronic Interfaces for Distributed Energy Systems. IEEE Trans. Energy Convers. 2010, 25, 901–908. [Google Scholar] [CrossRef] [Green Version]
  16. El-Ela, A.A.A.; El-Sehiemy, R.A.; Kinawy, A.; Mouwafi, M.T. Optimal Capacitor Placement in Distribution Systems for Power Loss Reduction and Voltage Profile Improvement. IET Gener. Transm. Distrib. 2016, 10, 1209–1221. [Google Scholar] [CrossRef]
  17. Balamurugan, K.; Srinivasan, D. Review of power flow studies on distribution network with distributed generation. In Proceedings of the IEEE Ninth International Conference on Power Electronics and Drive Systems (PEDS), Singapore, 5–8 December 2011. [Google Scholar] [CrossRef]
  18. Eminoglu, U.; Hocaoglu, H. Distribution systems forward/backward sweep-based power flow algorithms: A review and comparison study. Electr. Power Compon. Syst. 2009, 37, 91–110. [Google Scholar] [CrossRef]
  19. Teng, J.-H. A direct approach for distribution system load flow solutions. IEEE Trans. Power Deliv. 2003, 18, 882–887. [Google Scholar] [CrossRef]
  20. Dehghanian, P.; Fotuhi-Firuzabad, M.; Bagheri-Shouraki, S.; Kazemi, A.A.R. Critical component identification in reliability centered asset management of power distribution systems via fuzzy AHP. IEEE Syst. J. 2012, 6, 593–602. [Google Scholar] [CrossRef]
  21. Saaty, R.W. The analytic hierarchy process—What it is and how it is used. Math. Model. 1987, 9, 161–176. [Google Scholar] [CrossRef] [Green Version]
  22. Khatod, D.K.; Pant, V.; Sharma, J. A novel approach for sensitivity calculations in the radial distribution system. IEEE Trans. Power Deliv. 2006, 21, 2048–2057. [Google Scholar] [CrossRef]
  23. Nakhi, P.R.; Kamarposhti, M.A. Multi objective design of type II fuzzy based power system stabilizer for power system with wind farm turbine considering uncertainty. Int. Trans. Electr. Energy Syst. 2020, 30, 1–20. [Google Scholar] [CrossRef]
  24. Zhao, S.; Li, F.; Li, H.; Lu, R.; Ren, S.; Bao, H.; Han, S. Smart and Practical Privacy-Preserving Data Aggregation for Fog-Based Smart Grids. IEEE Trans. Inf. Forensics Secur. 2021, 16, 521–536. [Google Scholar] [CrossRef]
  25. Sui, T.; Marelli, D.; Sun, X.; Fu, M. Multi-sensor state estimation over lossy channels using coded measurements. Automatica 2020, 111, 108561. [Google Scholar] [CrossRef]
  26. Zhang, M.; Chen, Y.; Susilo, W. PPO-CPQ: A Privacy-Preserving Optimization of Clinical Pathway Query for E-Healthcare Systems. IEEE Internet Things J. 2020, 7, 10660–10672. [Google Scholar] [CrossRef]
  27. Xiao, G.; Chen, B.; Li, S.; Zhuo, X. Fatigue life analysis of aero-engine blades for abrasive belt grinding considering residual stress. Eng. Fail. Anal. 2022, 131, 105846. [Google Scholar] [CrossRef]
  28. Zhang, L.; Wang, X.; Zhang, Z.; Cui, Y.; Ling, L.; Cai, G. An Adaptative Control Strategy for Interfacing Converter of Hybrid Microgrid Based on Improved Virtual Synchronous Generator. IET Renew. Power Gener. 2022, 16, 261–273. [Google Scholar] [CrossRef]
  29. Wu, Y.; Zhu, W. The Role of CSR Engagement in Customer-Company Identification and Behavioral Intention during the COVID-19 Pandemic. Front. Psychol. 2021, 12, 721410. [Google Scholar] [CrossRef] [PubMed]
  30. Yu, H.; Tao, J.; Qin, C.; Liu, M.; Xiao, D.; Sun, H.; Liu, C. A novel constrained dense convolutional autoencoder and DNN-based semi-supervised method for shield machine tunnel geological formation recognition. Mech. Syst. Signal Process. 2022, 165, 108353. [Google Scholar] [CrossRef]
  31. Jin, X.; Chen, Y.; Wang, L.; Han, H.; Chen, P. Failure prediction, monitoring and diagnosis methods for slewing bearings of large-scale wind turbine: A review. Meas. J. Int. Meas. Confed. 2021, 172, 108855. [Google Scholar] [CrossRef]
  32. Ni, T.; Liu, D.; Xu, Q.; Huang, Z.; Liang, H.; Yan, A. Architecture of Cobweb-Based Redundant TSV for Clustered Faults. IEEE Trans. Large Scale Integr. (VLSI) Syst. 2020, 28, 1736–1739. [Google Scholar] [CrossRef]
  33. Zhu, W.; Deng, M.; Chen, D.; Zhang, Z.; Chai, W.; Chen, D.; Hao, Y. Dual-Phase CsPbCl3–Cs4PbCl6 Perovskite Films for Self-Powered, Visible-Blind UV Photodetectors with Fast Response. ACS Appl. Mater. Interfaces 2020, 12, 32961–32969. [Google Scholar] [CrossRef] [PubMed]
  34. Peng, Y.; Xu, Z.; Wang, M.; Li, Z.; Peng, J.; Luo, J.; Yang, Z. Investigation of frequency-up conversion effect on the performance improvement of stack-based piezoelectric generators. Renew. Energy 2021, 172, 551–563. [Google Scholar] [CrossRef]
  35. Yang, Y.; Peng, J.C.; Ye, C.; Ye, Z.; Ding, Y. A Criterion and Stochastic Unit Commitment towards Frequency Resilience of Power Systems. IEEE Trans. Power Syst. 2021, 1, 3095180. [Google Scholar] [CrossRef]
  36. Zhang, W.; Zhang, Z. Deck Electrical System Support Technology of Port Tanker. J. Coast. Res. 2020, 103, 392–396. [Google Scholar] [CrossRef]
  37. Baran, M.E.; Wu, F.F. Optimal capacitor placement on radial distribution systems. IEEE Trans. Power Deliv. 1989, 4, 725–734. [Google Scholar] [CrossRef]
Figure 1. Array Settings of type-3 DER’s Volt-VAR behavior.
Electronics 11 00765 g001
Figure 2. Desire VAR level determination algorithm.
Electronics 11 00765 g002
Figure 3. Power–electronic interface schematic.
Electronics 11 00765 g003
Figure 4. Schematic of the proposed algorithm.
Electronics 11 00765 g004
Figure 5. IEEE 33-bus standard distribution system.
Electronics 11 00765 g005
Figure 6. FAHP bus ranks.
Electronics 11 00765 g006
Figure 7. Convergence curve of the scenario 2.
Electronics 11 00765 g007
Figure 8. Reactive power injections of DERs.
Electronics 11 00765 g008
Figure 9. The comparison between voltages of four scenarios.
Electronics 11 00765 g009
Table 1. Pair-wise comparison and final normalized weights of criteria.
CriteriaCriterion 1Criterion 2Criterion 3Criterion 4Normalized Final Weight
Criterion 1(1, 1, 2)(1.6818, 2.7108, 3.7224)(2.4495, 3.5565, 4.6058)(4.1618, 5.1800, 6.1920)0.4809
Criterion 2(0.2686, 0.3689, 0.5946)(1, 1, 2)(4.1618, 5.1800, 6.1920)(4, 5, 6)0.3287
Criterion 3(0.2171, 0.2812, 0.4082)(0.1615, 0.1930, 0.2403)(1, 1, 2)(3.7606, 4.8206, 5.8560)0.1340
Criterion 4(0.1615, 0.1930, 0.2403)(0.1667, 0.2, 0.25)(0.1708, 0.2074, 0.2660)(1, 1, 2)0.05619
Note: Criterion 1: sensitivity matrix; Criterion 2: voltage deviation; Criterion 3: accessible reactive power; Criterion 4: Power loss.
Table 2. Final weight computation and ranks of the distribution network buses.
Bus No.Criterion 1Criterion 2Criterion 3Criterion 4RankBus No.Criterion 1Criterion 2Criterion 3Criterion 4Rank
20.00830.32870.02470.056232180.48090.32620.02090.05596
30.04560.32850.02090.056227190.01150.32870.02090.056231
40.06950.32840.03050.056124200.03240.32870.02090.056230
50.09340.32830.01420.056125210.03740.32870.02090.056229
60.17570.32790.01340.056123220.04220.32870.02090.056228
70.21550.32770.04740.05605230.05070.32850.02180.056126
80.29060.32730.04740.05602240.05850.32850.09850.056113
90.33180.32700.01340.056017250.06230.32850.09850.056110
100.36920.32680.01340.056016260.18070.32790.01380.056022
110.37230.32680.01150.056018270.18690.32780.01380.056021
120.37750.32680.01470.056015280.22020.32770.01340.056020
130.41700.32650.01470.056011290.24140.32760.02940.05608
140.43700.32640.03050.05603300.24800.32750.13400.05591
150.44890.32640.01290.056014310.26470.32740.03600.05597
160.45830.32630.01340.056012320.26890.32740.04930.05594
170.47760.32620.01340.05599330.27190.32740.01530.055919
Note: Criterion 1: sensitivity matrix; Criterion 2: voltage deviation; Criterion 3: accessible reactive power; Criterion 4: Power loss.
Table 3. Type-2 most effective buses.
Candidate Bus Number
No. of Candidates123456789101112131415161718192021222324252627282930313233
10 buses
20 buses
Table 4. Type-3 candidate buses.
Candidate Bus Number
No. of Candidates123456789101112131415161718192021222324252627282930313233
10 buses
20 buses
Table 5. The comparison of the proposed method with other methods.
Reference[1][6][7][8][9]Proposed
Approach
Item
Type II DER candidate selection criteriaMethodSensitivity analysisSensitivity analysisAccessible reactive power and sensitivity analysisAuthor selectionSensitivity analysisFAHP
Number of considered criteria112014
power flowAC power flowNRFBSAC power flowAC power flowFBS
Type III DER
Optimization MethodMathematical
Heuristic
Note: Considered: ✓; Not Considered: ✗; Abbreviations: FAHP—fuzzy analytical hierarchy process; FBS—Forward–Backward Sweep; NR—Newton–Raphson.
Publisher’s Note: MDPI stays neutral with regard to jurisdictional claims in published maps and institutional affiliations.

