Abstract
Speech emotion recognition is an important part of human–computer interaction, and the use of computers to analyze emotions and extract speech emotion features that can achieve high recognition rates is an important step. We applied the Fractional Fourier Transform (FrFT), and then constructed it to extract MFCC and combined it with a deep learning method for speech emotion recognition. Since the performance of FrFT depends on the transform order , we utilized an ambiguity function to determine the optimal order for each frame of speech. The MFCC was extracted under the optimal order of FrFT for each frame of speech. Finally, combining the deep learning network LSTM for speech emotion recognition. Our experiment was conducted on the RAVDESS, and detailed confusion matrices and accuracy were given for analysis. The MFCC extracted using FrFT was shown to have better performance than ordinal FT, and the proposed model achieved a weighting accuracy of 79.86%.
1. Introduction
With the rapid development in the field of speech recognition, researchers have realized that speech can convey more than just textual information, but also contains emotional information. In speech feature extraction, there are traditional methods such as prosodic features, voice quality features, and spectral features [1]. The Mel-Frequency Cepstral Coefficient (MFCC) [2] reflects the frequency characteristics of the human auditory system and has the advantages of being simple to calculate, highly discriminatory, and resistant to noise [3], and is, therefore, the most widely used speech feature at present. In 2017, Likitha [4] et al. proposed a speech emotion recognition method that uses MFCC and standard deviation values to detect emotions with 80% efficiency even in noisy environments. In 2018, Dhruvi [5] reviewed research on emotion recognition through speech signals, and this literature showed that MFCC provided a high level of recognition accuracy. In the same year, Jagtap [6] et al. proposed a system to detect seven emotions, which proposed using MFCC to reduce the frequency information contained in the speech signal to a small number of coefficients, and showed that the accuracy of the system depended on the database used for training.
Traditional speech spectrum feature extraction methods are mainly based on the Short Time Fourier Transform (STFT), which treats speech as short-term stability and only reflects the frequency components of the signal; however, speech signals are nonstationary signals whose frequency varies with time, so STFT is not suitable for processing speech signals. Therefore, our paper introduces a new speech analysis tool—the Fractional Fourier Transform (FrFT) [7].
As a new time-frequency transform tool, the Fractional Fourier Transform (FrFT) is a generalization of the Fourier Transform, capable of transforming a signal to any intermediate domain between the time and frequency domains. It was first proposed in a purely mathematical way by Namias in 1980. Then Almeida analyzed its relationship with the Wigner–Ville distribution (WVD) and interpreted it as an algorithm for the rotation of the time-frequency plane [8]. As FrFT can be considered as a decomposition of the linear frequency modulation (LFM) signal, it can significantly reduce processing complexity without reducing resolution, making FrFT well suited for processing speech signals. In 2008, Zhang et al. [9] proposed a fractional auditory cepstrum coefficient feature and applied it to language identification, reducing the equal error rates by 10.5% compared to conventional MFCC. In 2009, Yin [10] adaptively set the optimal transform order of FrFT according to the rate of in-frame pitch change and applied it to speech recognition, where it was shown that this method could obtain better discriminatory power for tones and vowels and had a higher recognition rate compared to traditional MFCC. Since FrFT has certain advantages in analyzing nonstationary signals, especially signals with transition frequency following time evolution, in 2011 Ma et al. [11] took advantage of this and combined it with the cepstrum analysis to separate the vocal tract and excitation of speech signals, using an appropriate Signal Interference Ratio as the search criterion to adaptively search for an appropriate transform order, and applied it to experiments on the fundamental frequency tracking of noisy Chinese vowels. Research on FrFT in the field of speech signal processing has focused on speech enhancement [12]; however, it has not yet been used in speech emotion recognition.
Compared to time-frequency transformation methods such as spectrograms and Wigner distributions, FrFT has a more flexible time-frequency representation due to the existence of the transformation order , which can make the algorithm more flexible, but finding the optimal transformation order has also been a challenge. The step search method is simple to use, but the calculation is too complex and computationally intensive, so it is inconvenient to use. Therefore, our paper used the ambiguity function (AF) to determine the optimal transformation order.
Speech signals are time-varying signals that require special processing to reflect time-varying properties. In contrast, Long Short-Term Memory (LSTM) networks can effectively remember relevant long-term contextual information from the input [13]. Therefore, LSTM networks are introduced to build models for speech emotion recognition.
The diagram of the speech emotion recognition system constructed in our paper is shown in Figure 1.
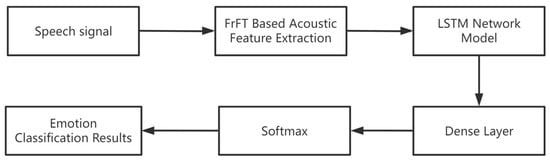
Figure 1.
Speech emotion recognition system.
This paper is organized as follows.
Section 2 introduces the extraction of speech features: Section 2.1 introduces the definition and some basic properties of FrFT. Section 2.2 introduces the method of determining the optimal transform order using AF. Section 2.3 introduces a new feature extraction method based on FrFT for MFCC extraction.
Section 3 introduces the construction of a classification model, giving the basic definition of LSTM and the basic structure of the classification model.
Section 4 gives the experimental parameters and results of applying the MFCC extracted by FrFT on the LSTM speech emotion recognition classification model.
Section 4 concludes this experiment.
2. Feature Extraction
2.1. Definition of the Fractional Fourier Transform
The FrFT representation of the signal is:
where denotes the FrFT operator, is the order of the FrFT and is a real number, and is the kernel of the FrFT; the expressions are as follows:
where is the transformation angle. The kernel function has the following properties:
Hence, the inverse of FrFT can be expressed as:
Equation (5) shows that can be viewed as a decomposition of the basis formed by an orthogonal LFM function in the u-domain. This also indicates that this LFM signal can be transformed into an impulse in a certain fractional domain. Thus, FrFT has a good localization effect on the LFM signal.
2.2. Determination of the Optimal Orders
The FrFT of the signal introduced in the previous section can be interpreted as the basis of the signal consisting of an orthogonal LFM function, so the optimal order is related to the chirp rate of the LFM signal.
Among the methods to find the optimal order, a simpler method is the step search method based on the Wigner–Ville Distribution (WVD) [14]. The basic principle is to use the FrFT of a signal with a continuously variable rotation angle to obtain the 2D parameter distribution of the signal, and then search for the maximum value of the signal in that 2D plane as a way to perform the detection and estimation of the LFM signal. However, this method is too computationally intensive because it is calculated on a 2D plane. Another method is to use the ambiguity function (AF) [15], which can search for the 2D plane simplified to a search in the 1D plane; this greatly reduces the amount of computation.
Since AF is simple to understand and has low computational complexity, our paper used AF to find the optimal order.
The AF of the signal is defined as:
The general expression for the LFM signal is:
where A is the amplitude, is the initial frequency, and is the chirp rate.
Bringing the expression for the LFM signal in Equation (7) into the definition of the AF in Equation (6), the AF of the LFM signal can be obtained:
From Equation (8), we can see that in the ideal condition, the amplitude of the AF of an LFM signal is linearly an impulse function. It passes through the origin and its slope is equal to the chirp rate. From this, we can detect the optimal order we want to obtain by simply calculating all linear integrals through the origin:
By searching the maximum value of the integration value, the chirp rate can be derived.
Having found the chirp rate , the specific relationship between the order and the chirp rate is further explained below.
The important relationship between FrFT and WVD is given: the projection of the linear integral of the WVD of a signal over the fractional domain is the square of the FrFT magnitude of that signal over this fractional domain. The WVD of the LFM signal is a straight line which has a maximum magnitude only in the projection at a point in the fractional domain perpendicular to it [16]. When the axis is rotated by an angle so that the LFM signal () forms an impulse in the fractional Fourier domain, then , is the optimal rotation angle found [17], as shown in Figure 2.
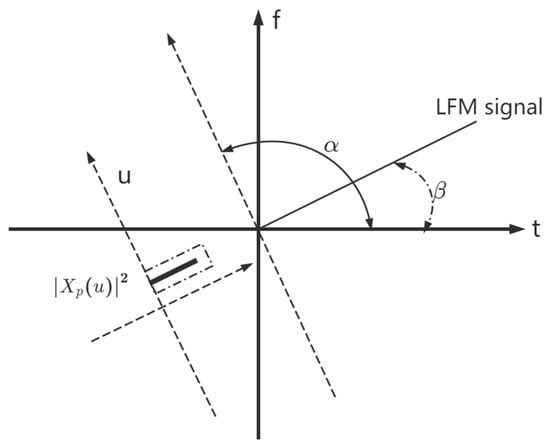
Figure 2.
LFM signal form impulses in the fractional Fourier domain.
Thus, the optimal order to find is:
The FrFT amplitude spectrum of a certain frame of the speech signal with several fixed orders and the found optimal order is given below.
As can be seen from Figure 3, the energy of the speech signal is relatively discrete in the time domain, and after FrFT processing, there is a certain degree of energy aggregation. This shows that the closer it is to the optimal order (the optimal order = 1.0323 for this frame of speech), the more obvious the energy aggregation effect. The best energy aggregation of the signal after FrFT processing is achieved when the optimal orderis reached. The experimental results are consistent with the fact that the LFM signal can be transformed into an impulse in some fractional domain as mentioned above, and show that FrFT has an excellent localization performance for the LFM signal. Therefore, FrFT is well suited for processing time-varying speech signals and can lead to better results for speech emotion recognition.
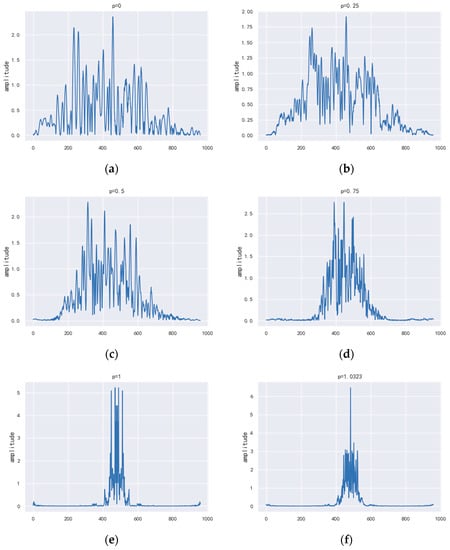
Figure 3.
The magnitude of FrFT of speech signal for various orders (domains). (a) the magnitude of the transform in the = 0 domain; (b) the magnitude of the transform in the = 0.25 domain; (c) the magnitude of the transform in the = 0.5 domain; (d) the magnitude of the transform in the = 0.75 domain; (e) the magnitude of the transform in the = 1 domain; (f) the magnitude of the transform in the optimal order= 1.0323 domain.
2.3. New MFCC Feature Extraction
MFCC uses mathematical calculations to represent the auditory system of the human ear and can achieve high recognition rates; therefore, MFCC is chosen as a feature for speech emotion recognition in this paper. However, the standard cepstrum parameter MFCC only reflects the static features of speech parameters, so this paper further calculates the dynamic features through the differential spectrum of static features. System performance is improved by combining static and dynamic features [18]. The optimal orderof FrFT is first obtained using the AF approach and is then applied to the extraction of MFCC features. The general steps are as follows:
- 1.
- Pre-processing of speech signals: First, pre-emphasis of the original speech signal occurs, so that the signal passes through the filter with . Then, the signal is divided into frames of 20 ms in length and 10 ms in shift. Finally, windows are added with Hamming Windows.
- 2.
- AF is used for each frame of the pre-processed speech signal to find the optimal order p.
- 3.
- The Discrete FrFT(DFrFT) is performed on each frame of the speech signal in combination with the optimal order found, and then further squared to obtain the energy spectrum.
- 4.
- The energy spectrum passes through a Mel filter bank where the filter bank is uniformly spaced, converting the linear frequency scale to a Mel frequency scale and followed by the logarithmic compression. The relationship between the Mel-scale and the frequency is:
- 5.
- The discrete cosine transform (DCT) of the logarithmic energy of the filter bank is calculated to obtain 13 static Mel-Frequency Cepstral Coefficients (MFCCs), and the first-order differential and second-order differential are further calculated to obtain first-order dynamic features and second-order dynamic features, for a total of 39 acoustic features. The formula for calculating the dynamic characteristics is as follows [19]:where is the first-order dynamic features, is the cepstrum coefficient, and typically K = 2. By replacing by one can similarly derive the second-order dynamic features.The framework of the new MFCC extraction algorithm is shown in Figure 4.
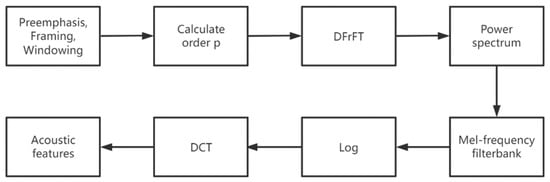 Figure 4. Framework for the new MFCC extraction algorithm.
3. Classification Model
The LSTM network, a further modified version of the Recurrent Neural Network (RNN), is used to learn long-term contextual relevance and therefore has the advantage of providing better performance when the data is sequential. The correlation between frames should be considered when performing speech emotion recognition; therefore, this paper uses LSTM as a classification model. The LSTM structure is shown in Figure 5.
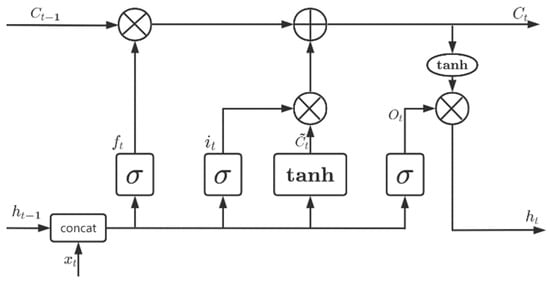
Figure 5.
The LSTM structure.
The equations describing the LSTM model are as follows:
where is the weight matrix containing the hidden layer inputs, is the weight matrix connecting the current layer to the previous layer, is the candidate hidden state calculated based on the current input and the previous hidden state, and C is the cell state [20].
The data is connected to the fully connected layer after learning temporal aggregation in the LSTM network and finally fed to the classifier for speech emotion classification. Softmax is a generalization of logistic regression to multi-category problems, where the category label takes on more than two values. Softmax is defined as follows:
where is the input to the softmax layer, is the activation of the previous layer, and is the weight matrix connecting the previous layer to the softmax layer. The predicted class labels are defined as follows:
4. Experimental Data and Results
4.1. Databases
The experiment was conducted on the RAVDESS [21]. The RAVDESS database is a gender-balanced database containing 7356 files with voice data for 12 female actors and 12 male actors. This paper used only the voice files containing 1440 files: Each of the 24 actors performed 60 experiments with voice files containing both “children talking next to the door” and “dog sitting next to the door”. There are eight emotions: neutral, calm, happy, sad, angry, fearful, surprise, and disgust. Each expression is produced at two levels of emotional intensity (normal, strong), with an additional neutral expression. The file format of the audio is 16 bit, 48 kHz and is stored in wave format.
4.2. Experimental Parameters
In this experiment, we applied ten-fold cross-validation. In each fold, firstly, the experimental data were randomly divided into two parts; the test set took 10% of the data. Then, the remaining 90% of the data was divided into 10 equal parts: nine parts for training and one part for validation. First, the MFCC is extracted from the preprocessed speech signal by the FrFT method. Then it is fed into an LSTM with 128 hidden layers to learn the temporal aggregation. A dropout rate of 0.5 was set for the dropout layer to prevent over-fitting. After that, the fully connected layer with the ReLU activation function is connected and finally fed into a softmax classifier for speech emotion classification, resulting in a classification result.
Table 1 shows the structural data of the model.

Table 1.
The structural data of the model.
The training parameters and parameter values for this paper are shown in Table 2.
Table 2.
Training parameters and parameter value.
4.3. Experimental Results and Analysis
In this paper, we use AF to find the optimal orderof FrFT and apply it to extract speech features MFCC, which is combined with the sequence model LSTM for speech emotion recognition. To verify the validity of the features, this paper conducts experiments on the RAVDESS.
The preliminary results are shown in Figure 6.
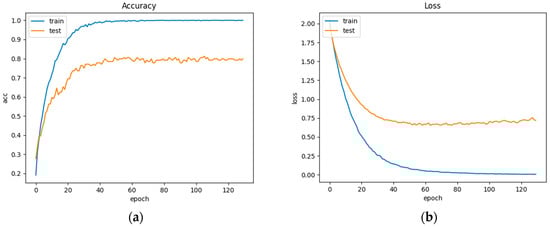
Figure 6.
(a) Accuracy curve; (b) Loss curve.
As demonstrated in Figure 6, the accuracy and loss start stabilizing after the 40th epoch.
Meanwhile, the weighted accuracy (WA) and unweighted accuracy (UA) were calculated in this experiment to evaluate the model’s performance [22]. The WA is often used to evaluate the system’s expected performance, whereas the UA is often used to assess its ability to discriminate between classes. The experiment achieved 79.86% WA and 79.51% UA. Initially, it can be seen that the experiment yielded good results.
Table 3 illustrates the comparison between this paper and other research evaluated using the UA results; all of the experiments used RAVDESS as the data set.
Table 3.
Comparison with other research using UA.
As illustrated in Table 3, the improved feature outperforms the original feature.
Furthermore, a confusion matrix was generated to show the classification results of each emotion more clearly. The confusion matrix on the RAVDESS dataset is shown in Figure 7.
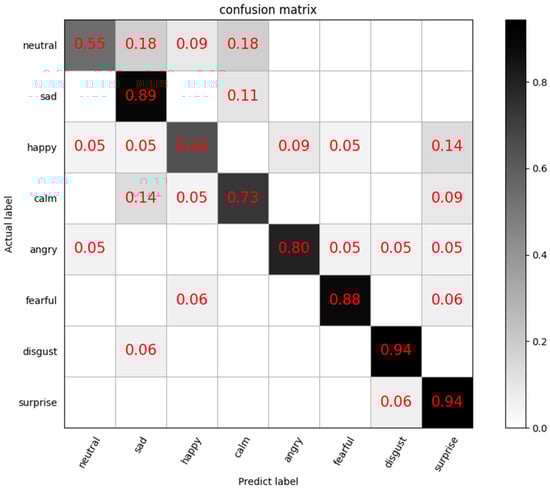
Figure 7.
Confusion matrix.
As demonstrated in Figure 7, disgust, surprise, sadness, and fearful achieved high recognition accuracies of 94%, 94%, 89%, and 88%. However, neutral and happy only obtained recognition accuracies of 55% and 64%. It can be seen that major confusion occurs between neutral and happy, so the cognition accuracy is relatively poor, and the cognition accuracy is relatively good for emotional fluctuations such as sadness, angry, fearful, disgust, surprise.
5. Conclusions
In our paper, FrFT is applied to speech feature extraction. The optimal fractional orderwas obtained using AF, extracting the new MFCC, and then obtaining the emotional classification of speech by sequence model LSTM classification. Due to applying FrFT, the new MFCC shows better performance, and the resulting features are better than the original MFCC features. Experiments show that better results can be obtained for the emotion categories on the RAVDESS, especially for sadness, angry, fearful, disgust, surprise.
However, there are some shortcomings in this experiment; that is, there is some room for improvement in the accuracy of the classification of emotions such as neutral, happy and calm. Therefore, the classification model will be further improved after this experiment to obtain better accuracy and reduce the loss rate.
Author Contributions
Methodology, L.H.; software, L.H.; writing—original draft preparation, L.H.; writing—review and editing, X.S. All authors have read and agreed to the published version of the manuscript.
Funding
This research received no external funding.
Data Availability Statement
The data presented in this study are available in the article.
Conflicts of Interest
The authors declare no conflict of interest.
References
- El Ayadi, M.; Kamel, M.S.; Karray, F. Survey on speech emotion recognition: Features, classification schemes, and databases. Pattern Recognit. 2011, 44, 572–587. [Google Scholar] [CrossRef]
- Davis, S.; Mermelstein, P. Comparison of parametric representations for monosyllabic word recognition in continuously spoken sentences. IEEE Trans. Acoust. Speech Signal Process. 1980, 28, 357–366. [Google Scholar] [CrossRef]
- Sowmya, V.; Rajeswari, A. Speech emotion recognition for Tamil language speakers. In Proceedings of the International Conference on Machine Intelligence and Signal Processing, Allahabad, India, 7–10 September 2019; Springer: Singapore, 2019; pp. 125–136. [Google Scholar]
- Likitha, M.S.; Gupta, S.R.R.; Hasitha, K.; Upendra Raju, A. Speech based human emotion recognition using MFCC. In Proceedings of the 2017 International Conference on Wireless Communications, Signal Processing and Networking (WiSPNET), Chennai, India, 22–24 March 2017; pp. 2257–2260. [Google Scholar]
- Dhruvi, D. Emotion recognition using Speech Signal: A Review. Int. Res. J. Eng. Technol. (IRJET) 2018, 5, 1599–1605. [Google Scholar]
- Jagtap, S.B.; Desai, K.R.; Patil, M.J.K. A Survey on Speech Emotion Recognition Using MFCC and Different classifier. In Proceedings of the 8th National Conference on Emerging Trends in Engg and Technology, New Delhi, India, 10 March 2018. [Google Scholar]
- Namias, V. The fractional order Fourier transform and its application to quantum mechanics. IMA J. Appl. Math. 1980, 25, 241–265. [Google Scholar] [CrossRef]
- Almeida, L.B. The fractional Fourier transform and time-frequency representations. IEEE Trans. Signal Process. 1994, 42, 3084–3091. [Google Scholar] [CrossRef]
- Zhang, W.Q.; He, L.; Hou, T.; Liu, J. Fractional Fourier transform based auditory feature for language identification. In Proceedings of the APCCAS 2008-2008 IEEE Asia Pacific Conference on Circuits and Systems, Macao, China, 30 November–3 December 2008; pp. 209–212. [Google Scholar]
- Yin, H.; Nadeu, C.; Hohmann, V. Pitch-and formant-based order adaptation of the fractional Fourier transform and its application to speech recognition. EURASIP J. Audio Speech Music. Process. 2010, 2009, 304579. [Google Scholar] [CrossRef][Green Version]
- Ma, D.; Xiang, X.; Jing, W.; Kuang, J. Pitch Tracking of Noisy Speech Using Cepstrum Based on FrFT. Sci. Online 2011, 6, 310–314. [Google Scholar]
- Ma, D.; Xie, X.; Kuang, J. A novel algorithm of seeking FrFT order for speech processing. In Proceedings of the 2011 IEEE International Conference on Acoustics, Speech and Signal Processing (ICASSP), Prague, Czech Republic, 22–27 May 2011; pp. 3832–3835. [Google Scholar]
- Verkholyak, O.V.; Kaya, H.; Karpov, A.A. Modeling short-term and long-term dependencies of the speech signal for paralinguistic emotion classification. SPIIRAS Proc. 2019, 18, 30–56. [Google Scholar] [CrossRef]
- Barbarossa, S. Analysis of multicomponent LFM signals by a combined Wigner-Hough transform. IEEE Trans. Signal Process. 1995, 43, 1511–1515. [Google Scholar] [CrossRef]
- Jennison, B.K. Detection of polyphase pulse compression waveforms using the Radon-ambiguity transform. IEEE Trans. Aerosp. Electron. Syst. 2003, 39, 335–343. [Google Scholar] [CrossRef]
- Yongqiang, D.; Ran, T.; Siyong, Z.; Yue, W. The Fractional Fourier Analysis of Multicomponent Chirp Signals with Unknown Parameters. Trans. Beijing Inst. Technol. 1999, 5, 612–616. [Google Scholar]
- Capus, C.; Brown, K. Short-time fractional Fourier methods for the time-frequency representation of chirp signals. J. Acoust. Soc. Am. 2003, 113, 3253–3263. [Google Scholar] [CrossRef] [PubMed]
- Huang, X.; Acero, A.; Hon, H.W. Spoken Language Processing: Guide to Algorithms and System Development, 1st ed.; Prentice Hall PTR: Hoboken, NJ, USA, 2001; pp. 423–424. [Google Scholar]
- Shi, T.; Zhen, J. Optimization of MFCC algorithm for embedded voice system. In Proceedings of the International Conference in Communications, Signal Processing, and Systems, Changbaishan, China, 4–5 July 2020; Springer: Singapore, 2020; pp. 657–660. [Google Scholar]
- An, S.; Ling, Z.; Dai, L. Emotional statistical parametric speech synthesis using LSTM-RNNs. In Proceedings of the 2017 Asia-Pacific Signal and Information Processing Association Annual Summit and Conference (APSIPA ASC), Kuala Lumpur, Malaysia, 12–15 December 2017; pp. 1613–1616. [Google Scholar]
- Livingstone, S.R.; Russo, F.A. The Ryerson Audio-Visual Database of Emotional Speech and Song (RAVDESS): A dynamic, multimodal set of facial and vocal expressions in North American English. PLoS ONE 2018, 13, e0196391. [Google Scholar] [CrossRef] [PubMed]
- Konar, A.; Chakraborty, A. Emotion Recognition: A Pattern Analysis Approach; John Wiley & Sons: Hoboken, NJ, USA, 2015; p. 250. [Google Scholar]
- Parry, J.; Palaz, D.; Clarke, G.; Lecomte, P.; Mead, R.; Berger, M.; Hofer, G. Analysis of Deep Learning Architectures for Cross-Corpus Speech Emotion Recognition. In Proceedings of the Interspeech, Graz, Austria, 15–19 September 2019; pp. 1656–1660. [Google Scholar]
- Jalal, M.A.; Loweimi, E.; Moore, R.K.; Hain, T. Learning temporal clusters using capsule routing for speech emotion recognition. In Proceedings of the Interspeech 2019, ISCA, Graz, Austria, 15–19 September 2019; pp. 1701–1705. [Google Scholar]
- Yadav, A.; Vishwakarma, D.K. A multilingual framework of CNN and bi-LSTM for emotion classification. In Proceedings of the 2020 11th International Conference on Computing, Communication and Networking Technologies (ICCCNT), Kharagpur, India, 1–3 July 2020; pp. 1–6. [Google Scholar]
- Zisad, S.N.; Hossain, M.S.; Andersson, K. Speech emotion recognition in neurological disorders using convolutional neural network. In Proceedings of the International Conference on Brain Informatics, Padua, Italy, 19 September 2020; Springer: Cham, Switzerland, 2020; pp. 287–296. [Google Scholar]
Publisher’s Note: MDPI stays neutral with regard to jurisdictional claims in published maps and institutional affiliations. |
© 2022 by the authors. Licensee MDPI, Basel, Switzerland. This article is an open access article distributed under the terms and conditions of the Creative Commons Attribution (CC BY) license (https://creativecommons.org/licenses/by/4.0/).