Design of Prototype Formulations for In Vitro Dermal Delivery of the Natural Antioxidant Ferulic Acid Based on Ethosomal Colloidal Systems


Abstract
1. Introduction
2. Experiment
2.1. Materials
2.2. Methods
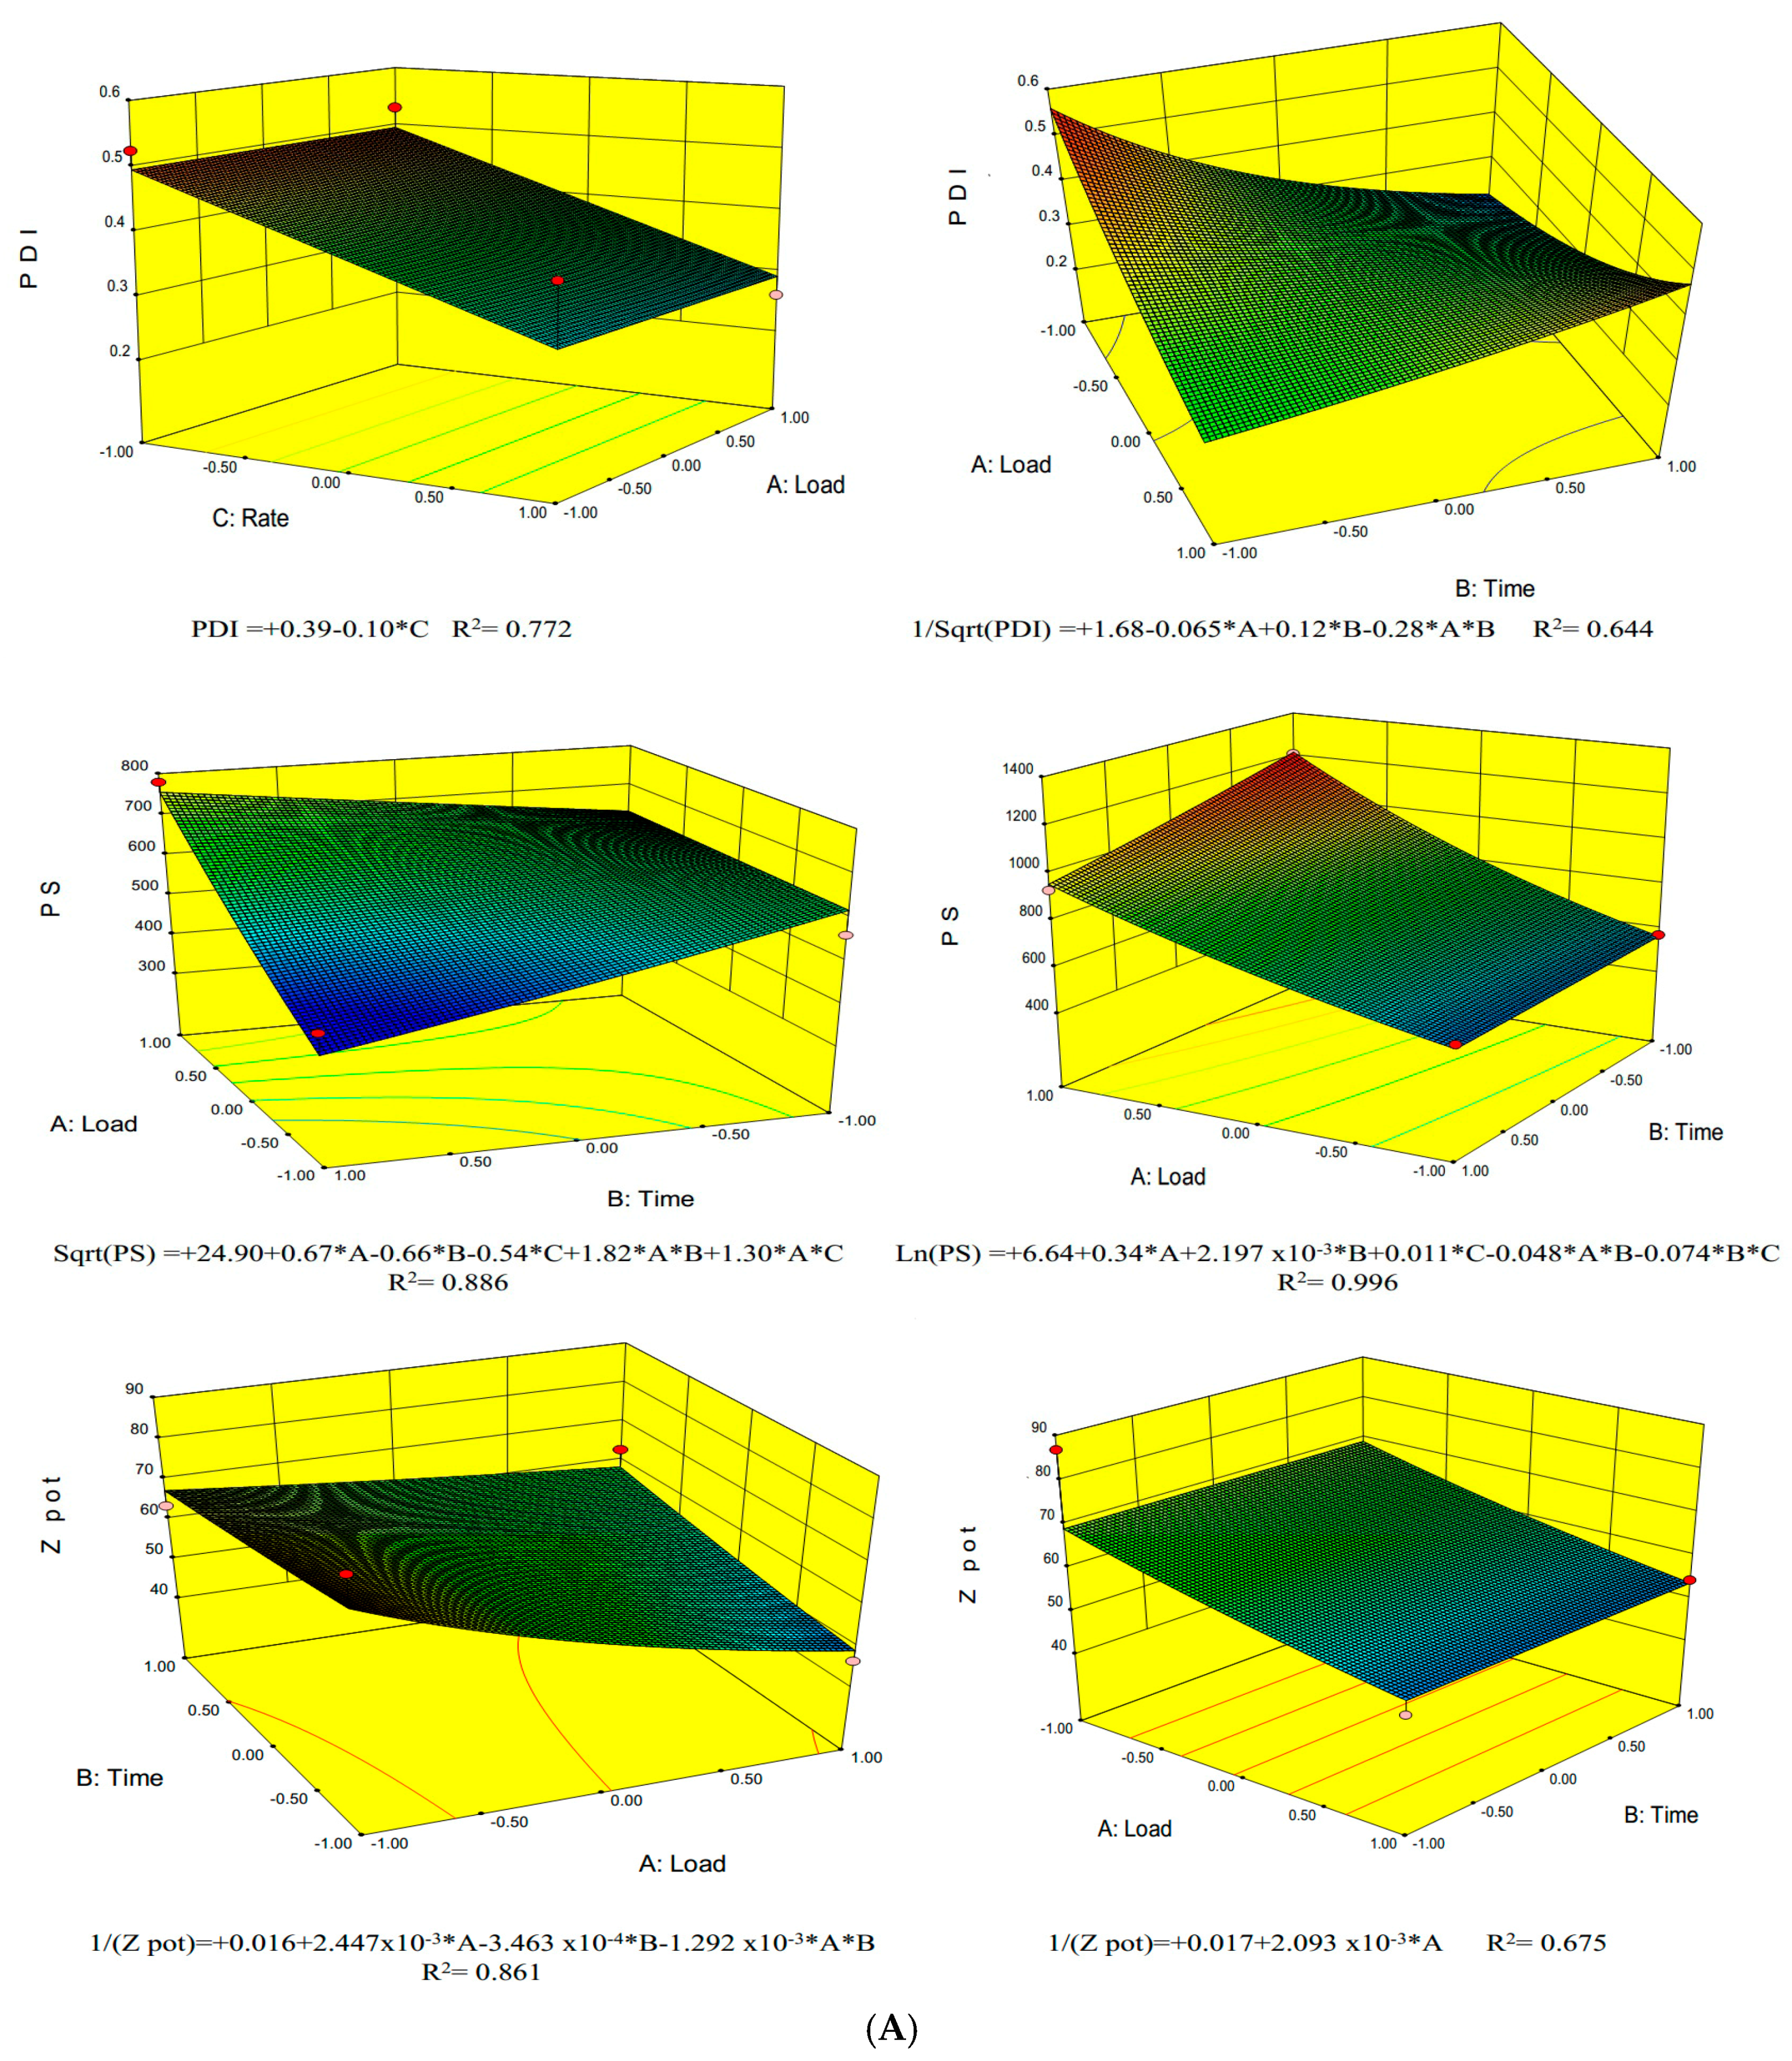
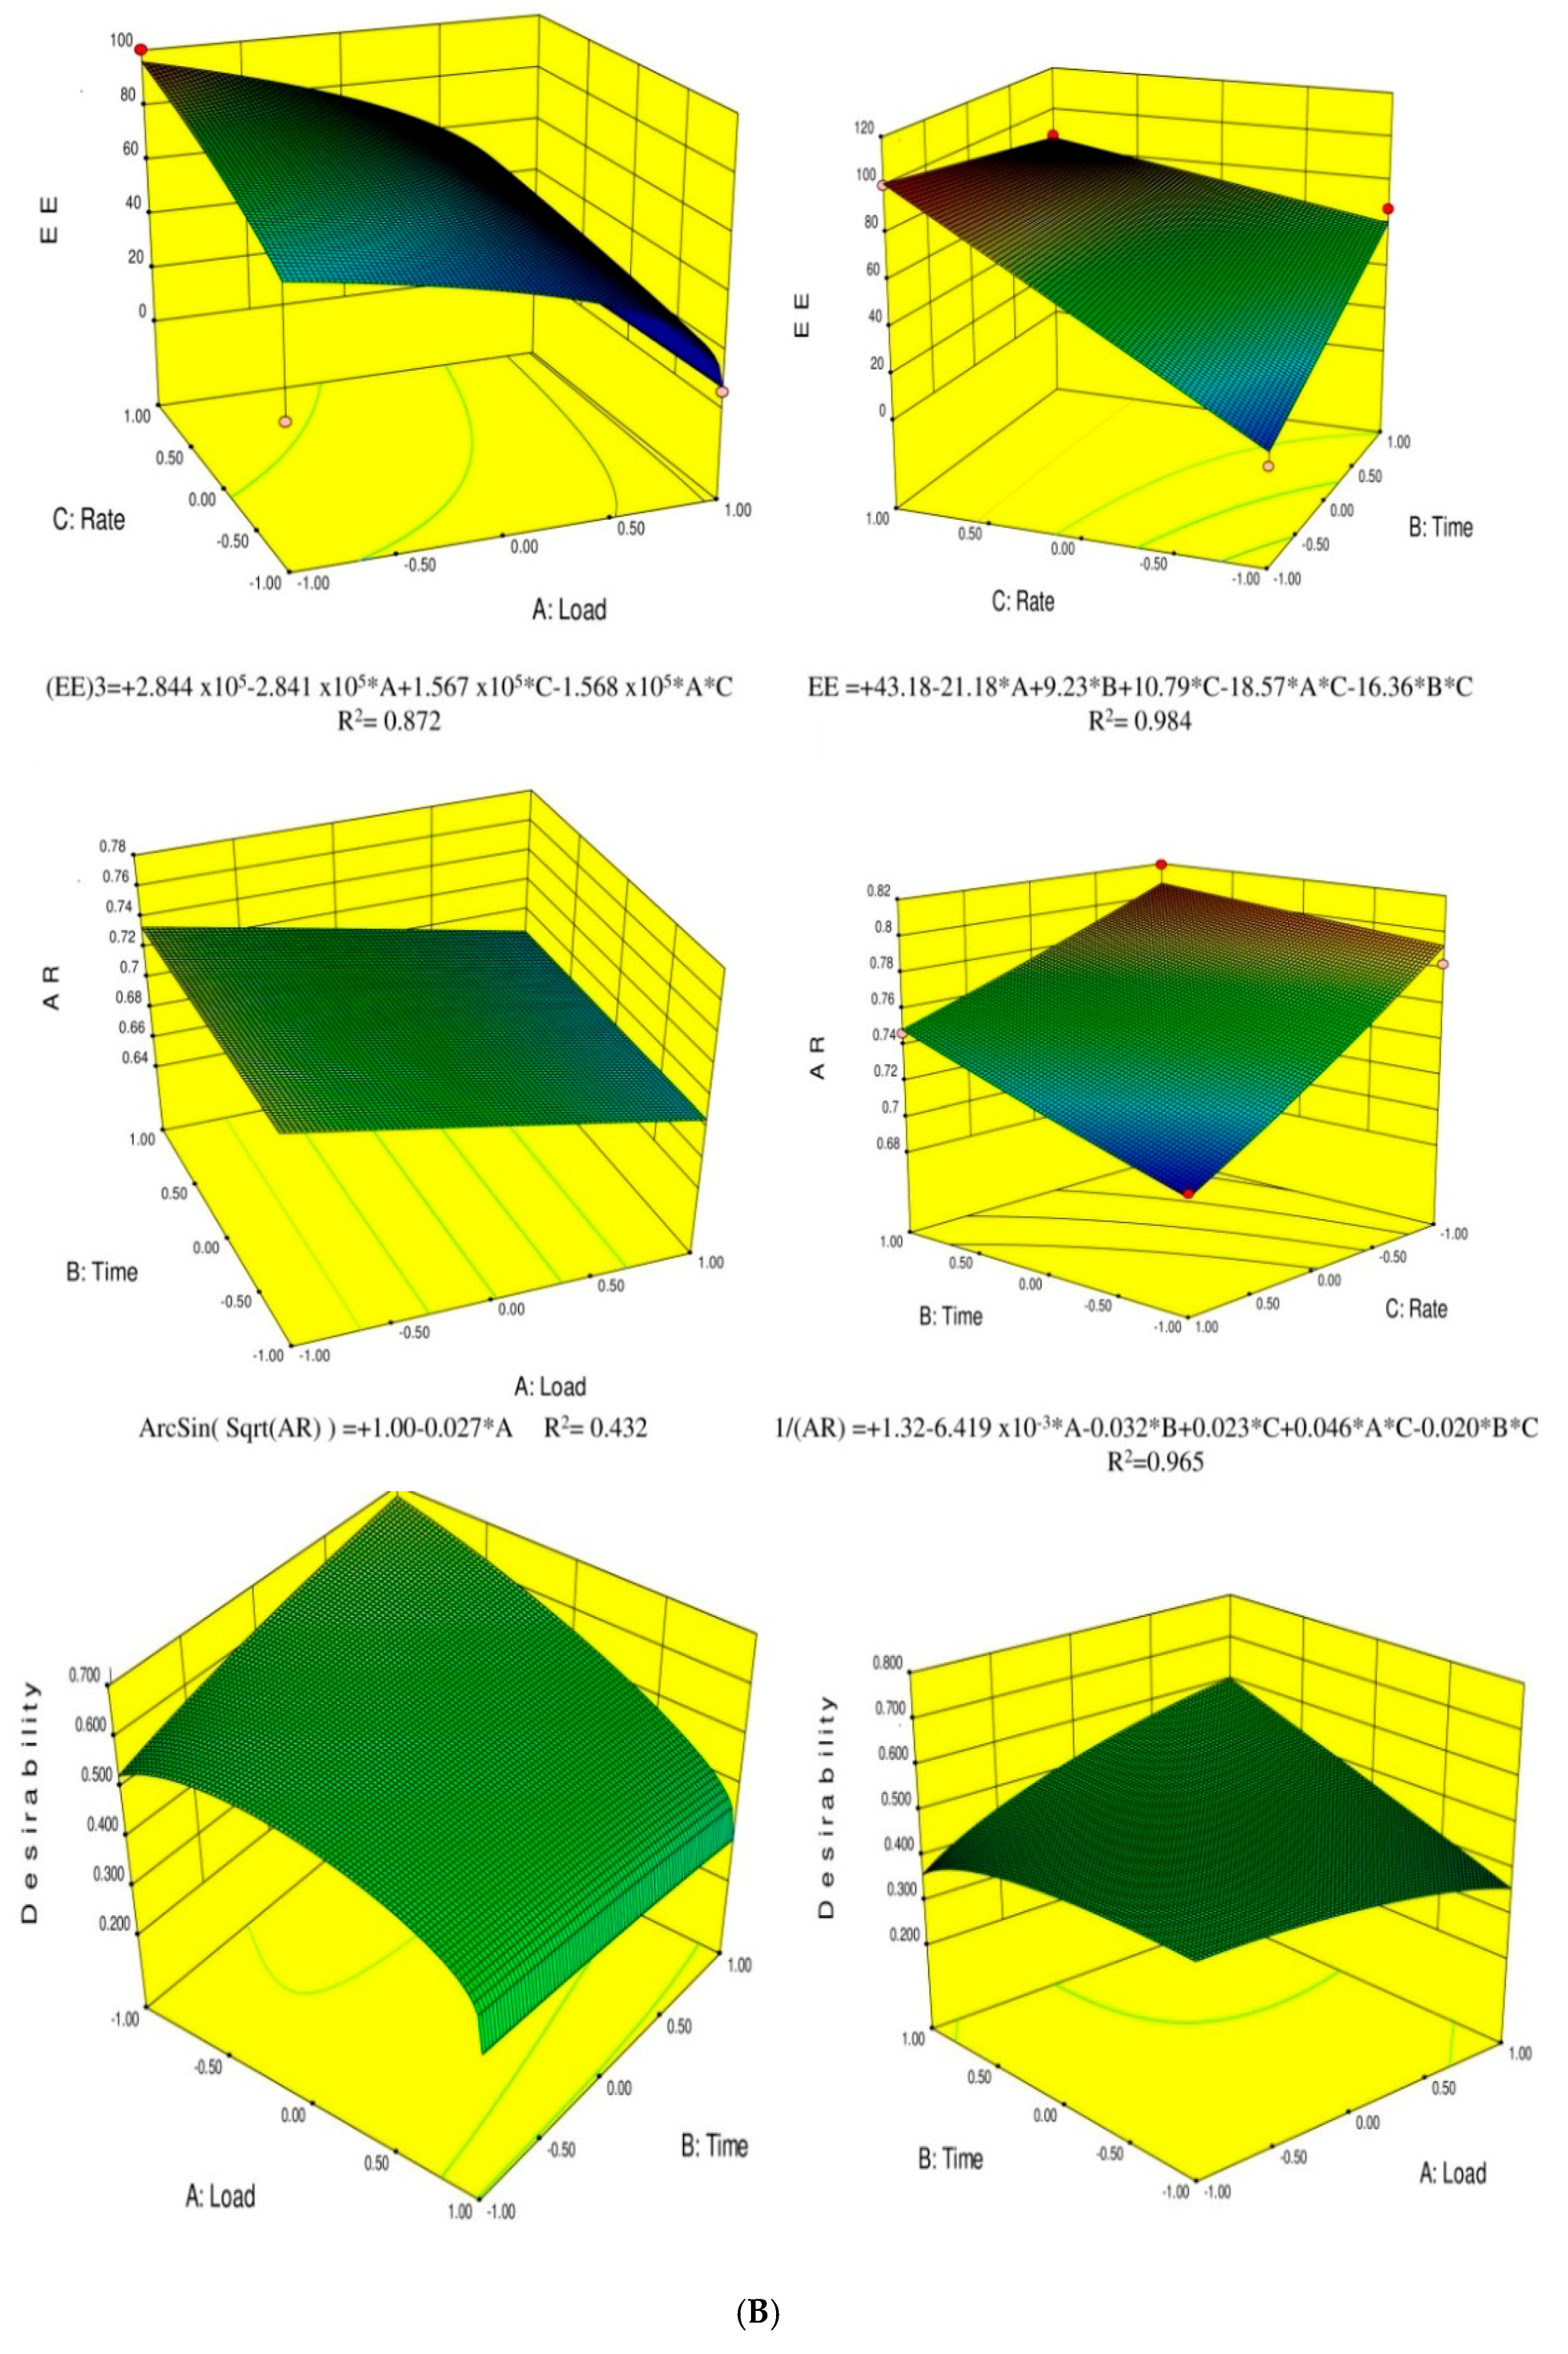
2.2.1. Experimental Design, Statistical Analysis, and Process Optimization
2.2.2. Production of Ethosomal Systems
Hot Processing Method
Cold Processing Method
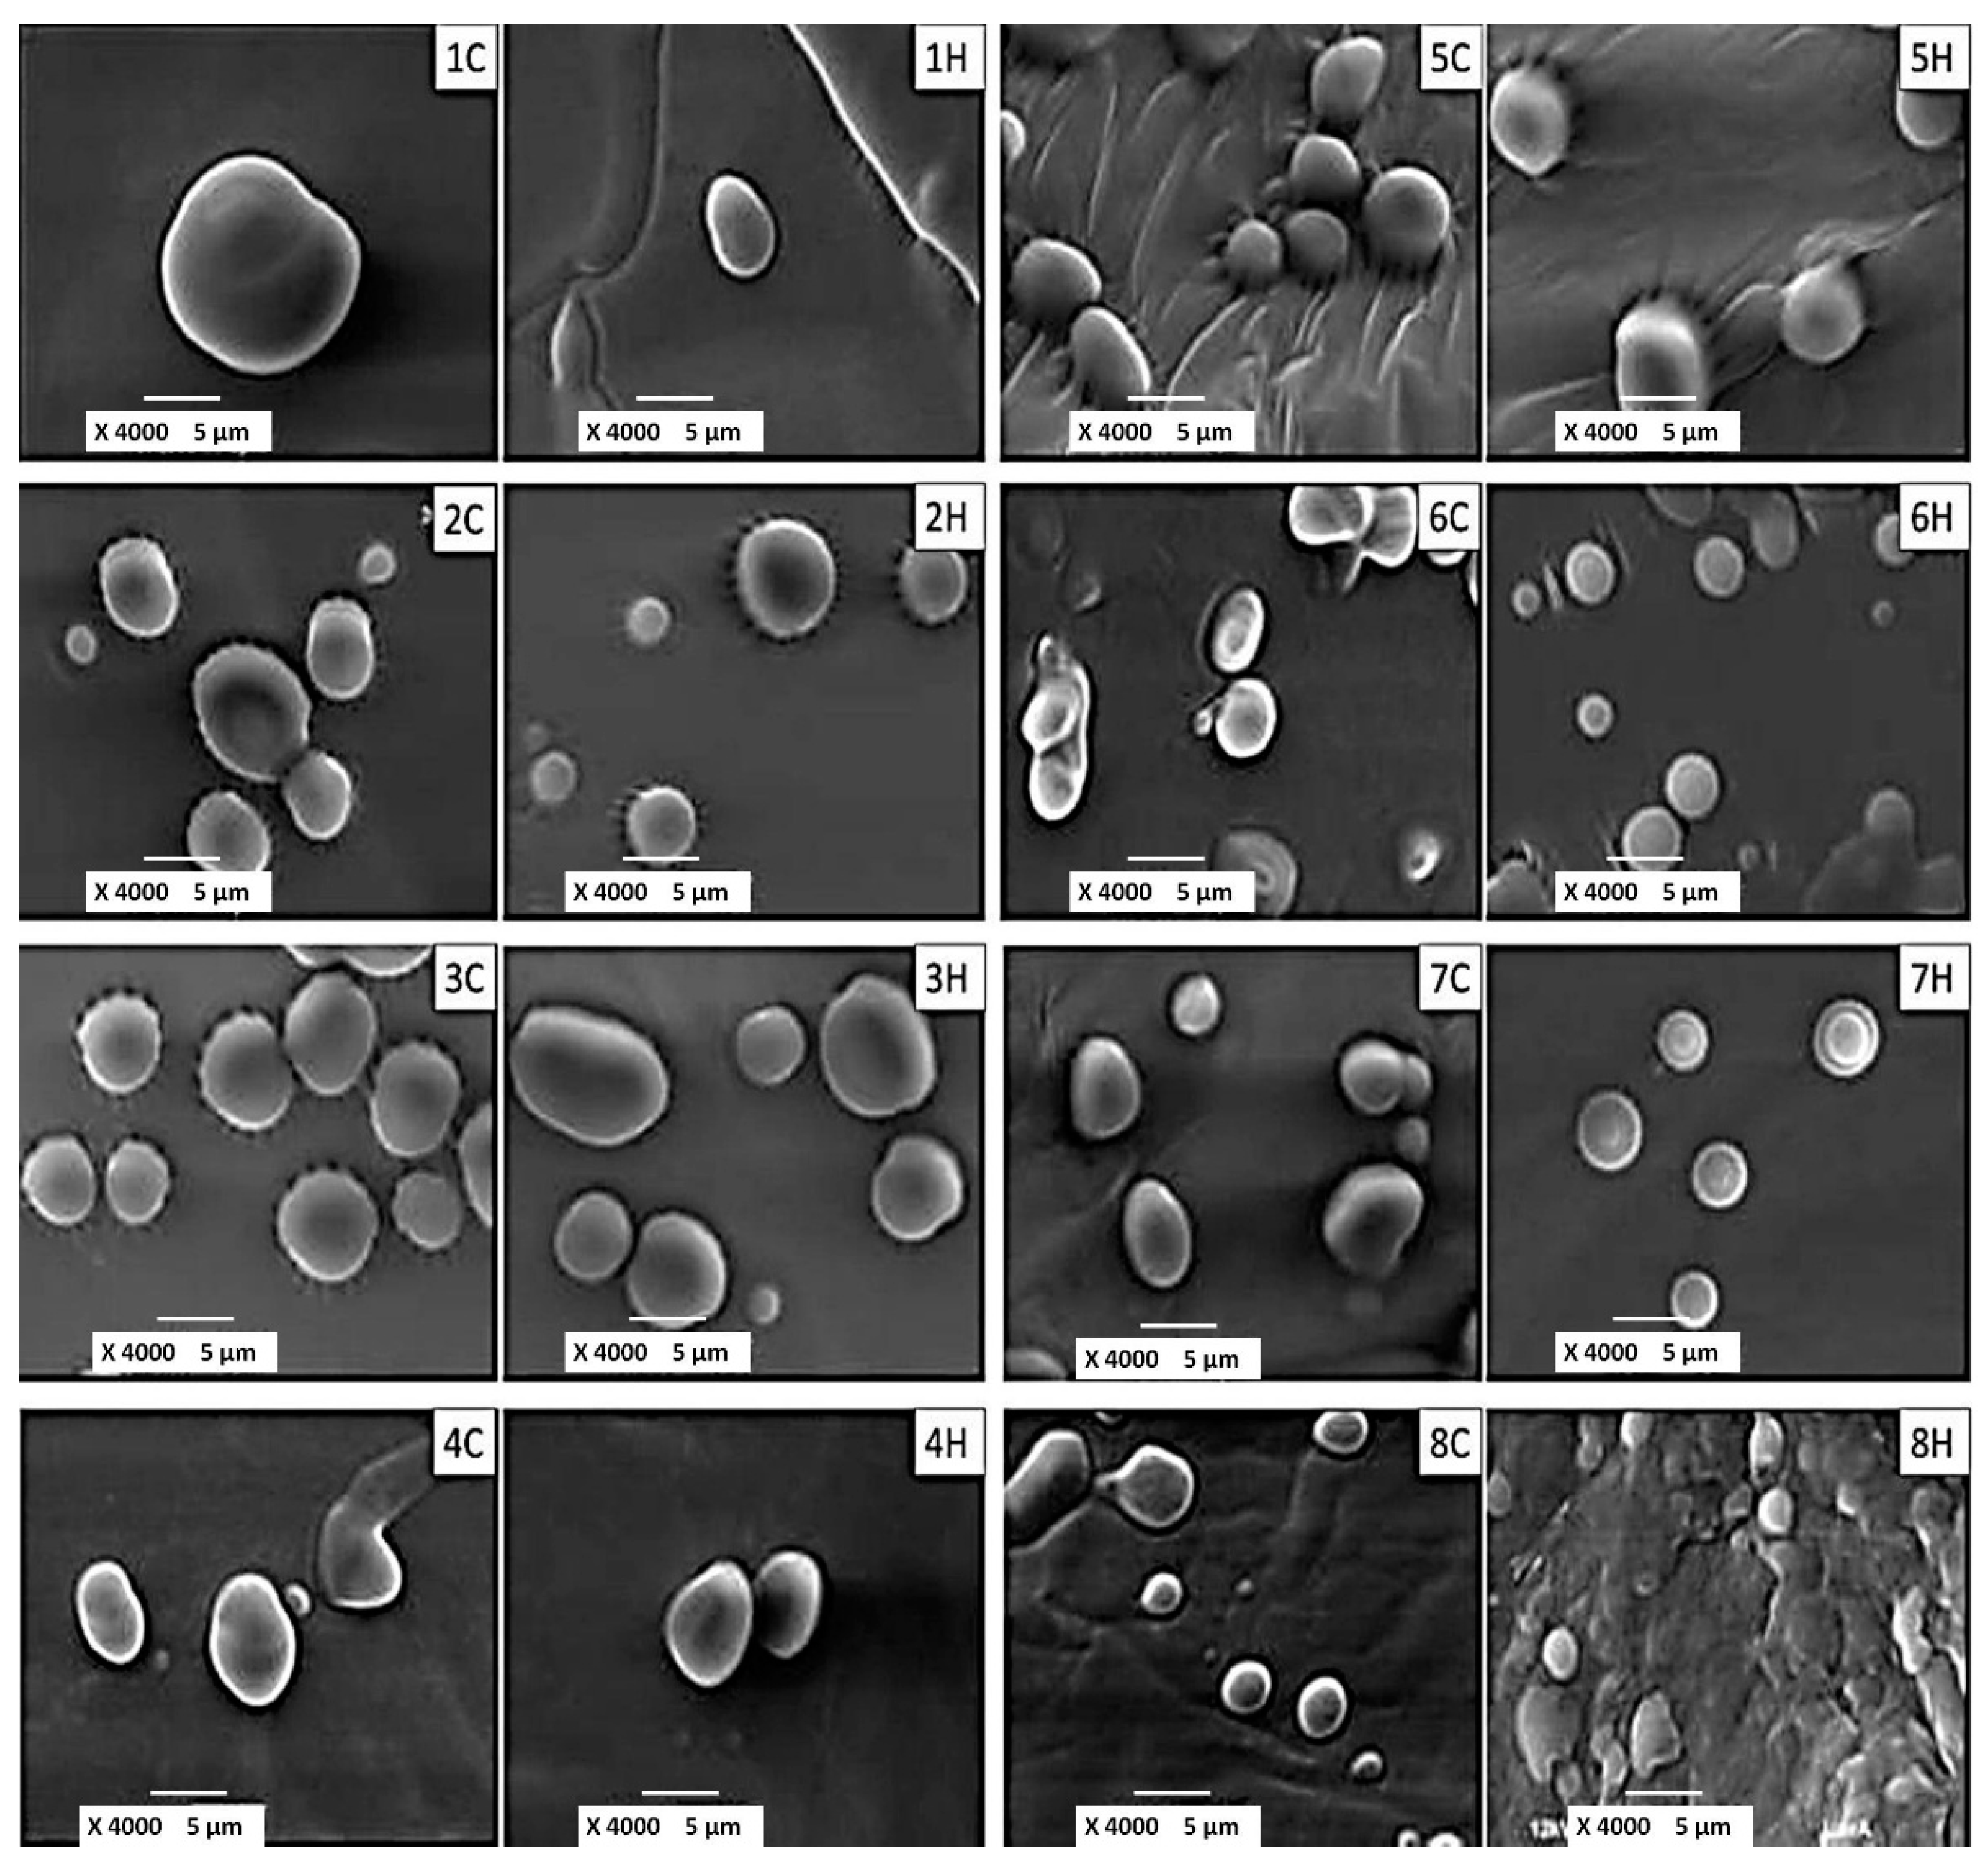
2.2.3. Morphology and Surface Analysis of the Vesicles
2.2.4. Dynamic Light Scattering (DLS) Characterization
2.2.5. EE Measurements
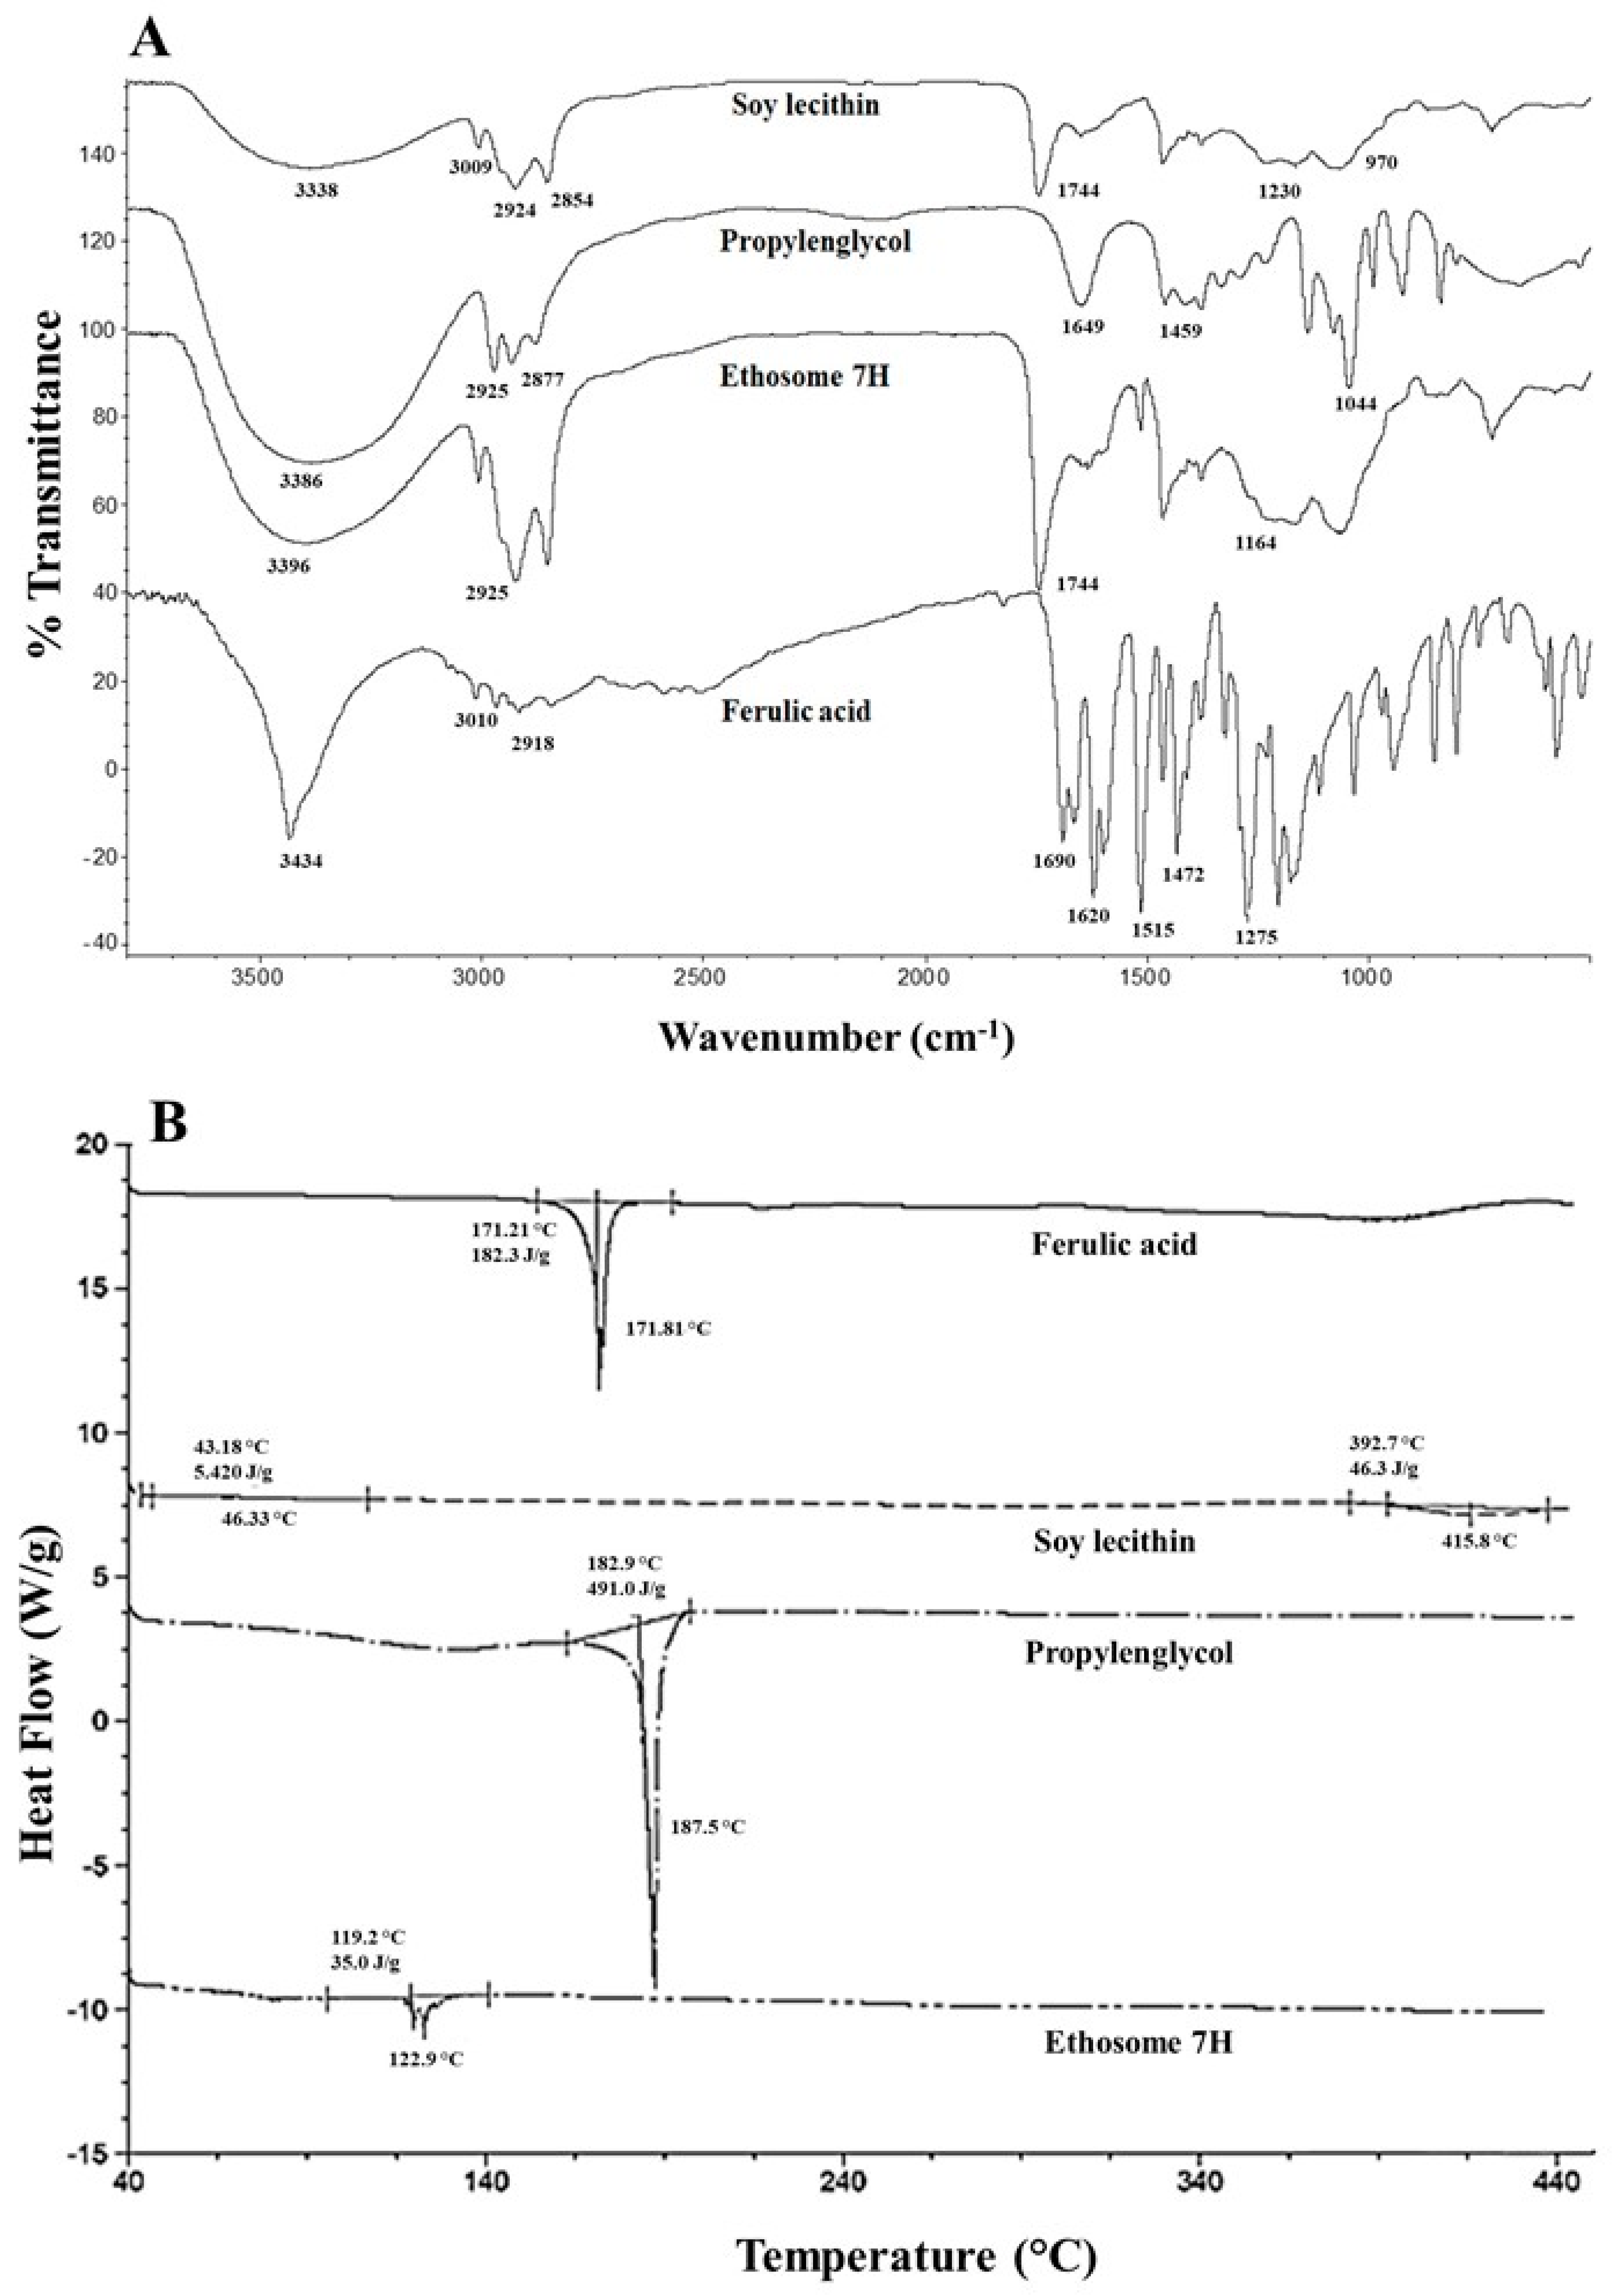
2.2.6. Characterization of Optimized Ethosomal Systems Using Fourier-Transform Infrared (FT-IR) Spectroscopy and Differential Scanning Calorimetry (DSC)
2.2.7. Physical Stability of Optimized Ethosomal Systems Analyzed Using DLS
2.2.8. Performance Tests
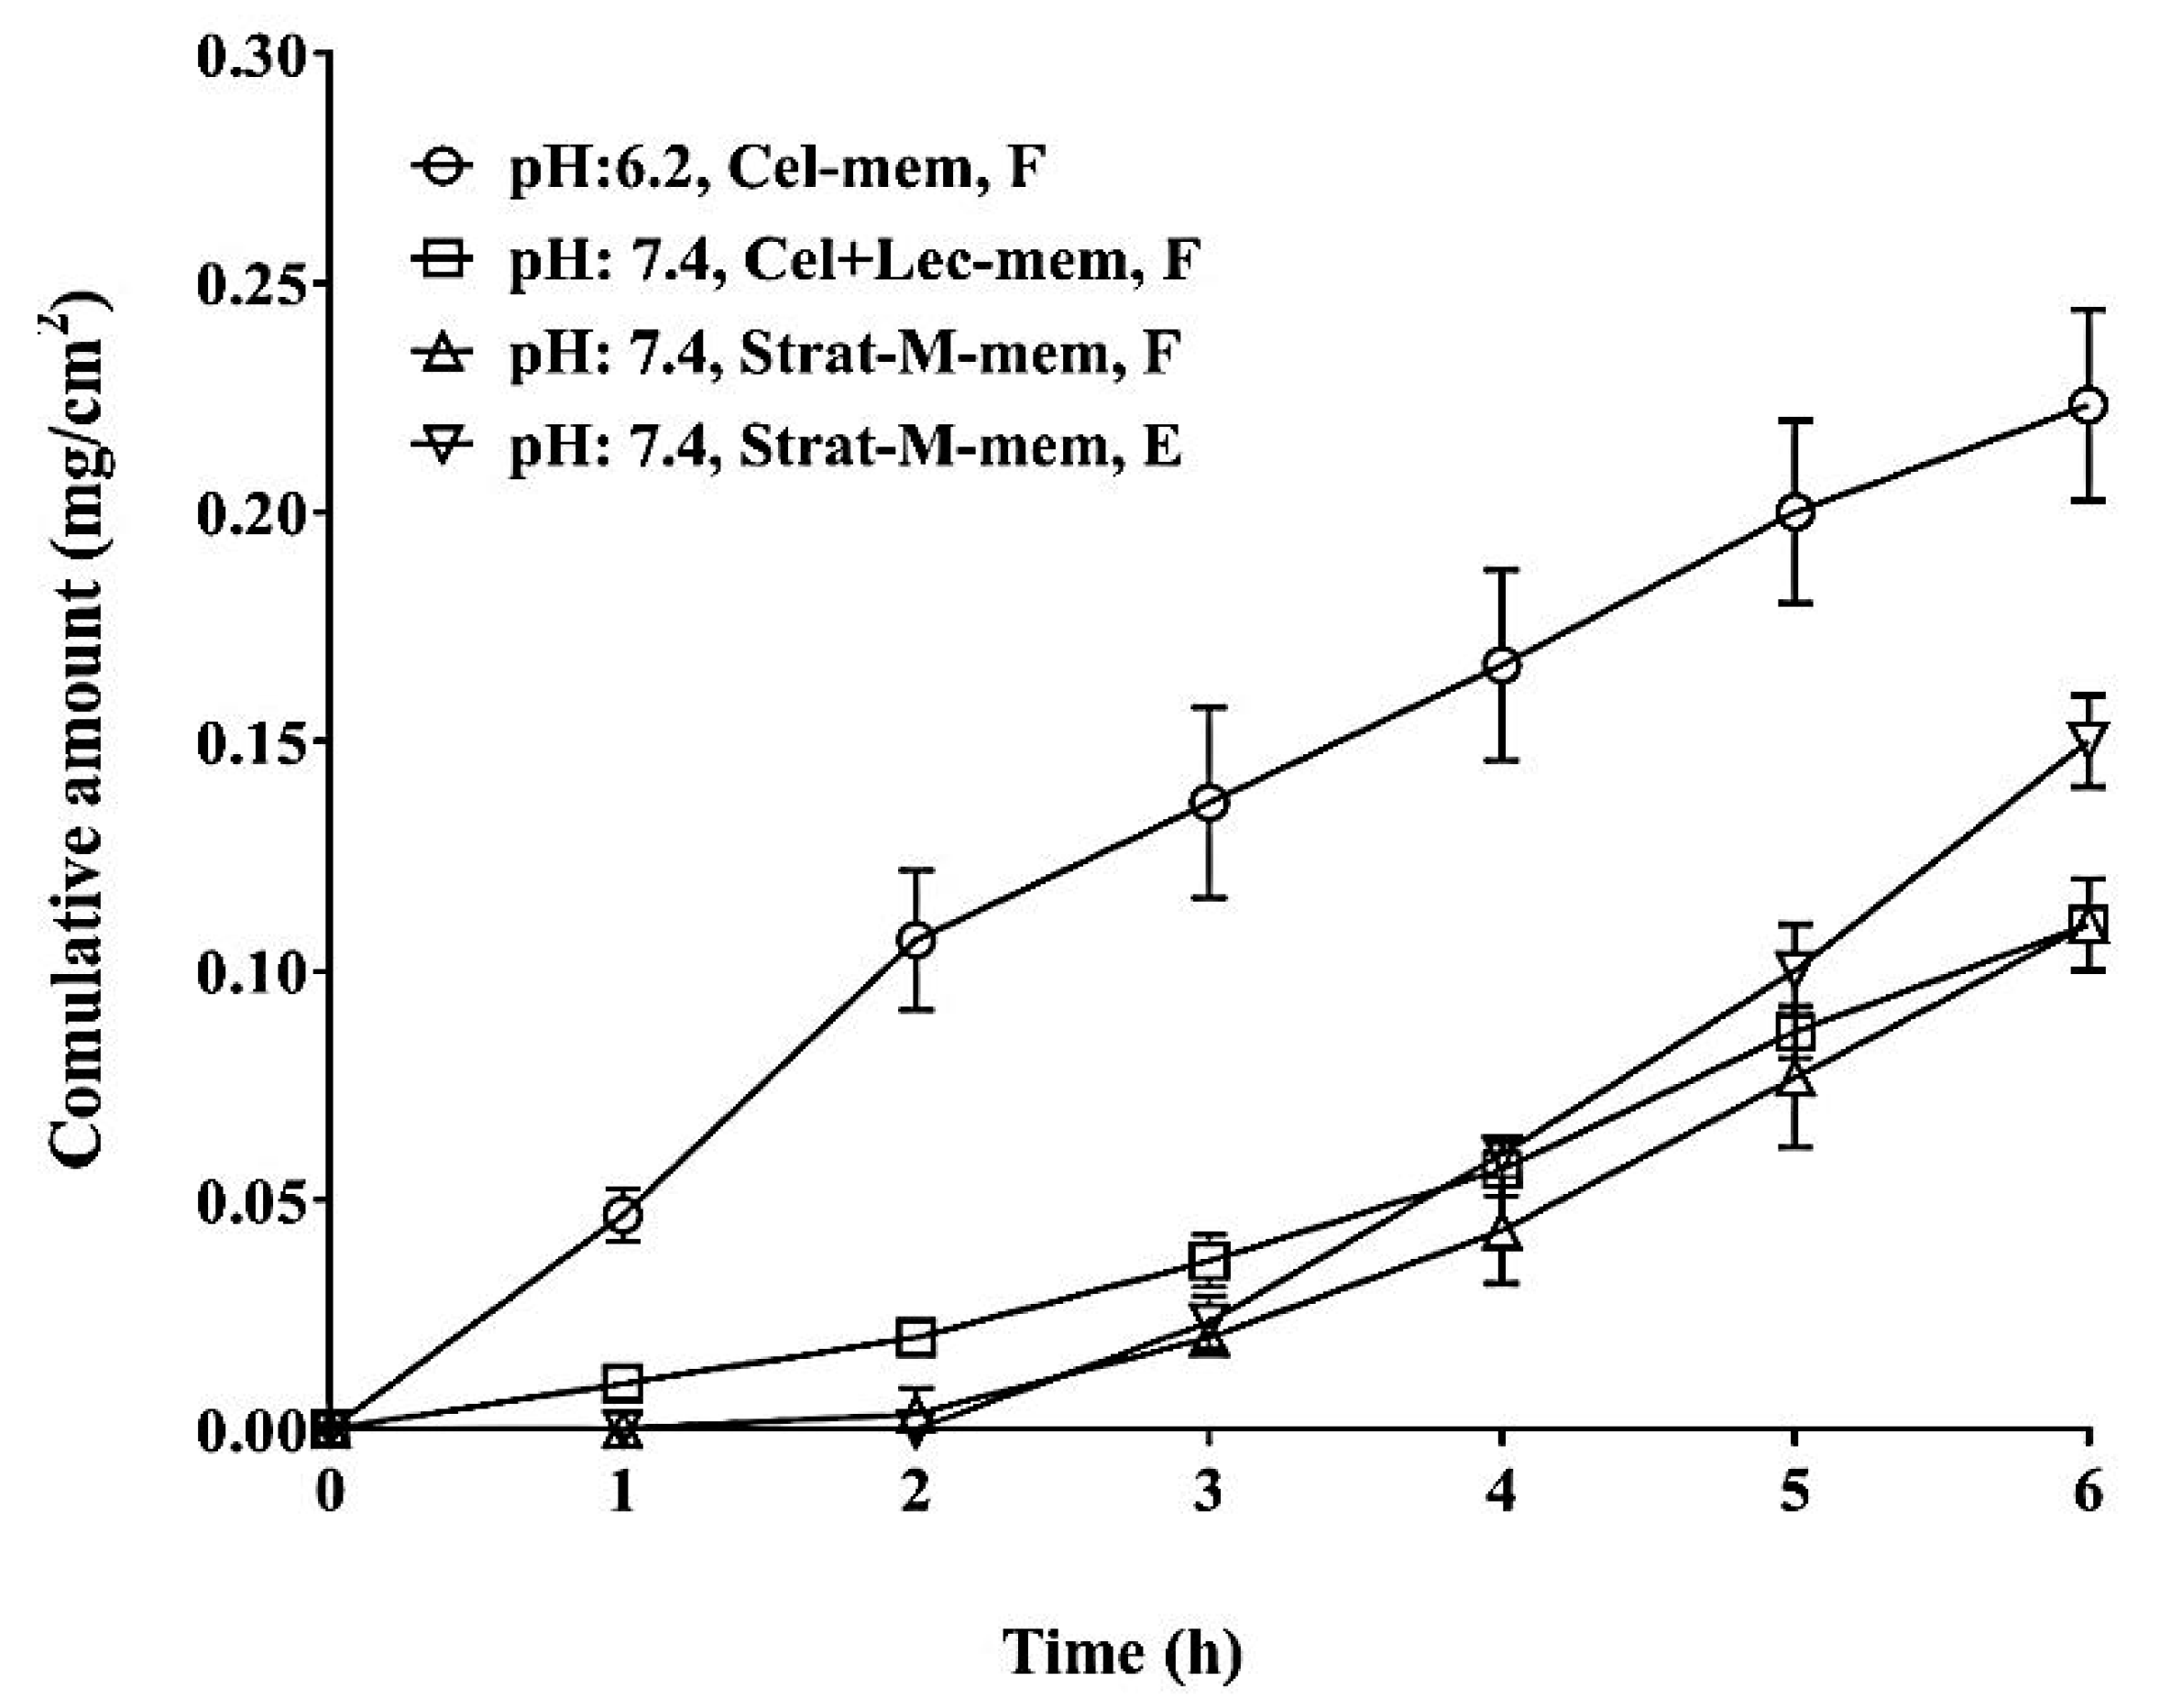
In-Vitro Permeability Test
3. Results and Discussion
3.1. Effect of Processing Conditions on Physical Properties of Vesicles
3.2. DLS Characterization of Vesicles
3.3. EE Analysis
3.4. FT-IR and DSC Characterization of the Optimized Ethosomal System
3.5. DLS Characterization of Optimized Ethosomal Systems
3.6. Performance Tests of the Optimized Ethosomal System
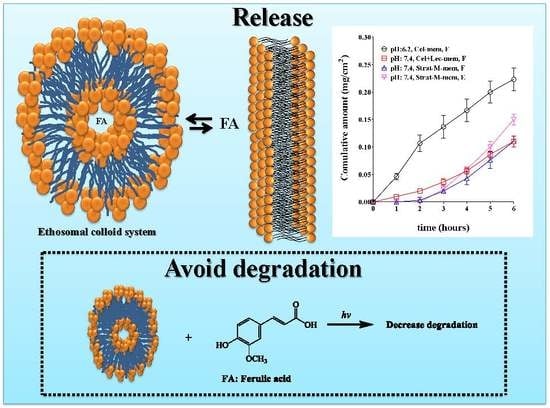
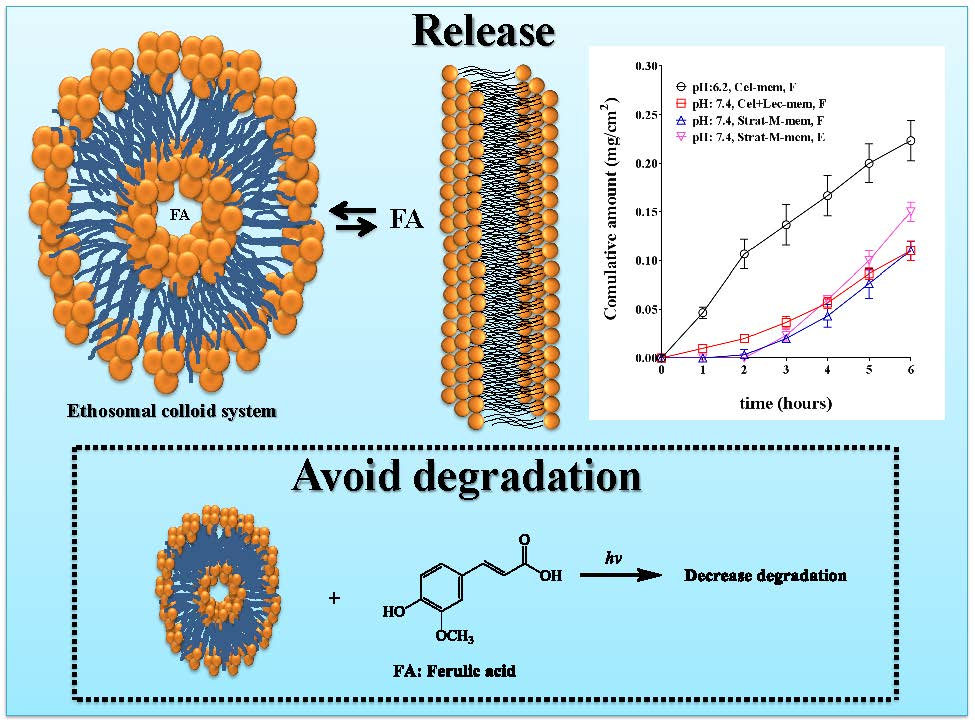
In-Vitro Permeability Test
4. Conclusions
Author Contributions
Funding
Acknowledgements
Conflicts of Interest
References
- World Health Organization. Skin Cancers. Available online: https://www.who.int/uv/faq/skincancer/en/index1.html (accessed on 18 January 2018).
- Rojas, J.; Londoño, C.; Ciro, Y. The health benefits of natural skin UVA photoprotective compounds found in botanical sources. Int. J. Pharm. Pharm. Sci. 2016, 8, 13–23. [Google Scholar]
- Harwansh, R.K.; Mukherjee, P.K.; Bahadur, S.; Biswas, R. Enhanced permeability of ferulic acid loaded nanoemulsion based gel through skin against UVA mediated oxidative stress. Life Sci. 2015, 141, 202–211. [Google Scholar] [CrossRef] [PubMed]
- Chang, M.; Chang, C. Determination of four lipophilic phenolics in o/w emulsions as well as their stability. Chia-Nan Annu. Bull. 2012, 38, 91–101. [Google Scholar]
- Ingredients Ferulic Acid. Available online: https://www.ewg.org/skindeep/ingredient/702470/FERULIC_ACID/ (accessed on 18 January 2018).
- Zhu, H.; Liang, Q.; Xiong, X.; Chen, J.; Wu, D.; Wang, Y.; Yang, B.; Zhang, Y.; Huang, X. Anti-Inflammatory Effects of the Bioactive Compound Ferulic Acid Contained in Oldenlandia diffusa on Collagen-Induced Arthritis in Rats. eCAM 2014, 2014, 573801. [Google Scholar] [PubMed]
- Rakesh, R.; Anoop, K. Ethosomes for transdermal and topical drug delivery. Int. J. Pharm. Pharm. Sci. 2012, 4, 17–24. [Google Scholar]
- Verma, P.; Pathak, K. Therapeutic and cosmeceutical potential of ethosomes: An overview. J. Adv. Pharm. Technol. Res. 2010, 1, 274–282. [Google Scholar] [CrossRef] [PubMed]
- Manca, M.; Castangia, I.; Matricardi, P.; Lampis, S.; Busquets, X.; Fadda, A.; Manconi, M. Molecular Arrangements and Interconnected Bilayer Formation Induced by Alcohol or Polyalcohol in Phospholipid Vesicles. Colloids Surf. B Biointerfaces 2014, 117, 360–367. [Google Scholar] [CrossRef] [PubMed]
- Grit, M.; De Srnidt, J.H.; Struijke, A.; Crommelin, D. Hydrolysis of phosphatidylcholine in aqueous liposome dispersions. Int. J. Pharm. 1989, 50, 1–6. [Google Scholar] [CrossRef]
- Brandl, M. Liposomes as drug carriers: A technological approach. Biotechnol. Annu. Rev. 2001, 7, 59–85. [Google Scholar] [PubMed]
- Blume, G.; Cevc, G. Molecular mechanism of the lipid vesicle longevity in vivo. BBA Biomembr. 1993, 1146, 157–168. [Google Scholar] [CrossRef]
- Kanehisa, M.; Tsong, T. Cluster model of lipid phase transitions with application to passive permeation of molecules and structure relaxations in lipid bilayers. J. Am. Chem. Soc. 1978, 100, 424–432. [Google Scholar] [CrossRef]
- Lodzki, M.; Godin, B.; Rakou, L.; Mechoulam, R.; Gallily, R.; Touitou, E. Cannabidiol—Transdermal delivery and anti-inflammatory effect in a murine model. J. Control. Release 2003, 93, 377–387. [Google Scholar] [CrossRef] [PubMed]
- Panwar, R.; Pemmaraju, S.C.; Sharma, A.K.; Pruthi, V. Efficacy of ferulic acid encapsulated chitosan nanoparticles against Candida albicans biofilm. Microb. Pathog. 2016, 95, 21–31. [Google Scholar] [CrossRef] [PubMed]
- Castangia, I.; Manca, M.; Matricardi, P.; Sinico, C.; Lampis, S.; Busquets, X.; Fadda, A.; Manconi, M. Effect of Diclofenac and Glycol Intercalation on Structural Assembly of Phospholipid Lamellar Vesicles. Int. J. Pharm. 2013, 456, 1–9. [Google Scholar] [CrossRef] [PubMed]
- Lian, T.; Ho, R. Trends and Developments in Liposome Drug Delivery Systems. J. Pharm. Sci. 2001, 90, 667–680. [Google Scholar] [CrossRef]
- Bhalaria, M.; Naik, S.; Misra, A. Ethosomes: A novel delivery system for antifungal drugs in the treatment of topical fungal diseases. Indian J. Exp. Biol. 2009, 47, 368–375. [Google Scholar] [PubMed]
- Uchida, T.; Kadhum, W.; Kanai, S.; Oshizaka, T.; Todo, H.; Sugibayashi, K. Prediction of skin permeation by chemical compounds using the artificial membrane, Strat-MTM. Eur. J. Pharm. Sci. 2015, 67, 113–118. [Google Scholar] [CrossRef] [PubMed]
- Simon, A.; Amaro, M.; Healy, A.; Cabral, L.; de Sousa, V. Comparative evaluation of rivastigmine permeation from a transdermal system in the Franz cell using synthetic membranes and pig ear skin with in vivo-in vitro correlation. Int. J. Pharm. 2016, 512, 234–241. [Google Scholar] [CrossRef]
- Touitou, E.; Dayan, N.; Bergelson, L.; Godin, B.; Eliaz, M. Ethosomes—Novel vesicular carriers for enhanced delivery: Characterization and skin penetration properties. J. Control. Release 2000, 65, 403–418. [Google Scholar] [CrossRef]
- Chapman, D.; Arrondo, J. Recent studies of liposomes and modifications of their structures. In Liposomes Drugs and Immunocompetent Cell Function; Nicolau, C., Paraf, A., Eds.; Academic Press: London, UK, 1981. [Google Scholar]
- Weiner, A.; Carpenter-Green, S.; Soehngen, E.; Lenk, R.; Popescu, M. Liposome–Collagen Gel Matrix: A Novel Sustained Drug Delivery System. J. Pharm. Sci. 1985, 74, 922–925. [Google Scholar] [CrossRef] [PubMed]
- Lee, D.; Chapman, D. Infrared Spectroscopic Studies of Biomembranes and Model Membranes. Biosci. Rep. 1986, 6, 235–256. [Google Scholar] [CrossRef] [PubMed]
- Maurer, N.; Fenske, D.; Cullis, P. Developments in liposomal drug delivery systems. Expert Opin. Biol. Ther. 2001, 1, 923–947. [Google Scholar] [CrossRef]
- Malekar, S. Liposomes for the Controlled Delivery of Multiple Drugs. Ph.D. Thesis, University of Rhode Island, Kingston, RI, USA, 2014. [Google Scholar]
- Bergstrand, N. Liposomes for Drug Delivery: From Physico-Chemical Studies to Applications. Ph.D. Thesis, Acta Universitatis Upsaliensis, Uppsala, Sweden, 2003. [Google Scholar]
- Kan, P.; Tsao, C.; Wang, A.; Su, W.; Liang, H. A liposomal formulation able to incorporate a high content of Paclitaxel and exert promising anticancer effect. J. Drug Deliv. 2011, 2011, 629234. [Google Scholar] [CrossRef]
- Torres, J.; Durás, S. Fosfolípidos: Propiedades y efectos sobre la salud. Nutr. Hosp. 2015, 31, 76–83. [Google Scholar]
- Kuligowski, J.; Quintás, G.; Garrigues, S.; De la Guardia, M. Determination of lecithin and soybean oil in dietary supplements using partial least squares–Fourier transform infrared spectroscopy. Talanta 2008, 77, 229–234. [Google Scholar] [CrossRef] [PubMed]
- Choudhary, N.; Pardhi, D.; Bhoyar, M. Isolation of soy lecithin from soy sludge, its standardization and behavioural stud. Asian J. Pharm. Clin. Res. 2013, 6, 133–136. [Google Scholar]
- Ingvarsson, P.; Yang, M.; Nielsen, H. Stabilization of liposomes during drying. Expert Opin. Drug Deliv. 2011, 8, 375–388. [Google Scholar] [CrossRef] [PubMed]
- Shinzawa, H.; Uchimaru, T.; Mizukado, J.; Kazarian, S.G. Non-equilibrium behavior of polyethylene glycol (PEG)/polypropylene glycol (PPG) mixture studied by Fourier transform infrared (FTIR) spectroscopy. Vib. Spectrosc. 2017, 88, 49–55. [Google Scholar] [CrossRef]
- Exton, J. Phosphatidylcholine breakdown and signal transduction. Biochim. Biophys. Acta 1994, 1212, 26–42. [Google Scholar] [CrossRef]
- Kashchiev, D.; Exerowa, D. Bilayer lipid membrane permeation and rupture due to hole formation. Biochim. Biophys. Acta 1983, 732, 133–145. [Google Scholar] [CrossRef]
- DeCoste, J. Study Finds Merck Millipore’s Strat-M® Synthetic Membrane Comparable to Human and Animal Skin for Permeation Studies. Available online: https://www.merckgroup.com/content/dam/web/corporate/non-images/press-releases/2015/may/en/Strat-M-EN.pdf (accessed on 18 January 2018).


| Processing Method | Sample ID | FAL (mg) | HT (min) | HR (rpm) | ZP ± SD (mV) | Size ± SD (nm) | PDI ± SD | EE ± SD (%) | AR ± SD |
|---|---|---|---|---|---|---|---|---|---|
| hot | 1H | 10 | 5 | 3000 | −86.8 ± 1.5 | 470.5 ± 6.1 | 0.59 ± 0.13 | 3.0 ± 0.05 | 0.7 ± 0.11 |
| hot | 2H | 10 | 5 | 15,000 | −60.9 ± 1.4 | 566.8 ± 39.8 | 0.54 ± 0.03 | 100 ± 0.02 | 0.7 ± 0.13 |
| hot | 3H | 10 | 15 | 3000 | −62.8 ± 0.3 | 590.5 ± 1353 | 0.23 ± 0.02 | 67.0 ± 0.12 | 0.7 ± 0.14 |
| hot | 4H | 10 | 15 | 15,000 | −72.0 ± 0.2 | 552.0 ± 2.4 | 0.20 ± 0.02 | 87.4 ± 0.09 | 0.8 ± 0.10 |
| hot | 5H | 100 | 5 | 3000 | −50.4 ± 2.4 | 1035 ± 21.9 | 0.58 ± 0.28 | 10.6 ± 0.12 | 0.8 ± 0.12 |
| hot | 6H | 100 | 5 | 15,000 | −55.5 ± 1.0 | 1208 ± 94.8 | 0.20 ± 0.14 | 22.2 ± 0.12 | 0.7 ± 0.14 |
| hot | 7H | 100 | 15 | 3000 | −54.3 ± 0.6 | 1119 ± 87.4 | 0.44 ± 0.17 | 49.0 ± 0.06 | 0.8 ± 0.12 |
| hot | 8H | 100 | 15 | 15,000 | −54.9 ± 0.8 | 929.8 ± 25.1 | 0.52 ± 0.16 | 6.2 ± 0.01 | 0.7 ± 0.10 |
| cold | 1C | 10 | 5 | 3000 | −84.8 ± 1.5 | 885.3 ± 89.3 | 0.51 ± 0.35 | 79.6 ± 0.13 | 0.8 ± 0.14 |
| cold | 2C | 10 | 5 | 15,000 | −71.4 ± 0.5 | 561.0 ± 15.75 | 0.21 ± 0.14 | 91.4 ± 0.01 | 0.7 ± 0.11 |
| cold | 3C | 10 | 15 | 3000 | −63.7 ± 1.0 | 501.5 ± 16.41 | 0.52 ± 0.04 | 17.9 ± 0.05 | 0.7 ± 0.16 |
| cold | 4C | 10 | 15 | 15,000 | −72.1 ± 0.9 | 445.3 ± 9.2 | 0.39 ± 0.08 | 100 ± 0.01 | 0.8 ± 0.09 |
| cold | 5C | 100 | 5 | 3000 | −46.3 ± 0.7 | 579.3 ± 9.7 | 0.42 ± 0.12 | 8.4 ± 0.09 | 0.7 ± 0.18 |
| cold | 6C | 100 | 5 | 15,000 | −52.2 ± 0.9 | 612.7 ± 11.8 | 0.31 ± 0.11 | 6.3 ± 0.01 | 0.7 ± 0.13 |
| cold | 7C | 100 | 15 | 3000 | −62.9 ± 0.7 | 653.4 ± 9.2 | 0.53 ± 0.09 | 5.5 ± 0.01 | 0.7 ± 0.12 |
| cold | 8C | 100 | 15 | 15,000 | −54.6 ± 1.3 | 778.6 ± 31.6 | 0.26 ± 0.22 | 0 ± 0.00 | 0.7 ± 0.14 |
| Parameter | pH 6.2 Cel-mem, F | pH 7.4 Cel-mem, F | pH 7.4 Strat-M-mem, F | pH 7.4 Strat-M-mem, E |
|---|---|---|---|---|
| Diffusion Coefficient D (cm2/s) | 0.068 | 0.034 | 0.037 | 0.044 |
| Lag Time (h) | 0 | 0.76 | 1.94 | 1.96 |
| Flux (mg·h/ cm2) | 0.77 | 0.28 | 0.27 | 0.35 |
© 2019 by the authors. Licensee MDPI, Basel, Switzerland. This article is an open access article distributed under the terms and conditions of the Creative Commons Attribution (CC BY) license (http://creativecommons.org/licenses/by/4.0/).
Share and Cite
Londoño, C.A.; Rojas, J.; Yarce, C.J.; Salamanca, C.H. Design of Prototype Formulations for In Vitro Dermal Delivery of the Natural Antioxidant Ferulic Acid Based on Ethosomal Colloidal Systems. Cosmetics 2019, 6, 5. https://doi.org/10.3390/cosmetics6010005
Londoño CA, Rojas J, Yarce CJ, Salamanca CH. Design of Prototype Formulations for In Vitro Dermal Delivery of the Natural Antioxidant Ferulic Acid Based on Ethosomal Colloidal Systems. Cosmetics. 2019; 6(1):5. https://doi.org/10.3390/cosmetics6010005
Chicago/Turabian StyleLondoño, Cesar A., John Rojas, Cristhian J. Yarce, and Constain H. Salamanca. 2019. "Design of Prototype Formulations for In Vitro Dermal Delivery of the Natural Antioxidant Ferulic Acid Based on Ethosomal Colloidal Systems" Cosmetics 6, no. 1: 5. https://doi.org/10.3390/cosmetics6010005
APA StyleLondoño, C. A., Rojas, J., Yarce, C. J., & Salamanca, C. H. (2019). Design of Prototype Formulations for In Vitro Dermal Delivery of the Natural Antioxidant Ferulic Acid Based on Ethosomal Colloidal Systems. Cosmetics, 6(1), 5. https://doi.org/10.3390/cosmetics6010005