Abstract
Bacterial cellulose (BC) has become of great interest in recent years, as a delivery system in several areas of application, including food, drugs, and cosmetics, thanks to its exclusive advantages, such as high biocompatibility, water holding capacity, and good gas permeability. The novel approach of the authors has led to a protocol for checking the quality and safety of bacterial cellulose matrices in the manufacture of cosmetic masks. Two non-destructive techniques, near-infrared spectroscopy (NIR) and multiple light scattering (MLS), were used to verify different parameters affecting the quality of BC sheets, allowing cellulose masks to be checked over time. NIR spectroscopy allowed for discovering changes in the water content, depending on filling/packaging procedures, like flat-folding. Multiple light scattering was used to ascertain the stability of solutions in contact with masks. From a clinical standpoint, the cutaneous tolerability of biocellulose masks, and their effect on skin parameters, were evaluated through some specific “in vivo” tests. Also, a safety evaluation during application was conducted through different studies: a short-term one after single application, and a long-term one upon continued use.
1. Introduction
Cellulose is one of the most abundant biodegradable materials in nature. Currently, cellulose can be produced in different ways, all by natural synthesis procedures, plant photosynthesis, microbial synthesis, and synthetic methods [1].
Microbial cellulose (or bacterial cellulose, BC) is produced by various species of bacteria, such as Gluconacetobacter xylinus, in the presence of oxygen and glucose. Since 1886, Gluconacetobacter xylinus has been used as the model microorganism for different bases and applied studies on cellulose. Microbial cellulose is an exopolysaccharide, a long chain polysaccharide consisting of sugars units, or sugar derivatives, joined by different links (e.g., 1–2 and 1–4). The molecular formula of bacterial cellulose (C6H10O5) is the same as that of plant cellulose, but their physical and chemical features are different [2].
Typically, bacterial cellulose exhibits a basic structure made of microfibrils composed of glucan chains interlocked by hydrogen bonds, so that a crystalline pattern (microfibrils) is obtained. BC possesses a higher purity, crystallinity index, and degree of polymerization in comparison to plant cellulose. Its fibrils are about 100 times thinner (diameter 20–100 nm), such that a very high surface area per unit mass is demonstrated. This feature, combined with its highly hydrophilic nature, results in a very high liquid-loading capacity. Its water-holding capacity (WHC) is over 100 times (by mass) higher than plant cellulose, and the WHC is 100–200 times its dry weight [1,2,3].
The hydrogen bonds between its fibrillar units stabilize the whole structure, and define many of its mechanical properties. Tensile strength, maximum elongation, and elastic modulus, that characterize BC, depend on its own uniform ultrafine-fiber network structure, and the high planar orientation of the ribbon-like fibers, when compressed into sheets, results in good chemical stability [3].
Bacterial cellulose shows great biocompatibility, not only because of its non-toxic effects on biological systems but, also, by eliciting an appropriate host response to ensure satisfactory performance during a specific application. Petersen and Gatenholm have pointed out that biocompatibility of BC for tissue engineering applications can be can be due to structure similarities with extracellular matrix components, such as collagen. In fact, collagen and BC nanofibers have similar diameters (around 100 nm), and are extracellularly assembled from precursor molecules into polymer chains [4].
Due to its unique structural properties, BC has become of interest in different fields, such as in the textile industry, high quality paper production, food, pharmaceutical and medical devices, electronics, and acoustics [1,2]. In particular, the biomedical field exploits microbial cellulose as a natural, porous, nontoxic material in tissue-like products for both wound care and the regeneration of damaged or diseased organs. Due to its unique nanostructure and properties, BC is a natural candidate for numerous medical and tissue-engineered applications, such as wound dressings, bone tissue engineering and bone grafting, and cardiovascular applications [3,4,5]. In wound healing systems, BC has great potential because it is biocompatible, adherent, elastic, and transparent, resulting in good permeability and water absorption capacity. Also, it maintains a moist environment in wounds, absorbing exudates, and shows low solubility and resistance to degradation [1].
Biocompatibility allows for classification of BC among sustainable/renewable sources, thus suitable when developing value-added cosmetic products [6].
It has been claimed that, due to its high water-holding capacity and good gas permeability, BC can be an appropriate carrier for delivering active ingredients to the skin, including moisturizers, whitening ingredients, and anti-wrinkling agents.
In recent years, studies have been developed for the use of BC as a substrate to deliver hydrophilic cosmetic compounds, in order to obtain masks with exfoliating and brightening effect, purifying hot clay masks, and anti-wrinkle patches [7,8,9,10,11,12].
A patented BC facial mask was fabricated with holes for the eyes, mouth, and nose. The author claimed that such a mask may be suitable for repeated or prolonged use for skin beautifying purposes, skin nutrition, and moisturizing and cosmetic effects [11]. An American study describes a method for manufacturing masks from bacterial biocellulose by directly adding extracts of ginseng (known for its antioxidant and anti-inflammatory properties) to the culture broth; results show overall user satisfaction in terms of moist feel and skin elasticity in women aged 30+ years [11].
However, available information about the use of BCs in the cosmetic industry and, also, clinical results, are rather scarce [12].
The production of a safe and stable formulation is one of the more important issues to be addressed by cosmetic and pharmaceutical companies.
Stability evaluation is always crucial for colloidal systems, like emulsions and suspensions. They are intrinsically unstable, and particle migration (sedimentation or creaming) combined with particle aggregation might lead to partial or total separation, or the emulsion breaking. Characterizing these destructive processes and monitoring of stability are, therefore, essential. This is usually obtained through Aging tests, accelerating destabilization to detect potentially unstable formulations. Products are stored under specific conditions (temperature, humidity, light), then organoleptic properties, pH, and viscosity are analyzed. Besides ordinary visual inspections, non-destructive instrumental techniques (NIR and MLS) have been used to investigate the expected stability.
The aim of this paper has been to establish a protocol for the manufacture of BC face masks, and to identify appropriate methods for quality assessment of the finished product, establishing criteria to evaluate their shelf-life, as well.
Finally, specific “in vivo” tests have been designed in order to test such aspects as tolerability, safety, and efficacy of cosmetic formulations, and their effect on many different skin parameters upon application using a BC mask delivery system.
2. Materials and Methods
2.1. Materials
The bacterial cellulose sheets (BCS) used in this study were obtained from two manufacturers; sheets were supplied in stacks (20 sheets) soaked with a preserved water solution (phenoxyethanol 0.075%, iodopropynyl butylcarbamate 0.0015%). Both manufacturers stated that BC had been obtained by incubation of Gluconacetobacter xylinus in a sterile broth at 30 °C, for a period of up to 120 h, at a pH = 6.5–7.0, in static conditions. After partially de-watering the gel, the BC sheet had been die-cut to obtain a mask shape, with holes for eyes, nose, and mouth.
The diameter of the fibers is about 40 nm, so that the ultrafine net of BC has a very smooth network of microfibrils, perfect to fit skin (Figure 1).
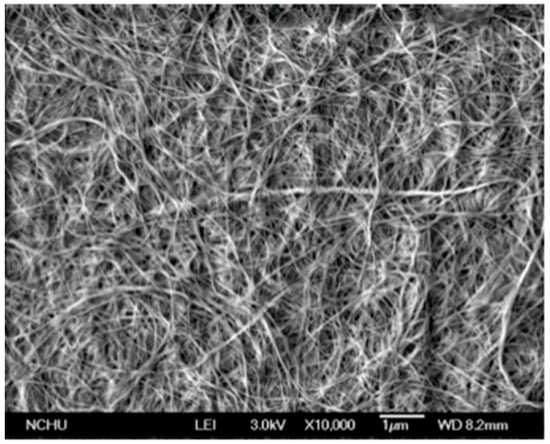
Figure 1.
Fiber structure of bacterial cellulose (BC) observed using scanning electron microscopy at 10,000× magnification.
2.2. Preparation of Face Masks
In this work, placebo masks (PM) were prepared, starting from BCS in the following way: bacterial cellulose sheets (BCS, batch 1603, Supplier 2) were folded, embedded with 15 mL of solution placebo (P) containing water 95.7%, butylene glycol 3%, phenoxyethanol 0.9%, ethylhexylglycerin 0.1%, and xanthan gum 0.3%.
The folded masks were inserted into Polyethylene terephthalate (PET)/aluminum/ Polyethylene (PE) sachets, thermo-sealed, and stored for 1 week at room temperature before analysis.
Figure 2 shows unfolded face placebo masks, as an example.
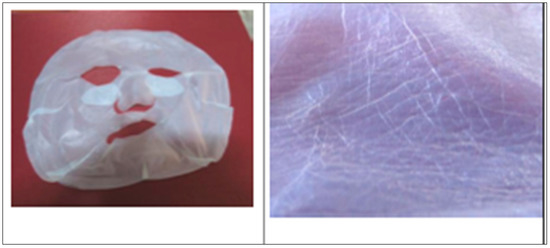
Figure 2.
left: unfolded face placebo mask (PM); right: pattern of microfibrils network.
Table 1 shows all samples investigated in this study.

Table 1.
Bacterial cellulose sheets (BCS) and placebo mask (PM) samples evaluated in the study. Both sheets and masks are face-shaped.
The “in vitro” analyses were performed on
- -
- bacterial cellulose sheets (BCS),
- -
- placebo masks (PM);
- -
- solution P before and after squeezing the masks.
2.3. Stability Testing
For these purposes, two non-destructive techniques, near-infrared spectroscopy (MicroNIR™ Pro Spectrometer, JDSU, Milpitas, CA, USA) and multiple light scattering (MLS, Turbiscan Tower®, Formulaction, Toulouse, France), were used.
2.3.1. Near-Infrared (NIR) Analysis
In recent years, NIR spectroscopy has gained wide acceptance within the pharmaceutical industry for raw material testing, product quality control, and process monitoring. The growing pharmaceutical interest in NIR spectroscopy is probably a direct result of its major advantages over other analytical techniques, namely, an easy sample preparation without any pretreatments, the use of fiber optic probes for measurement of samples far from the spectrometer, and the capacity to predict chemical and physical sample parameters from one single spectrum [13,14].
The combined use of near-infrared (NIR) spectroscopy and multivariate spectral processing chemometric techniques has enabled the development of effective methods for establishing the composition of complex samples with acceptable levels of analytical properties, such as accuracy, precision, and throughput [15]. In this work, we applied principal component analysis (PCA) and global indices (viz., the hydroxyl value), obtained from the NIR spectrum of the sample, to define the limit of acceptability. The models, thus obtained, are accurate enough for use in quality control analyses of cosmetic preparations, and provide an effective alternative to existing conventional global methods [16].
NIR spectroscopy is used as non-destructive mask characterization for two different purposes:
- ✓
- To test the homogeneity of the cellulose sheets, investigating the overall quality of the biocellulose item, and assess/validate the BCS supplier;
- ✓
- To check the manufacturing process of face masks, and use spectroscopy as a quality control tool over time.
Both sheets and masks to be analyzed were extracted from the sachet and completely unfolded, stretched, and laid on the work surface, looking for visible stains or folds. Then, three specific areas to be scanned were selected (the same for all performed analyses) with reference to actual face areas: upper section (corresponding to forehead), median section (cheek), and lower section (chin). For each area, the points analyzed are split between the right and the left, as shown in the Figure 3. The right/left name is referred to the viewer’s point of view, with the sample lying on the work surface.
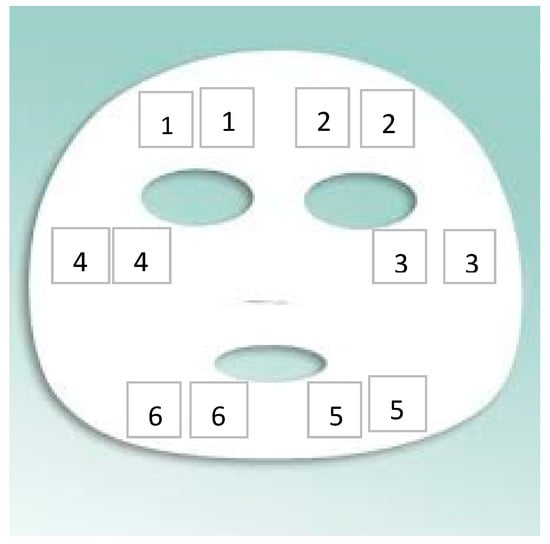
Figure 3.
Different points for NIR analysis. Each sheet has been analyzed in 6 different areas, with 2 replicas for each area.
At least 3 samples from each batch and 3 different batches of sheets and placebo masks were analyzed.
For the NIR spectroscopy, the scanning wavelength was in the range of 950–1650 nm. In this region, each constituent of a complex organic mixture has unique absorption properties, due to the stretching and bending vibrations in molecular bonds [13].
For this analysis, the MicroNIR™ Pro Spectrometer, (JDSU, Milpitas, CA, USA) was used, with parameters reported in Table 2. This technique presents some advantages with respect to other analytical techniques, for example, its ability to record the spectra of solid and liquid samples without prior manipulation. Furthermore, it is simple, rapid, and cost-effective [14,15].
Table 2.
MicroNIR instrument parameters.
Samples were placed on a non-reflective support, with a fixed and constant distance (3 mm) from the acquisition window. Three replicates for each sample were always used, and analyses performed at 21 °C ± 2 °C and 70% RH.
All the analyzed samples were white, and of uniform appearance (visual inspection).
Data were evaluated using the Unscrambler® X software, version 10.4 (Camo software AS, Oslo, Norway). The spectra were pretreated by using standard normal variate (SNV) followed by the first derivative with Savitzky–Golay smoothing. Principal component analysis (PCA), on pretreated spectra, were performed on the obtained spectra.
2.3.2. Multiple Light Scattering (MLS) Analysis
MLS technique allows evaluation of optical characteristics for several formulations, from suspensions or emulsions to nanosystem or microsystem gels [17,18,19]. With the multiple light scattering technique, a macroscopic fingerprint of the sample at a given time is obtained, providing useful information about changes in droplet size, distribution, and appearance of a creaming layer. On a smaller scale, MLS also offers a new approach to predict migration phenomena, like sedimentation and creaming (for emulsion and suspension), and size variation phenomena (like flocculation and aggregation). MLS provides a major advantage over current ageing tests. It is possible (i) to measure the stability of both opaque and concentrated colloidal dispersions with a single instrument; (ii) to detect instability phenomena much earlier and easier than is usually possible through a visual inspection [20].
Other advantages represented by this technique are (i) a short evaluation time when compared to those of usual stability protocols (hours/days instead of weeks/months), (ii) a small sample required (20–30 g); (iii) no dilution nor sample preparation; the instrument works on the product as such.
Destabilization phenomena by multiple light scattering were investigated by Turbiscan Tower® (Formulaction—France). Solutions were transferred in the specific glass vials and they were scanned, each 40 µm, by a pulsed near-infrared light source (λ = 880 nm). The instrument is equipped with two synchronous detectors: the transmission detector receives light through the sample at an angle of 0 degrees from the incident beam; the backscattering detector receives the light scattered by the sample at an angle of 135 degrees from the incident beam. Three different sequences of analyses were established: six hours at 20 °C, six hours at 4 °C and, again, six hours at 20 °C, in order to simulate a thermal shock.
For each cycle of analysis, 181 scans were acquired every 25 s. All samples, before analysis, were kept at room temperature (at 25 °C).
Solutions obtained by squeezing placebo masks, from three different batches manufactured over a period of 12 months, were analyzed using the MLS technique, in order to evaluate the possible interaction between the cellulose matrix and the solution used to soak the biopolymer.
The solutions obtained by mask squeezing and, then, analyzed as reported below:
- -
- P-M 1 (from PM batch BN337, 1 year old),
- -
- P-M 2 (from PM batch BN067, six months old),
- -
- P-M 3 (from PM batch BN252, just produced)
Two parameters were evaluated and compared: transmission variations (ΔT), and Turbiscan stability index (TSI). Only transmission variations over ±10% were considered significant. TSI sums all the variations detected in the sample in terms of size and/or distribution. The higher is the TSI, the worse the stability. Visual evaluation (by image capture) and pH measurements (by pH-meter 827 pH Lab/Metrohm, Italy) were performed before and after Turbiscan cycles.
2.4. In Vivo Testing
2.4.1. Study Design
In order to investigate the safety of the biocellulose masks applied to skin, different in vivo studies have been performed on placebo masks. In particular, short-term effects after single application, and long-term effects after one month of use, were investigated.
In the short-term study, the effect of biocellulose masks was evaluated after one application by measuring the water content before the application (t0), and 2 h (t2), 4 h (t4), and 6 h (t6) after application. A site treated with water was used as reference.
In the long-term study, the safety and effect of biocellulose masks was evaluated after 1 month of application 3 times a week.
Skin parameters investigated in these studies were
- ➢
- Erythema index
- ➢
- Water content of the stratum corneum
- ➢
- Skin barrier integrity
All “in vivo” protocol studies have been carried out according to the Helsinki declaration (Ethical Principles for Medical Research Involving Human Subjects). For both studies, 89 healthy female volunteers were recruited according to the following general inclusion criteria:
- -
- good general health;
- -
- absence of cutaneous diseases;
- -
- people that do not show cutaneous lesions or other lesions in the interested area that could interfere with the study evaluation;
- -
- people that do not present a history of hypersensitivity to the common components of the cosmetic formulations;
- -
- women that are not pregnant nor breastfeeding;
- -
- people that agreed not to undergo other treatments for the entire duration of the test in the treated area;
- -
- subjects that signed the informed consent form and following the common exclusion criteria:
- -
- subjects that did not meet the inclusion criteria above;
- -
- subjects under pharmacological therapy;
- -
- participation in similar study by at least 60 days;
- -
- subjects with no known allergies to any components of the product.
2.4.2. Instrumental Evaluation
The instrumental evaluation was carried out at the beginning of each study, and at predetermined times, depending on the aim of the study. In all cases, the mask was applied 3 times a week, on the cleaned face, and 20 min after it was removed.
All measurements were made in an air-conditioned room with controlled temperature and humidity (T 22 °C, RH 70 ± 5%); subjects were preconditioned in such room for at least 15 min before the measurements.
The instruments used in the evaluation of the skin properties, such as water content, skin barrier integrity, and the erythema index, involve contact between the skin and a series of probes that do not cause discomfort, pain, or damage the skin.
The water content of the stratum corneum, reflecting the hydrating effect of the product, was evaluated by Corneometer CM 825 (Cutometer MPA580, Courage & Khazaka, Cologne, Germany). Corneometry is a technology used to assess the hydration of the outer layer of the epidermis: the stratum corneum [21]. Since skin is a dielectric medium, all variations in hydration result in corresponding changes in the skin capacity [22]. The device used in our trial was equipped with a 49 mm2 surface probe that allows precise measurements in 1 s within a 10–20 μm depth range in the stratum corneum. The parameters were expressed as an arbitrary score scale (0–100 A.U.).
The assessment of skin barrier integrity, and the possible occlusive effect caused by the use of the product object of this study, have been performed by a Tewameter TM 300 (Cutometer MPA580, Courage & Khazaka, Cologne, Germany) [22,23]. Transepidermal water loss (TEWL) is assessed in terms of g/m2h by a skin evaporimeter made of a small cylindrical open chamber (1 cm in diameter, 2 cm in height) with a couple of hygrometric sensors connected to a microprocessor plugged into a computer workstation. The device allows recording of TEWL values (ranging from 0 to 90 g/m2h), as well as the relative humidity (ranging from 0 to 100%) and the probe temperature.
The erythema index (EI) was assessed using a reflectance spectrophotometer (Mexameter MX 18, Courage & Khazaka, Cologne, Germany).
2.4.3. Statistical Analysis
All data obtained were processed as both a descriptive statistical analysis, and as a paired t-test. A significance level of 5% was chosen, so changes were considered statistically significant for p < 0.05.
3. Results and Discussion
3.1. Quality Check by NIR
3.1.1. Quality Test on Bacterial Cellulose Sheets (BCS)
The studies performed on bacterial cellulose sheets (BCS) had different purposes: the first was to evaluate the homogeneity of the biopolymer in all checked areas of the sheet; the second was to ascertain the reproducibility among sheets from the same batch and from different batches.
To assess the quality and the homogeneity of the biopolymer, 28 bacterial cellulose sheets coming from the same supplier were analyzed; 3 areas for each matrix were analyzed in duplicate.
Data obtained from NIR analysis were pretreated and then evaluated using principal component analysis (PCA). Figure 4 shows the results obtained on BCS coming from Supplier 1.
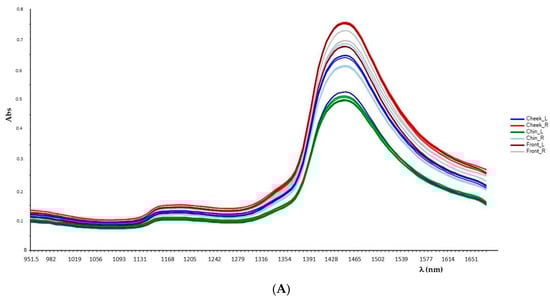
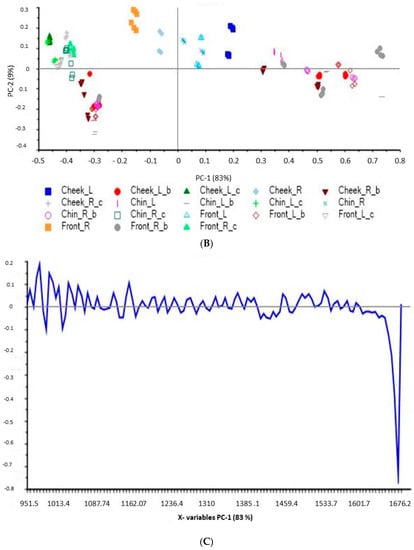
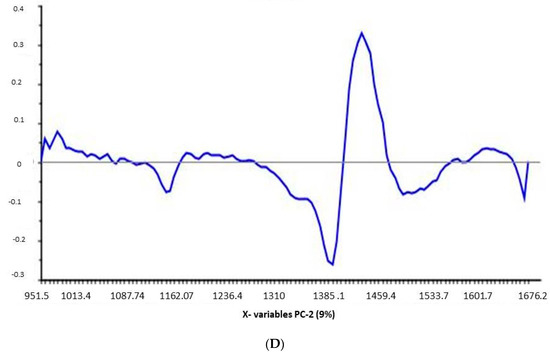
Figure 4.
NIR spectra and mathematical elaboration of the 6 areas analyzed for each of 28 sheets: R, right; L, left (A) NIR spectra data expressed as a mean value (all sheets, all analyzed areas), (B) PCA plot and (C) loadings plot for PC1, (D) loadings plot for PC2 for BCS coming from Supplier 1.
The results highlighted a great variability among the different zones analyzed in the sheets. As shown in Figure 4B (PCA plot), some changes in the biopolymer structure of all analyzed areas occurred, though to a different extent. This greater variability (83%) is expressed along the PC1 axis, as shown in the PCA plot. This is confirmed by the loadings plot specific for PC1 (Figure 4C), in which a characteristic peak at 1676 cm−1, corresponding to OH and CH overtone peak, seems to be the responsible for this variation. This peak can be related to the cellulose structure. Also, the characteristic peak of water around 1450 cm−1, in the loading plot specific for component 2 in the PCA plot, indicates that a different distribution of water occurs among cellulose zones. The reproducibility among different batches of BCS was tested by analyzing at least 3 different batches for each supplier; 5 matrices for each batch were evaluated in triplicate.
Hereafter are reported PCA analyses of matrices coming from the two suppliers (Figure 5).
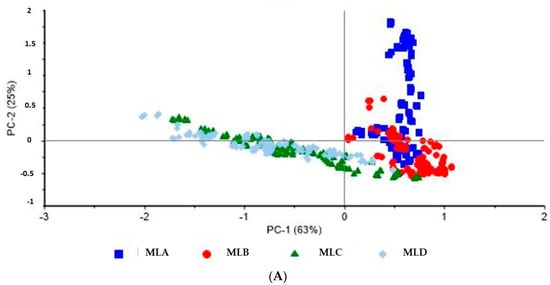
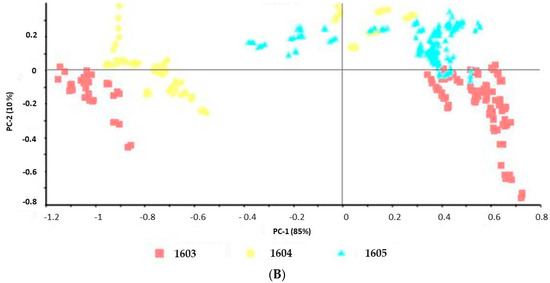
Figure 5.
PCA plots of NIR spectra of BCS different batches coming from (A) Supplier 1 and (B) Supplier 2.
PCA plots indicate that the variability of batches coming from Supplier 2 depends quite exclusively on only one variable (PC1 of about 85%), probably a different distribution of water among matrices; on the contrary, at least two variables are involved in the variability among sheets from Supplier 1. In fact, in this case, PC1 is only 63%. For this reason, only matrices coming from Supplier 2 have been further investigated and used to prepare placebo masks.
Finally, in order to understand the cause of the variability found analyzing BC sheets from the same batch, 4 selected sheets from each of three batches (Supplier 2) were evaluated, picked from the original packages as follows:
- 1604_1: first sheet on top of the stack
- 1604_2 & 1604_3: sheets from the center of the stack
- 1604_4: last sheet from the bottom.
Hereafter, PCA and loading graphs are reported.
The results show very clearly that the first one sheet from the top (1604_1) is different from the others (Figure 6A). The loading plot (Figure 6B) indicates that the same peaks, at around 1676 cm−1 and 1450 cm−1, are responsible for this difference. This is probably due to a non-homogeneous distribution of the aqueous solution used for soaking BC sheets, also provoking a different stretching of the cellulose molecule OH, responsible for the hydrogen bond with water. This finding reveals that a suitable storage protocol must be applied by manufacturers, before releasing every batch product, to allow a thorough soaking process.
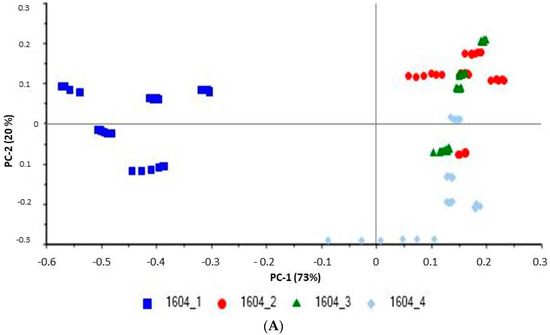
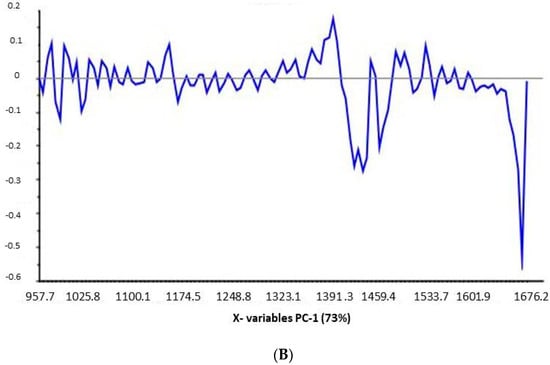
Figure 6.
Mathematical elaboration of NIR spectra: (A) PCA plot and (B) loadings plot for PC1 for BCS coming from Supplier 2.
3.1.2. Quality Testing on Placebo Masks (PM)
The maximum wavelength of all recorded spectra values was 1453.2 cm–1, for placebo masks manufactured with BC Sheets (from Supplier 2), as shown in Figure 7A,B. This wavelength has eventually been used to check the quality and homogeneity of samples. A correlation coefficient (95%) between each spectrum was taken as a threshold for the acceptance of batches, as suggested by the European Medicines Evaluation Agency (EMEA) notes of guidance for NIR applications in industrial processes [24]. Samples were considered to conform if they had a maximum absorption within the range mean ±95%. All samples tested showed acceptable values, according to this principle.
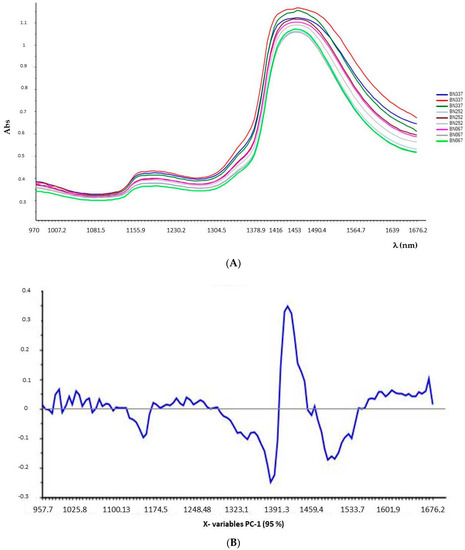
Figure 7.
NIR spectra and mathematical elaboration of placebo masks (PM) produced using BCS coming from Supplier 2: (A) NIR spectra and (B) loadings plot for PC1.
In conclusion, NIR spectroscopy has proven successful, whenever used to check the homogeneity of placebo masks by monitoring the water absorption peak. Probably, the same approach could be used to check the quality of BC masks containing hydrophilic (water-soluble) actives; in such cases, the presence of substances dissolved in water will change the water absorption peak, proportionally with the concentration of the actives.
Changes are always observed, probably due to the folding process and/or the positioning of sachets inside the outer packaging when stored; however, these changes seem to be not significant enough to affect the moisture distribution through the entire BC sheet. There were no areas showing a significant decrease in water content (graph would show such a behavior, with PCAs seen as points distributed at a considerable distance from the average value).
The loading plots were extremely similar among masks from the same type: this also shows that variability in the three different areas of the mask (forehead, cheek, chin) follows the same pattern.
3.2. Stability Evaluation by Multiple Light Scattering
Several variables could influence the stability of solutions embedding masks, such as the interaction between substrate (cellulose matrix) and solution ingredients (rheology modifiers, preservatives). In this study, placebo solutions from masks belonging to three different batches (obtained as described in Section 2.3.2) were characterized, in order to predict sample stability due to possible interaction between biopolymer matrix and solution constituents. The results showed a large difference in terms of physical stability of samples, directly related to the masks’ date of manufacture. Figure 8 shows transmission profile (ΔT) of batch P-M 1, the oldest batch manufactured (twelve months before the analysis).
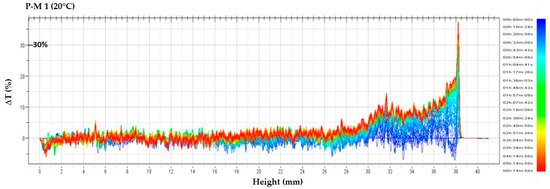
Figure 8.
Transmission profiles of P-M 1.
The transmission profile revealed that some aggregation occurred on the surface of the sample, though not detectable by visual inspection. This could clearly be seen as the result of an interaction over time between the cellulose polymer and the placebo solution, probably leading to an extraction of some matrix molecules. This hypothesis was confirmed by a pH measurement of the solution. A pH value of 6.77 for P-M 1 solution, was higher than those observed for P-M 2 and P-M 3, two batches that maintained their pH value (5.12 and 4.94 respectively).
In Figure 9 transmission profiles (ΔT) of batches P-M 2 and P-M 3 are reported, and measurements were made at different temperatures (20 °C, then 4 °C and, finally, 20 °C again).
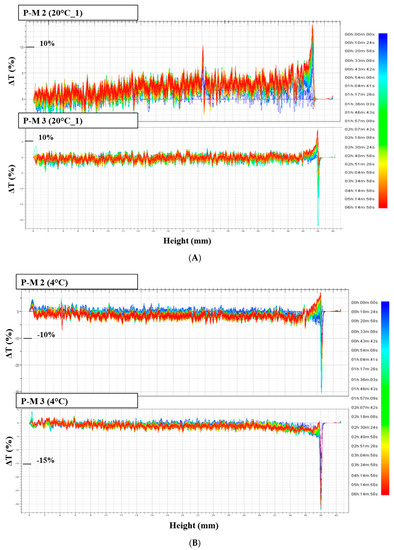
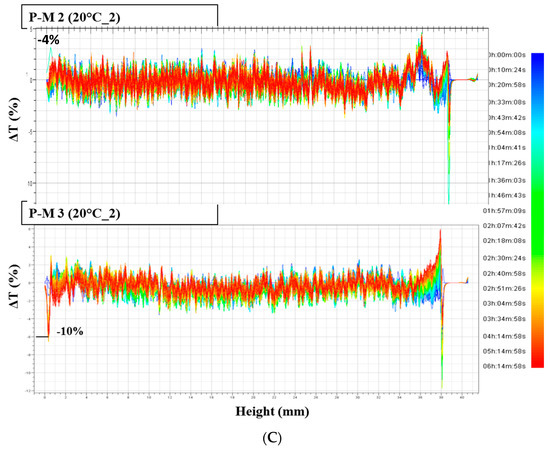
Figure 9.
Transmission profiles of P-M 2 and P-M 3: (A) after one cycle at 20 °C; (B) after one cycle at 4 °C; (C) after the second cycle at 20 °C.
As it is possible to observe in Figure 9. After one cycle at 20 °C, that the solutions showed an irregular transmission profile in the range ±5%, probably due to the air bubbles and light foam, formed when masks were squeezed to extract the sample solution.
No significant negative peak, corresponding to possible sedimentation, was observed. For each sample, comparable profiles were obtained after the second and third analysis (4 °C and 20 °C): transmission variations were in an acceptable range, ±10%. As reported in the literature, the transmission variation permits breaking phenomena to be detected at a very early stage in non-absorbing concentrated dispersions. In particular, the instrument detects these phenomena at least 4 times earlier than the naked eye for dilute emulsions (about 5%), and more than 20 times earlier for concentrated ones (>20%) [20].
These data confirmed that thermal shock did not cause aggregation or flocculation phenomena for both batches (P-M 2 and P-M 3), their respective values being very similar.
Table 3 shows the Turbiscan stability index (TSI), at different times, for all samples tested.
Table 3.
Turbiscan stability index (TSI)—solutions squeezed out of the masks.
It seems obvious that batch P-M 3, the last one manufactured, showed the lowest values at all readings. As a rule, TSI index increases with ageing of batches, indicating that stability is worsening over time.
3.3. In Vivo Testing
The in vivo tests aimed at verifying the tolerability of bacterial cellulose masks when applied onto the skin, allowing a novel approach for the release/delivery of actives, particularly small molecules and hydrophilic substances.
Some studies were conducted to evaluate the effect of this membranes on the skin [25,26,27,28]. Amnuaikit et al. 2011 concluded that cellulose masks obtained from A. xylinum could be used as a natural cosmetic product, in order to increase moisture uptake in the skin. However, no other skin characteristics were deemed to change significantly [25].
Results obtained from this work highlighted that a noticeable hydration effect is attributable to placebo masks (M). Upon a single application, hydration becomes statistically significant after two hours (p = 0.0292*). Control area C (not treated) and W area (treated with water) were used for comparison.
Results are reported in Figure 10A, showing that the cellulose matrix can transfer water to the outermost epidermal layers; this water does not evaporate as quickly as it happens when free water is applied onto the skin.
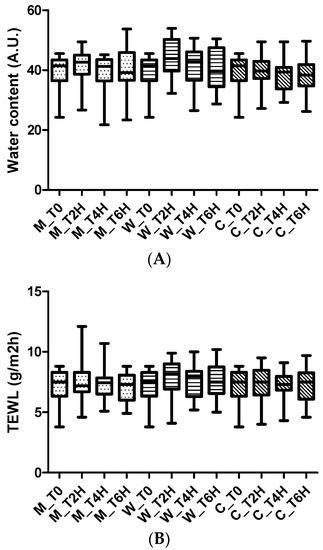
Figure 10.
(A) Water content and (B) transepidermal (TEWL) data obtained in short time analysis after only one application on the following sites: M (placebo mask); W (area treated with water); C (not treated area used as control).
Biocellulose masks seem to be a promising delivery system for releasing active ingredients onto the skin. Transepidermal water loss (TEWL) values confirmed that BC masks were well tolerated, and the integrity of the barrier function was not affected (Figure 10B).
A monthlong clinical evaluation has been performed as part of the present study; it has been of the utmost importance to investigate the interactions between biocellulose masks and skin parameters. In a previous skin compatibility study, Almeida et al. evaluated the skin irritating potential of biocellulose membranes through an occlusion test: conclusions were that this material is very well tolerated [26].
Results obtained at the end of the long-term study confirmed the good tolerability of biocellulose masks. The continued use of the masks did not cause any irritating effects (the change in EI between T0 and T1 is of no importance, accounting for 0.02%, as shown in Figure 11A) while TEWL values were statistically significant, but the values remains within the physiological range (medium TEWL value at T1 is 10.71), (Figure 11B).
Figure 11.
(A) Erythema index (B) TEWL, and (C) water content data obtained from 1 month of continuous application of PM.
As concerning water content, the results showed that PM did not significantly increase the hydration of stratum corneum (Figure 11C).
4. Conclusions
Bacterial cellulose is used, among several applications, for the manufacture of cosmetic masks, with beautifying purposes, to promote skin nutrition and moisture, plus other desirable cosmetics effects.
In order to develop stable, safe, and effective commercial products, it is essential to establish a protocol to check their quality and stability. So far, no methods, nor complete protocols for quality assurance of BC mask, have been published.
In this study, NIR and MLS techniques were applied to bacterial cellulose sheets and masks. These fast and reproducible techniques proved to be suitable methods for quality and stability testing. NIR proved to be able to detect changes in water and ingredients distribution in different areas of the mask, and to ascertain the influence of folding as well. Multiple light scattering was successful to evaluate stability, as well as possible interactions between the formulation and the cellulose matrix, leading to a more precise definition of the expiry date (shelf-life) attributable to these new delivery system.
If one refers to the tested products, the most likely shelf-life period for stable and safe commercially available BC masks would be 6 months.
Erythema index values and TEWL values, obtained during in vivo tests, highlighted the great tolerability of BC masks: skin parameters were not altered upon continued use, no occlusive effect was reported, nor had the skin barrier function been affected.
To summarize, bacterial cellulose may be a promising substrate to develop a new class of cosmetics, able to deliver a large number of hydrophilic/water-soluble substances onto the skin.
Author Contributions
P.P., M.B. and A.C. designed the study. P.P. performed the in vitro experiments, M.B. performed the in vivo experiments. F.C. performed statistical analysis. All authors analyzed the results and wrote the manuscript.
Funding
This research received no external funding.
Acknowledgments
The authors acknowledge Silvio Valle for technical support.
Conflicts of Interest
The authors declare no conflict of interest.
References
- Lina, F.; Yue, Z.; Jin, Z.; Guang, Y. Bacterial Cellulose for Skin Repair Materials, Biomedical Engeneering. In Frontiers and Challenges; Fazel-Rezai, R., Ed.; InTech Publisher: London, UK, 2011; pp. 249–274. ISBN 978-953-307-309-5. [Google Scholar]
- Chawla, P.R.; Bajaj, I.B.; Survase, S.A.; Singhal, R.S. Fermentative Production of Microbial Cellulose. Food Technol. Biotechnol. 2009, 47, 107–124. [Google Scholar]
- Torres, F.G.; Commeaux, S.; Troncoso, O.P. Biocompatibility of Bacterial Cellulose Based Biomaterials. J. Funct. Biomater. 2012, 3, 864–878. [Google Scholar] [CrossRef] [PubMed]
- Petersen, N.; Gatenholm, P. Bacterial cellulose-based materials and medical devices: Current state and perspectives. Appl. Microbiol. Biotechnol. 2011, 91, 1277–1286. [Google Scholar] [CrossRef] [PubMed]
- Czaja, W.K.; Young, D.J.; Kawecki, M.; Brown, R.M., Jr. The future Prospects of Microbial cellulose in Biomedical Applications. Am. Chem. Soc. 2007, 8, 1–2. [Google Scholar] [CrossRef] [PubMed]
- Gallegos, A.M.A.; Carrera, S.H.; Parra, R.; Keshavarz, T.; Iqbal, M.N. Bacterial Cellulose: A sustainable source to develop value-added products—A review. Bioresources 2016, 11, 5641–5655. [Google Scholar] [CrossRef]
- Legendre, J.Y. Assembly Comprising a Substrate Comprising Biocellulose, and a Powdered Cosmetic Composition to Be Brought into Contact with the Substrate. U.S. Patent 2009/0041815, 12 February 2009. [Google Scholar]
- Silva, N.H.C.S.; Drumond, I.; Almeida, I.F.; Costa, P.; Rosado, C.F.; Pascoal Neto, C.; Freire, C.S.R.; Silvestre, A.J.D. Topical caffeine delivery using biocellulose membranes: A potential innovative system for cellulite treatment. Cellulose 2014, 21, 665–674. [Google Scholar] [CrossRef]
- Hasan, N.; Biak, D.R.A.; Kamarudin, S. Application of Bacterial Cellulose (BC) in Natural Facial Scrub. Int. J. Adv. Sci. Eng. Inf. Technol. 2012, 2, 1–4. [Google Scholar] [CrossRef]
- Ullah, H.; Santos, H.A.; Khan, T. Applications of bacterial cellulose bin food, cosmetics and drug delivery. Cellulose 2016, 23, 2291–2314. [Google Scholar] [CrossRef]
- Lee, C.K.; Hsu, K.C.; Cho, J.C.; Kim, Y.J.; Han, S.H. Cosmetic Bio-Cellulose Mask Pack Sheet and Method for Manufacturing Same. U.S. Patent 2013/0244977A1, 19 September 2013. [Google Scholar]
- Pacheco, G.; de Mello, C.V.; Galdorfini Chiari-Andreo, B.; Borges Isaac, V.L.; Lima Ribeiro, S.J.; Pecoraro, E.; Trovatti, E. Bacterial cellulose skin masks—Properties and sensory tests. J. Cosmet. Dermatol. 2017, 17, 840–847. [Google Scholar] [CrossRef] [PubMed]
- Reich, G. Near-infrared spectroscopy and imaging: Basic principles and pharmaceutical applications. Adv. Drug Deliv. Rev. 2005, 57, 1109–1143. [Google Scholar] [CrossRef] [PubMed]
- Roggo, Y.; Chalus, P.; Maurer, L.; Lema-Martinez, C.; Edmond, A.; Jent, N. A review of near infrared spectroscopy and chemometrics in pharmaceutical technologies. J. Pharm. Biomed. Anal. 2007, 44, 683–700. [Google Scholar] [CrossRef] [PubMed]
- U.S. Department of Health and Human Services, Food and Drug Administration. Development and Submission of Near Infrared Analytical Procedures- Guidance for Industry; FDA Office Publisher: Silver Spring, MD, USA, 2015; pp. 1–24. [Google Scholar]
- Blanco, M.; Alcalá, M.; Planells, J.; Mulero, R. Quality control of cosmetic mixtures by NIR spectroscopy. Anal. Bioanal. Chem. 2007, 389, 1577–1583. [Google Scholar] [CrossRef] [PubMed]
- Celia, C.; Trapasso, E.; Cosco, D.; Paolino, D.; Fresta, M. Turbiscan Lab® Expert analysis of the stability of ethosomes® and ultradeformable liposomes containing a bilayer fluidizing agent. Colloids Surf. B Biointerfaces 2009, 72, 155–160. [Google Scholar] [CrossRef] [PubMed]
- Kirilov, P.; Rum, S. Aqueous dispersions of organogel nanoparticles—Potential systems for cosmetic and dermo-cosmetic applications. Int. J. Cosmet. Sci. 2014, 36, 336–346. [Google Scholar] [CrossRef] [PubMed]
- Olejnik, A.; Goscianska, J. Stability determination of the formulations containing hyaluronic acid. Int. J. Cosmet. Sci. 2015, 37, 401–407. [Google Scholar] [CrossRef] [PubMed]
- Mengual, G.; Meunier, I.; Cayre, K.; Puech, P. Snabre, Characterisation of instability of concentrated dispersions by a new optical analyser: The TURBISCAN MA 1000. Colloids Surf. A Physicochem. Eng. Asp. 1999, 152, 111–123. [Google Scholar] [CrossRef]
- Blichman, C.W.; Serup, J. Assessment of skin moisture. Measurement of electrical conductance, capacitance and transepidermal water loss. Acta Dermato-Venereol. 1988, 68, 284. [Google Scholar]
- Lee, C.M.; Maibach, H.I. Bioengineering Analysis of Water Hydration: An Overview. Exog. Dermatol. 2002, 1, 269–275. [Google Scholar] [CrossRef]
- Pinnagoda, J.; Tupkek, R.; Agner, T.; Serup, J. Guidelines for transepidermal water loss (TEWL) measurement. Contact Dermat. 1990, 22, 164–178. [Google Scholar] [CrossRef]
- Guideline on the Use of Near Infrared Spectroscopy (NIRS) by the Pharmaceutical Industry and the Data Requirements for new Submissions and Variations; EMEA/CHMP/CVMP/QWP/17760/2009 Rev2; EMEA Office Publisher, EMEA Office: London, UK, 20 January 2012.
- Amnuaikit, T.; Chusuit, T.; Raknam, P.; Boonme, P. Effects of a cellulose mask synthesized by bacterium on facial skin characteristics and user satisfaction. Med. Devices Evid. Res. 2011, 4, 77–81. [Google Scholar]
- Almeida, I.F.; Pereira, T.; Silva, N.H.C.S.; Gomes, F.P.; Silvestre, A.J.D.; Freire, C.S.R.; Sousa Lobo, J.M.; Costa, P.C. Bacterial cellulose membranes as drug delivery systems: An in vivo skin compatibility study. Eur. J. Pharma. Biopharm. 2014, 86, 332–336. [Google Scholar] [CrossRef] [PubMed]
- Lin, Y.C.; Wey, Y.-C.; Lee, M.-L. Bacterial Cellulose Film and Uses. U.S. Patent 2011/0286948, 24 November 2011. [Google Scholar]
- Lati, E.; Daniel, M.; Durand, C.; Sandager, E.; Monstatier, C. Evaluation of the release of active ingredients from a bio-cellulose mask on support followed by a clinical evaluation of its efficiency in combination with a serum with a depigmentation activity. In Proceedings of the International Federation of Societies of Cosmetic Chemists (IFSCC), Paris, France, 27–30 October 2014. [Google Scholar]
© 2018 by the authors. Licensee MDPI, Basel, Switzerland. This article is an open access article distributed under the terms and conditions of the Creative Commons Attribution (CC BY) license (http://creativecommons.org/licenses/by/4.0/).