A Practical Approach for Social Life Cycle Assessment in the Automotive Industry


Abstract
1. Introduction
1.1. The Status in Research
1.2. The Status in Industry
1.3. Research Needs
- consideration of the entire life cycle of a product,
- priority use of company-specific data in industries with complex, international manufacturing and supplier structures,
- inclusion not only of material but also of energy flows, and
- compatibility of SLCA with LCA and LCC in the context of an LCSA.
- availability and comparability of social data in the context of different, internationally operating companies,
- consideration of social impacts in the use phase of a product, and
- further development of impact assessment.
- analysis and development of social aspects and indicators considering the characteristics of the automotive industry,
- involving stakeholders from the automotive industry in prioritizing and evaluating social aspects, and
- theoretical derivation of social car properties.
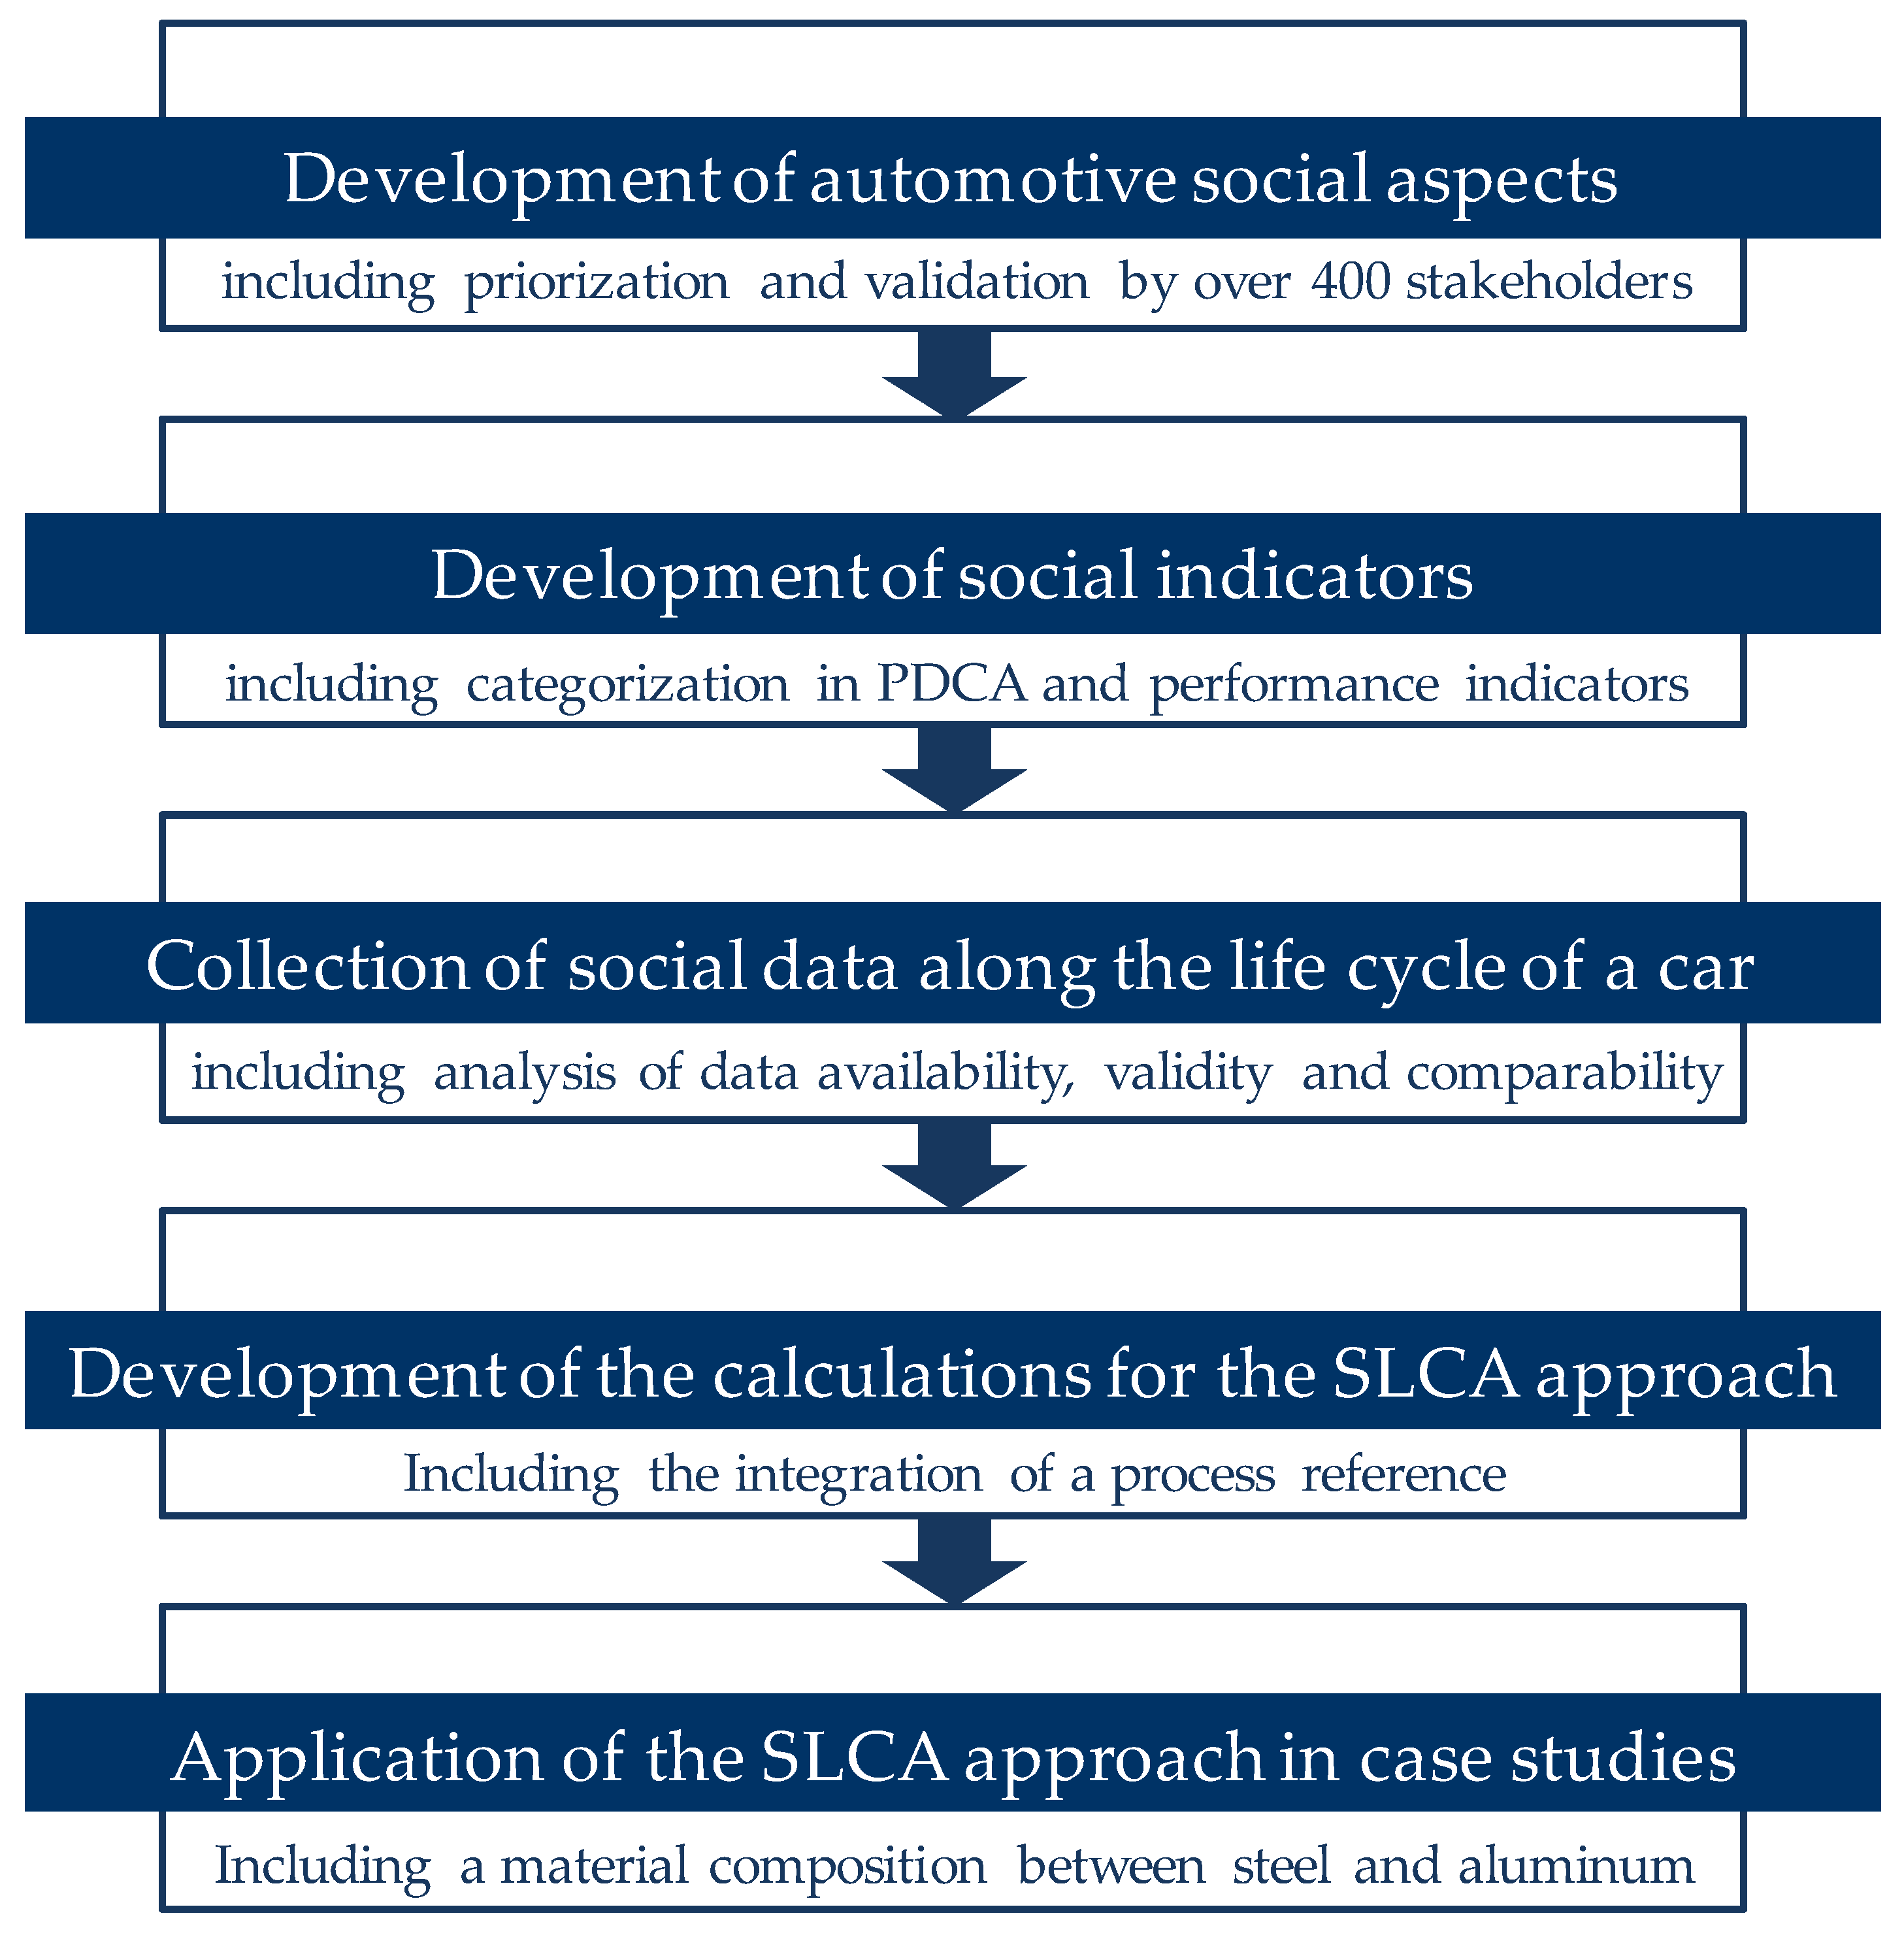
1.4. Objectives of This Paper
2. Materials and Methods
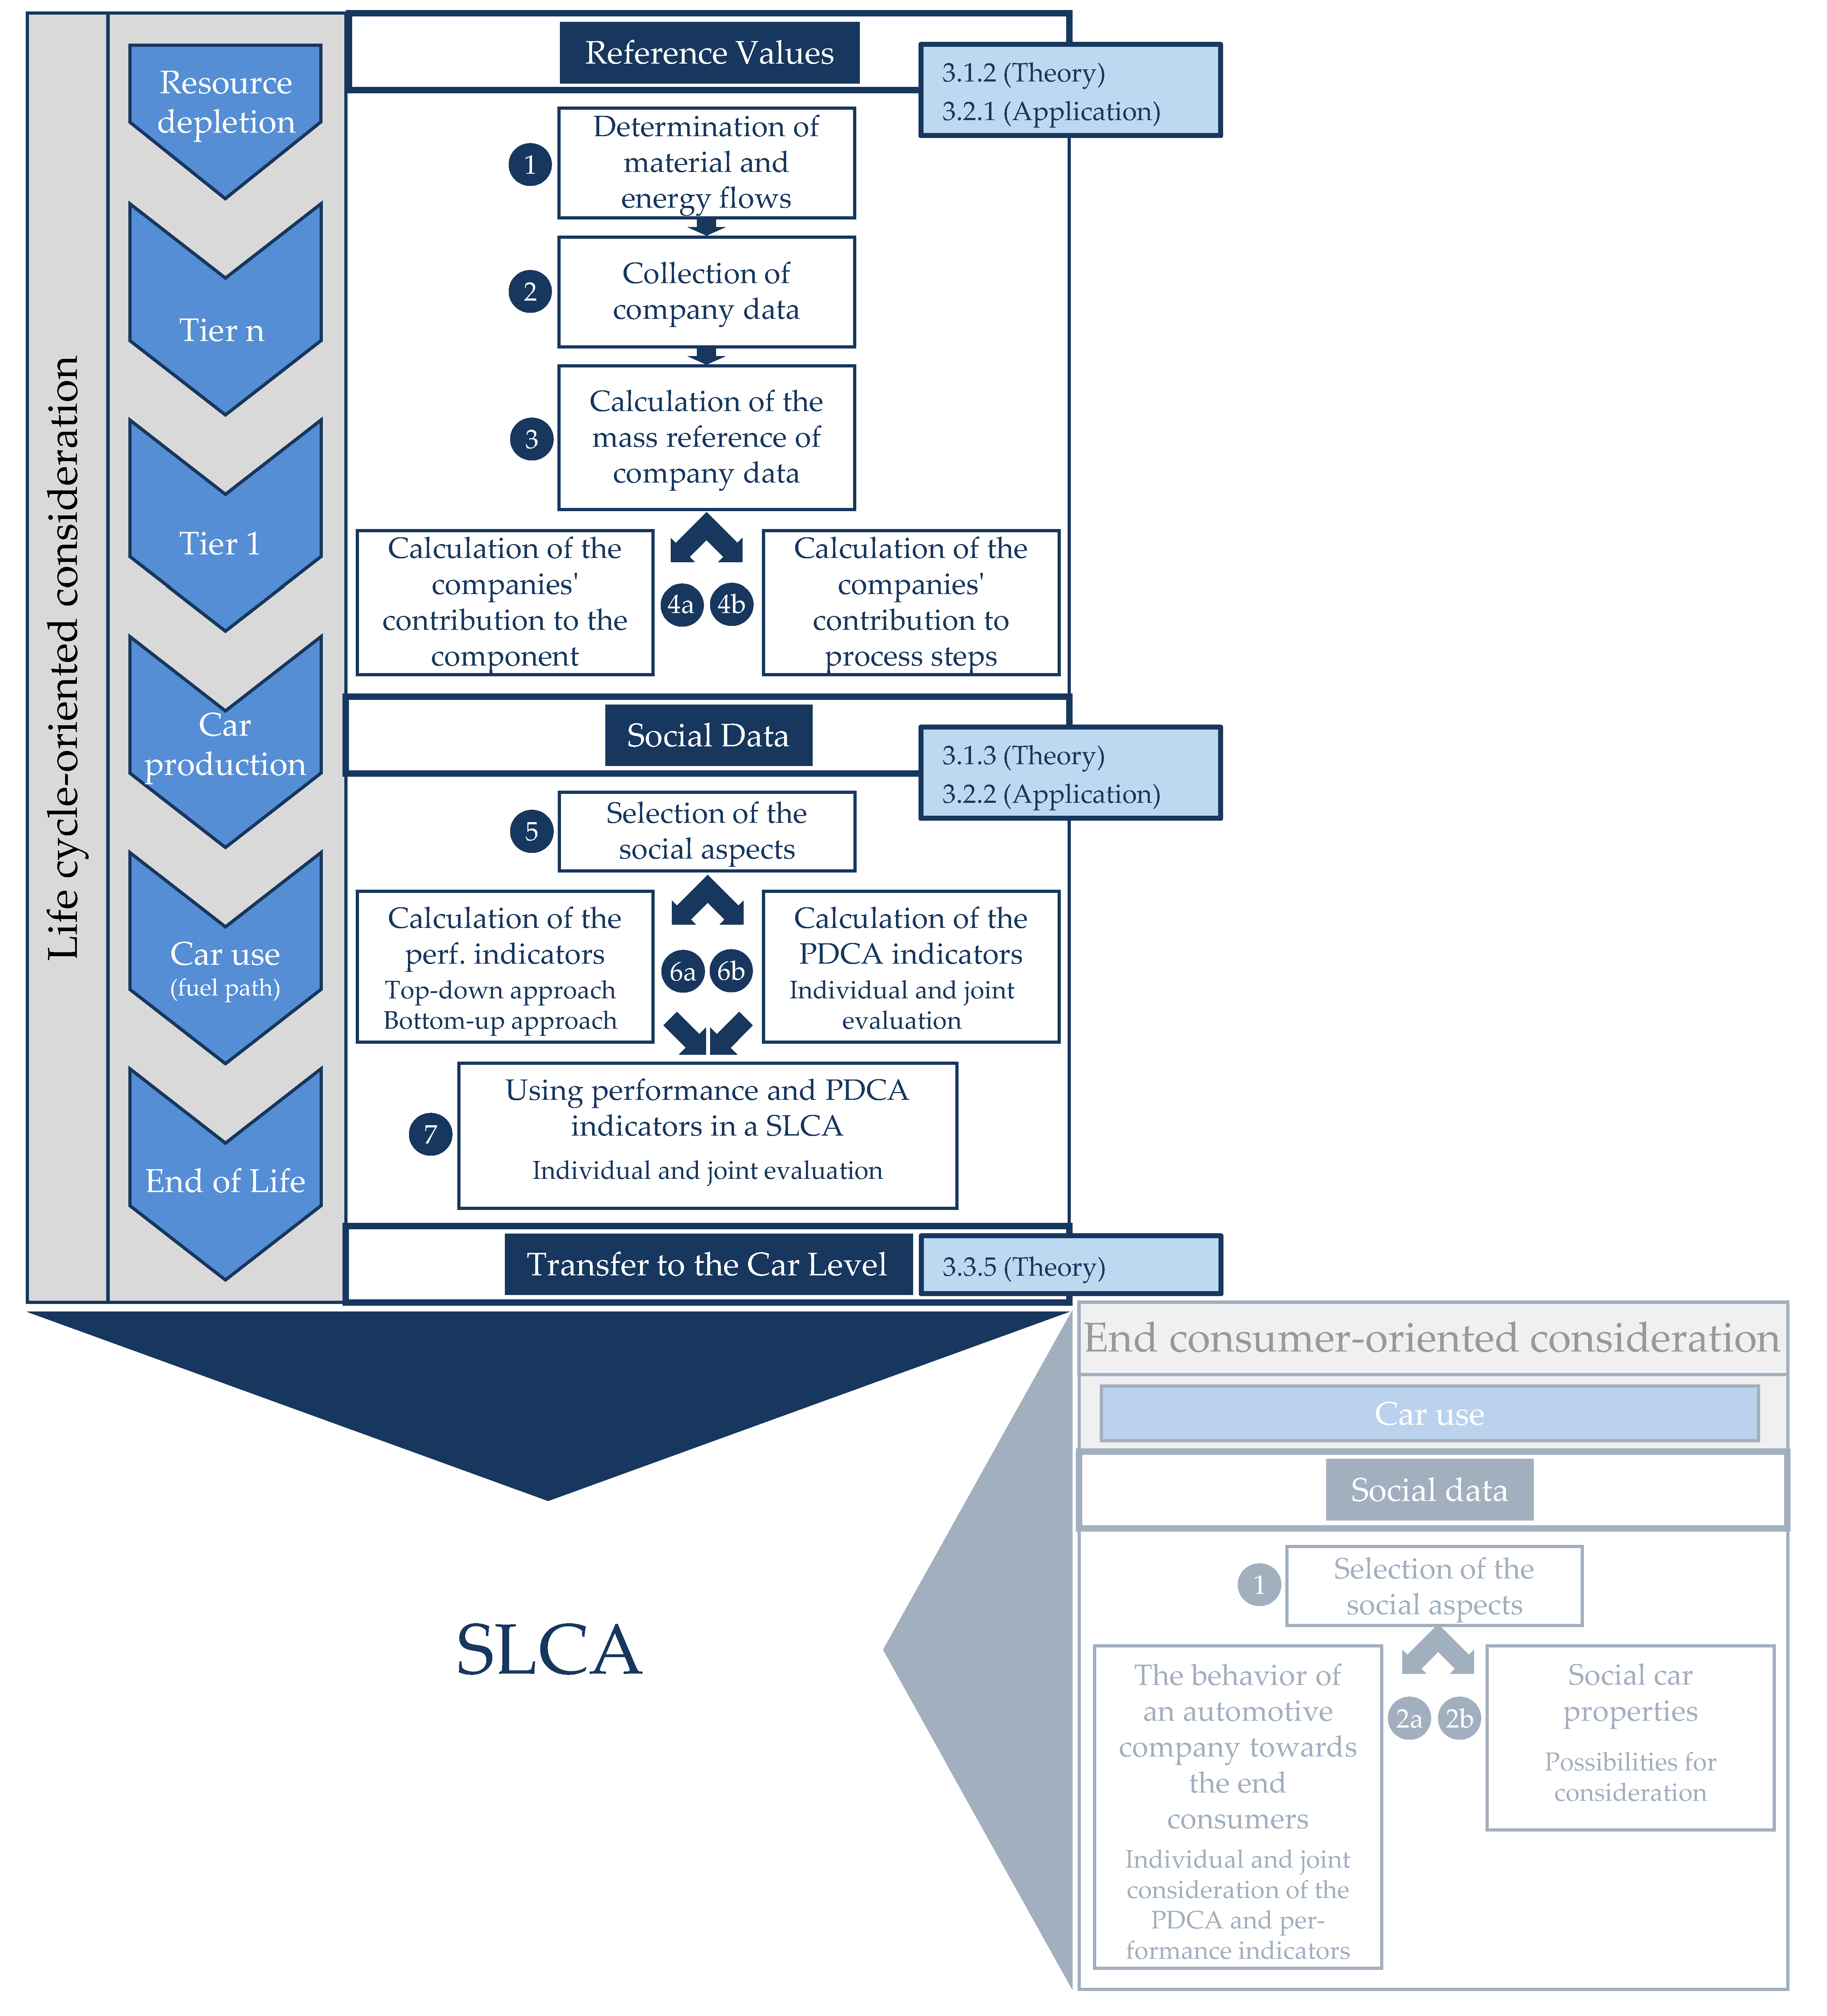
2.1. Practical Approach for SLCA in the Automotive Industry
2.1.1. Collection of Social Data along the Life Cycle of a Car
- Which of the social aspects and indicators are available in the different companies or communicated?
- What are the challenges in data collection?
- considering the entire life cycle of a car,
- covering a large proportion of the materials contained in a car; and
- including materials that have already been the focus of attention in other sectors regarding their social impacts (such as textiles or platinum metals).
2.1.2. Calculation of the Reference Values
2.1.3. Calculations with the Social Data
2.2. Application of the SLCA Approach in Case Studies
3. Results
3.1. Practical Approach for SLCA in the Automotive Industry
3.1.1. Collection of Social Data along the Life Cycle of a Car
- Obtaining data at the process level
- Obtaining location information with company data
- Definition of cut-off-criteria
- Comparability of social data between different companies
- Collection of company-specific social data in the supply chain
- Collection of deviations from legal regulations
- Concerns of companies about the collection of social data
- Effort of companies in completing the data collection form
- Translation of the data collection form
3.1.2. Calculation of the Reference Values
- mass of their products per year and
- number of employees.
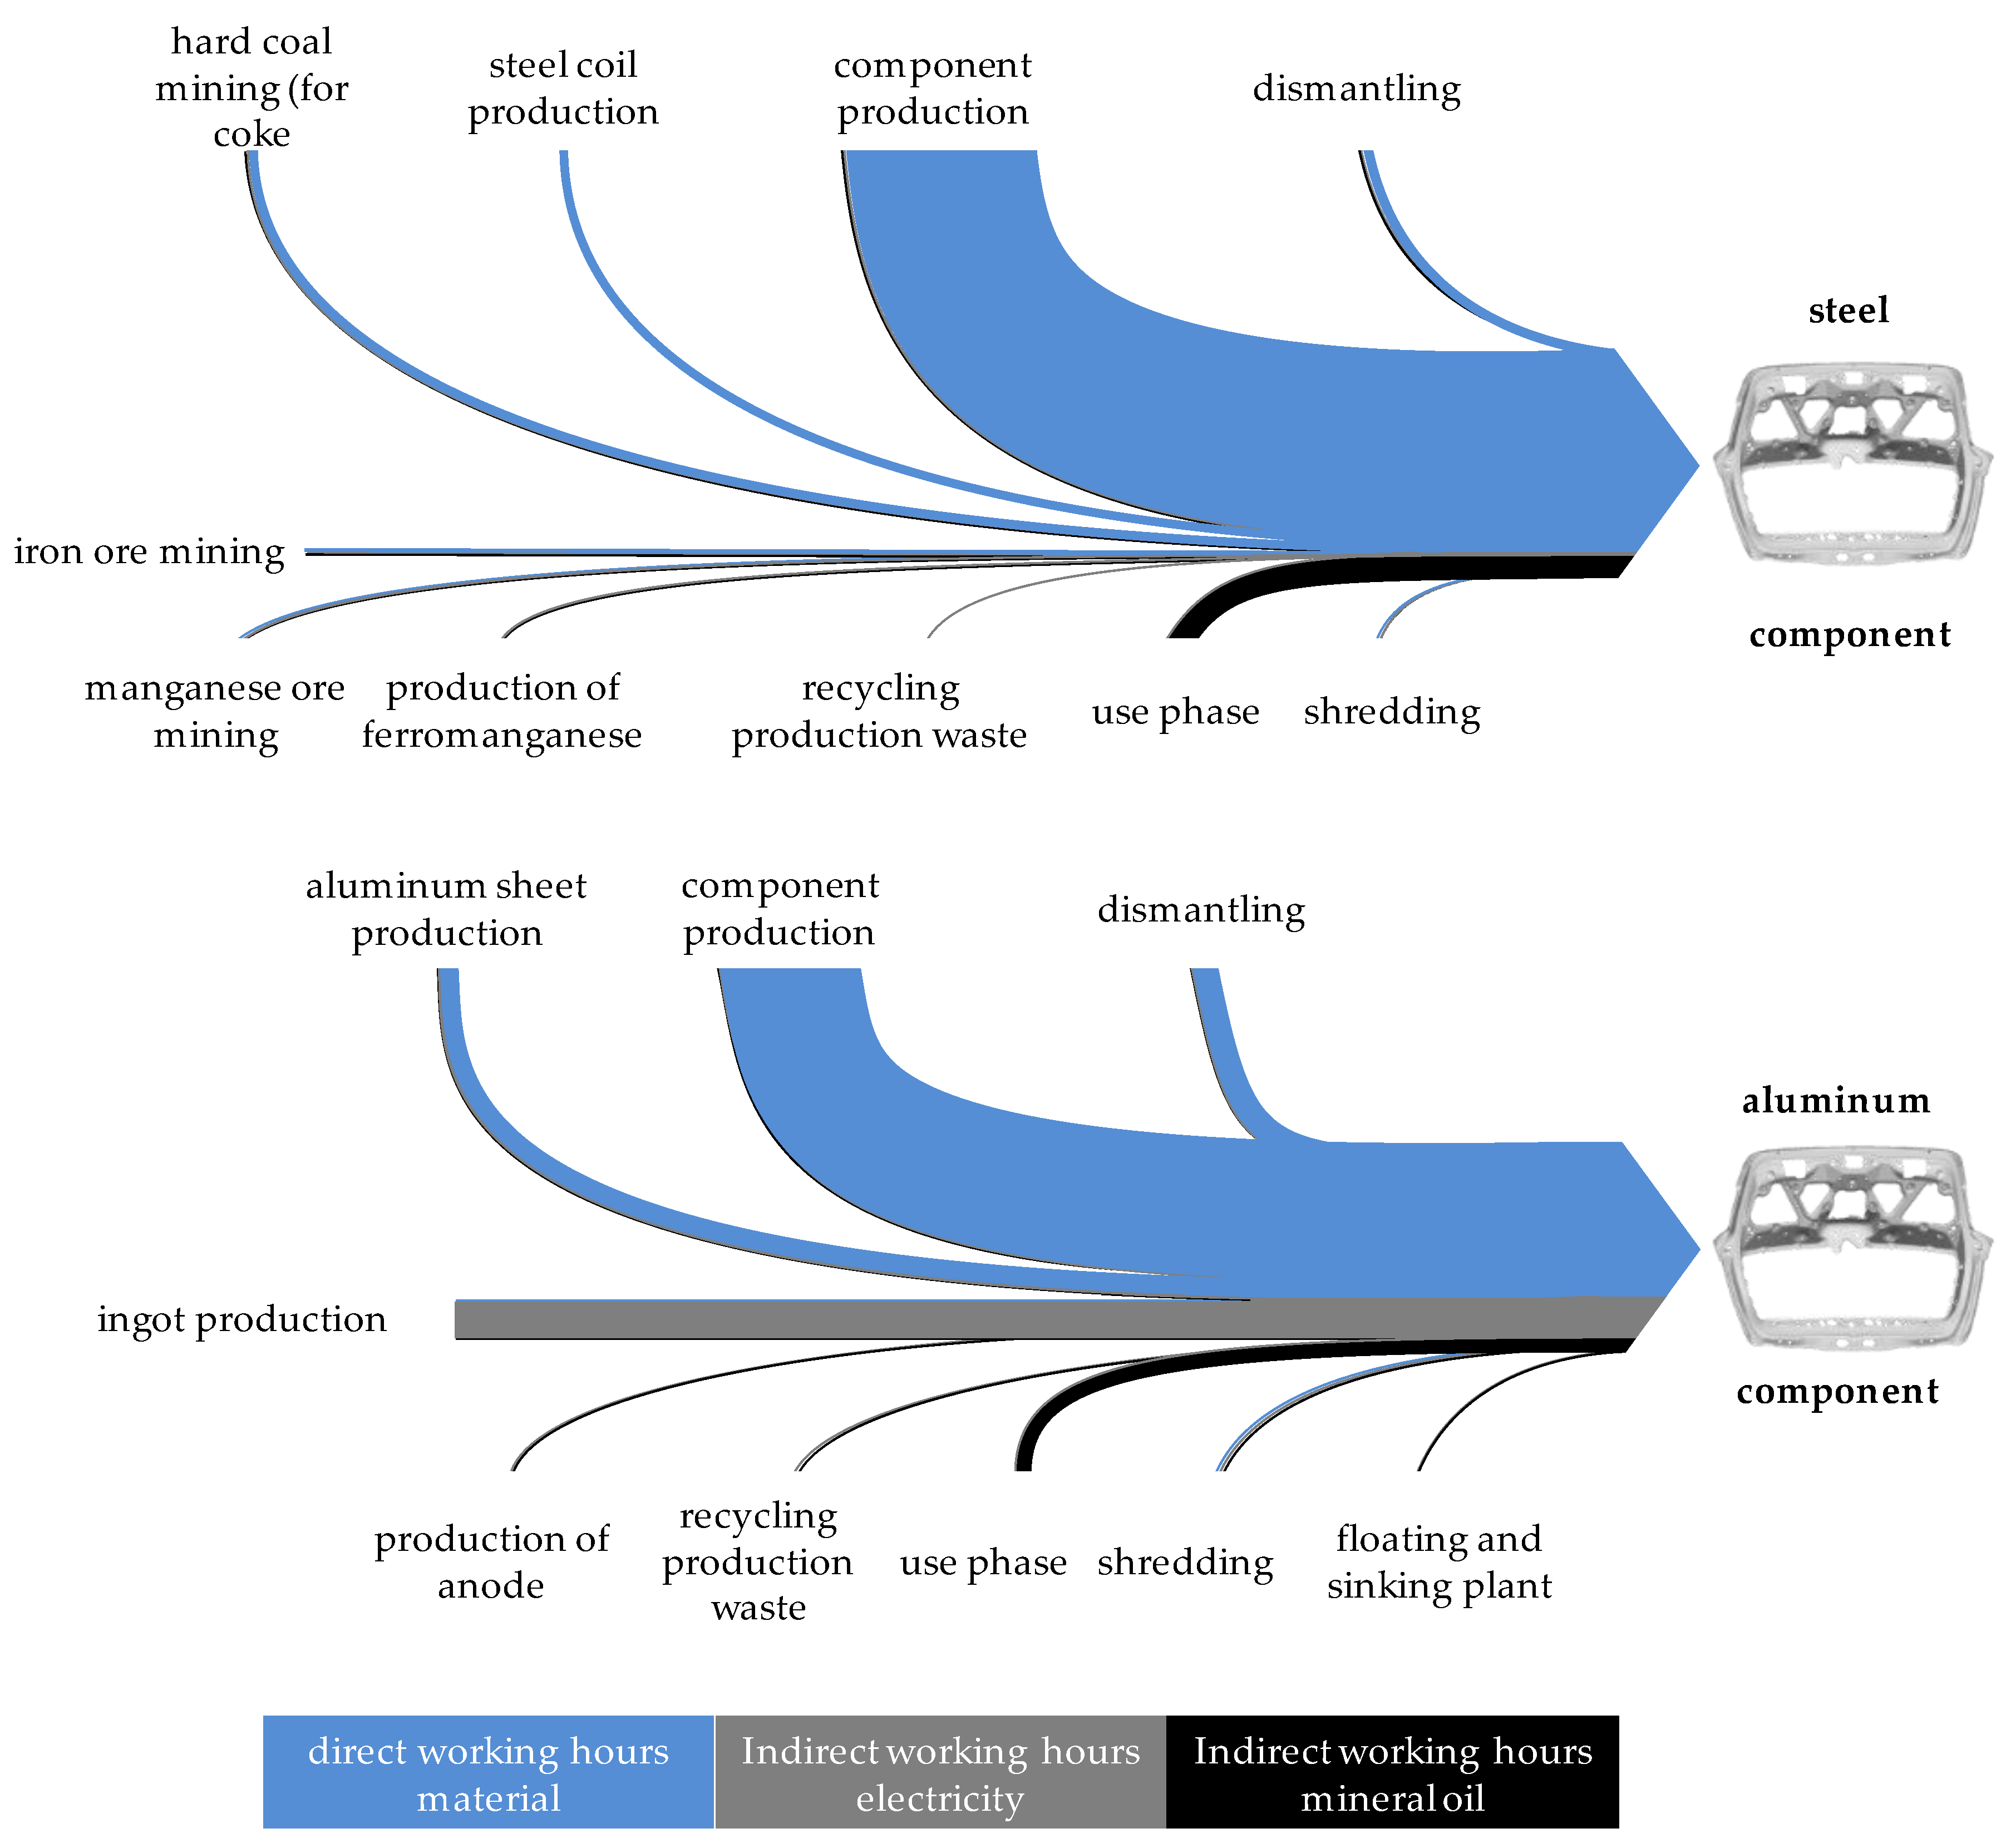
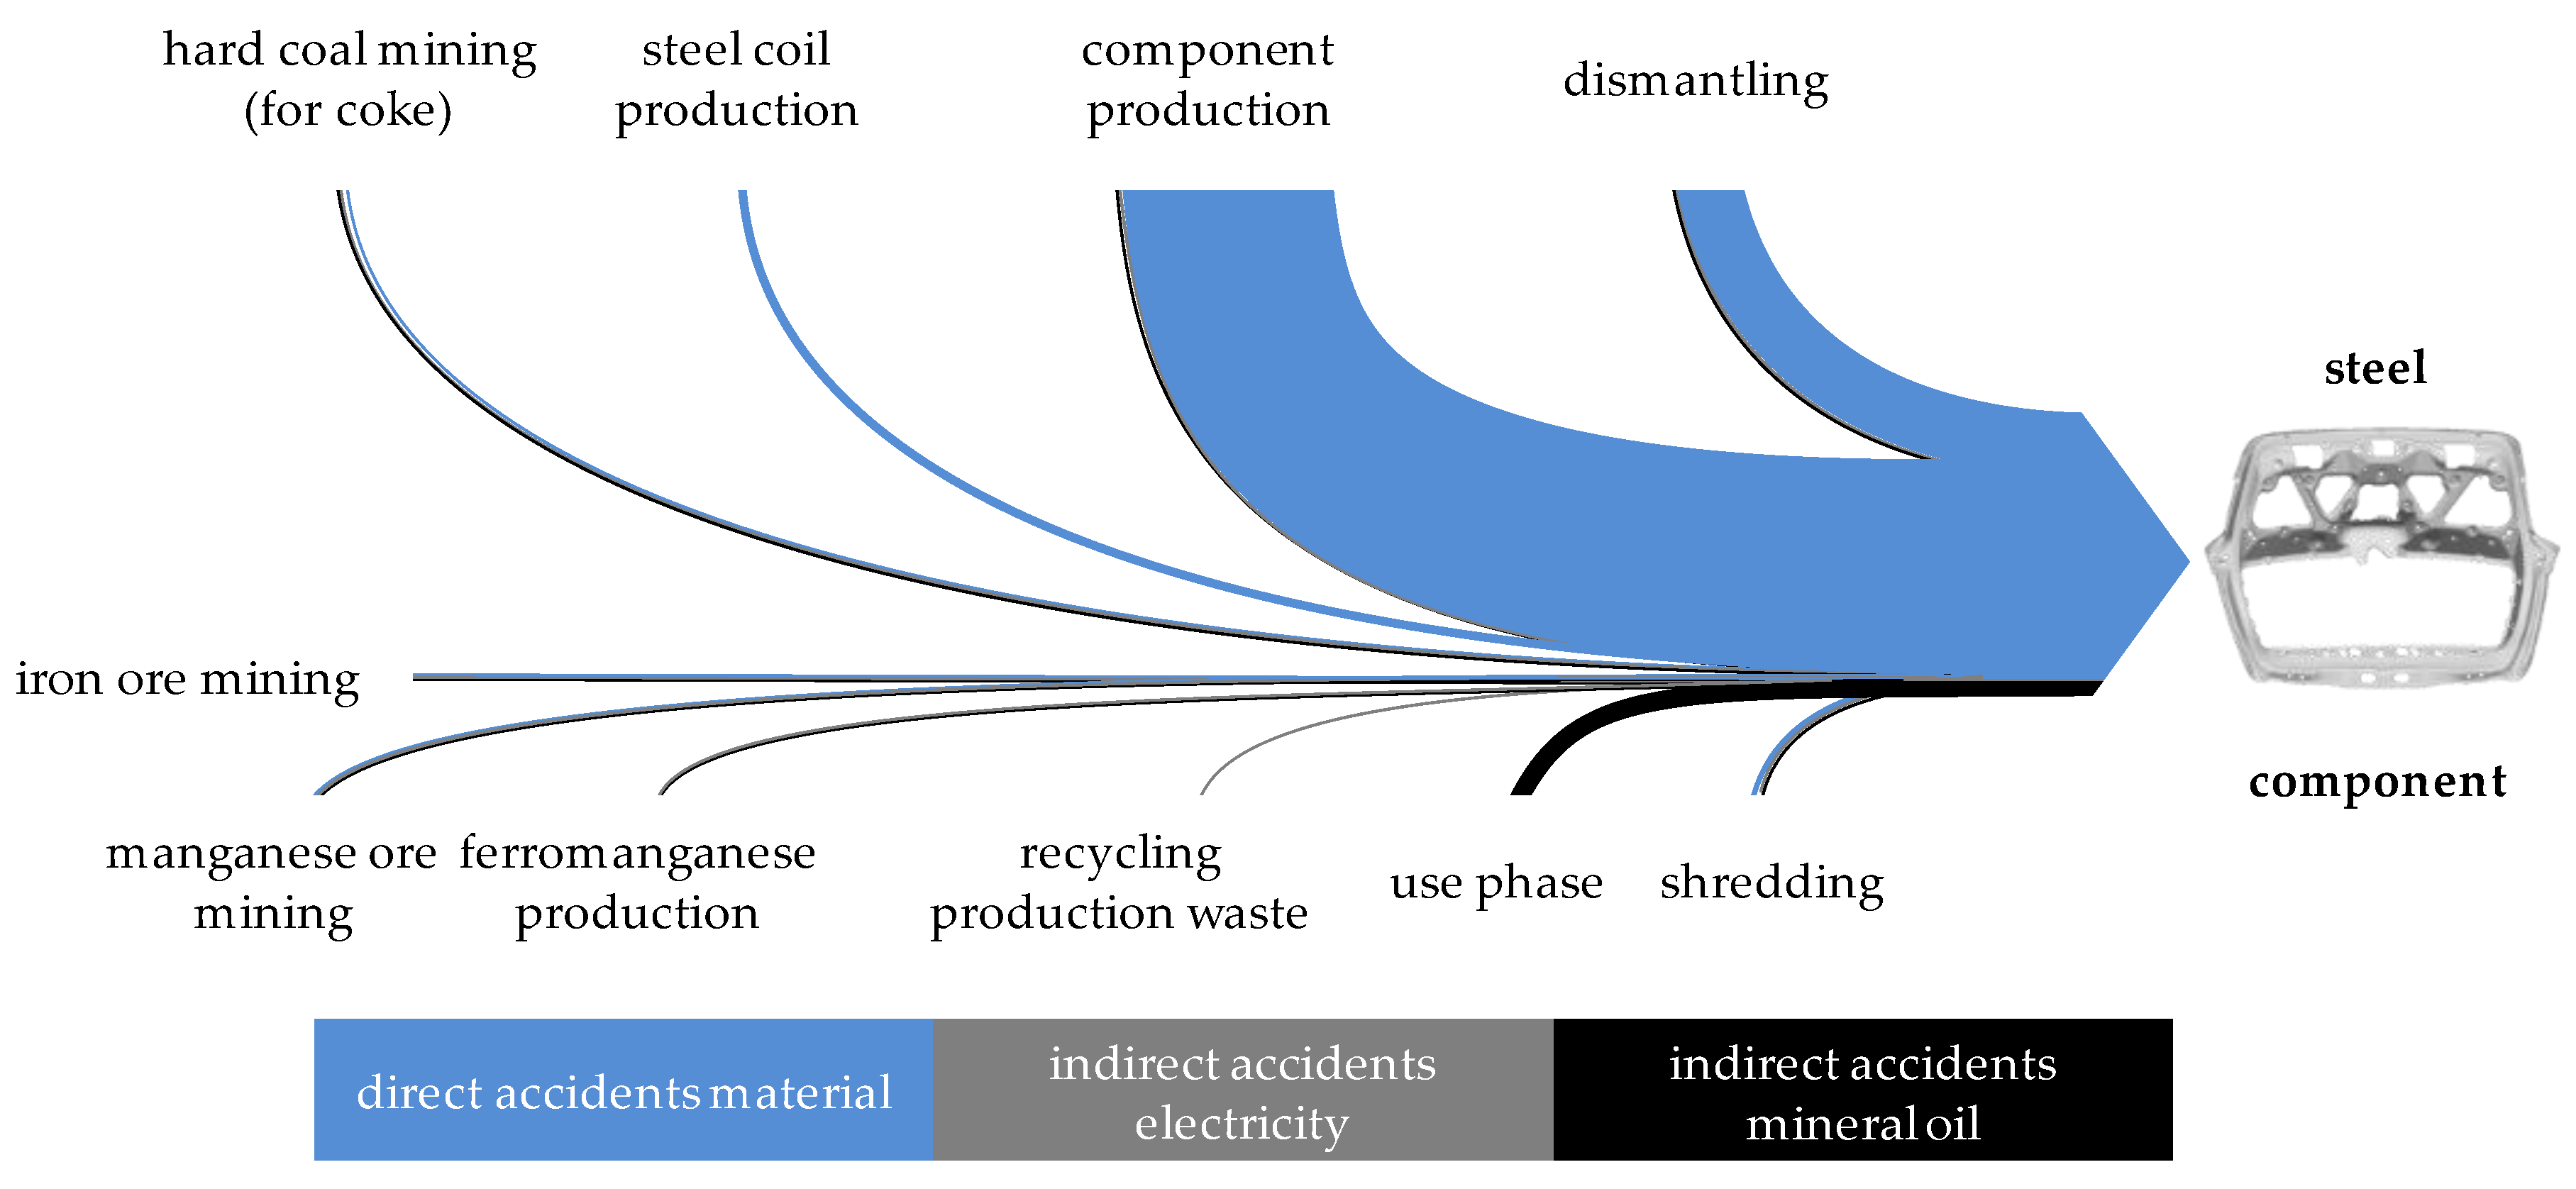
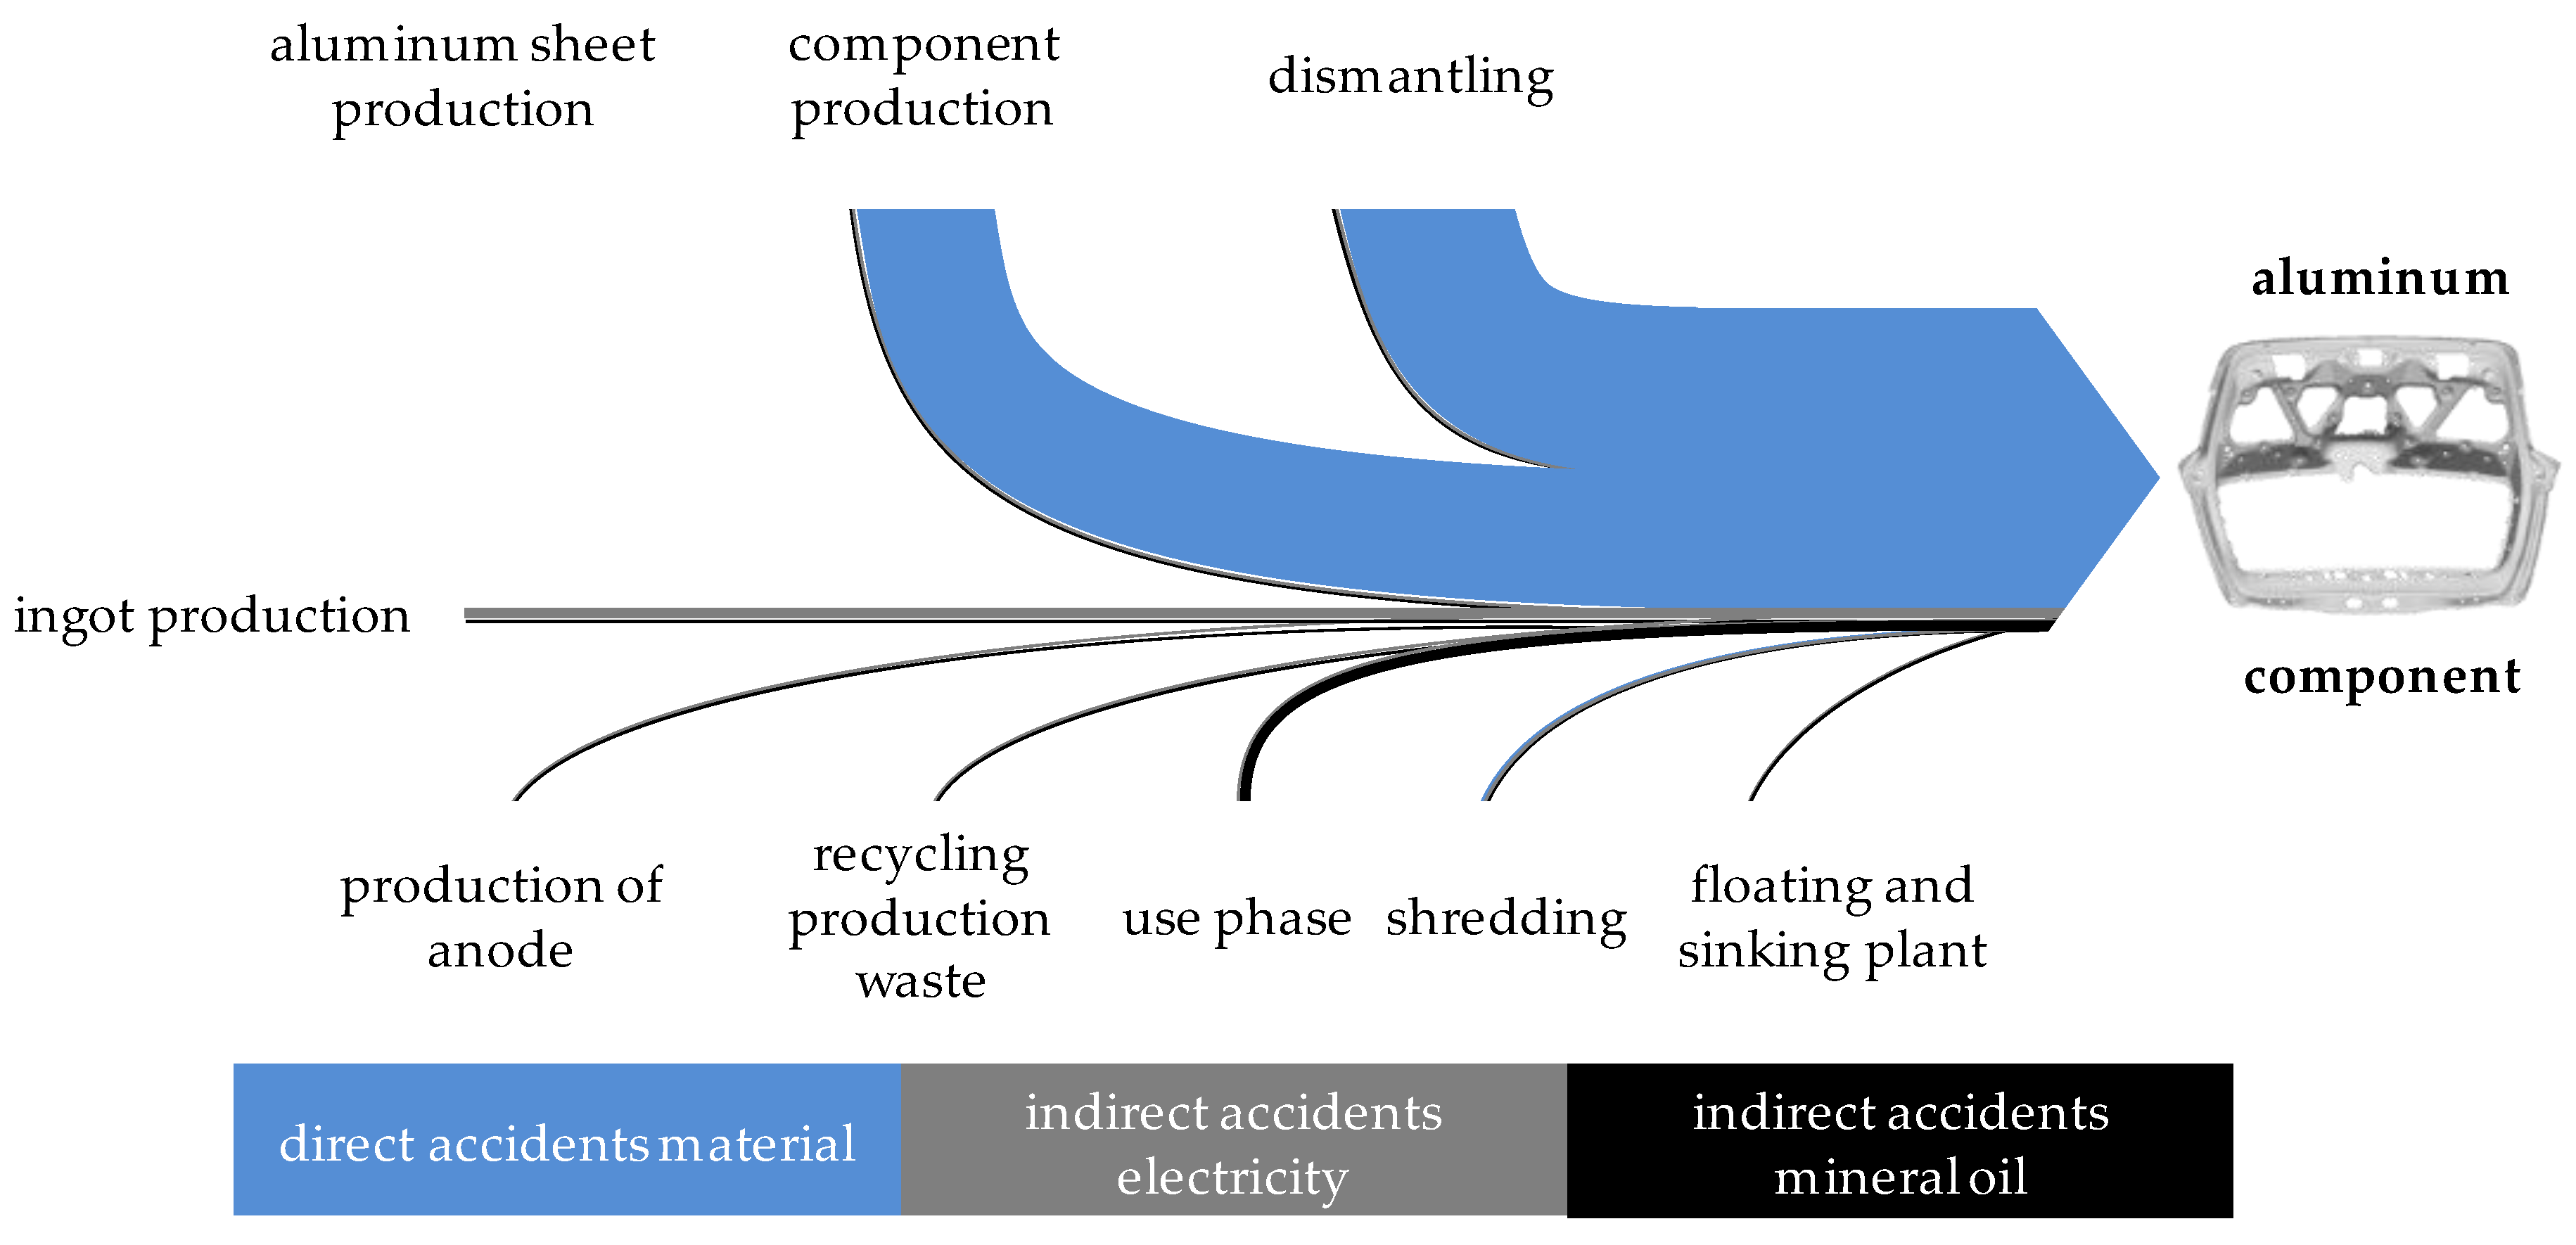
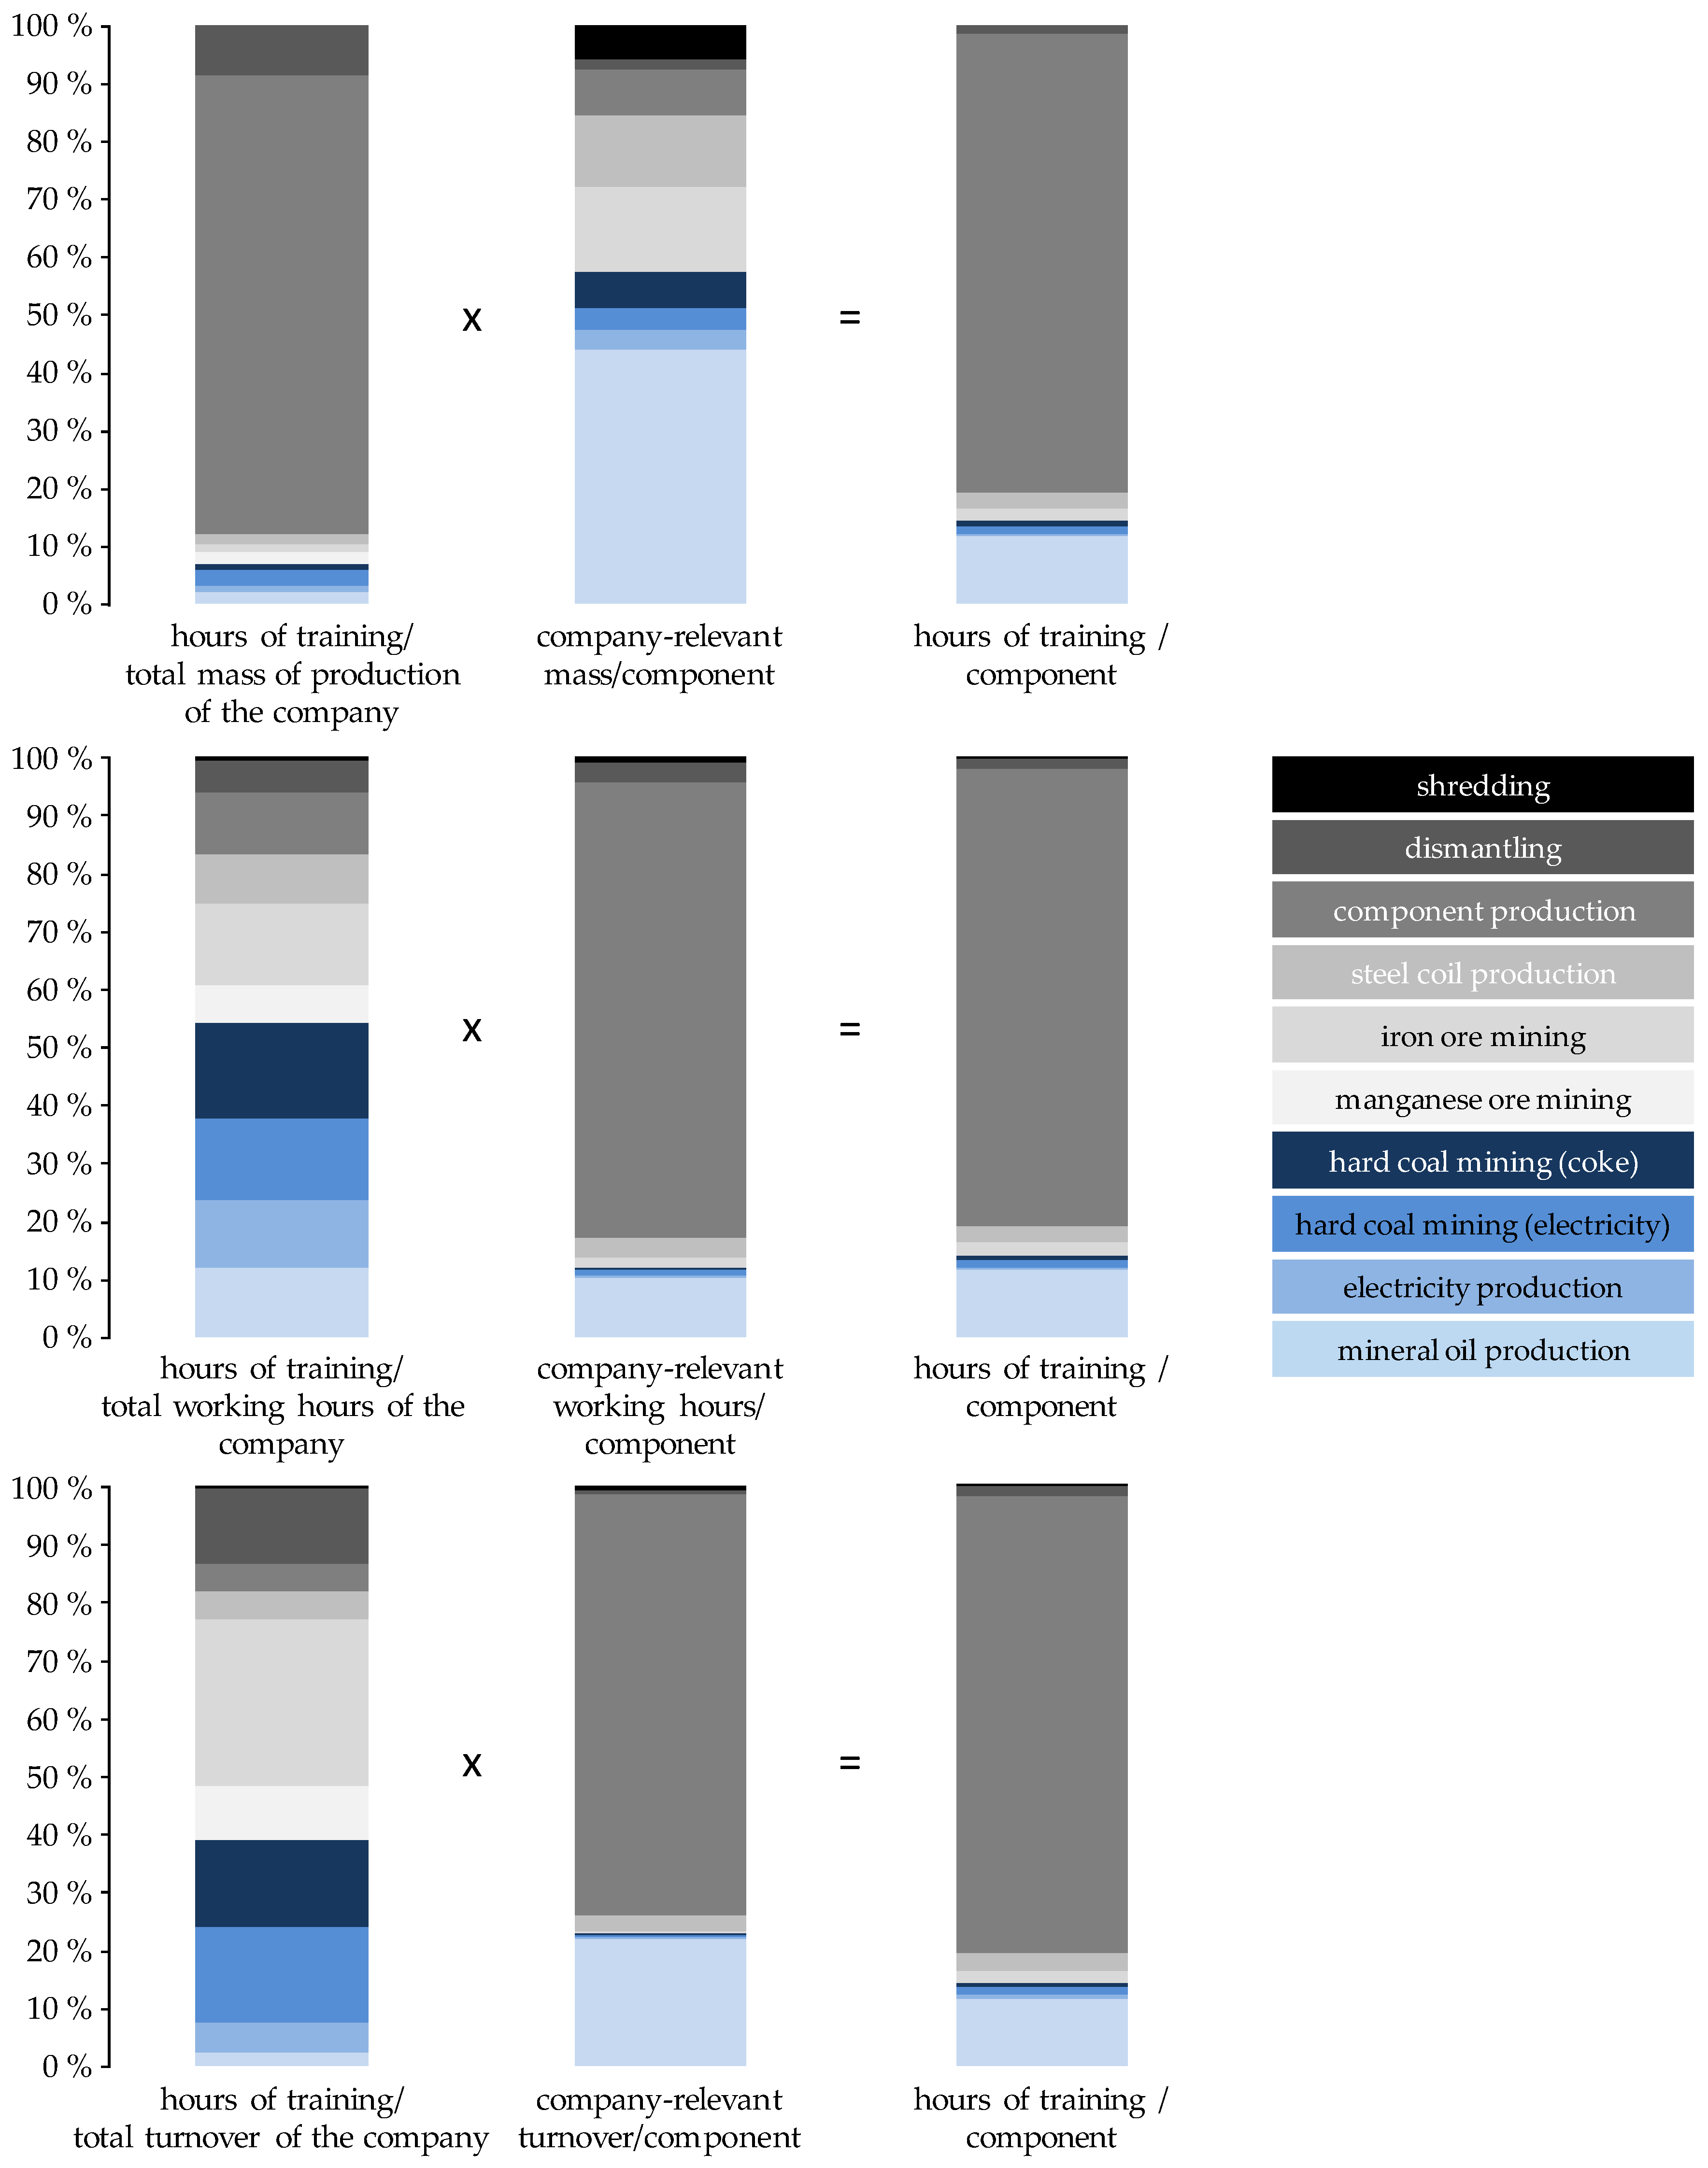
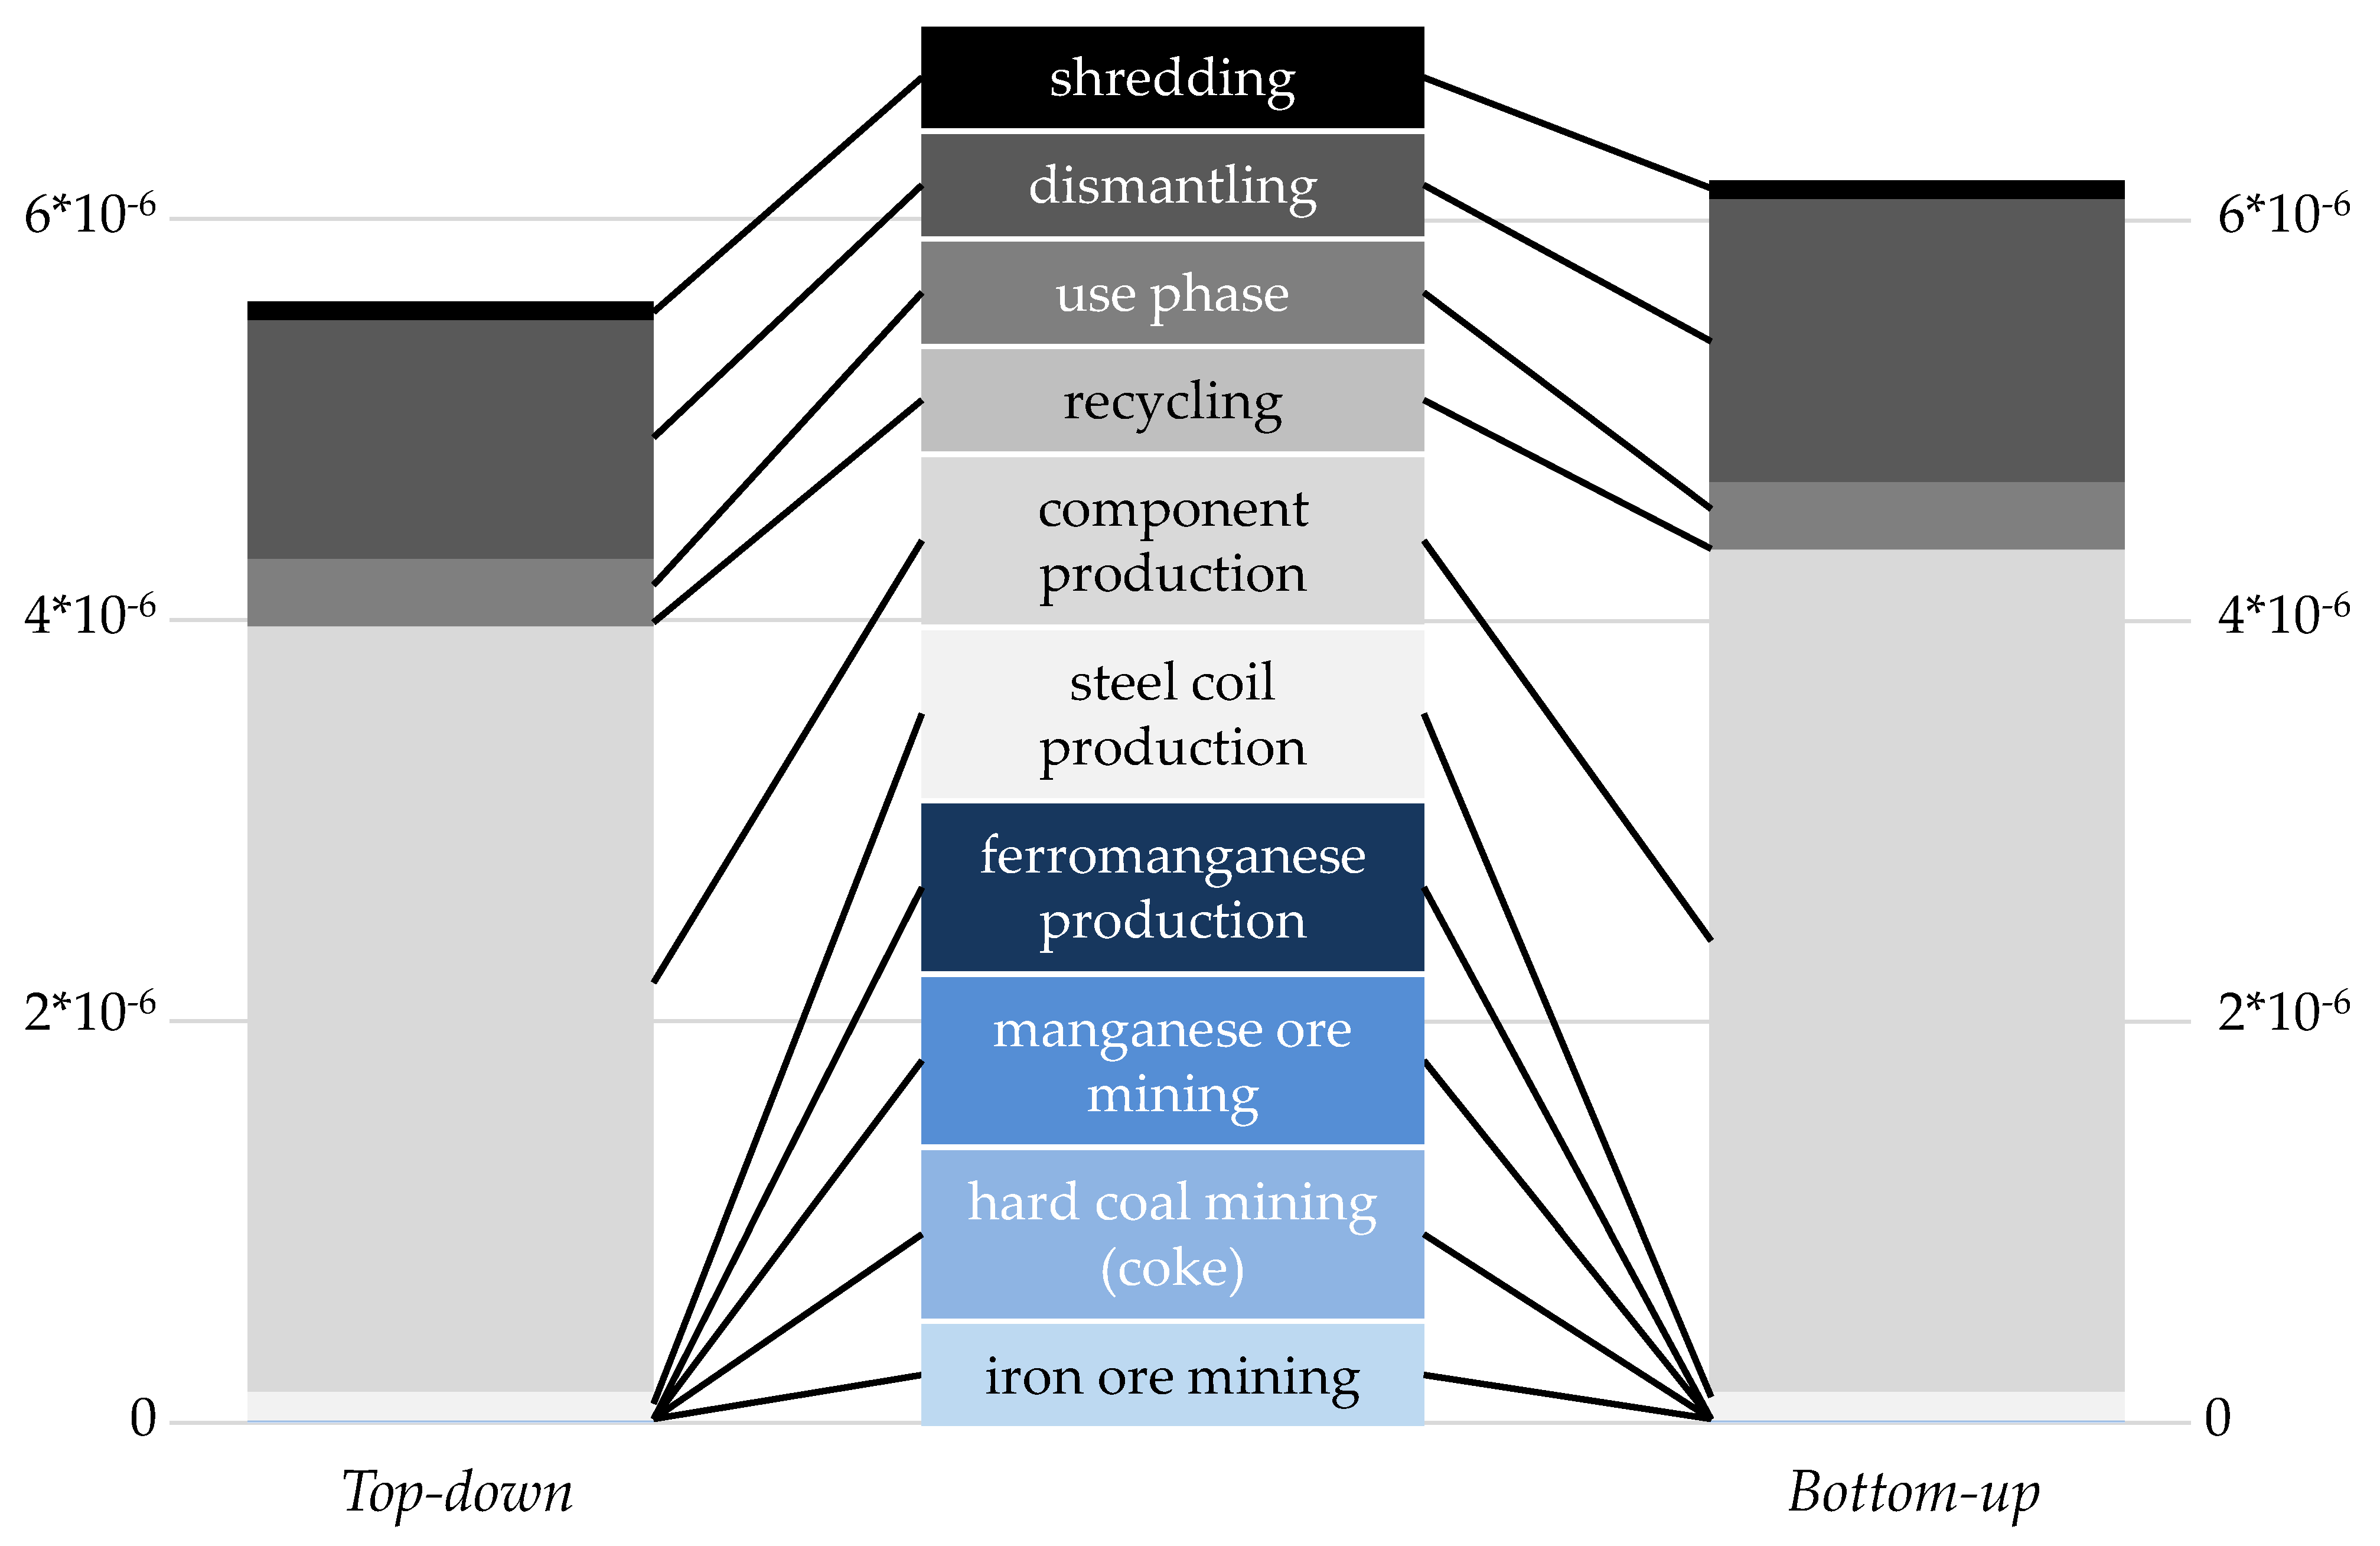
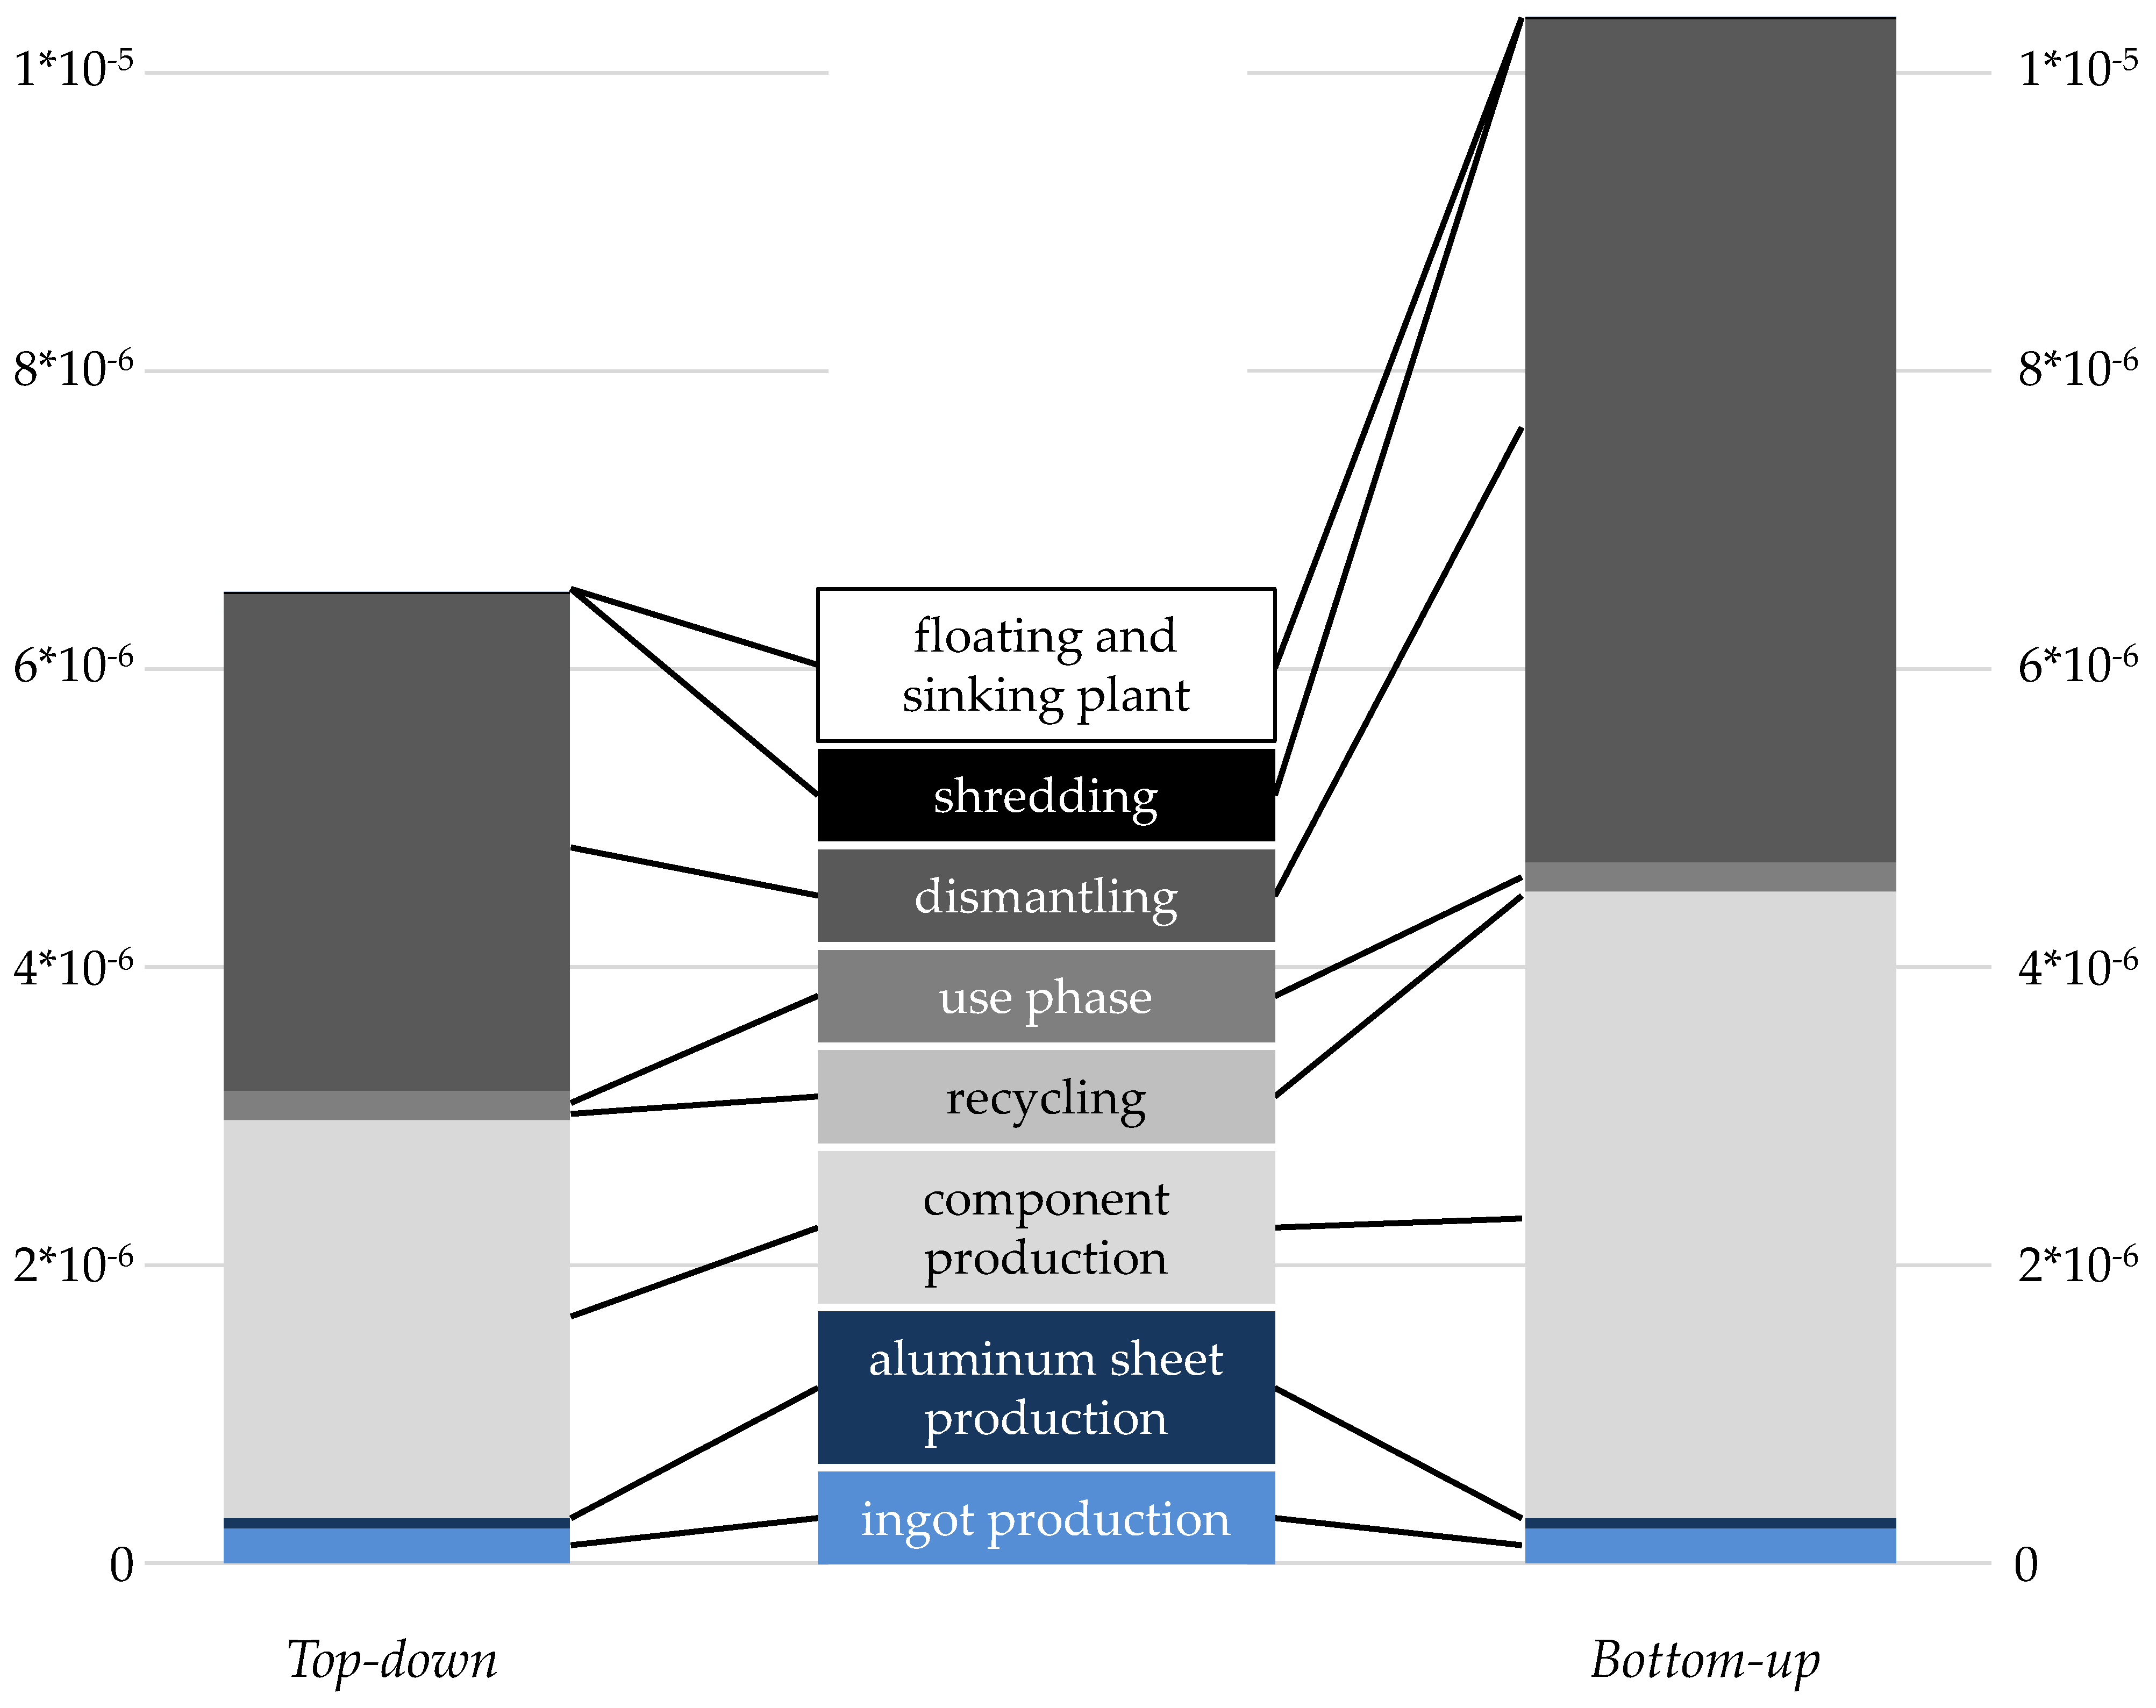
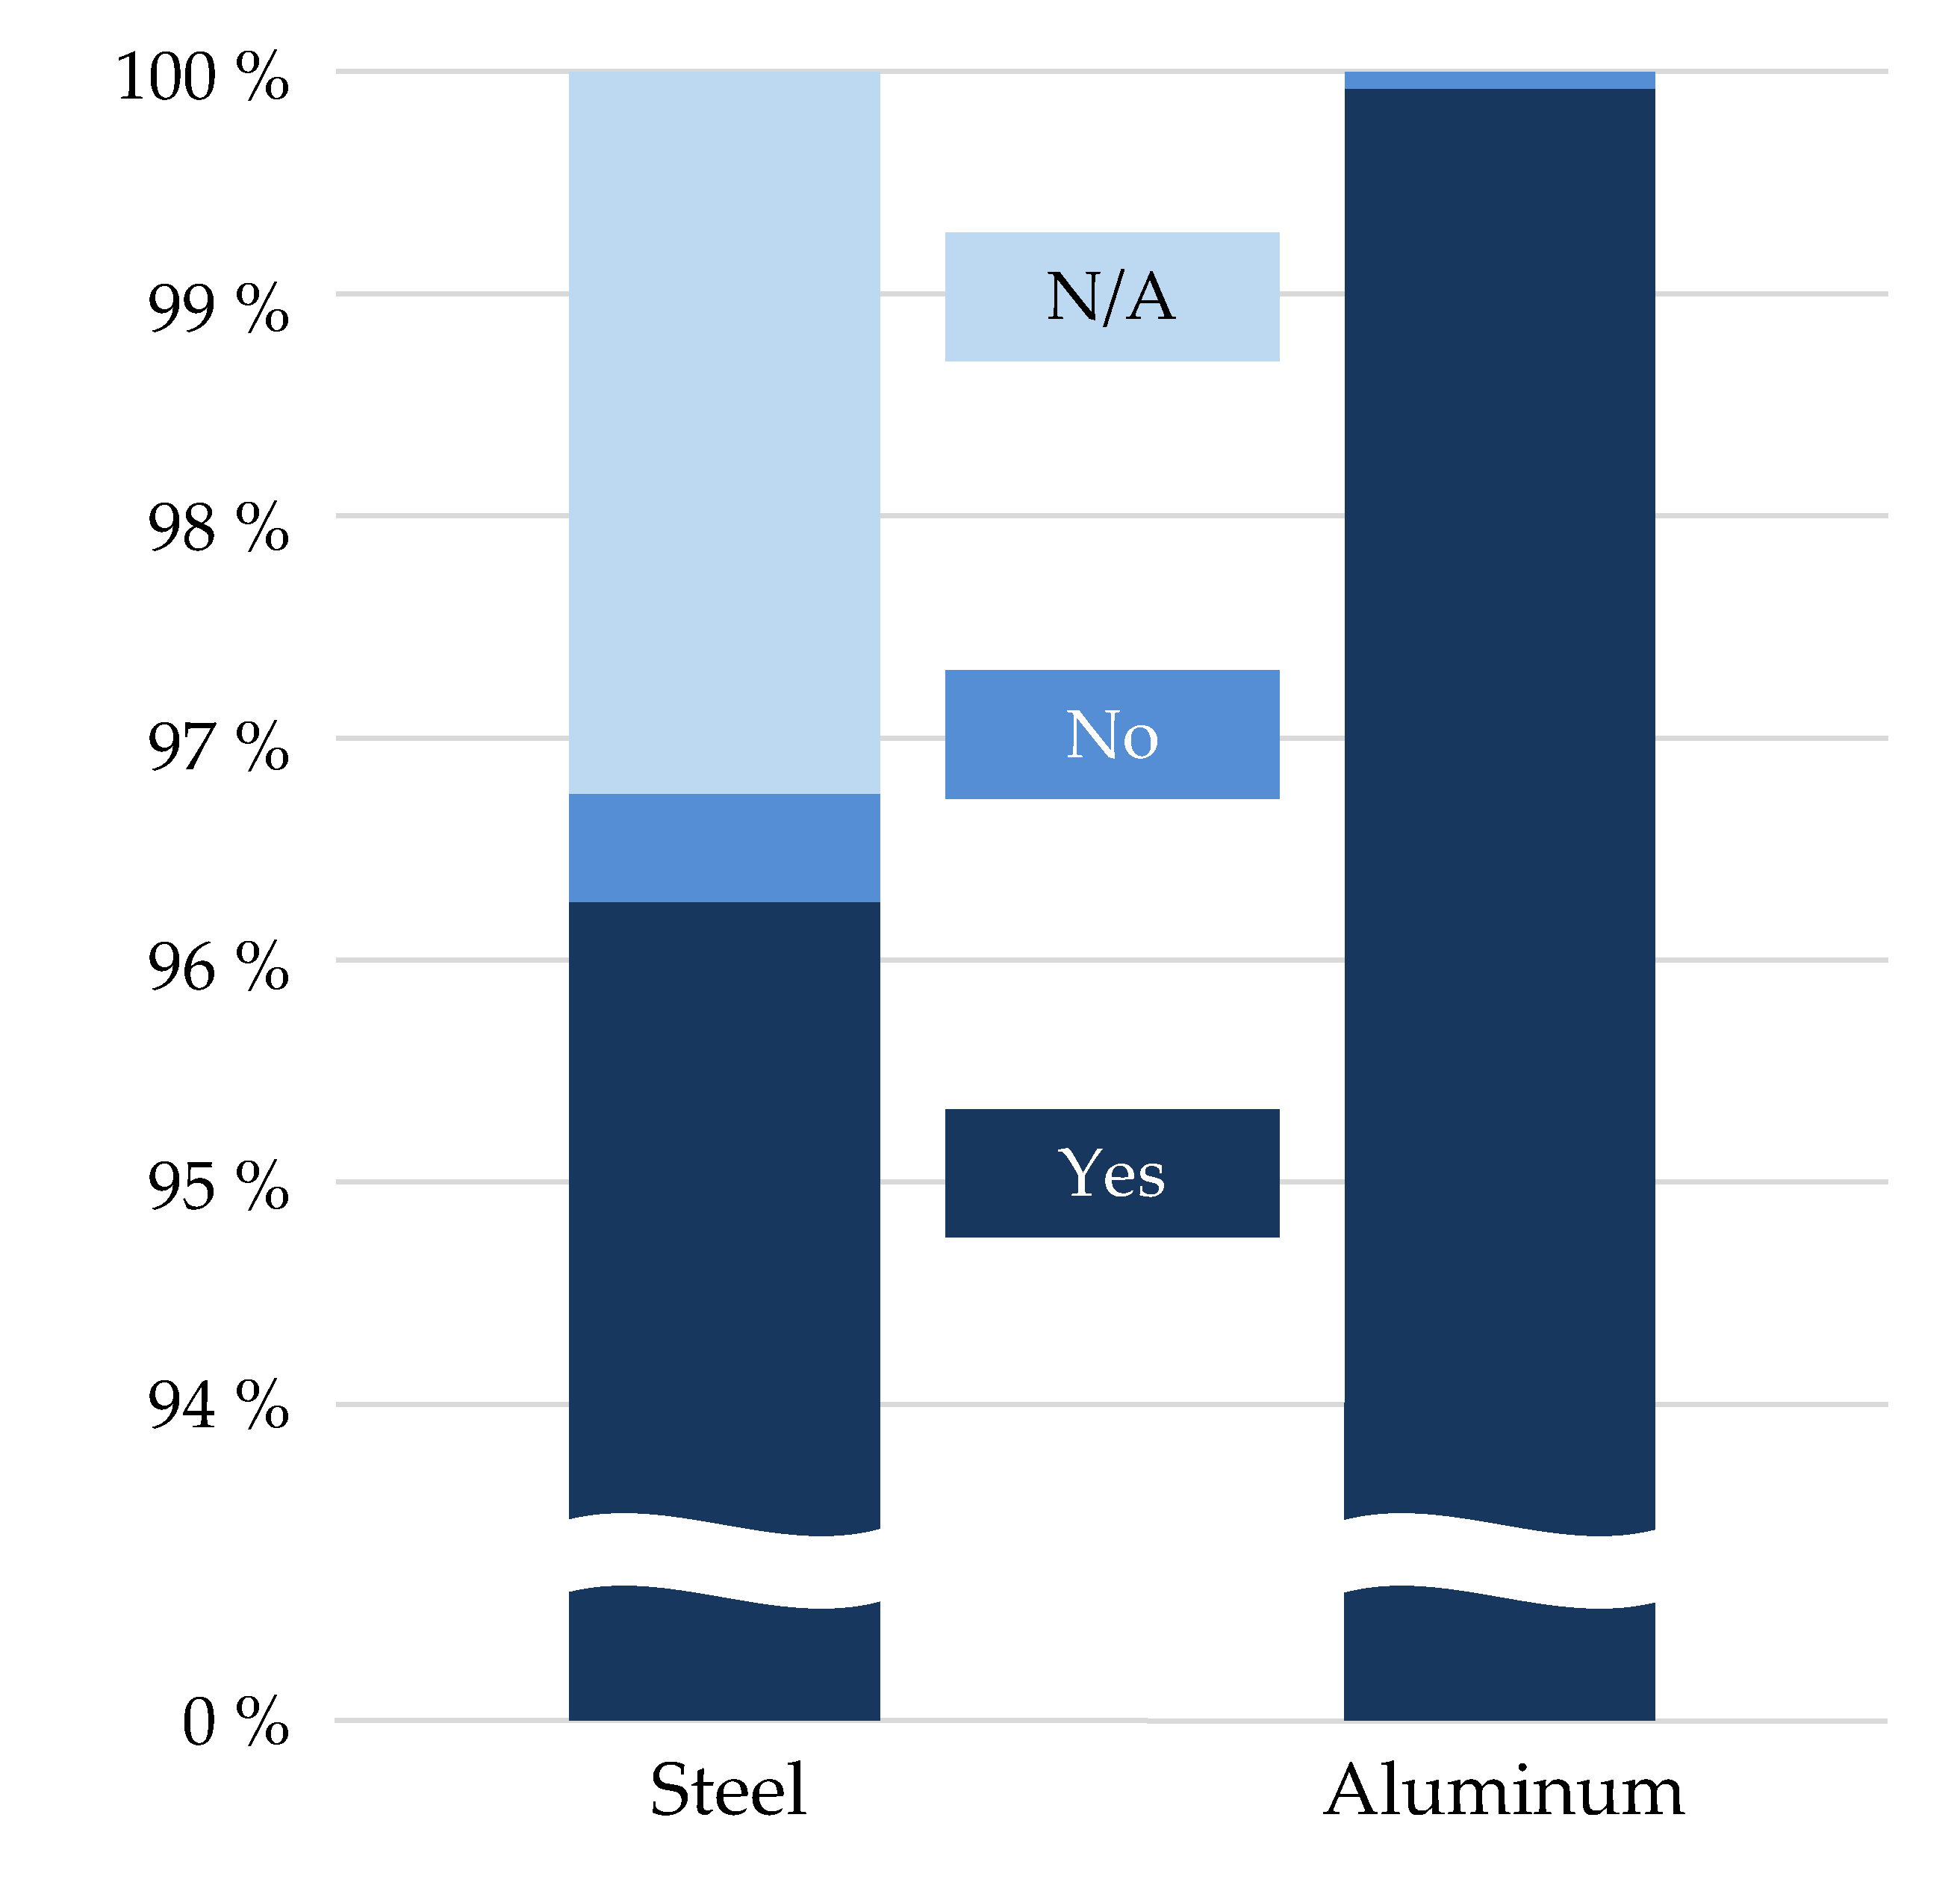
3.1.3. Calculations with the Social Data
3.2. Application of the SLCA Approach in Case Studies
3.2.1. Calculation of the Reference Values
3.2.2. Calculations with the Social Data
- -
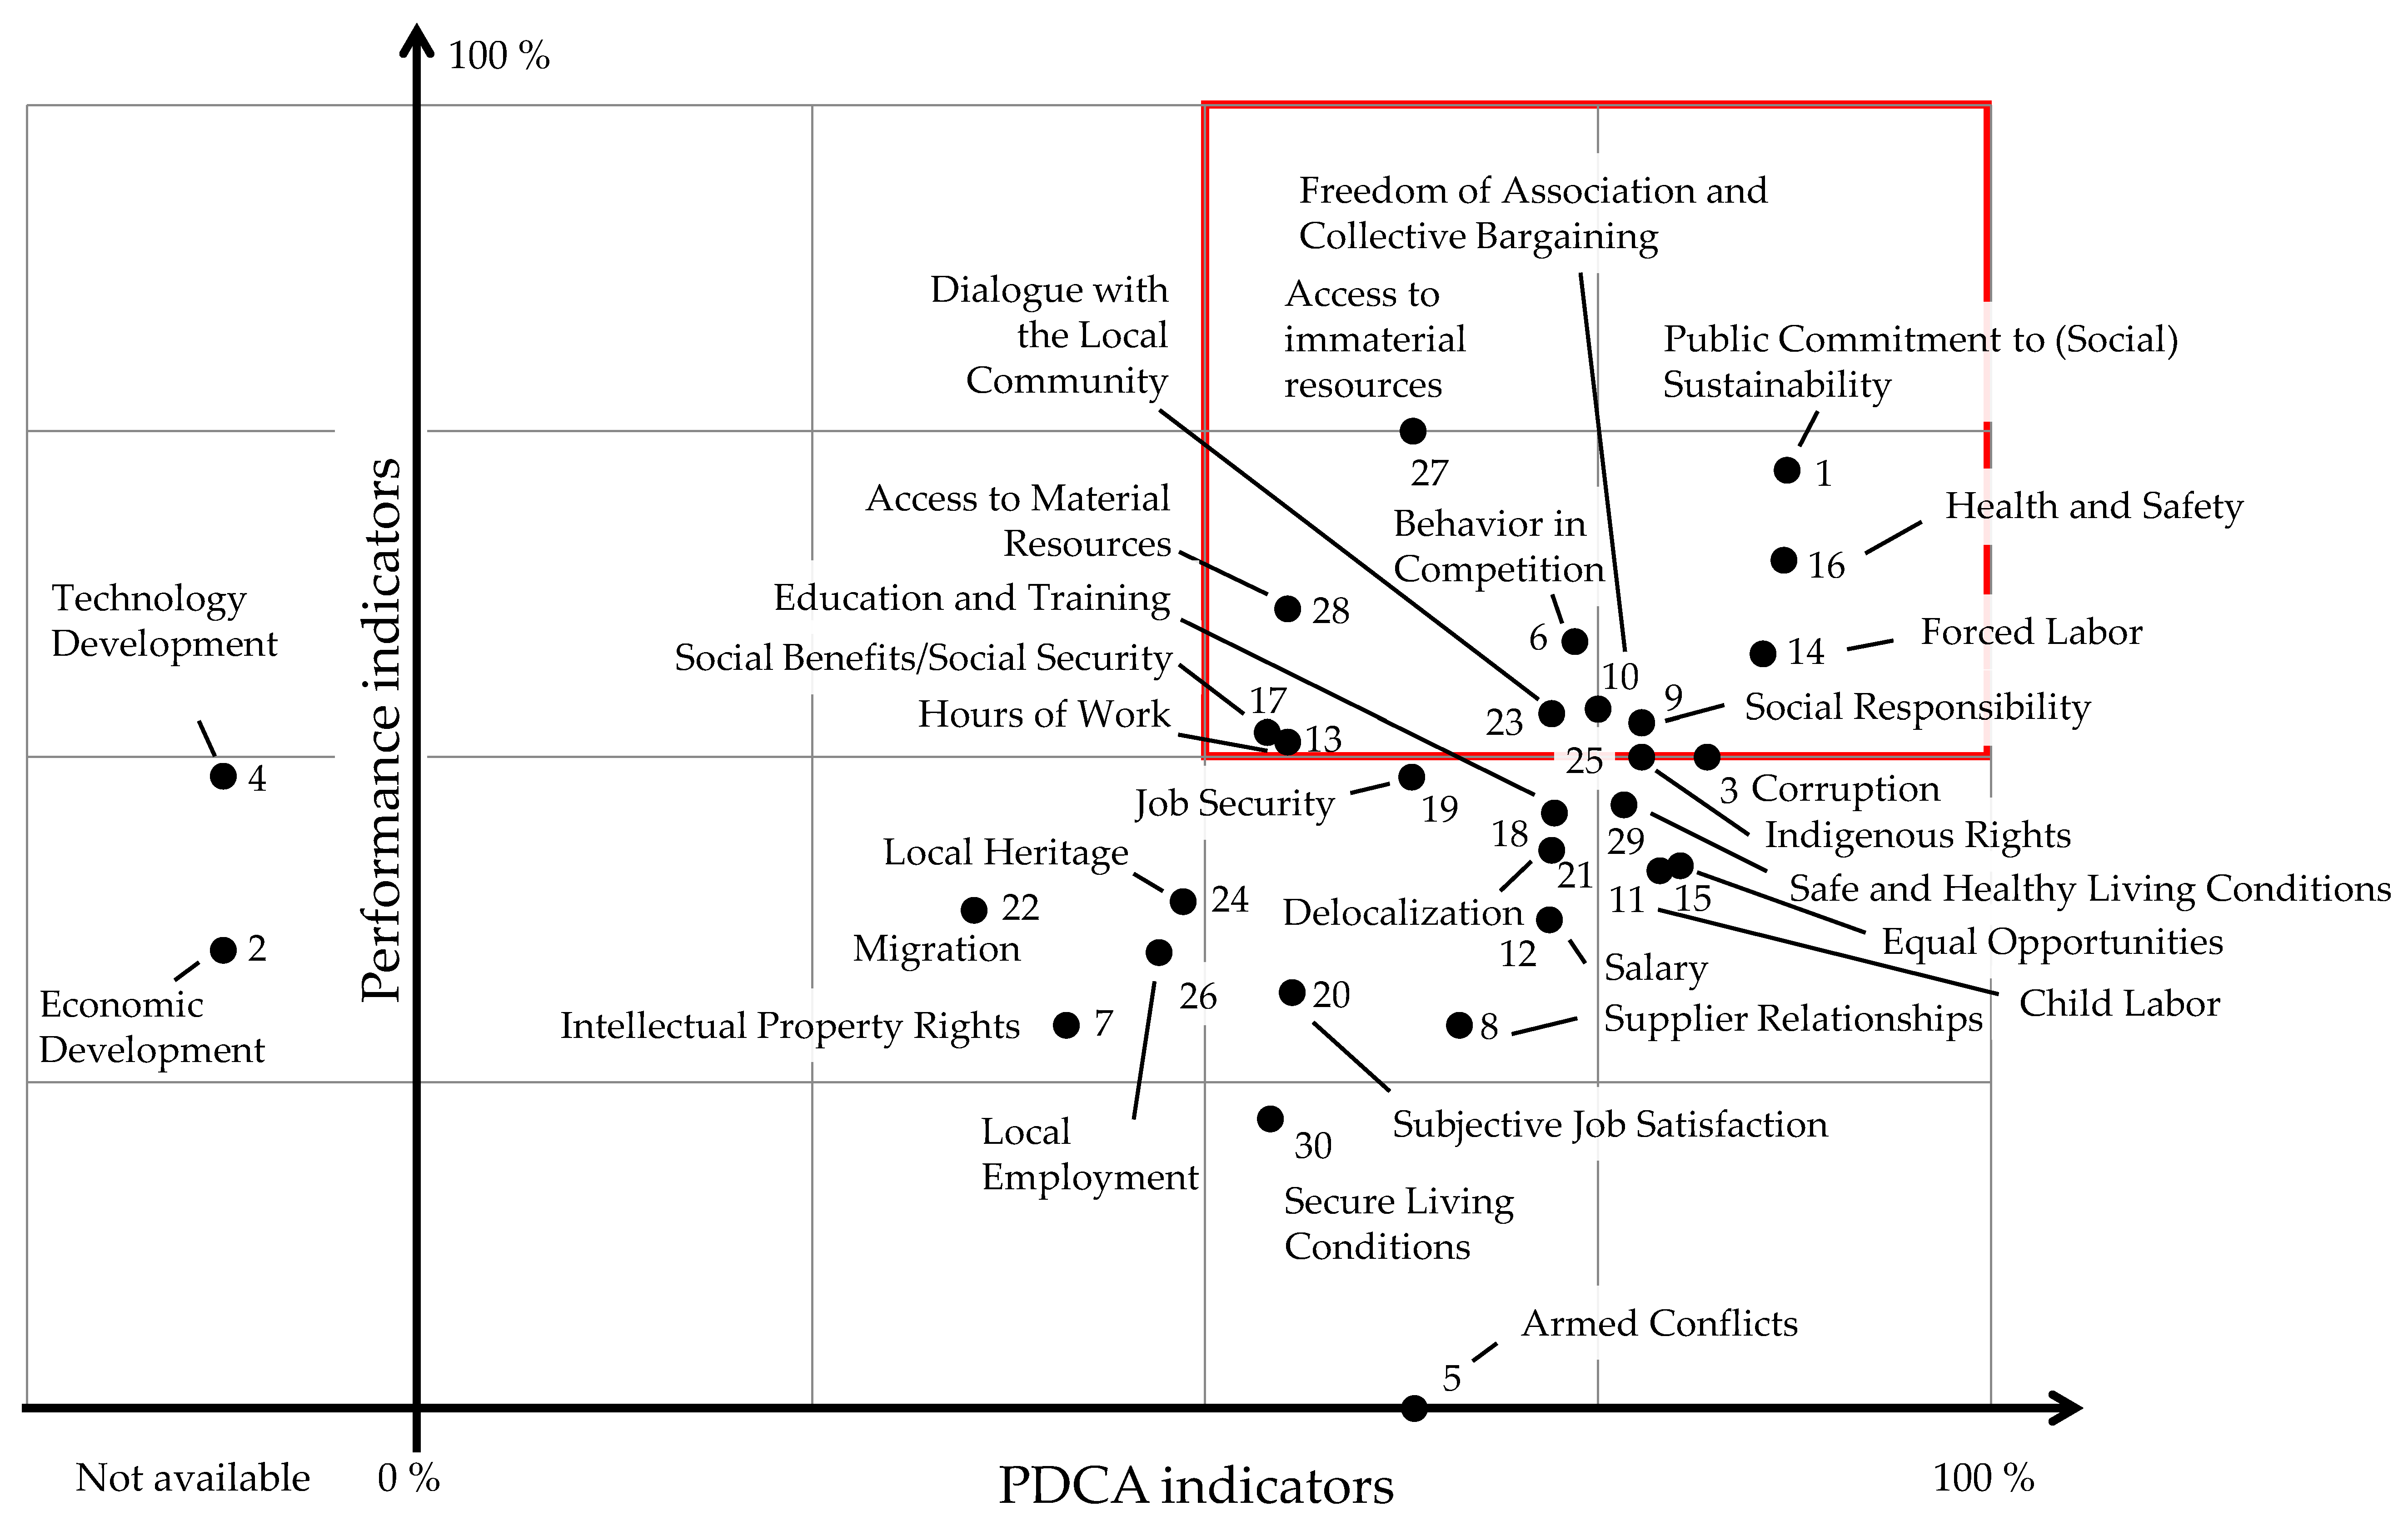
- Health and Safety (16),
- -
- Forced Labor (14) and
- -
- Freedom of Association and the Right to Collective Bargaining (10).
- Are you training your employees on your code of conduct or your attitude to social sustainability? (social aspect 1, Public Commitment to Social Sustainability),
- What is the proportion of employees covered by collective agreements? (social aspect 10, Freedom of Association and Collective Bargaining),
- How many injuries and non-fatal accidents at work were there in the last year in the company? How many fatal accidents at work were there in the last year in the company? (social aspect 16, Health and Safety) and
- What is the average number of training days per employee per year (social aspect 18, Education and Training)?
- Number of (workplace) accidents (social aspect 16, Health and Safety) for the calculation of the performance indicators,
- PLAN indicator of the social aspect Corruption (3) and CHECK indicator of the social aspect Child Labor (11) for the individual calculation of the PDCA indicators,
- Are you a member of an initiative for promoting social responsibility along the value chain? (social aspect 9, Social Responsibility) for the integration of qualitative performance indicators,
- PDCA indicators of the social aspect Health and Safety (16) for the joint calculation of PDCA indicators, and
- PDCA indicators and one quantitative performance indicator (number of accidents) of the social aspect Health and Safety (16) for the use of these indicator types in an SLCA.
3.3. Discussion of the Presented SLCA Approach
3.3.1. Availability and Quality of Social Data
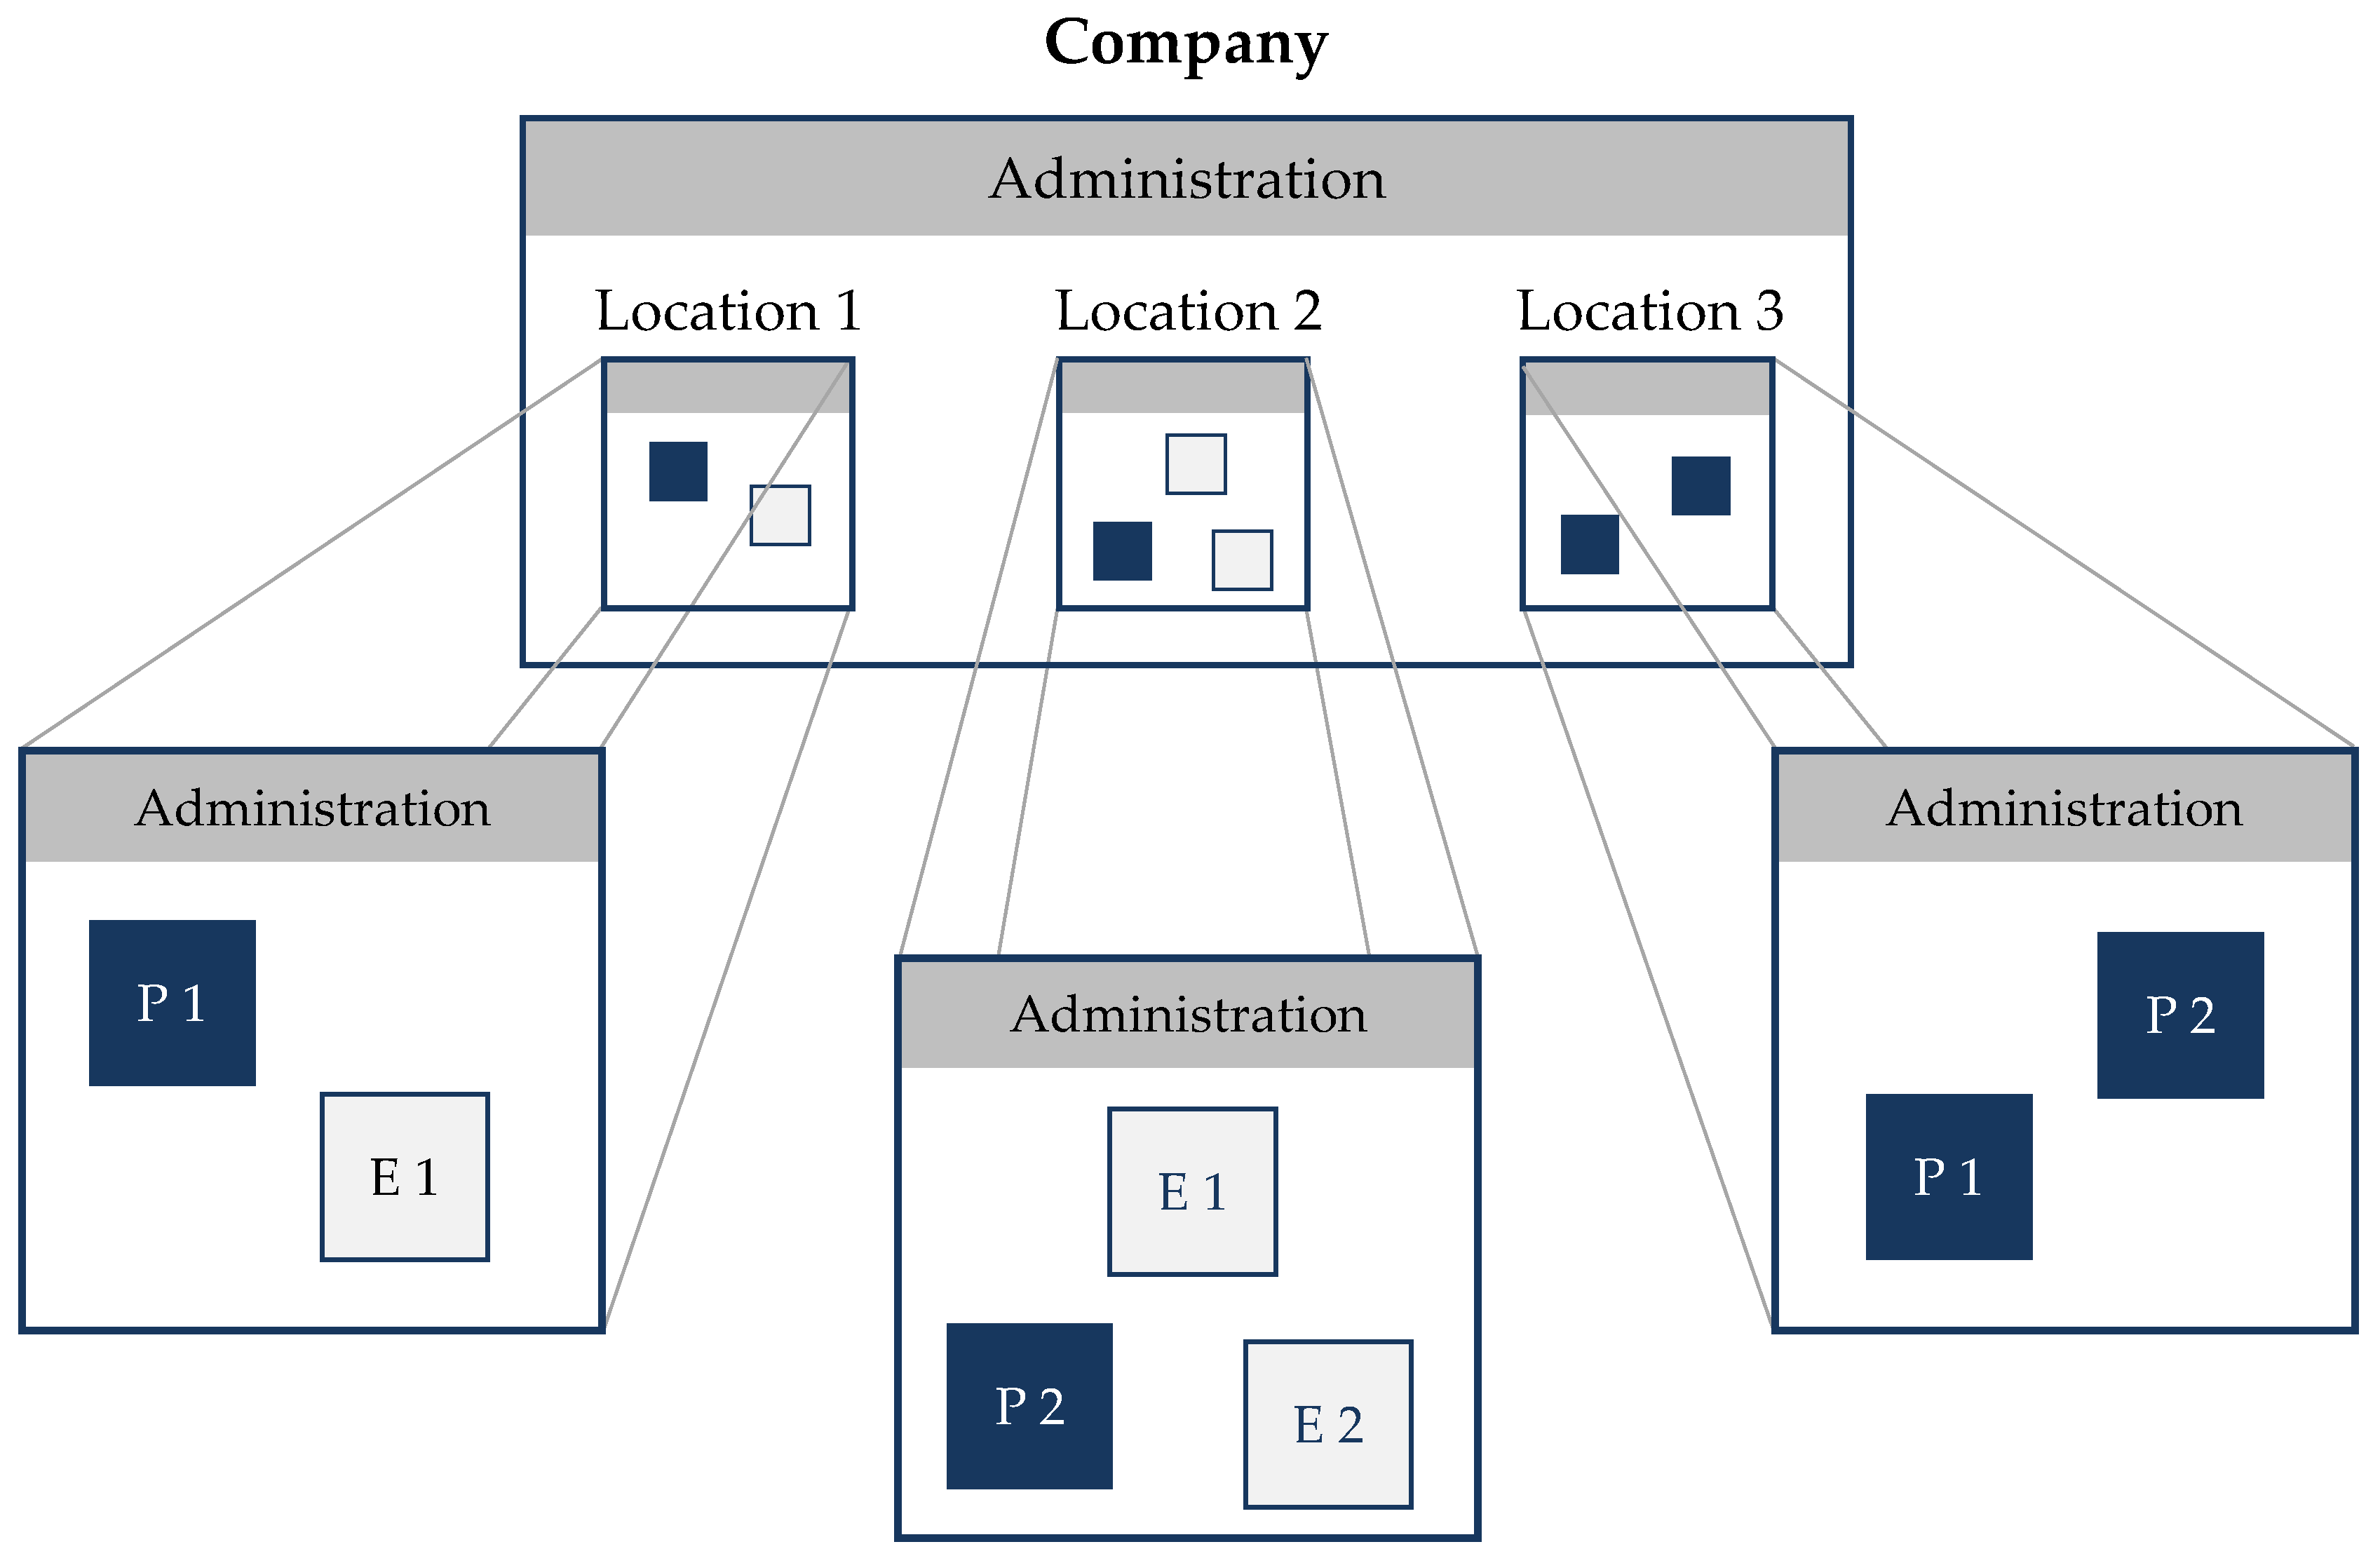
3.3.2. Establishing a Process Reference for the Life Cycle-Oriented Social Aspects
- In a company, several products are manufactured during whose production large differences occur in the activity variable and in the SLCA only one of these products is considered.
- A company produces the same product in several countries with large differences in the activity variable and in SLCA only one of these countries is analyzed.
- In a company, some parts of a product are manufactured in-house, while others are purchased. Since in this approach the activity variable refers to the mass, too much is allocated to the purchased parts and too little to the self-manufactured parts.
- The total mass output of a company is an important parameter in this approach (see Section 3.1.2). However, in the data provided by different companies, it can refer to different quantities, such as output or sales, and is difficult to compare in such cases.
- The social data are not proportional to the selected activity variable or have no relation at all to an activity variable.
- Although the social data are proportional to the chosen activity variable, they show large deviations in different processes.
3.3.3. Use of the Calculated Indicators in an SLCA
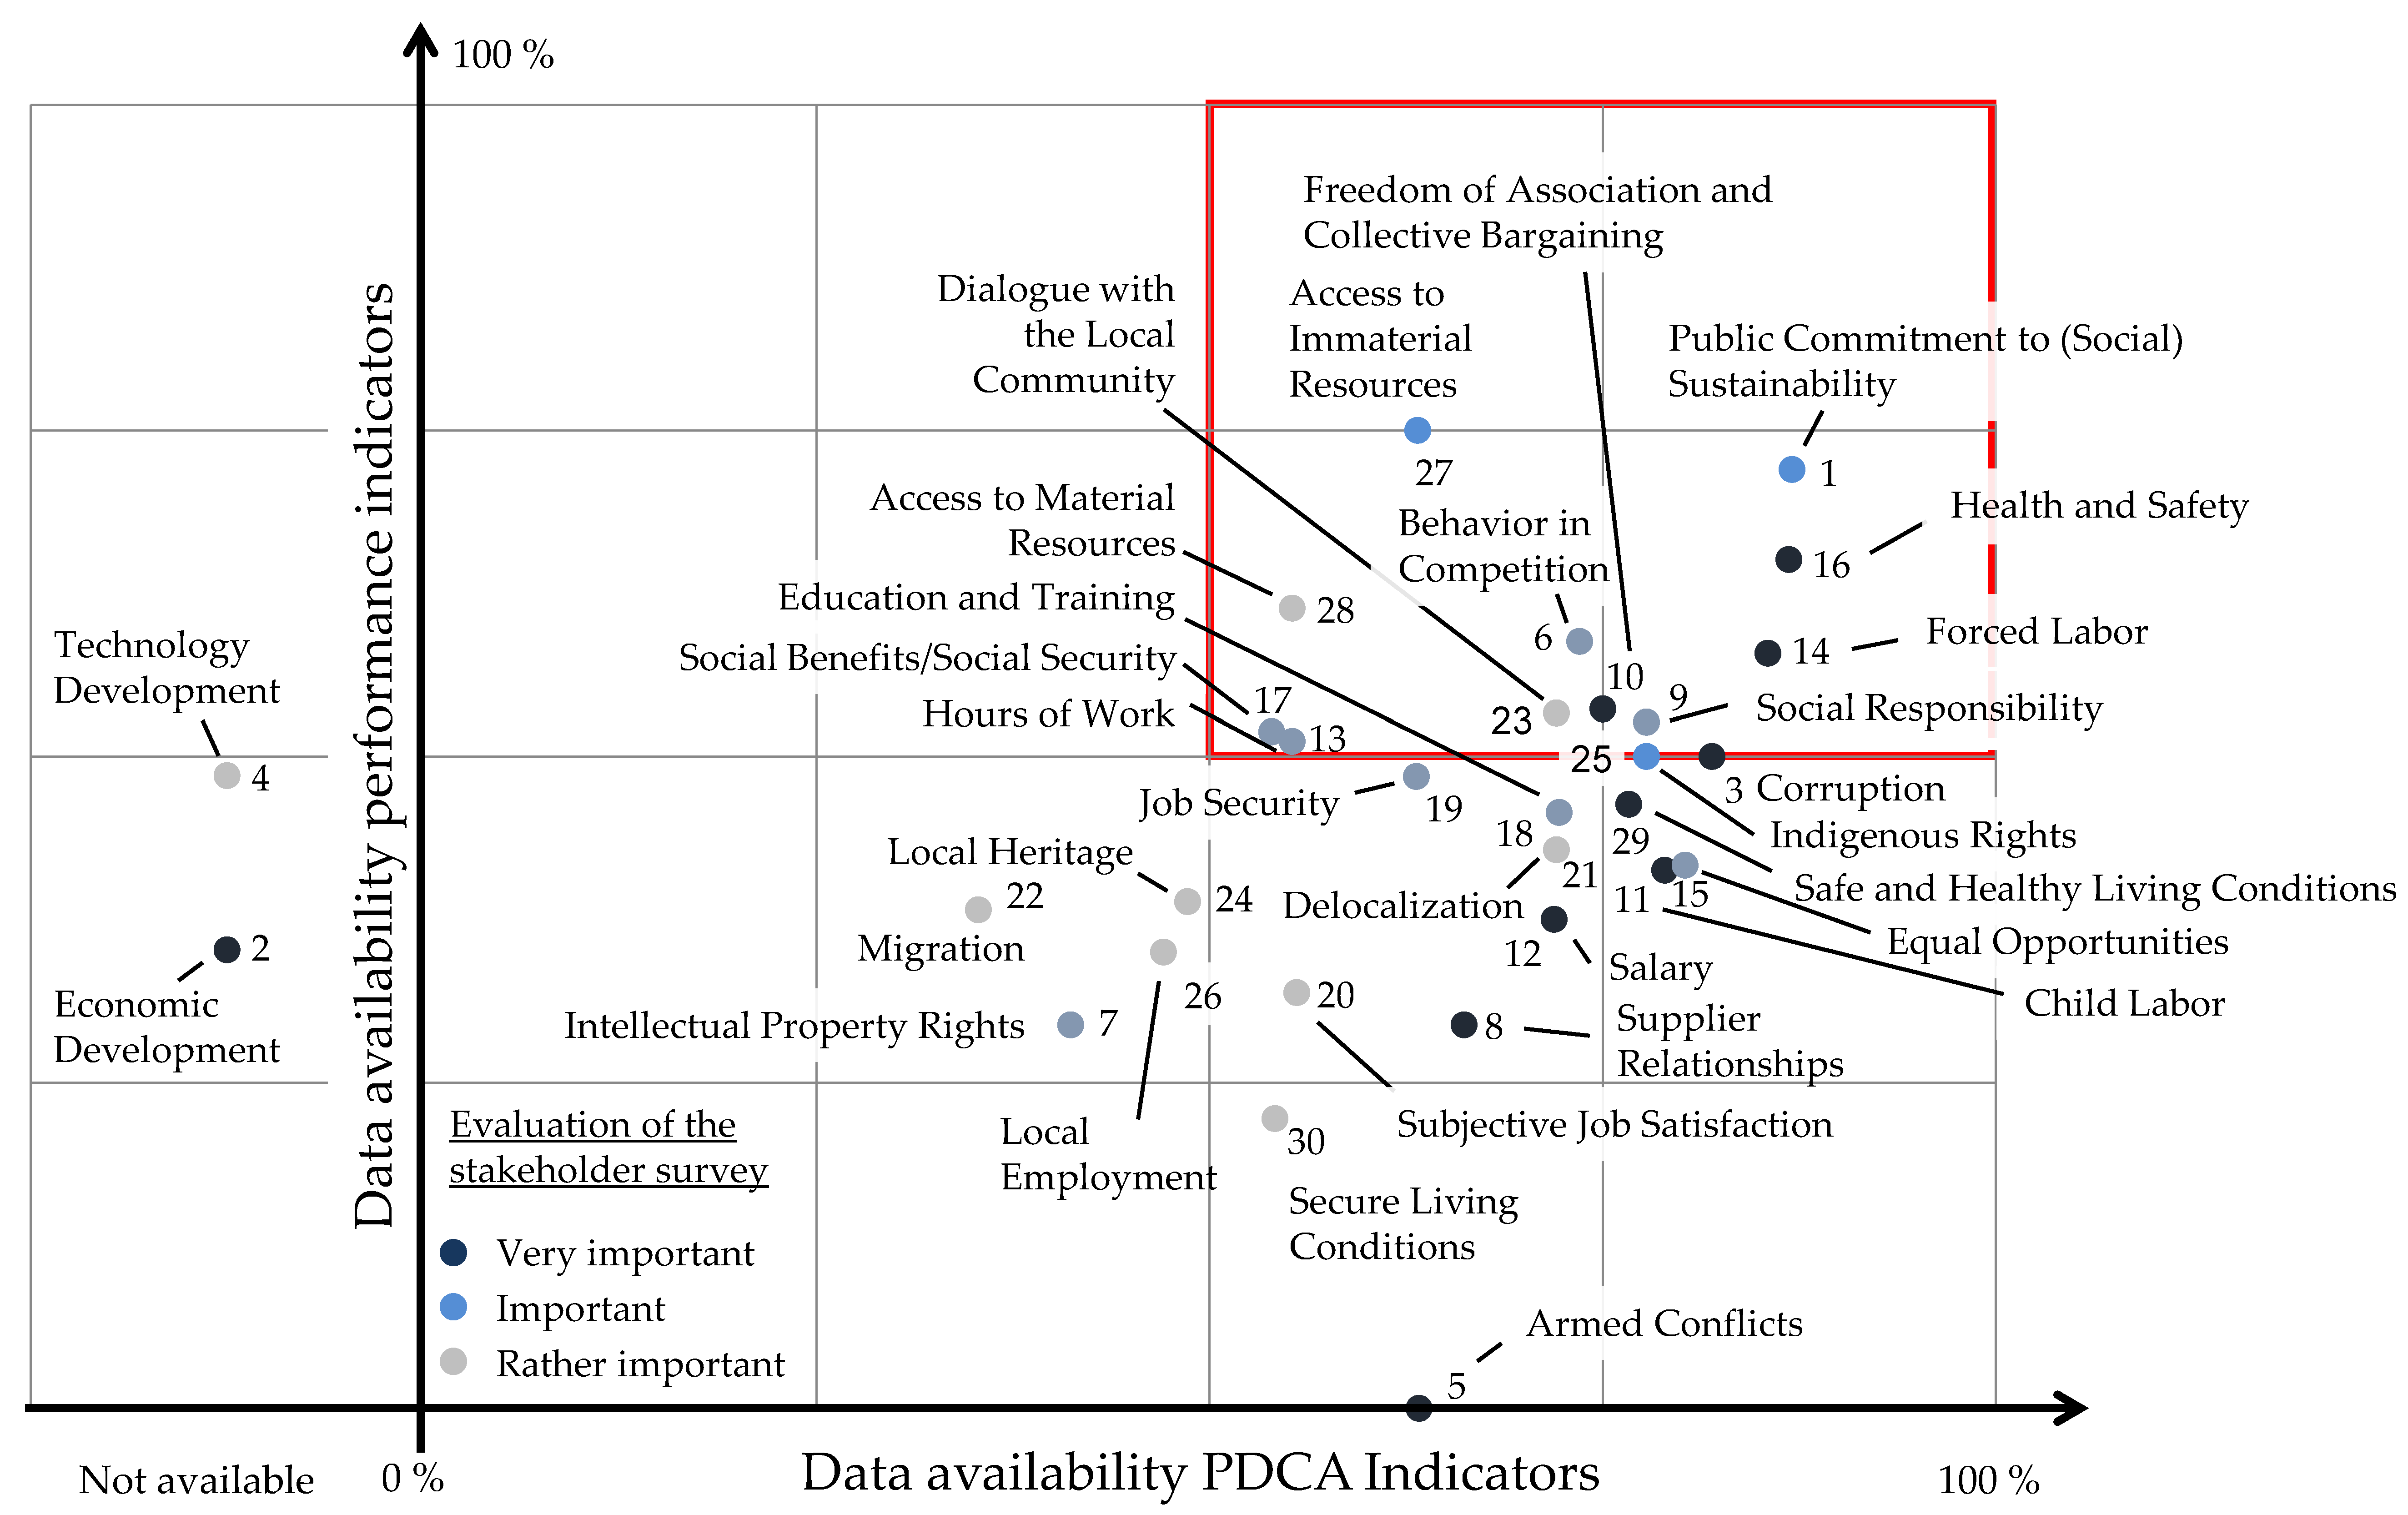
3.3.4. Assessment of the Social Aspects
3.3.5. Transfer of the Approach from the Component to the Car Level
4. Conclusions and Outlook
4.1. Applicability of the SLCA Method
4.2. Recommendations for the Automotive Industry
4.3. Further Research Needs
- In the future, a strong focus should continue to be placed on the concretization and standardization of the indicators, including the constant reporting of companies. This could be used to set up a database with uniform indicators for different sectors and countries. With the help of such a database, missing company-specific social data could be balanced out and the data received could be evaluated.
- The mining, production and disposal processes and their interrelations with activity variables should be analyzed in more detail and the results of the investigations should be made available. Thus, the detour via the mass output of the companies, which had to be used in this work, would not be necessary and a more exact mapping of the processes would be possible. For example, an SLCA database (analogous to an LCA database) would be desirable in which different activity variables are listed for each process step. Since companies often treat this information confidentially, they could be listed in such a database on an industry-specific basis and thus maintain confidentiality.
- For the impact assessment in an SLCA within the framework of an LCSA, it is necessary to further analyze the evaluation of the social aspects. The aim of these studies should be to develop a system for evaluating the social aspects that will be included in future versions of the Guidelines or comparable documents.
Author Contributions
Funding
Acknowledgments
Conflicts of Interest
Appendix A. Detailed Overview of the PDCA and Performance Indicators

| Category | Indicators/Questions |
|---|---|
| 1. Public Commitment to (Social) Sustainability | |
| PLAN | Have you introduced (in writing) and signed social sustainability principles? If yes, which one: Universal Declaration of Human Rights ILO standards UN Global Compact OECD Guidelines for Multinational Enterprises Company’s own code of conduct Other: |
| DO/CHECK | Have you developed procedures and measures for applying and monitoring these social sustainability principles? If yes, which one: Sustainability management Scorecard Membership in associations/programs for promoting socially sustainable business practices Other: |
| ACT | Have you established procedures for responding to violations regarding these social sustainability principles respectively regarding complaints? If yes, please specify. |
| Perf | Do you publish documents containing promises and agreements regarding (social) sustainability? If yes, please specify. |
| Perf | Have you received awards for your commitment to social sustainability? If yes: How many? Which ones? |
| Perf | Do you train employees in your code of conduct/position on social sustainability? If yes: How many have you trained last year (in percent)? |
| Perf | Have you received complaints concerning non-compliance against the principles in the last five years? If yes: How many? What was their nature? |
| 2. Economic Development | |
| Perf | How much does your product contribute to your country’s economic growth? Gross value added (in €) Revenues (in €) Profit (in €) Salaries paid (in €) Contribution to government budget (taxes paid, subsidies received) (in €) Other: |
| Perf | How much does your product contribute to the economic growth of developing countries (in €)? Imports from developing countries Investment in developing countries |
| Perf | How many key investment agreements containing human rights provisions or that were vetted under human rights aspects do you have (in number and in percentage of all investment agreements)? |
| 3. Corruption | |
| PDCA | See table heading |
| Perf | Are you suffering/have you ever suffered financial losses (in €) from corruption? If yes: What amount? What type? |
| Perf | Do you train your employees in anti-corruption policy and procedures? If yes: How many have you been trained last year (in percent)? |
| 4. Technology Development | |
| Perf | Are you involved in external research projects including technology, expertise, know-how or facilities? If yes: in how many? In which ones? |
| Perf | Do you have research and development partnerships? If yes: How many? Which ones? |
| Perf | How much (in €) did you invest in technological development last year? |
| Perf | On average, how many patents do you file per year? |
| 5. Armed Conflicts | |
| In advance | Do you have business activities in regions with ongoing conflicts? If no, please continue with Behavior in competition; if yes please answer the following questions: |
| PDCA | See table heading |
| Perf | Have you been involved in conflicts/have there been problems with the local community etc.? If yes: How often? Why? |
| 6. Behavior in Competition | |
| PDCA | See table heading |
| Perf | Have lawsuits been filed against you for anti-competitive behavior, forming trusts or establishing a monopoly in the past? If yes: How many? What were the results? |
| 7. Intellectual Property Rights | |
| PDCA | See table heading |
| Perf | Have there been claim against you regarding violations of intellectual property rights in the last five years (including court decisions)? If yes: How many? What kinds? |
| 8. Supplier Relationships | |
| PDCA | See table heading |
| Perf | How long are the relationships with your suppliers lasting on average in the main components? (new suggestion from one company) |
| Perf | Have there been complaints from suppliers in the last five years? If yes: How many? What was their nature? |
| 9. Social Responsibility | |
| PDCA | See table heading |
| Perf | What percentage of your suppliers did you audit last year? |
| Perf | Are you a member of an initiative for promoting social responsibility along the value chain? If yes: What initiative? |
| Perf | Do you have fair trade labels or the like? If yes: How many? Which ones? |
| 10. Freedom of Association and Collective Bargaining | |
| PLAN | Have you established (in writing) principles concerning freedom of association and the right to collective bargaining? If yes, which ones? |
| DO | Have you implemented procedures or measures regarding freedom of association and the right to collective bargaining? If yes, which ones? Are unions adequately supported within the company (availability of infrastructure, time, ability to exercise corresponding functions with pay)? Are employee/union representatives invited to participate in planning major changes at the company that will have an effect on working conditions? Are written records and decisions resulting from collective bargaining kept on file? Are minimum periods for giving notice of significant operational changes specified? Do employees have access to a neutral, binding and independent dispute resolution process or an independent counseling office? Other: |
| CHECK | Have you introduced control mechanisms for verifying whether all employees are ensured freedom of association and the right to collective bargaining? If yes, which ones? |
| ACT | Have you established procedures for responding to violations of freedom of association and the right to collective bargaining in your company? If yes, which ones? |
| Perf | What percentage of your employees are covered by collective bargaining agreements? |
| Perf | Have there been complaints from employees concerning freedom of association or the right to collective bargaining in the last five years? If yes: How many? What kind? |
| 11. Child Labor | |
| PLAN | Have you established (in writing) principles for preventing child labor? If yes, which ones? |
| DO | Have you developed procedures or measures to prevent child labor or improve the situation for working children? If yes, which ones? Do you verify the actual age of new employees by means of official documentation? If yes, what percentage? (new suggestion from one company)Are records of employees’ name and age or date of birth kept on file? Are working school-age children allowed to attend school (with their parents being compensated for the lost income)? Other: |
| CHECK | Have you introduced control mechanisms for identifying child labor (including external control offices etc.)? If yes, which ones? |
| ACT | Have you established procedures for responding to child labor? If yes, which ones? |
| Perf | How old do employees have to be in order to perform dangerous tasks? |
| Perf | How old is your youngest employee? |
| Perf | Have there been complaints concerning child labor in the last five years? If yes: How many? What was their nature? |
| 12. Salary | |
| PLAN | Have you established (in writing) fair wage principles for your employees? If yes, which ones? |
| DO | Have you developed procedures or measures for implementing fair wages for your employees? If yes, which ones? |
| CHECK/ACT | Have you established procedures to regularly review and adjust the fair wages? If yes, which ones? |
| Perf | How much (in €) does your lowest paid full-time employee earn? |
| Perf | How much (in €) does an employee with an average wage earn at your company? |
| Perf | At what intervals are your employees paid? |
| Perf | How many days of paid vacation do your employees receive per year? |
| Perf | Is overtime of employees paid? If no, is there another compensation? |
| Perf | How do you influence the wages of your temporary workers? |
| Perf | Have there been complaints about wages in the last five years? If yes: How many? What was their nature? |
| 13. Hours of Work | |
| PDCA | See table heading |
| Perf | Do your workers have individual flexibility in their hours? If yes, which ones? |
| Perf | On average, how many hours do employees work each week? |
| Perf | What is the maximum number of hours employees work per week (full time)? |
| Perf | After how many consecutive days are employees given at least one day off? |
| Perf | How many part-time employees work for you (in percent)? |
| 14. Forced Labor | |
| PLAN | Have you established (in writing) principles for preventing forced labor? If yes, which ones? |
| DO | Have you developed procedures or measures for preventing forced labor? If yes, which ones? Do your employment contracts establish pay, hours, vacation and conditions for termination? Do you deliver original documents belonging to the employee to the employees again? Employees voluntarily agree to the terms of employment. Other: |
| CHECK | Have you introduced control mechanisms for identifying forced labor (including external control offices)? If yes, which ones? |
| ACT | Have you established procedures for responding to forced labor? If yes, which ones? |
| Perf | Have there been complaints about forced labor in the last five years? If yes: How many? What was their nature? |
| 15. Equal Opportunities | |
| PDCA | See table heading |
| Perf | What is the composition of your governing bodies and break-down of your employees (in percent) by gender, age group and minority group membership (elderly, disabled, religion)? |
| Perf | What is the base pay for women (in €)? |
| Perf | What is the base pay for men (in €)? |
| Perf | How many women are in the management level? (new suggestion from one company) |
| Perf | How many (severely) disabled persons work for you? |
| Perf | Have there been incidents of discrimination in the last five years? If yes: How many? Which ones? |
| 16. Health and Safety | |
| PLAN | Have you established (in writing) principles for ensuring and promoting employee health and safety? If yes, which ones? |
| DO | Have you developed measures or procedures for ensuring/promoting employee health and safety? If yes, which ones? Are you certified according to OHSAS 18001? Are there measures in place (training, protective clothing, etc.) to prevent accidents and illnesses? Are there measures in place for accidents or hazardous situation (e.g., emergency plans)? Do employees have a way to report risks, make suggestions for improvement, etc. to a responsible authority? Do you have an employee counseling program? Do you have programs to combat locally significant health issues? Other: |
| CHECK | Have you introduced control mechanisms for monitoring compliance? If yes, which ones? |
| ACT | Have you established procedures for responding to problems with the above-mentioned measures or procedures? If yes, which ones? |
| Perf | Last year, how many injuries and non-fatal workplace accidents occurred? |
| Perf | Last year, how many fatal workplace accidents occurred? |
| Perf | Have there occurred occupational illnesses in the last five years? If yes: How many? What kinds? |
| 17. Social Benefits/Social Security | |
| PDCA | See table heading |
| Perf | What social benefits/social security do you offer? |
| Perf | How much (in €) do you spend on social benefits/social security? |
| Perf | Are any benefits provided to full-time employees only? If yes, which ones? |
| Perf | How long (in days) do you continue paying wages in cases of maternity leave? |
| Perf | How long (in days) do you continue paying wages in cases of employee sickness? |
| 18. Education and Training | |
| PDCA | See table heading |
| Perf | How much (in €) do you spend on education and training of your employees? |
| Perf | What percentages of skilled and unskilled workers do you employ? |
| Perf | What percentage of trainees/apprentices do you employ? |
| Perf | What percentage of your employees attend education and training courses? |
| Perf | What is the average number of days spent on education/training per employee per year? |
| 19. Job Security | |
| PLAN | See table heading |
| Perf | What percentages of permanent employees, fixed-term employees, workers from temporary staffing agencies and from contractors do you have? |
| Perf | How many employees (in percent) are dismissed each year as a share of your total workforce? |
| Perf | How much has your headcount risen or fallen in the last five years (divided by age, gender and religion)? |
| 20. Subjective Job Satisfaction | |
| PDCA | See table heading |
| Perf | What were the results of your last survey meaning for example what percentage of the employees are satisfied? |
| Perf | Were all the responses confidential? |
| Perf | Do you communicate your results with your employees? |
| 21. Delocalization | |
| PDCA | See table heading |
| Perf | How many people had to be displaced because of the company? |
| Perf | In recent years, have there been any complaints regarding delocalization? If yes: How many? What kind? |
| 22. Migration | |
| PDCA | See table heading |
| Perf | Do you offer annual language and integration courses for foreign/migrant workers? |
| Perf | In recent years, have there been any complaints regarding this issue? If yes: How many? What kind? |
| 23. Dialogue with the Local Community | |
| PDCA | See table heading |
| Perf | Do you meet with stakeholder groups (independent from current events)? If yes: With how many? How often? In what form? |
| Perf | How do you support community initiatives (through volunteer work or finances)? |
| Perf | Have you violated any rules of local political or social governing bodies? If yes: In what manner? How often? |
| 24. Local Heritage | |
| PDCA | See table heading |
| Perf | Have there been complaints concerning disregard for the local cultural heritage in the past 5 years? If yes: How often? What kind? |
| 25. Indigenous Rights | |
| In advance | Are you active in a region where there are indigenous populations? If no, please continue with Access to immaterial resources; if yes please answer the following questions: |
| PDCA | See table heading |
| Perf | Do you meet with indigenous populations? If yes: How often? In what form? |
| Perf | Have there been complaints concerning disregard for the rights of the Indigenous populations in the past 5 years? If yes: How often? Which ones? |
| 26. Local Employment | |
| PDCA | See table heading |
| Perf | What percentage of your employees are hired locally (radius 100 km)? |
| Perf | What percentage of your suppliers do business locally (radius 100 km)? |
| 27. Access to Immaterial Resources | |
| PDCA | See table heading |
| Perf | Do you have education initiatives for the local community? If yes: How many? What kind? |
| 28. Access to Material Resources | |
| PDCA | See table heading |
| Perf | Do you provide infrastructure facilities for the community? If yes, which ones? |
| Perf | Does the company have a certified environmental management system? |
| 29. Safe and Healthy Living Conditions | |
| In advance | What health risks and opportunities does the population have in the area surrounding the company? Does the company handle radioactive materials and/or promote activities in the field of nuclear weapons/nuclear energy or genetic engineering? Have you established (in writing) principles concerning health issues in the local sur-rounding area? If yes, which ones? |
| PDCA | See table heading |
| Perf | How many fatal/non-fatal accidents have there been in the local surrounding area in the last 5 years related to the company’s activities? |
| Perf | Have there been complaints in the last 5 years concerning health issues in the local surrounding area related to the company’s activities? If yes: How many? What kind? |
| 30. Secure Living Conditions | |
| PDCA | See table heading |
| Perf | Have there been lawsuits/complaints about secure living conditions in the last 5 years? If yes: How often? What kind? |
Appendix B. Detailed Information on the Case Studies of the Life Cycle Approach
Appendix B.1. Data on the Mass and Energy Flows


| Process | Material Input | Material Output | Energy Consumption | Source |
|---|---|---|---|---|
 | – | 11.3 kg Iron ore | 0.0423 MJ Diesel 0.0211 kWh Electricity | [116] (Part II, pp. 10, 13) |
 | – | 4.63 kg Coal | 0.303 MJ Diesel 0.0352 MJ Useful heat 0.0837 kWh Electricity | [117] (p. 54) Country of origin is mainly Australia: Lower calorific value (hard coal): 27.5 MJ/kg (GaBi) |
 | – | 0.0228 kg Manganese ore | 0.00182 MJ Diesel 0.000172 kWh Electricity | [116] (Part VII, pp. 18 f.) |
 | 0.0228 kg Manganese ore | 0.00979 kg Ferromanganese | 0.0252 kWh Electricity | [116] (Part VII, pp. 26 f.) |
 | 11.3 kg Iron ore 3.36 kg Steel from recycling 4.63 kg Coal 0.00979 kg Ferromanganese | 9.44 kg Steel coil | The production of steel coils was considered self-sufficient due to coke production. | GaBi, Steel coil, cold-rolled |
 | 9.44 kg Steel coil | 5.90 kg Component | 1.65 MJ Useful heat 1.80 kWh Electricity | GaBi, DE steel sheet metal deep drawing (multistage) |
 | 3.54 kg Offcuts | 3.36 kg Steel | 1.42 kWh Electricity | [116] (Part II, pp. 57 ff.) |
 | 5.90 kg Component | 5.90 kg Component | 1212 MJ Diesel | – |
 | 1.18 kg Component | 1.18 kg Component | 0.00488 kWh Electricity | [105] (p. 139) |
 | 4.72 kg Component | 4.72 kg Component | 0.478 kWh Electricity | [105] (p. 139) |
| Process | Material Input | Material Output | EnergyConsumption | Source |
|---|---|---|---|---|
 | – | 18.2 kg Bauxite | 0.237 MJ Thermal energy 0.00810 kWh Electricity | [104] (p. 23) |
 | 18.2 kg Bauxite | 8.29 kg Aluminum oxide | 78.9 MJ Thermal energy 2.00 kWh Electricity | [104] (p. 24) |
 | 8.29 kg Aluminum oxide | 4.31 kg Liquid aluminum | 63.9 kWh Electricity | [104] (p. 27) |
 | 2.26 kg Anode | 0.461 kg Anode residues | 6.14 MJ Thermal energy 0.333 kWh Electricity | [104] (p. 25) |
 | 4.31 kg Liquid Aluminum | 4.28 kg Ingots | 5.49 MJ Thermal energy 0.542 kWh Electricity | [104] (p. 29) |
 | 4.28 kg Ingots 2.35 kg Aluminum from recycling | 6.61 kg Aluminum sheets | 5.49 MJ Thermal energy 0.542 kWh Strom | [104] (p. 41) |
 | 2.48 kg Offcuts | 2.35 kg Aluminum | 7.93 MJ Thermal energy 0.313 kWh Electricity | [104] (p. 41) |
 | 6.61 kg Aluminum sheets | 4.13 kg Component | 13.8 MJ Thermal energy 4.37 kWh Electricity | GaBi, DE Aluminium sheet deep drawing |
 | 4.13 kg Component | 4.13 kg Component | 708 MJ Diesel | – |
 | 3.30 kg Component | 3.30 kg Component | 0.0137 kWh Electricity | [105] (p. 139) |
 | 0.826 kg Component | 0.826 kg Component | 0.0836 kWh Electricity | [105] (p. 139) |
 | 0.826 kg Scrap | 0.826 kg Scrap | 0.00258 kWh Electricity | [105] (p. 139) |
| Process | Material Input | Material Output | Energy Consumption | Source |
|---|---|---|---|---|
| Electricity | ||||
| Hard coal from mine | – | 0.417 kg Hard coal | 0.03 MJ 0.0147 MJ Useful heat (see below) 0.00746 kWh Electricity | [117] (p. 54) The hard coal of the company surveyed comes mainly from Chile, Colombia, South Africa and Australia. An average lower calorific value of 26.3 MJ/kg was assumed. |
| Hard coal in the power plant DE | 0.417 kg Hard coal | 10.0 MJ Hard coal | 0.00724 MJ Fuel oil | [117] (p. 91) |
| Electricity from power plant DE | 10.0 MJ Hard coal | 1.00 kWh Electricity | – | [117] (p. 186) |
| Diesel | ||||
| Crude oil from onshore production RAF | – | 0.970 kg Crude oil | 0.343 MJ Diesel 128 MJ Natural gas 1.94 MJ Natural gas/sweet gas 0.175 MJ Sweet gas 0.233 MJ Fuel oil S 0.0179 kWh Electricity | [110] (p. 96) |
| Diesel, from refinery RER | 0.970 kg Crude oil | 1.00 kg Diesel | 1.69 MJ Naphtha 0.680 MJ Fuel oil S 0.0245 kWh Electricity 2.06 MJ Refinery gas | [110] (p. 165) |
| Diesel, low in sulfur, from refinery RER | 1.00 kg Diesel | 1.00 kg Diesel, low in sulfur | 0.0427 MJ Fuel oil S0.124 MJ Refinery gas 0.00147 kWh Electricity | [110] (p. 171) |
| Useful heat | ||||
| Hard coal, in industrial furnaces 1–10 MW RER | 0.0433 kg Hard coal mix | 1.25 MJ Hard coal | 0.00521 kWh Electricity | [117] (p. 217) |
| Useful heat, hard coal, from industrial furnaces 1–10 MW RER | 1.25 MJ Hard coal | 1 MJ Useful heat | – | [117] (p. 224) |
Appendix B.2. Social Data of Companies
| Process Step | Material | Electricity | Mineral Oil | Sum Per Process Step |
|---|---|---|---|---|
| Working hours (in h) | ||||
| Iron ore mining | 1.07 × 10⁻² | 2.92 × 10⁻⁵ | 2.33 × 10⁻⁶ | 1.07 × 10⁻² |
| Hard coal mining | 3.34 × 10⁻³ | 1.16 × 10⁻⁴ | 1.66 × 10⁻⁵ | 3.48 × 10⁻³ |
| Manganese ore mining | 8.05 × 10⁻⁵ | 2.43 × 10⁻⁷ | 9.89 × 10⁻⁸ | 8.09 × 10⁻⁵ |
| Ferromanganese production | – | 3.47 × 10⁻⁵ | 4.01 × 10⁻⁸ | 3.47 × 10⁻⁵ |
| Steel coil production | 2.18 × 10⁻² | – | – | 2.18 × 10⁻² |
| Component production | 5.01 × 10⁻¹ | 2.49 × 10⁻³ | 9.23 × 10⁻⁵ | 5.04 × 10⁻¹ |
| Recycling | – | 1.97 × 10⁻³ | – | 1.97 × 10⁻³ |
| Use phase | – | 3.80 × 10⁻³ | 6.56 x 10⁻² | 6.94 × 10⁻² |
| Dismantling | 2.24 × 10⁻² | 6.73 × 10⁻⁶ | 7.78 × 10⁻⁹ | 2.24 × 10⁻² |
| Shredding | 4.89 × 10⁻³ | 6.59 × 10⁻⁴ | 7.62 × 10⁻⁷ | 5.55 × 10⁻³ |
| Turnover (in €) | ||||
| Iron ore mining | 1.10 | 1.98 × 10⁻² | 2.47 × 10⁻³ | 1.13 |
| Hard coal mining | 7.98 × 10⁻¹ | 7.90 × 10⁻² | 1.76 × 10⁻² | 8.94 × 10⁻¹ |
| Manganese ore mining | 1.22 × 10⁻² | 1.65 × 10⁻⁴ | 1.05 × 10⁻⁴ | 1.24 × 10⁻² |
| Ferromanganese production | – | 2.36 × 10⁻² | 4.26 × 10⁻⁵ | 2.36 × 10⁻² |
| Steel coil production | 8.72 | – | – | 8.72 |
| Component production | 3.98 × 10+2 | 1.69 | 9.81 × 10⁻² | 4.00 × 10+2 |
| Recycling | – | 1.33 | – | 1.33 |
| Use phase | – | 2.58 | 6.98 × 10+1 | 7.23 × 10+1 |
| Dismantling | 2.31 | 4.57 × 10⁻³ | 8.27 × 10⁻⁶ | 2.32 |
| Shredding | 2.11 | 4.47 × 10⁻¹ | 8.10 × 10⁻⁴ | 2.56 |
| Number of accidents | ||||
| Iron ore mining | 7.49 × 10⁻⁹ | 6.53 × 10⁻¹¹ | 1.16 × 10⁻¹¹ | 7.56 × 10⁻⁹ |
| Hard coal mining | 1.92 × 10⁻⁹ | 2.60 × 10⁻¹⁰ | 8.28 × 10⁻¹¹ | 2.27 × 10⁻⁹ |
| Manganese ore mining | 1.18 × 10⁻¹⁰ | 5.44 × 10⁻¹³ | 4.95 × 10⁻¹³ | 1.19 × 10⁻¹⁰ |
| Ferromanganese production | – | 7.76 × 10⁻¹¹ | 2.01 × 10⁻¹³ | 7.78 × 10⁻¹¹ |
| Steel coil production | 1.45 × 10⁻⁷ | – | – | 1.45 × 10⁻⁷ |
| Component production | 3.81 × 10⁻⁶ | 5.57 × 10⁻⁹ | 4.62 × 10⁻¹⁰ | 3.81 × 10⁻⁶ |
| Recycling | – | 4.39 × 10⁻⁹ | – | 1.46 × 10⁻⁹ |
| Use phase | – | 8.49 × 10⁻⁹ | 3.28 × 10⁻⁷ | 3.37 × 10⁻⁷ |
| Dismantling | 1.19 × 10⁻⁶ | 1.50 × 10⁻¹¹ | 3.89 × 10⁻¹⁴ | 1.19 × 10⁻⁶ |
| Shredding | 8.99 × 10⁻⁸ | 1.47 × 10⁻⁹ | 3.81 × 10⁻¹² | 9.14 × 10⁻⁸ |
| Number of fatal accidents | ||||
| Iron ore mining | 4.65 × 10⁻¹⁰ | 2.03 × 10⁻¹² | 1.90 × 10⁻¹³ | 4.67 × 10⁻¹⁰ |
| Hard coal mining | 4.54 × 10⁻¹¹ | 8.09 × 10⁻¹² | 1.35 × 10⁻¹² | 5.48 × 10⁻¹¹ |
| Manganese ore mining | 0 | 1.69 × 10⁻¹⁴ | 8.08 × 10⁻¹⁵ | 2.50 × 10⁻¹⁴ |
| Ferromanganese production | – | 2.41 × 10⁻¹² | 3.28 × 10⁻¹⁵ | 2.42 × 10⁻¹² |
| Steel coil production | 0 | – | – | 0 |
| Component production | 3.75 × 10⁻⁹ | 1.73 × 10⁻¹⁰ | 7.54 × 10⁻¹² | 3.93 × 10⁻⁹ |
| Recycling | – | 1.37 × 10⁻¹⁰ | – | 1.37 × 10⁻¹⁰ |
| Use phase | – | 2.64 × 10⁻¹⁰ | 5.36 × 10⁻⁹ | 5.62 × 10⁻⁹ |
| Dismantling | 0 | 4.68 × 10⁻¹³ | 6.35 × 10⁻¹⁶ | 4.68 × 10⁻¹³ |
| Shredding | 0 | 4.58 × 10⁻¹¹ | 6.22 × 10⁻¹⁴ | 4.59 × 10⁻¹¹ |
| Number of training hours (in h) | ||||
| Iron ore mining | 3.09 × 10⁻⁴ | 8.09 × 10⁻⁷ | 5.80 × 10⁻⁸ | 3.10 × 10⁻⁴ |
| Hard coal mining | 1.16 × 10⁻⁴ | 3.22 × 10⁻⁶ | 4.13 × 10⁻⁷ | 1.19 × 10⁻⁴ |
| Manganese ore mining | 1.09 × 10⁻⁶ | 6.73 × 10⁻⁹ | 2.47 × 10⁻⁹ | 1.10 × 10⁻⁶ |
| Ferromanganese production | – | 9.61 × 10⁻⁷ | 1.00 × 10⁻⁹ | 9.62 × 10⁻⁷ |
| Steel coil production | 3.98 × 10⁻⁴ | – | – | 3.98 × 10⁻⁴ |
| Component production | 1.11 × 10⁻² | 6.90 × 10⁻⁵ | 2.30 × 10⁻⁶ | 1.11 × 10⁻² |
| Recycling | – | 5.44 × 10⁻⁵ | – | 5.44 × 10⁻⁵ |
| Use phase | – | 1.05 × 10⁻⁴ | 1.64 × 10⁻³ | 1.74 × 10⁻³ |
| Dismantling | 2.48 × 10⁻⁴ | 1.86 × 10⁻⁷ | 1.94 × 10⁻¹⁰ | 2.48 × 10⁻⁴ |
| Shredding | 6.74 × 10⁻⁶ | 1.82 × 10⁻⁵ | 1.90 × 10⁻⁸ | 2.50 × 10⁻⁵ |
| Working hours with collective agreements | ||||
| Iron ore mining | 96% | 87% | 68% | 96% |
| Hard coal mining | 50% | 87% | 68% | 51% |
| Manganese ore mining | 100% | 87% | 68% | 100% |
| Ferromanganese production | – | 87% | 68% | 87% |
| Steel coil production | 99% | – | – | 99% |
| Component production | 95% | 87% | 68% | 95% |
| Recycling | – | 87% | – | 87% |
| Use phase | – | 87% | 68% | 69% |
| Dismantling | 80% | 87% | 68% | 80% |
| Shredding | 90% | 87% | 68% | 90% |
| Process Step | Material | Electricity | Mineral Oil | Sum Per Process Step |
|---|---|---|---|---|
| Working hours (in h) | ||||
| Ingot production | 1.88 × 10⁻³ | 9.24 × 10⁻² | 5.02 × 10⁻³ | 9.93 × 10⁻² |
| Aluminum sheet production | 4.57 × 10⁻² | 6.69 × 10⁻³ | 1.24 × 10⁻³ | 5.36 × 10⁻² |
| Component production | 3.51 × 10⁻¹ | 1.77 × 10⁻³ | 2.05 × 10⁻⁶ | 3.52 × 10⁻¹ |
| Recycling | – | 4.57 × 10⁻⁴ | 4.30 × 10⁻⁴ | 8.86 × 10⁻⁴ |
| Use phase | – | 2.22 × 10⁻³ | 3.84 × 10⁻² | 4.06 × 10⁻² |
| Dismantling | 6.28 × 10⁻² | 1.88 × 10⁻⁵ | 2.18 × 10⁻⁸ | 6.29 × 10⁻² |
| Shredding | 8.56 × 10⁻⁴ | 1.15 × 10⁻⁴ | 1.33 × 10⁻⁷ | 9.71 × 10⁻⁴ |
| Floating and sinking plant | – | 3.56 × 10⁻⁶ | 4.11 × 10⁻⁹ | 3.56 × 10⁻⁶ |
| Turnover (in €) | ||||
| Ingot production | 3.24 × 10+2 | 6.27 × 10+1 | 5.34 | 3.92 × 10+2 |
| Aluminum sheet production | 1.69 × 10+1 | 4.54 | 1.32 | 2.28 × 10+1 |
| Component production | 3.98 × 10+2 | 1.20 | 2.18 × 10⁻³ | 3.99 × 10+2 |
| Recycling | – | 3.10 × 10⁻¹ | 4.57 × 10⁻¹ | 7.67 × 10⁻¹ |
| Use phase | – | 1.51 | 4.08 × 10+1 | 4.23 × 10+1 |
| Dismantling | 9.24 | 1.28 × 10⁻² | 2.31 × 10⁻⁵ | 9.26 |
| Shredding | 3.70 × 10⁻¹ | 7.83 × 10⁻² | 1.42 × 10⁻⁴ | 4.49 × 10⁻¹ |
| Floating and sinking plant | – | 2.42 × 10⁻³ | 4.37 × 10⁻⁶ | 2.42 × 10⁻³ |
| Number of accidents | ||||
| Ingot production | 3.48 × 10⁻⁹ | 2.06 × 10⁻⁷ | 2.51 × 10⁻⁸ | 2.35 × 10⁻⁷ |
| Aluminum sheet production | 4.57 × 10⁻⁸ | 1.50 × 10⁻⁸ | 6.20 × 10⁻⁹ | 6.69 × 10⁻⁸ |
| Component production | 2.66 × 10⁻⁶ | 3.96 × 10⁻⁹ | 1.02 × 10⁻¹¹ | 2.67 × 10⁻⁶ |
| Recycling | – | 1.02 × 10⁻⁹ | 2.15 × 10⁻⁹ | 3.17 × 10⁻⁹ |
| Use phase | – | 4.96 × 10⁻⁹ | 1.92 × 10⁻⁷ | 1.97 × 10⁻⁷ |
| Dismantling | 3.33 × 10⁻⁶ | 4.21 × 10⁻¹¹ | 1.09 × 10⁻¹³ | 3.33 × 10⁻⁶ |
| Shredding | 1.57 × 10⁻⁸ | 2.58 × 10⁻¹⁰ | 6.66 × 10⁻¹³ | 1.60 × 10⁻⁸ |
| Floating and sinking plant | – | 7.96 × 10⁻¹² | 2.06 × 10⁻¹⁴ | 7.98 × 10⁻¹² |
| Number of fatal accidents | ||||
| Ingot production | 3.00 × 10⁻¹¹ | 6.42 × 10⁻⁹ | 4.10 × 10⁻¹⁰ | 6.86 × 10⁻⁹ |
| Aluminum sheet production | 2.36 × 10⁻⁹ | 4.65 × 10⁻¹⁰ | 1.01 × 10⁻¹⁰ | 2.93 × 10⁻⁹ |
| Component production | 2.63 × 10⁻⁹ | 4.65 × 10⁻¹⁰ | 1.67 × 10⁻¹³ | 3.09 × 10⁻⁹ |
| Recycling | – | 3.17 × 10⁻¹¹ | 3.51 × 10⁻¹¹ | 6.68 × 10⁻¹¹ |
| Use phase | – | 1.54 × 10⁻¹⁰ | 3.13 × 10⁻⁹ | 3.29 × 10⁻⁹ |
| Dismantling | 0 | 1.31 × 10⁻¹² | 1.78 × 10⁻¹⁵ | 1.31 × 10⁻¹² |
| Shredding | 0 | 8.02 × 10⁻¹² | 1.09 × 10⁻¹⁴ | 8.03 × 10⁻¹² |
| Floating and sinking plant | – | 2.47 × 10⁻¹³ | 3.36 × 10⁻¹⁶ | 2.48 × 10⁻¹³ |
| Number of training hours (in h) | ||||
| Ingot production | Not published | 2.56 × 10⁻³ | 1.25 × 10⁻⁴ | 2.68 × 10⁻³ |
| Aluminum sheet production | 5.44 × 10⁻⁴ | 1.85 × 10⁻⁴ | 3.09 × 10⁻⁵ | 7.60 × 10⁻⁴ |
| Component production | 7.74 × 10⁻³ | 4.91 × 10⁻⁵ | 5.11 × 10⁻⁸ | 7.79 × 10⁻³ |
| Recycling | – | 1.26 × 10⁻⁵ | 1.07 × 10⁻⁵ | 2.34 × 10⁻⁵ |
| Use phase | – | 6.14 × 10⁻⁵ | 9.56 × 10⁻⁴ | 1.02 × 10⁻³ |
| Dismantling | 6.93 × 10⁻⁴ | 5.22 × 10⁻⁷ | 5.43 × 10⁻¹⁰ | 6.94 × 10⁻⁴ |
| Shredding | 1.18 × 10⁻⁶ | 3.19 × 10⁻⁶ | 3.32 × 10⁻⁹ | 4.38 × 10⁻⁶ |
| Floating and sinking plant | 5.44 × 10⁻⁴ | 9.85 × 10⁻⁸ | 1.03 × 10⁻¹⁰ | 9.86 × 10⁻⁸ |
| Working hours with collective agreements | ||||
| Ingot production | 68% | 87% | 85% | 86% |
| Aluminum sheet production | 68% | 87% | 69% | 71% |
| Component production | 68% | 87% | 95% | 95% |
| Recycling | 68% | 87% | – | 77% |
| Use phase | 68% | 87% | – | 69% |
| Dismantling | 68% | 87% | 80% | 80% |
| Shredding | 68% | 87% | 90% | 90% |
| Floating and sinking plant | 68% | 87% | 85% | 87% |
| Yes | No | Not Relevant | No Answer | |
|---|---|---|---|---|
| 1. Public Commitment to (Social) Sustainability | ||||
| PLAN | 9 | |||
| DO/CHECK | 9 | |||
| ACT | 8 | 1 | ||
| 3. Corruption | ||||
| PLAN | 8 | 1 | ||
| DO | 8 | 1 | ||
| CHECK | 8 | 1 | ||
| ACT | 8 | 1 | ||
| 5. Armed Conflicts | ||||
| PLAN | 4 | 4 | 1 | |
| DO | 2 | 4 | ||
| CHECK | 4 | |||
| ACT | 1 | 4 | ||
| 6. Behavior in Competition | ||||
| PLAN | 8 | 1 | ||
| DO | 7 | 1 | 1 | |
| CHECK | 6 | 1 | 2 | |
| ACT | 8 | 1 | ||
| 7. Intellectual Property Rights | ||||
| PLAN | 4 | 1 | 4 | |
| DO | 3 | 1 | 5 | |
| CHECK | 2 | 2 | 5 | |
| ACT | 3 | 2 | 4 | |
| 8. Supplier Relationships | ||||
| PLAN | 8 | 1 | ||
| DO | 5 | 1 | 3 | |
| CHECK | 6 | 1 | 2 | |
| ACT | 6 | 1 | 2 | |
| 9. Social Responsibility | ||||
| PLAN | 7 | 2 | ||
| DO | 7 | 2 | ||
| CHECK | 5 | 2 | 2 | |
| ACT | 4 | 2 | 3 | |
| 10. Freedom of Association and Collective Bargaining | ||||
| PLAN | 8 | 1 | ||
| DO | 8 | 1 | ||
| CHECK | 6 | 2 | 1 | |
| ACT | 7 | 1 | 1 | |
| 11. Child Labor | ||||
| PLAN | 6 | 1 | 2 | |
| DO | 6 | 1 | 2 | |
| CHECK | 5 | 1 | 2 | 1 |
| ACT | 6 | 1 | 2 | |
| 12. Salary | ||||
| PLAN | 9 | |||
| DO | 7 | 2 | ||
| CHECK/ACT | 8 | 1 | ||
| 13. Hours of Work | ||||
| PLAN | 6 | 3 | ||
| DO | 4 | 5 | ||
| CHECK | 4 | 5 | ||
| ACT | 4 | 5 | ||
| 14. Forced Labor | ||||
| PLAN | 6 | 1 | 2 | |
| DO | 6 | 2 | 1 | |
| CHECK | 5 | 1 | 2 | 1 |
| ACT | 6 | 1 | 2 | |
| 15. Equal Opportunities | ||||
| PLAN | 8 | 1 | ||
| DO | 7 | 1 | 1 | |
| CHECK | 6 | 2 | 1 | |
| ACT | 7 | 2 | ||
| 16. Health and Safety | ||||
| PLAN | 9 | |||
| DO | 8 | 1 | ||
| CHECK | 8 | 1 | ||
| ACT | 8 | 1 | ||
| 17. Social Benefits/Social Security | ||||
| PLAN | 5 | 1 | 3 | |
| DO | 4 | 1 | 4 | |
| CHECK | 1 | 2 | 6 | |
| ACT | 1 | 2 | 6 | |
| 18. Education and Training | ||||
| PLAN | 9 | |||
| DO | 8 | 1 | ||
| CHECK | 6 | 3 | ||
| ACT | 5 | 1 | 3 | |
| 19. Job Security | ||||
| PLAN | 4 | 2 | 3 | |
| 20. Subjective Job Satisfaction | ||||
| PLAN | 3 | 2 | 4 | |
| DO | 4 | 2 | 3 | |
| CHECK | 6 | 1 | 2 | |
| ACT | 3 | 1 | 5 | |
| 21. Delocalization | ||||
| PLAN | 7 | 1 | 1 | |
| DO | 6 | 1 | 1 | 1 |
| CHECK | 4 | 1 | 1 | 3 |
| ACT | 5 | 1 | 1 | 2 |
| 22. Migration | ||||
| PLAN | 3 | 1 | 5 | |
| DO | 1 | 1 | 7 | |
| CHECK | 1 | 1 | 7 | |
| ACT | 1 | 1 | 7 | |
| 23. Dialogue with the Local Community | ||||
| PLAN | 8 | 1 | ||
| DO | 8 | 1 | ||
| CHECK | 7 | 1 | 1 | |
| ACT | 7 | 1 | 1 | |
| 24. Local Heritage | ||||
| PLAN | 3 | 2 | 4 | |
| DO | 3 | 2 | 4 | |
| CHECK | 2 | 2 | 5 | |
| ACT | 2 | 2 | 5 | |
| 25. Indigenous Rights | ||||
| PLAN | 4 | 5 | ||
| DO | 4 | 5 | ||
| CHECK | 2 | 5 | 2 | |
| ACT | 2 | 5 | 2 | |
| 26. Local Employment | ||||
| PLAN | 6 | 3 | ||
| DO | 3 | 3 | 3 | |
| CHECK | 3 | 6 | ||
| ACT | 1 | 2 | 6 | |
| 27. Access to Immaterial Resources | ||||
| PLAN | 8 | 1 | ||
| DO | 5 | 1 | 3 | |
| CHECK | 2 | 1 | 6 | |
| ACT | 2 | 1 | 6 | |
| 28. Access to Material Resources | ||||
| PLAN | 7 | 2 | ||
| DO | 6 | 3 | ||
| CHECK | 2 | 1 | 6 | |
| ACT | 4 | 5 | ||
| 29. Safe and Healthy Living Conditions | ||||
| PLAN | 9 | |||
| DO | 9 | |||
| CHECK | 9 | |||
| ACT | 8 | 1 | ||
| 30. Secure Living Conditions | ||||
| PLAN | 8 | 1 | ||
| DO | 6 | 1 | 1 | |
| CHECK | 3 | 1 | 1 | 4 |
| ACT | 3 | 1 | 1 | 4 |
References
- Otto GmbH & Co KG. Lebensqualität. 4. Otto Group Trendstudie zum ethischen Konsum; Otto GmbH & Co KG: Hamburg, Germany, 2013; Available online: http://www.ottogroup.com/media/docs/de/trendstudie/1_Otto_Group_Trendstudie_2013.pdf (accessed on 19 June 2014).
- Brigitte. BRIGITTE KommunikationsAnalyse 2012: Sozial ist das neue Bio; Brigitte; Gruner + Jahr AG & Co KG; G+J Media Research Services: Berlin, Germany, 2012; Available online: http://www.gujmedia.de/fileadmin/redaktion/Print/Deutsch/Portfolio/Titel/brigitte/KA_2012_Druck_V10.pdf (accessed on 4 April 2015).
- Fiedler, D. Moral am Supermarktregal: Der Kauf von Bier rettet Regenwald, der von Eis hilft Bienen: Sozial-Marketing wird wichtiger. Schwäbisches Tagblatt, 21 May 2012; 20. [Google Scholar]
- Fairtrade International. Strong Producers, Strong Future. Annual Report 2013–14. 2014. Available online: http://www.fairtrade.net/fileadmin/user_upload/content/2009/resources/2013-14_AnnualReport_FairtradeIntl_web.pdf (accessed on 13 December 2014).
- Chamberlain, G. Monsoon’s internal audits reveal suppliers used child labour and underpaid workers. 2010. Available online: http://www.guardian.co.uk/business/2010/nov/21/monsoon-child-labour-india?INTCMP=ILCNETTXT3487 (accessed on 7 December 2011).
- Tief verstrickt: Deutsche Textilfirmen lassen zu menschenunwürdigen Bedingungen in China und der Dritten Welt produzieren. Der Spiegel, 21 December 1998; 52, 88–89.
- GLHR. How Can Wal-Mart Sell a Denim Shirt for $11.67? Institute for Global Labour and Human Rights (GLHR), 2005. Available online: http://www.globallabourrights.org/reports?id=0042 (accessed on 7 December 2011).
- Lee, F. Kinderarbeit für Samsung: Südkoreanischer Elektrokonzern wehrt sich gegen Vorwürfe. Schwäbisches Tagblatt, 10 August 2012; 15. [Google Scholar]
- Perras, A.; Bitala, M. Das Blut an meinem Handy. Natur+Kosmos 2011, 3, 29–33. [Google Scholar]
- Robertson, J. Apple Admits Using Child Labor: 15-Year-Olds Worked In Factories. 2010. Available online: http://www.huffingtonpost.com/2010/02/28/apple-child-labor-confess_n_479871.html (accessed on 12 January 2012).
- Bojanowski, A. Europas Gift verseucht Spielplätze in Afrika: Uno-Studie zu Elektroschrott. 2011. Available online: http://www.spiegel.de/wissenschaft/technik/0,1518,794843,00.html (accessed on 9 January 2012).
- Kaiser, M. Nigerian Carcycler. 2012. Available online: http://vimeo.com/61253899 (accessed on 17 October 2014).
- Bock, C. Toxic City. Deutscher Giftschrott für Ghana; ZDF: Mainz, Germany, 2011. [Google Scholar]
- Kerkow, U.; Martens, J.; Müller, A. Vom Erz zum Auto. Abbaubedingungen und Lieferketten im Rohstoffsektor und die Verantwortung der deutschen Automobilindustrie. Bischöfliches Hilfswerk MISEREOR e.V., Diakonisches Werk der Evangelischen Kirche in Deutschland e.V für die Aktion “Brot für die Welt”, Global Policy Forum Europe, Eds. 2012. Available online: http://www.misereor.de/fileadmin/redaktion/Vom_Erz_zum_Auto.pdf (accessed on 11 December 2012).
- Hütz-Adams, F.; Voge, A.-K.; Liese, S.; Hörmann, S.; Bethge, J.P. Nachhaltige Rohstoffe für den deutschen Automobilsektor. Herausforderungen und Lösungswege. SÜDWIND e.V., Collaborating Centre on Sustainable Consumption and Production, Global Nature Fund, Eds. 2014. Available online: http://www.suedwind-institut.de/fileadmin/fuerSuedwind/Publikationen/2014/2014-13_Nachhaltige_Rohstoffe_fuer_den_deutschen_Automobilsektor.pdf (accessed on 27 June 2014).
- UNEP/SETAC LCI. Guidelines for Social Life Cycle Assessment of Products. United Nations Environment Programme (UNEP)/Society of Environmental Toxicology and Chemistry (SETAC) Life Cycle Initiative (LCI). 2009. Available online: http://www.unep.fr/shared/publications/pdf/DTIx1164xPA-guidelines_sLCA.pdf (accessed on 20 March 2019).
- UNEP/SETAC LCI. The Methodological Sheets for Subcategories in Social Life Cycle Assessment (S-LCA). United Nations Environment Programme (UNEP)/Society of Environmental Toxicology and Chemistry (SETAC) Life Cycle Initiative (LCI). 2013. Available online: http://www.lifecycleinitiative.org/wp-content/uploads/2013/11/S-LCA_methodological_sheets_11.11.13.pdf (accessed on 12 September 2014).
- Grießhammer, R.; Buchert, M.; Gensch, C.-O.; Hochfeld, C.; Manhart, A.; Rüdenauer, I. PROSA—Product Sustainability Assessment. Endbericht. In cooperation with Ebinger, M. Öko-Institut e.V., Ed. 2007. Available online: http://www.prosa.org/fileadmin/user_upload/pdf/PROSA-gesamt_Finalversion_0407_red.pdf (accessed on 17 January 2011).
- Manhart, A.; Grießhammer, R. Soziale Auswirkungen der Produktion von Notebooks. Beitrag zur Entwicklung einer Produktnachhaltigkeitsanalyse (PROSA). 2006-010-de. Öko-Institut e.V., Ed. 2006. Available online: https://www.oeko.de/oekodoc/291/2006-010-de.pdf (accessed on 20 March 2019).
- Kruse, S.A.; Flysjö, A.; Kasperczyk, N.; Scholz, A.J. Socioeconomic indicators as a complement to life cycle assessment—An application to salmon production systems. Int. J. Life Cycle Assess. 2009, 14, 8–18. [Google Scholar] [CrossRef]
- Paragahawewa, U.; Blackett, P.; Small, B. Social Life Cycle Analysis (S-LCA): Some Methodological Issues and Potential Application to Cheese Production in New Zealand. AgResearch. 2009. Available online: http://www.saiplatform.org/uploads/Library/SocialLCA-FinalReport_July2009.pdf (accessed on 8 April 2011).
- Lehmann, A.; Russi, D.; Bala, A.; Finkbeiner, M.; Fullana-i-Palmer, P. Integration of Social Aspects in Decision Support, Based on Life Cycle Thinking. Sustainability 2011, 3, 562–577. [Google Scholar] [CrossRef]
- Hunkeler, D. Societal LCA Methodology and Case Study. Int. J. Life Cycle Assess. 2006, 11, 371–382. [Google Scholar] [CrossRef]
- Norris, G.A. Social Impacts in Product Life Cycles: Towards Life Cycle Attribute Assessment. Int. J. Life Cycle Assess. 2006, 11, 97–104. [Google Scholar] [CrossRef]
- Andrews, E.; Lesage, P.; Benoît, C.; Parent, J.; Norris, G.A.; Revéret, J.-P. Life Cycle Attribute Assessment: Case Study of Quebec Greenhouse Tomatoes. J. Ind. Ecol. 2009, 13, 565–578. [Google Scholar] [CrossRef]
- Ekener-Petersen, E.; Finnveden, G. Potential hotspots identified by social LCA: Part 1: A case study of a laptop computer. Int. J. Life Cycle Assess. 2013, 18, 127–143. [Google Scholar] [CrossRef]
- Ciroth, A.; Franze, J. LCA of an Ecolabeled Notebook—Consideration of Social and Environmental Impacts along the Entire Life Cycle. GreenDeltaTC, 2011. Available online: https://www.greendelta.com/wp-content/uploads/2017/03/LCA_laptop_final.pdf (accessed on 20 March 2019).
- Prakash, S.U.C.; Manhart, A. Socio-economic assessment and feasibility study on sustainable e-waste management in Ghana. In cooperation with Amoyaw-Osei, Y., Agyekum, O. Opoku. Öko-Institut e.V., Ed. 2010. Available online: http://www.oeko.de/oekodoc/1057/2010-105-en.pdf (accessed on 20 March 2019).
- Zamani, B.; Sandin, G.; Svanström, M.; Peters, G.M. Hotspot identification in the clothing industry using social life cycle assessment—Opportunities and challenges of input-output modelling. Int. J. Life Cycle Assess. 2018, 23, 536–546. [Google Scholar] [CrossRef]
- Blom, M.; Solmar, C. How to Socially Assess Biofuels: A Case Study of the UNEP/SETAC Code of Practice for Socialeconomical LCA. Master’s Thesis, Luleå University of Technology, Luleå, Sweden, 2009. Available online: http://ltu.diva-portal.org/smash/get/diva2:1019458/FULLTEXT01.pdf (accessed on 20 March 2019).
- Ekener-Petersen, E.; Höglund, J.; Finnveden, G. Screening potential social impacts of fossil fuels and biofuels for vehicles. Energy Policy 2014, 73, 416–426. [Google Scholar] [CrossRef]
- Traverso, M.; Asdrubali, F.; Francia, A.; Finkbeiner, M. Towards life cycle sustainability assessment: An implementation to photovoltaic modules. Int. J. Life Cycle Assess. 2012, 17, 1068–1079. [Google Scholar] [CrossRef]
- Souza, A.; Watanabe, M.D.B.; Cavalett, O.; Ugaya, C.M.L.; Bonomi, A. Social life cycle assessment of first and second-generation ethanol production technologies in Brazil. Int. J. Life Cycle Assess. 2018, 23, 617–628. [Google Scholar] [CrossRef]
- Hosseinijou, S.A.; Mansour, S.; Akbarpour Shirazi, M. Social life cycle assessment for material selection: A case study of building materials. Int. J. Life Cycle Assess. 2013, 19, 620–645. [Google Scholar] [CrossRef]
- Bozhilova-Kisheva, K.; Hu, M.; van Roekel, E. An integrated Life Cycle Inventory for demolition processes in the context of Life Cycle Sustainability Assessment. In International Symposium on Life Cycle Assessment and Construction—Civil Engineering and Buildings; Ventura, A., de La Roche, C., Eds.; CSTB: Nantes, France, 2012; pp. 327–335. [Google Scholar]
- Traverso, M. Life Cycle Sustainability Assessment—A tool for supporting decision makers. In Proceedings of the Workshop “Social Aspects of Products along the Whole Life Cycle”, Berlin, Germany, 30 May 2011; Available online: http://www.greendeltatc.com/uploads/media/TU_Berlin_Traverso.pdf (accessed on 8 June 2011).
- Ugaya, C.M.L.; Brones, F.; Corrêa, S. S-LCA: Preliminary results of Natura’s cocoa soap bar. In Proceedings of the LCM 2011—Towards Life Cycle Sustainability Management, Berlin, Germany, 28–31 August 2011; Available online: http://www.lcm2011.org/papers.html (accessed on 12 January 2012).
- Sanchez Ramirez, P.; Petti, L.; Ugaya, C.M.L. Subcategory Assessment Method for Social LCA: A First Application on the Wine Sector. In Pathways to Environmental Sustainability: Methodologies and Experiences; Salomone, R., Saija, G., Eds.; Springer International Publishing: Cham, Switzerland, 2014; pp. 107–116. ISBN 978-3-319-03826-1. [Google Scholar]
- Franze, J.; Ciroth, A. Social Life Cycle Assessment of Roses. A Comparison of Cut Roses from Ecuador and the Netherlands. In Proceedings of the SETAC Annual Meeting, Sevilla, Spain, 25 May 2010. [Google Scholar]
- Revéret, J.-P.; Couture, J.-M.; Parent, J. Socioeconomic LCA of Milk Production in Canada. In Social Life Cycle Assessment: An Insight; Muthu, S.S., Ed.; Springer: Singapore, 2015; pp. 25–69. ISBN 978-981-287-295-1. [Google Scholar]
- Manik, Y.; Leahy, J.; Halog, A. Social life cycle assessment of palm oil biodiesel: A case study in Jambi Province of Indonesia. Int. J. Life Cycle Assess. 2013, 18, 1386–1392. [Google Scholar] [CrossRef]
- Nemarumane, T.M.; Mbohwa, C. Social Life Cycle Assessment in the South African Sugar Industry: Issues and Views. In Social Life Cycle Assessment: An Insight; Muthu, S.S., Ed.; Springer: Singapore, 2015; pp. 71–113. ISBN 978-981-287-295-1. [Google Scholar]
- Martinéz-Blanco, J.; Lehmann, A.; Muñoz, P.; Antón, A.; Traverso, M.; Rieradevall, J.; Finkbeiner, M. Application challenges for the social LCA of fertilizers within Life Cycle Sustainability Assessment. J. Clean. Prod. 2014, 69, 34–48. [Google Scholar] [CrossRef]
- Chang, Y.-J.; Sproesser, G.; Neugebauer, S.; Wolf, K.; Scheumann, R.; Pittner, A.; Rethmeier, M.; Finkbeiner, M. Environmental and Social Life Cycle Assessment of Welding Technologies. Procedia CIRP 2015, 26, 293–298. [Google Scholar] [CrossRef]
- Tsurukawa, N.; Prakash, S.; Manhart, A. Social Impacts of Artisanal Cobalt Mining in Katanga, Democratic Republic of Congo; Öko-Institut e.V., Ed. 2011. Available online: http://www.oeko.de/oekodoc/1294/2011-419-en.pdf (accessed on 17 May 2015).
- Chang, Y.-J.; Schau, E.M.; Finkbeiner, M. Application of Life Cycle Sustainability Assessment to the bamboo and aluminum bicycles in surveying social risks of developing countries. In Proceedings of the 2nd World Sustainability Forum, 1–30 November 2012. web conference. [Google Scholar]
- Lehmann, A. Lebenszyklusbasierte Nachhaltigkeitsanalyse von Technologien: Am Beispiel eines Projekts zum Integrierten Wasserressourcenmanagement. Ph.D. Dissertation, Technical University Berlin, Berlin, Germany, 2013. Available online: http://opus4.kobv.de/opus4-tuberlin/frontdoor/index/index/docId/3759 (accessed on 8 December 2013).
- Arcese, G.; Lucchetti, M.; Merli, R. Social Life Cycle Assessment as a Management Tool: Methodology for Application in Tourism. Sustainability 2013, 5, 3275–3287. [Google Scholar] [CrossRef]
- Foolmaun, R.K.; Ramjeeawon, T. Comparative life cycle assessment and social life cycle assessment of used polyethylene terephthalate (PET) bottles in Mauritius. Int. J. Life Cycle Assess. 2013, 18, 155–171. [Google Scholar] [CrossRef]
- Aparcana, S.; Salhofer, S. Application of a methodology for the social life cycle assessment of recycling systems in low income countries: Three Peruvian case studies. Int. J. Life Cycle Assess. 2013, 18, 1116–1128. [Google Scholar] [CrossRef]
- Vinyes, E.; Oliver-Solà, J.; Ugaya, C.M.L.; Rieradevall, J.; Gasol, C.M. Application of LCSA to used cooking oil waste management. Int. J. Life Cycle Assess. 2013, 18, 445–455. [Google Scholar] [CrossRef]
- Petti, L.; Serreli, M.; Di Cesare, S. Systematic literature review in social life cycle assessment. Int. J. Life Cycle Assess. 2016, 23, 422–431. [Google Scholar] [CrossRef]
- Musaazi, M.K.; Mechtenberg, A.R.; Nakibuule, J.; Sensenig, R.; Miyingo, E.; Makanda, J.V.; Hakimian, A.; Eckelman, M.J. Quantification of social equity in life cycle assessment for increased sustainable production of sanitary products in Uganda. J. Clean. Prod. 2015, 96, 569–579. [Google Scholar] [CrossRef]
- Weldegiorgis, F.S.; Franks, D.M. Social dimensions of energy supply alternatives in steelmaking: Comparison of biomass and coal production scenarios in Australia. J. Clean. Prod. 2014, 84, 281–288. [Google Scholar] [CrossRef]
- Bouzid, A.; Padilla, M. Analysis of social performance of the industrial tomatoes food chain in Algeria. New Medit. 2014, 13, 60–65. [Google Scholar]
- Baumann, H.; Arvidsson, R.; Tong, H.; Wang, Y. Does the Production of an Airbag Injure more People than the Airbag Saves in Traffic? J. Ind. Ecol. 2013, 17, 517–527. [Google Scholar] [CrossRef]
- Moran, D.; McBain, D.; Kanemoto, K.; Lenzen, M.; Geschke, A. Global Supply Chains of Coltan. J. Ind. Ecol. 2015, 19, 357–365. [Google Scholar] [CrossRef]
- Subramanian, V.; Semenzin, E.; Zabeo, A.; Saling, P.; Ligthart, T.; van Harmelen, T.; Malsch, I.; Hristozov, D.; Marcomini, A. Assessing the social impacts of nano-enabled products through the life cycle: The case of nano-enabled biocidal paint. Int. J. Life Cycle Assess. 2018, 23, 348–356. [Google Scholar] [CrossRef]
- Finkbeiner, M.; Schau, E.M.; Lehmann, A.; Traverso, M. Towards Life Cycle Sustainability Assessment. Sustainability 2010, 2, 3309–3322. [Google Scholar] [CrossRef]
- Parent, J.; Cucuzzella, C.; Revéret, J.-P. Impact assessment in SLCA: Sorting the sLCIA methods according to their outcomes. Int. J. Life Cycle Assess. 2010, 15, 164–171. [Google Scholar] [CrossRef]
- Wu, R.; Yang, D.; Chen, J. Social Life Cycle Assessment Revisited. Sustainability 2014, 6, 4200–4226. [Google Scholar] [CrossRef]
- Chhipi-Shrestha, G.K.; Hewage, K.; Sadiq, R. ‘Socializing’ sustainability: A critical review on current development status of social life cycle impact assessment method. Clean Technol. Environ. Policy 2015, 17, 579–596. [Google Scholar] [CrossRef]
- Jørgensen, A.; Lai, L.C.H.; Hauschild, M.Z. Assessing the validity of impact pathways for child labour and well-being in social life cycle assessment. Int. J. Life Cycle Assess. 2010, 15, 5–16. [Google Scholar] [CrossRef]
- Neugebauer, S.; Traverso, M.; Scheumann, R.; Chang, Y.-J.; Wolf, J.; Finkbeiner, M. Impact Pathways to Address Social Well-Being and Social Justice in SLCA—Fair Wage and Level of Education. Sustainability 2014, 6, 4839–4857. [Google Scholar] [CrossRef]
- Benoît Norris, C. Data for social LCA. Int. J. Life Cycle Assess. 2014, 19, 261–265. [Google Scholar] [CrossRef]
- Jørgensen, A. Social LCA—A way ahead? Int. J. Life Cycle Assess. 2013, 18, 296–299. [Google Scholar] [CrossRef]
- Jørgensen, A.; Dreyer, L.C.; Wangel, A. Addressing the effect of social life cycle assessments. Int. J. Life Cycle Assess. 2012, 17, 828–839. [Google Scholar] [CrossRef]
- Macombe, C.; Leskinen, P.; Feschet, P.; Antikainen, R. Social life cycle assessment of biodiesel production at three levels: A literature review and development needs. J. Clean. Prod. 2013, 52, 205–216. [Google Scholar] [CrossRef]
- Zamagni, A.; Buttol, P.; Buonamici, R.; Masoni, P.; Guinée, J.B.; Huppes, G.; Heijungs, R.; van der Voet, E.; Ekvall, T.; Rydberg, T. D20 Blue Paper on Life Cycle Sustainability Analysis. Institute of Environmental Sciences, Leiden University. Proceedings of the CALCAS (Co-ordination Action for innovation in Life-Cycle Analysis for Sustainability). Deliverable 20 of Work Package 7 of the CALCAS project. 2009. Available online: http://www.leidenuniv.nl/cml/ssp/publications/calcas_report_d20.pdf (accessed on 8 June 2015).
- International Organization for Standardization (ISO). ISO/TS 14072: Environmental Management—Life Cycle Assessment—Requirements and Guidelines for Organizational Life Cycle Assessment; ISO: Geneva, Switzerland, 2014. [Google Scholar]
- UNEP/SETAC LCI. Guidance on Organizational Life Cycle Assessment. United Nations Environment Programme (UNEP), Society of Environmental Toxicology and Chemistry (SETAC); Life Cycle Initiative (LCI). 2015. Available online: http://www.lifecycleinitiative.org/wp-content/uploads/2015/04/o-lca_24.4.15-web.pdf (accessed on 15 June 2015).
- Martínez-Blanco, J.; Inaba, A.; Quiros, A.; Valdivia, S.; Milà-i-Canals, L.; Finkbeiner, M. Organizational LCA: The new member of the LCA family—Introducing the UNEP/SETAC Life Cycle Initiative guidance document. Int. J. Life Cycle Assess. 2015, 20, 1045–1047. [Google Scholar] [CrossRef]
- Martínez-Blanco, J.; Lehmann, A.; Chang, Y.-J.; Finkbeiner, M. Social organizational LCA (SOLCA)—A new approach for implementing social LCA. Int. J. Life Cycle Assess. 2015, 20, 1586–1599. [Google Scholar] [CrossRef]
- Daimler Communications. Mit Bildung gegen Kinderarbeit—Daimler unterstützt soziales Projekt in der Demokratischen Republik Kongo mit über einer Million Euro. Press Release 12 May 2019. Available online: https://media.daimler.com/marsMediaSite/de/instance/print/Mit-Bildung-gegen-Kinderarbeit--Daimler-unterstu-etzt-soziales-Projekt-in-der-Demokratischen-Republik-Kongo-mit-ueber-einer-Million-Euro.xhtml?oid=42790689&ls=L3NlYXJjaHJlc3VsdC9zZWFyY2hyZXN1bHQueGh0bWw_c2VhcmNoU3RyaW5nPUhSUlMmc2VhcmNoSWQ9MCZzZWFyY2hUeXBlPWRldGFpbGVkJmJvcmRlcnM9dHJ1ZSZyZXN1bHRJbmZvVHlwZUlkPTE3NSZ2aWV3VHlwZT10aHVtYnMmc29ydERlZmluaXRpb249UFVCTElTSEVEX0FULTImdGh1bWJTY2FsZUluZGV4PTAmcm93Q291bnRzSW5kZXg9NQ!!&rs=0 (accessed on 29 March 2019).
- Kölsch, D.; Saling, P.; Kicherer, A.; Grosse-Sommer, A.; Schmidt, I. How to measure social impacts? A socio-eco-efficiency analysis by the SEEBALANCE® method. Int. J. Sustain. Dev. 2008, 11, 1–23. [Google Scholar] [CrossRef]
- Schmidt, I.; Meurer, M.; Saling, P.; Kicherer, A.; Reuter, W.; Gensch, C.-O. SEEbalance: Managing Sustainability of Products and Processes with the Socio-Eco-Efficiency Analysis by BASF. Green. Manag. Int. 2004, 45, 79–94. [Google Scholar]
- Saling, P. AgBalance—Measuring agricultural sustainability. A clearer view of agricultural sustainability. In Proceedings of the International Workshop “Practical Aspects of Social Life Cycle Assessment”, Berlin, Germany, 25 May 2012; Available online: http://www.greendeltatc.com/uploads/media/Saling_AgBalance.pdf (accessed on 4 September 2013).
- WBCSD. Social Life Cycle Metrics for Chemical Products. The World Business Council for Sustainable Development (WBCSD); Working Group on Life Cycle Metrics. 2016. Available online: https://www.wbcsd.org/Projects/Chemicals/Resources/Social-Life-Cycle-Metrics-for-Chemical-Products (accessed on 16 April 2019).
- Fontes, J. Handbook for Product Social Impact Assessment. Roundtable for Product Social Metrics, Ed. Version 2.0. 2014. Available online: http://product-social-impact-assessment.com/wp-content/uploads/2014/08/Handbook-for-Product-Social-Impact-Assessment.pdf (accessed on 3 September 2014).
- Goedkoop, M.J.; Indrane, D.; de Beer, I.M. Handbook for Product Social Impact Assessment. Roundtable for Product Social Metrics, Ed. Version 4.0. 2018. Available online: https://product-social-impact-assessment.com/handbook/ (accessed on 6 February 2019).
- Fontes, J.; Tarne, P.; Traverso, M.; Bernstein, P. Product social impact assessment. Int. J. Life Cycle Assess. 2018, 23, 547–555. [Google Scholar] [CrossRef]
- Karlewski, H. Social Life Cycle Assessment in der Automobilindustrie. Ph.D. Thesis, Technical University Berlin, Berlin, Germany, 2016. Available online: https://www.depositonce.tu-berlin.de/bitstream/11303/5286/3/karlewski_hannah.pdf (accessed on 6 February 2019).
- Tarne, P.; Lehmann, A. A comparison of Multi-Regional Input-Output databases regarding transaction structure and supply chain analysis. Int. J. Life Cycle Assess. 2018, 196, 1486–1500. [Google Scholar] [CrossRef]
- Tarne, P.; Lehmann, A.; Finkbeiner, M. Introducing weights to life cycle sustainability assessment—How do decision-makers weight sustainability dimensions? Int. J. Life Cycle Assess. 2019, 24, 530–542. [Google Scholar] [CrossRef]
- Tarne, P.; Lehmann, A.; Kantner, M.; Finkbeiner, M. Introducing a product sustainability budget at an automotive company—One option to increase the use of LCSA results in decision-making processes. Int. J. Life Cycle Assess. 2018, 66, 1–19. [Google Scholar] [CrossRef]
- Tarne, P.; Traverso, M.; Finkbeiner, M. Review of Life Cycle Sustainability Assessment and Potential for Its Adoption at an Automotive Company. Sustainability 2017, 9, 670. [Google Scholar] [CrossRef]
- Schmidt, W.-P.; Taylor, A. Ford of Europe’s Product Sustainability Index. In Proceedings of the 13th CIRP International Conference on Life Cycle Engineering, Leuven, Belgium, 31 May–2 June 2006; Available online: http://www.mech.kuleuven.be/lce2006/key2.pdf (accessed on 15 November 2012).
- Martin, M.; Røyne, F.; Ekvall, T.; Moberg, Å. Life Cycle Sustainability Evaluations of Bio-based Value Chains: Reviewing the Indicators from a Swedish Perspective. Sustainability 2018, 10, 547. [Google Scholar] [CrossRef]
- Rafiaani, P.; Kuppens, T.; van Dael, M.; Azadi, H.; Lebailly, P.; van Passel, S. Social sustainability assessments in the biobased economy: Towards a systemic approach. Renew. Sustain. Energy Rev. 2018, 82, 1839–1853. [Google Scholar] [CrossRef]
- Di Cesare, S.; Silveri, F.; Sala, S.; Petti, L. Positive impacts in social life cycle assessment: State of the art and the way forward. Int. J. Life Cycle Assess. 2016, 23, 406–421. [Google Scholar] [CrossRef]
- Kühnen, M.; Hahn, R. Indicators in Social Life Cycle Assessment: A Review of Frameworks, Theories, and Empirical Experience. J. Ind. Ecol. 2017, 21, 1547–1565. [Google Scholar] [CrossRef]
- Jørgensen, A.; Hauschild, M.Z.; Jørgensen, M.S.; Wangel, A. Relevance and feasibility of social life cycle assessment from a company perspective. Int. J. Life Cycle Assess. 2009, 14, 204–214. [Google Scholar] [CrossRef]
- New Earth. Social Hotspot Database. 2015. Available online: http://socialhotspot.org (accessed on 15 July 2015).
- Hauschild, M.; Dreyer, L.C.; Jørgensen, A. Assessing social impacts in a life cycle perspective—Lessons learned. CIRP Ann. Manuf. Technol. 2008, 57, 21–24. [Google Scholar] [CrossRef]
- Falcone, P.; Imbert, E. Social Life Cycle Approach as a Tool for Promoting the Market Uptake of Bio-Based Products from a Consumer Perspective. Sustainability 2018, 10, 1031. [Google Scholar] [CrossRef]
- GRI. G3. Leitfaden zur Nachhaltigkeitsberichterstattung. Version 3.0. Global Reporting Initiative (GRI). 2006. Available online: https://www.globalreporting.org/resourcelibrary/German-G3-Reporting-Guidelines.pdf (accessed on 12 December 2012).
- Jørgensen, A.; Le Bocq, A.; Nazarkina, L.; Hauschild, M. Methodologies for Social Life Cycle Assessment. Int. J. Life Cycle Assess. 2008, 13, 96–103. [Google Scholar] [CrossRef]
- MBC. Umwelt-Zertifikat Mercedes-Benz S-Klasse. Life Cycle. Mercedes-Benz Cars (MBC), Daimler AG. 2013. Available online: http://www.daimler.com/Projects/c2c/channel/documents/2373356_Umweltzertifikat_Mercedes_Benz_S_Klasse.pdf (accessed on 12 December 2013).
- Springer Gabler Verlag. Gabler Wirtschaftslexikon: Stichwort: Unternehmensgrößenstruktur. 2010. Available online: http://wirtschaftslexikon.gabler.de/Archiv/71553/unternehmensgroessenstruktur-v8.html (accessed on 24 April 2014).
- LBP-GaBi. Documentation of LCWE data in GaBi 4. Abteilung Ganzheitliche Bilanzierung (GaBi); Lehrstuhl für Bauphysik (LBP); Universität Stuttgart. 2010. Available online: http://www.gabi-software.com/fileadmin/Documents/lcwe.pdf (accessed on 20 February 2011).
- Ramirez, P.K.S.; Petti, L.; Brones, F.; Ugaya, C.M.L. Subcategory assessment method for social life cycle assessment. Part 2: Application in Natura’s cocoa soap. Int. J. Life Cycle Assess. 2016, 21, 106–117. [Google Scholar] [CrossRef]
- LBP-GaBi; thinkstep. GaBi Software Homepage. Abteilung Ganzheitliche Bilanzierung (GaBi); Lehrstuhl für Bauphysik (LBP); University of Stuttgart; thinkstep AG, formerly PE International. 2015. Available online: www.gabi-software.com (accessed on 5 May 2015).
- Ecoinvent Association. ecoinvent database. 2015. Available online: www.ecoinvent.org (accessed on 7 February 2015).
- EAA. Environmental Profile Report for the European Aluminium Industry. Life Cycle Inventory data for aluminium production and transformation processes in Europe. European Aluminium Association (EAA). 2008. Available online: http://www.alueurope.eu/wp-content/uploads/2011/08/EAA_Environmental_profile_report-May081.pdf (accessed on 20 April 2014).
- Wötzel, K. Ökobilanzierung der Altfahrzeugverwertung am Fallbeispiel eines Mittelklassefahrzeuges und Entwicklung einer Allokationsmethodik. Ph.D. Thesis, Technical University of Braunschweig, Braunschweig, Germany, 2007. [Google Scholar]
- Finkbeiner, M.; Ackermann, R.; Bachmann, V.; Berger, M.; Brankatschk, G.; Chang, Y.-J.; Grinberg, M.; Lehmann, A.; Martínez-Blanco, J.; Minkov, N.; et al. Challenges in Life Cycle Assessment: An Overview of Current Gaps and Research Needs. In Background and Future Prospects in Life Cycle Assessment; Klöpffer, W., Ed.; Springer: Dordrecht, The Netherlands, 2014; pp. 207–258. [Google Scholar]
- OECD. Average annual hours actually worked per worker. Organisation for Economic Co-operation and Development (OECD). 2014. Available online: http://stats.oecd.org/Index.aspx?DataSetCode=ANHRS (accessed on 24 October 2014).
- Klöpffer, W.; Grahl, B. Ökobilanz (LCA). Ein Leitfaden für Ausbildung und Beruf; Wiley-VCH Verlag GmbH & Co. KGaA: Weinheim, Germany, 2009. [Google Scholar]
- Deutsches Institut für Normung (DIN) e. V. DIN EN ISO 14044 (2006): Umweltmanagement—Ökobilanz—Anforderungen und Anleitungen (German and English version); Deutsches Institut für Normung (DIN) e. V.: Berlin, Germany, 2006. [Google Scholar]
- Jungbluth, N. Erdöl: Teil IV. Sachbilanzen von Energiesystemen: Grundlagen für den ökologischen Vergleich von Energiesystemen und den Einbezug von Energiesystemen in Ökobilanzen für die Schweiz; Dones, R., Bauer, C., Bolliger, R., Burger, B., Faist Emmenegger, M., Frischknecht, R., Heck, T., Jungbluth, N., Röder, A., Eds.; Akademie der Naturwissenschaften Schweiz: Dübendorf, Switzerland, 2007. [Google Scholar]
- Burckhardt, G. Soziale Indikatoren in Nachhaltigkeitsberichten. Freiwillig, verlässlich, gut? Abteilung Wirtschafts- und Sozialpolitik der Friedrich-Ebert-Stiftung, Ed. 2012. Available online: http://library.fes.de/pdf-files/wiso/09459.pdf (accessed on 7 January 2014).
- Arvidsson, R.; Baumann, H.; Hildenbrand, J. On the scientific justification of the use of working hours, child labour and property rights in social life cycle assessment: Three topical reviews. Int. J. Life Cycle Assess. 2014, 20, 161–173. [Google Scholar] [CrossRef]
- HP. IMDS Internationales Material Daten System. Hewlett-Packard GmbH (HP). 2013. Available online: http://www.imds.de/ (accessed on 10 July 2014).
- Philipp, J.A.; Eyerer, P.; Erve, S.; Schuckert, M.; Theobald, W.; Volkhausen, W. Ökobilanzen für Stahlprodukte: Sachstand und Perspektiven. Stahl und Eisen 1994, 114, 71–77. [Google Scholar]
- Endemann, G.; Degner, M.; Fandrich, R. Stahlfibel, veränderter Nachdruck, Originalausgabe 2007; Verlag Stahleisen GmbH: Düsseldorf, Germany, 2011. [Google Scholar]
- Classen, M.; Althaus, H.-J.; Blaser, S.; Tuchschmid, M.; Jungbluth, N.; Scharnhorst, W.; Faist Emmenegger, M. Life Cycle Inventories of Metals; Swiss Centre for Life Cycle Inventories. Proceedings of the Final report ecoinvent. No. 10, data v2.1; EMPA: Dübendorf, Switzerland, 2009. [Google Scholar]
- Dones, R.; Bauer, C.; Röder, A. Sachbilanzen von Energiesystemen: Grundlagen für den ökologischen Vergleich von Energiesystemen und den Einbezug von Energiesystemen in Ökobilanzen für die Schweiz; Kohle: Teil VI; Dones, R., Bauer, C., Bolliger, R., Burger, B., Faist Emmenegger, M., Frischknecht, R., Heck, T., Jungbluth, N., Röder, A., Eds.; Akademie der Naturwissenschaften Schweiz: Dübendorf, Switzerland, 2007. [Google Scholar]


| Materials/Energy | Resource Depletion | Tier 1–Tier n | Car Production | Car Use | Dismantling | Shredder |
|---|---|---|---|---|---|---|
| Steel | x | x | x | x | x | |
| Textile | x | x | x | x | x | |
| Biopolymer | x | x | x | x | x | |
| Platinum metals | x | x | x | x | x | |
| Aluminum | x | x | x | x | x | |
| Energy | x | x | x | x | x | x |
| No. | Social Aspect | PDCA | Perf | No. | Social Aspect | PDCA | Perf | |
|---|---|---|---|---|---|---|---|---|
| 1 | Public Commitment to (Social) Sustainability | + | − | 16 | Health and Safety | + | 0 | |
| 2 | Economic Development | − | 17 | Social Benefits/Social Security | + | 0 | ||
| 3 | Corruption | + | − | 18 | Education and Training | + | + | |
| 4 | Technology Development | − | 19 | Job Security | 0 | + | ||
| 5 | Armed Conflicts | − | − | 20 | Subjective Job Satisfaction | 0 | 0 | |
| 6 | Behavior in Competition | + | + | 21 | Delocalization | 0 | + | |
| 7 | Intellectual Property Rights | − | 0 | 22 | Migration | 0 | 0 | |
| 8 | Supplier Relationships | − | − | 23 | Dialogue with the Local Community | − | − | |
| 9 | Social Responsibility | + | 0 | 24 | Local Heritage | − | − | |
| 10 | Freedom of Association and Collective Bargaining | 0 | 0 | 25 | Indigenous Rights | 0 | + | |
| 11 | Child Labor | + | 0 | 26 | Local Employment | − | − | |
| 12 | Salary | + | 0 | 27 | Access to Immaterial Resources | − | − | |
| 13 | Hours of Work | + | + | 28 | Access to Material Resources | − | + | |
| 14 | Forced Labor | + | − | 29 | Safe and Healthy Living Conditions | − | − | |
| 15 | Equal Opportunities | + | + | 30 | Secure Living Conditions | − | 0 |
| Component Production | Dismantling | |||||
|---|---|---|---|---|---|---|
| Development | Press Shop | Body Shop | Painting | Assembly | ||
| Considered parameter | Development time/produced RW door | RW door | Number of welding spots of the RW door | Area of the RW door | Assembly time/RW door | Dismantling time/RW door |
| Reference value | Total working hours of the development department | Number of pressed RW doors | Number of welding spots in the body shop | Painted total area | Total working hours of assembly | Total working hours of dismantling |
| Aim | Accidents/RW door | |||||
| Results | 7.67 × 10⁻⁸ | 9.76 × 10⁻⁷ | 8.88 × 10⁻⁷ | 1.35 × 10⁻⁷ | 8.03 × 10⁻⁷ | 7.07 × 10⁻⁶ |
| Life Cycle Phase | Reference Value for the Consideration of a Component | Necessary Steps for the Consideration of the Complete Car |
|---|---|---|
| Upstream chain | Mass (top-down) | Adding the results of the different components |
| Manufacturing | Component (bottom-up) | Top-down in relation to the vehicle |
| Use phase (fuel path) | Mass (top-down), fuel reduction factor | Top-down in relation to the fuel consumption of the vehicle |
| Dismantling | Component (bottom-up) | Top-down in relation to the vehicle, dismantling rate is to be considered |
| Shredding | Mass (top-down) | Top-down in relation to the vehicle, shredding rate is to be considered |
© 2019 by the authors. Licensee MDPI, Basel, Switzerland. This article is an open access article distributed under the terms and conditions of the Creative Commons Attribution (CC BY) license (http://creativecommons.org/licenses/by/4.0/).
Share and Cite
Karlewski, H.; Lehmann, A.; Ruhland, K.; Finkbeiner, M. A Practical Approach for Social Life Cycle Assessment in the Automotive Industry. Resources 2019, 8, 146. https://doi.org/10.3390/resources8030146
Karlewski H, Lehmann A, Ruhland K, Finkbeiner M. A Practical Approach for Social Life Cycle Assessment in the Automotive Industry. Resources. 2019; 8(3):146. https://doi.org/10.3390/resources8030146
Chicago/Turabian StyleKarlewski, Hannah, Annekatrin Lehmann, Klaus Ruhland, and Matthias Finkbeiner. 2019. "A Practical Approach for Social Life Cycle Assessment in the Automotive Industry" Resources 8, no. 3: 146. https://doi.org/10.3390/resources8030146
APA StyleKarlewski, H., Lehmann, A., Ruhland, K., & Finkbeiner, M. (2019). A Practical Approach for Social Life Cycle Assessment in the Automotive Industry. Resources, 8(3), 146. https://doi.org/10.3390/resources8030146