1. Introduction
There have been many efforts in recent years to evaluate the criticality of elements and materials in light of material scarcity and predictions of potential supply constraints. These evaluations are attempts to identify materials that have a comparatively high economic importance combined with a comparatively high risk of supply disruptions [
1]. Among the governmental criticality assessments most widely recognized are those of the U.S. National Research Council [
2], the U.S. Department of Energy [
3], the European Commission [
4,
5], and the British Geological Survey [
6,
7]. Some of these studies were used by the Australian Government as a foundation to examine critical resources for Australia, given this country’s relevance in the global supply of mineral commodities [
8]. Complementary academic studies are rapidly evolving and various versions of criticality methodology have been presented [
9,
10,
11,
12,
13,
14,
15,
16,
17].
Most criticality research has been restricted to lists of metals, with a few exceptions that examined several non-metal materials (e.g., coking coal, natural rubber, pulpwood) [
4,
5]. Although a definitive list of “critical metals”, stable over time, would be very helpful to industries and governments, such a list is unrealistic. New ore deposits are discovered, revisions occur in geopolitics and legislation, technological evolution induces changes in demand, and so forth. Therefore, because criticality is a dynamic state, it is desirable that the results from criticality assessments be periodically updated [
18]. The European Commission has attempted to respond to this situation by performing an initial evaluation in 2010 and an update in 2014 (the results showed little change) [
4,
5]. The British Geological Survey [
6,
7] also performed evaluations four years apart, but for metal supply only. There was some shuffling of rankings between the two assessments, but a change in methodology makes comparison of results from the two years problematic.
An additional attribute of criticality is that the degree of concern for a given metal depends on who is making the inquiry, as results can legitimately differ at corporate, national, regional, and global levels [
19].
In the present work, we respond to some of these issues in the following ways:
We update our previous 2008 results [
19,
20,
21,
22] to 2012 for the United States and for the planet;
We generate criticality assessments for 2008 and 2012 for Australia;
We compare the results over time at the global level, at the country level, and metal to metal;
The assessments are performed for six metals: aluminum, iron, nickel, copper, and zinc, used in large quantities throughout the world in major industrial sectors such as construction, infrastructure, electrification, and transportation, plus indium as an example of a metal with higher scarcity concerns and employment in very specialized applications.
2. Methodology
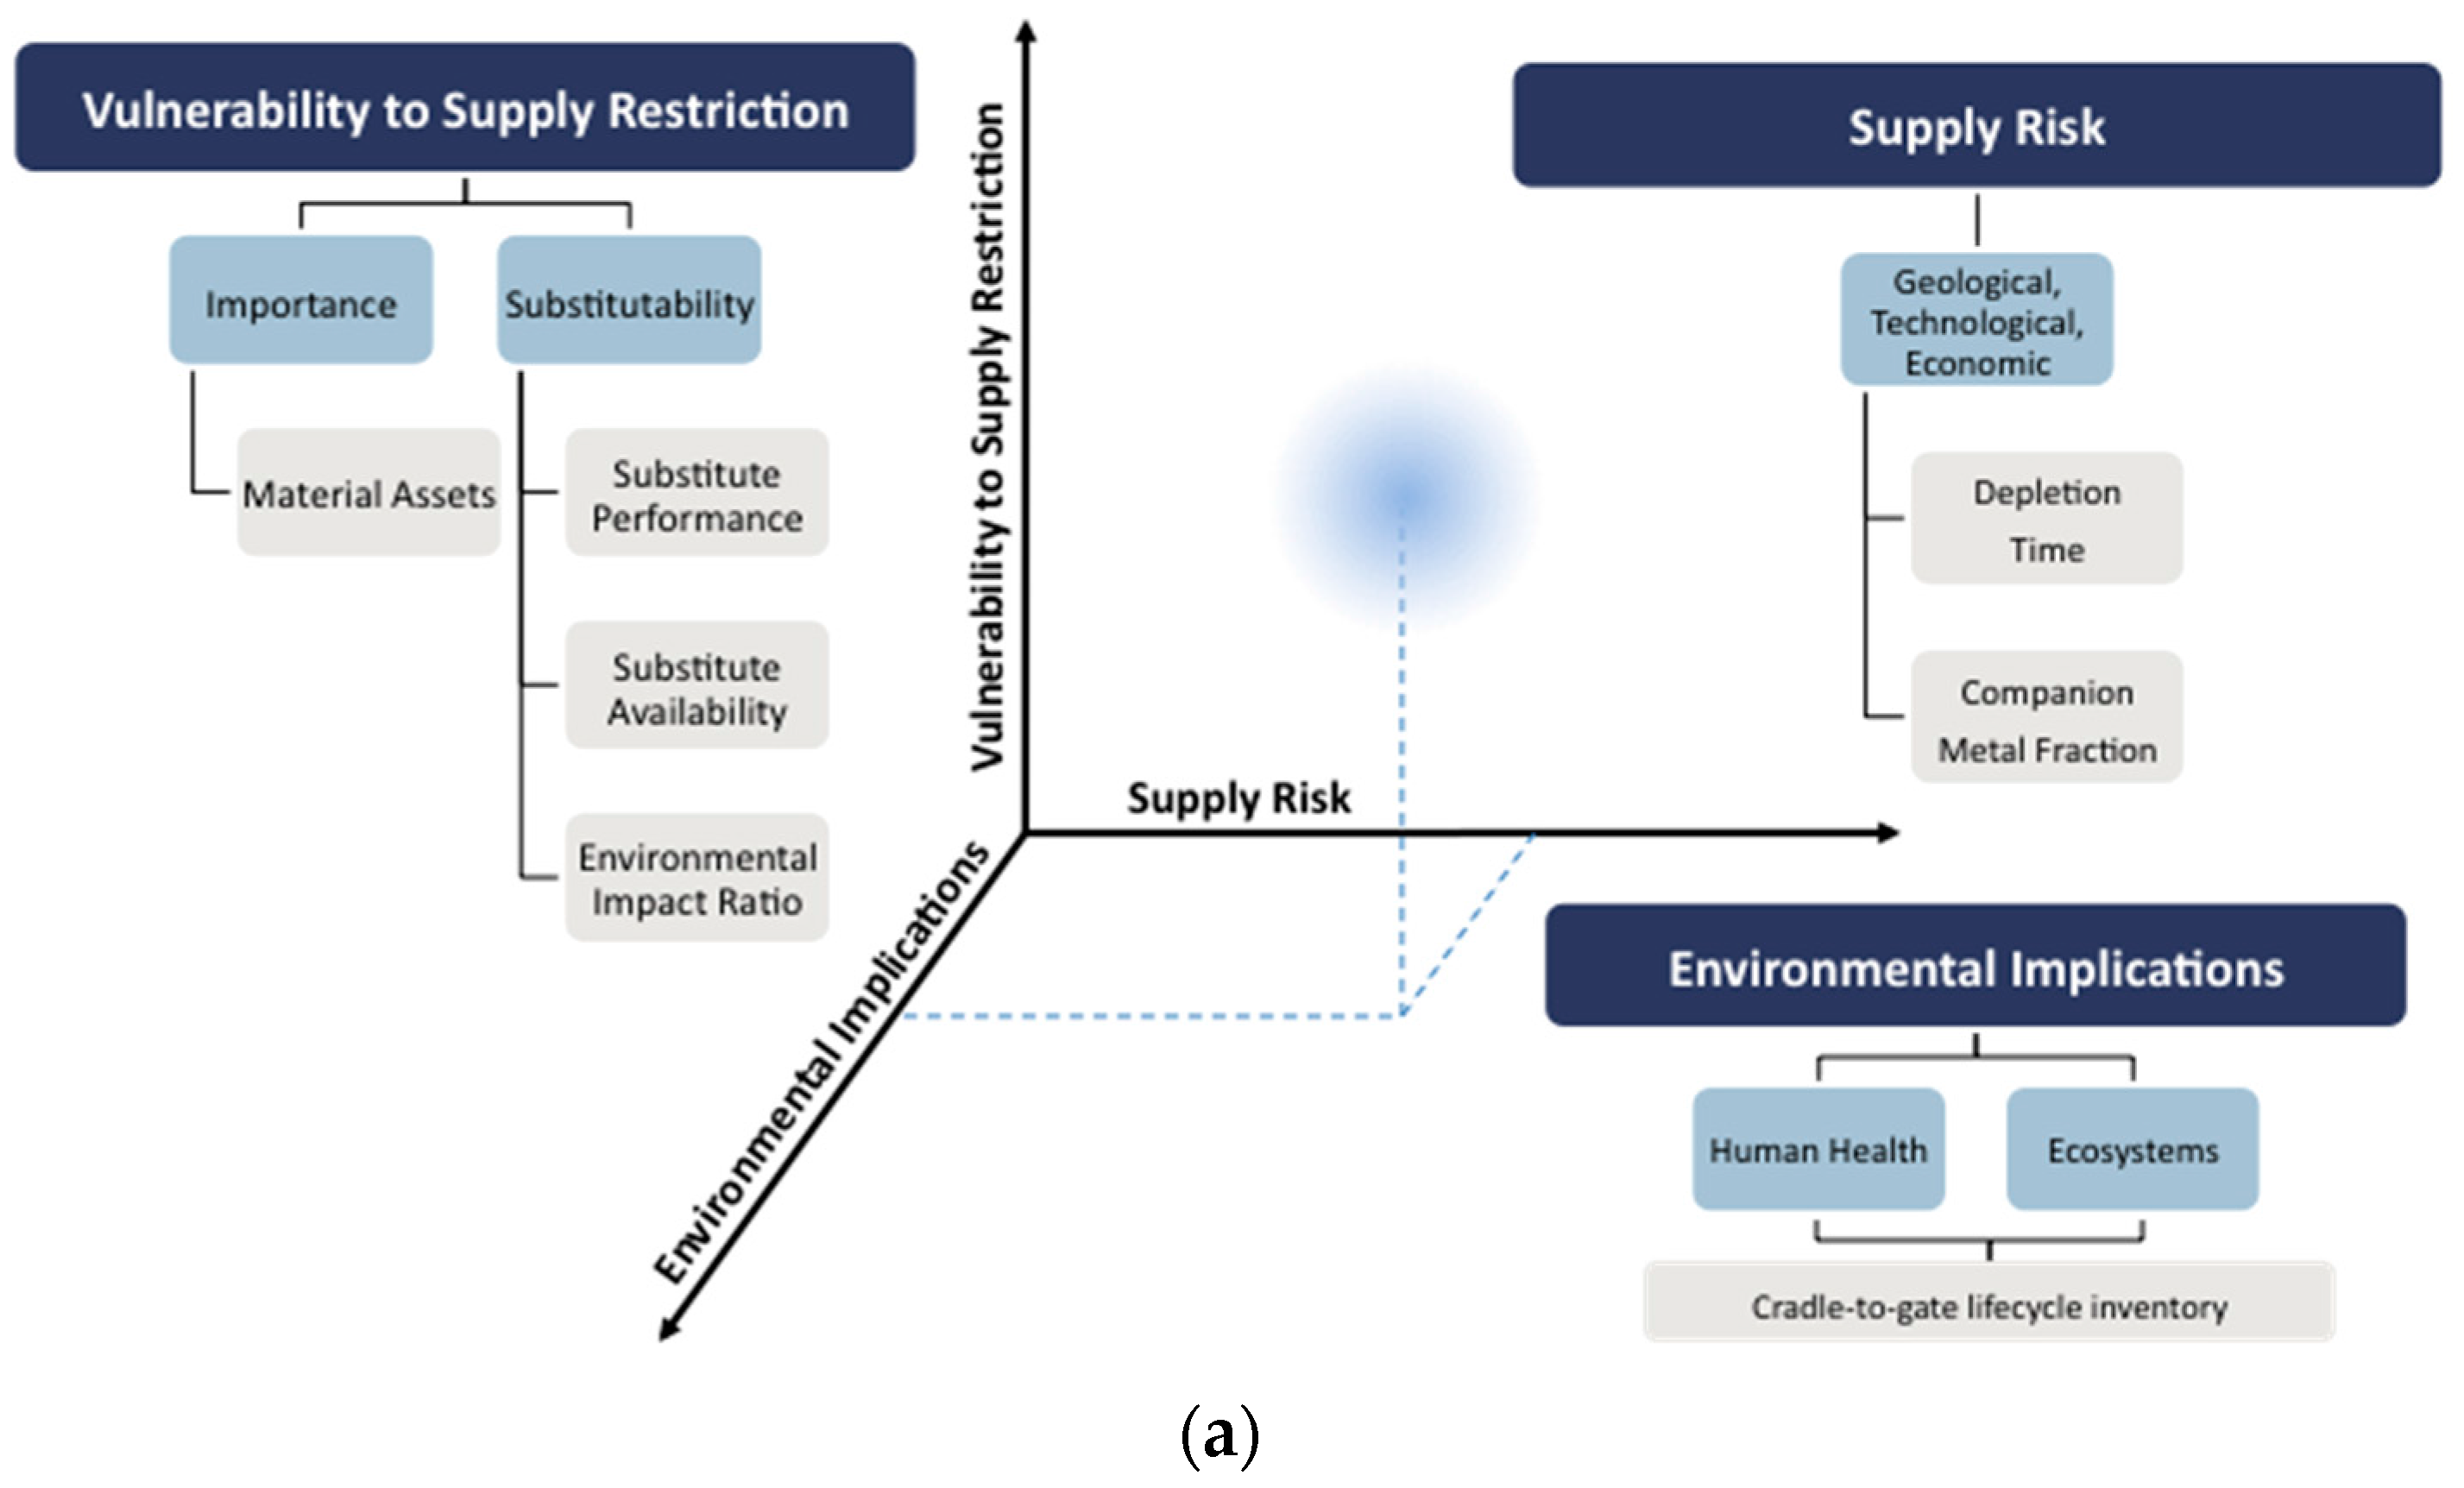
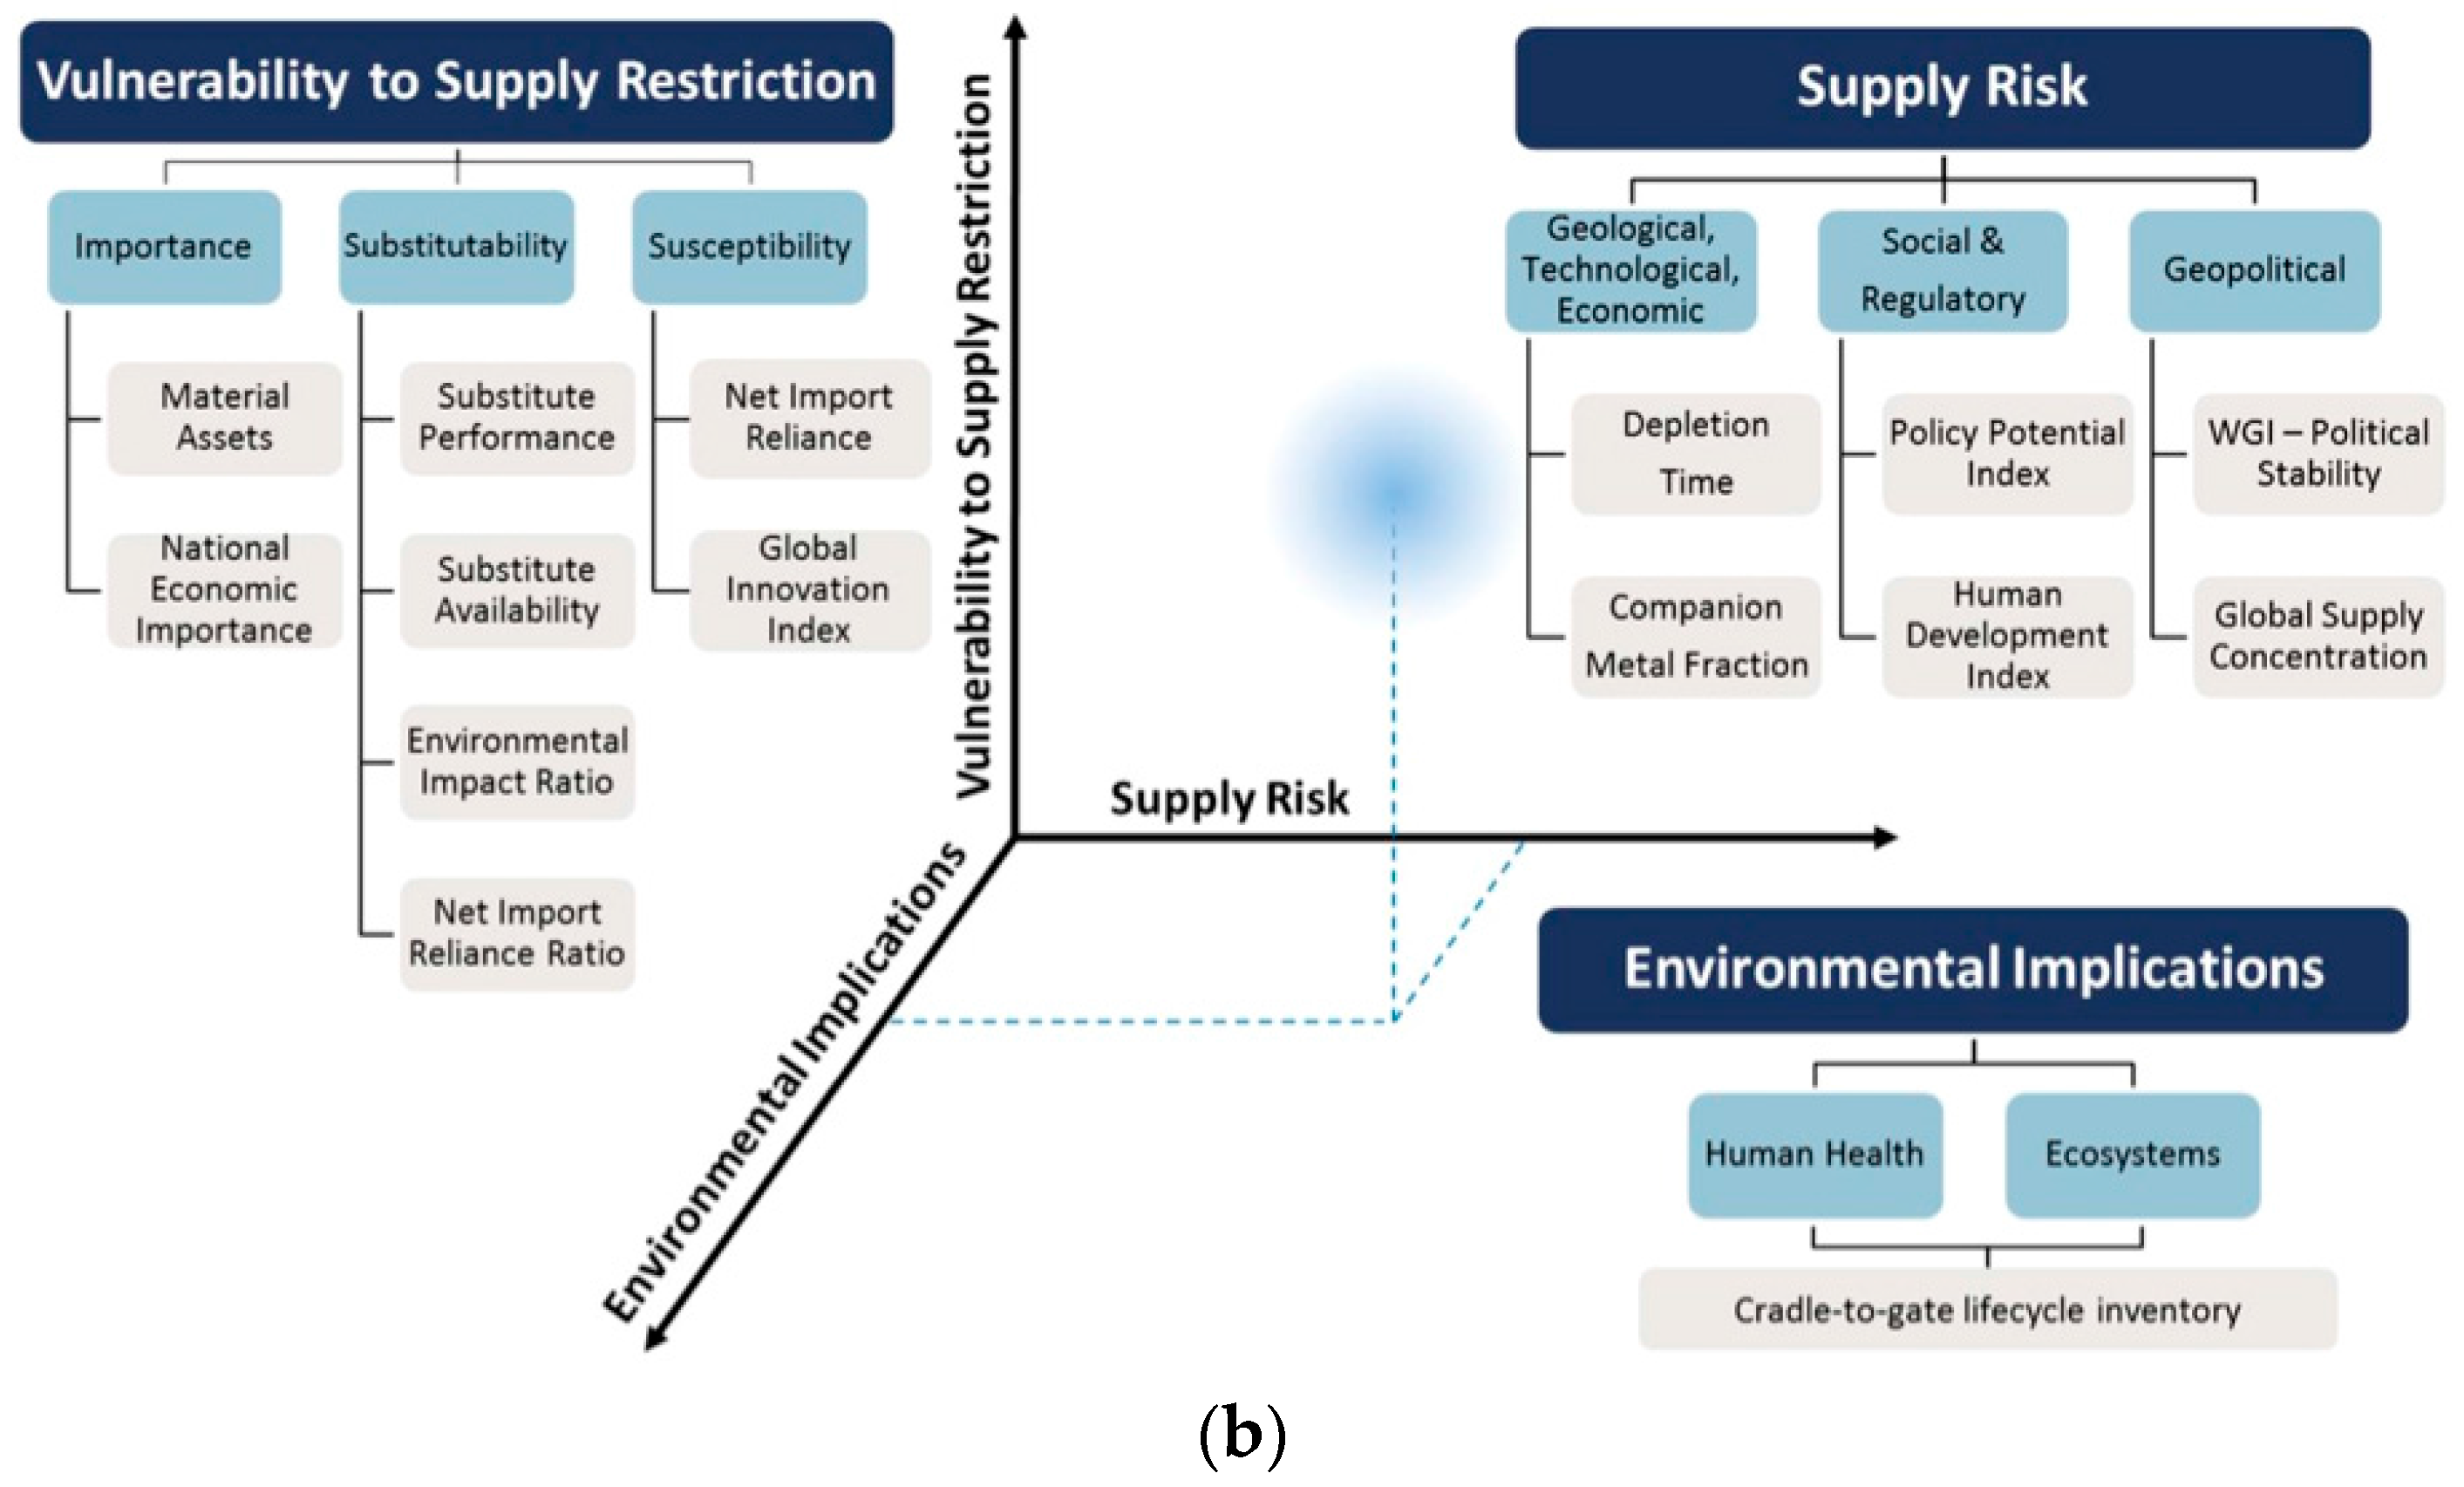
The Yale methodology, which we employ here for metal criticality assessment, is shown in
Figure 1a (global level) and
Figure 1b (country level). The methodology addresses three criticality dimensions: Supply Risk (SR), Environmental Implications (EI), and Vulnerability to Supply Restriction (VSR). Each of these is the result of the aggregation of several indicators, and those in turn are aggregations of several metrics. A detailed description of the methodological details is given in Graedel et al. [
11] with updates given in Harper et al. [
21].
A feature of the criticality methodology worth noting is that the evaluations of the SR and EI axes at the global level depend entirely on the geological and environmental properties of the metal. The EI axis evaluation at the national level is identical to that at the global level because the lack of mine-specific environmental impacts limits the EI assessment to inherent toxicological and energy use impacts. The national SR axis takes into account not only geology of ore deposits but also various properties of the countries from which the metal is extracted and processed (
Figure 1b). These values are weight-averaged by each producing country’s share of worldwide production. As a result, national SR ratings for all countries are identical. Using country variability is addressed by the VSR axis in such metrics as Economic Importance and Import Dependence, as shown in
Figure 1b.
A review of a number of methodological approaches to the assessment of criticality [
18] generated a list of ten desirable attributes such as transparency, evaluation of uncertainty, and breadth of scope. The Yale methodology as applied in previous work for different metal groups [
19,
20,
21,
22] satisfied nine of the ten. The tenth desirable attribute, periodic updating, is served at least in part by the present work. An alternative discussion of methodological challenges in measuring criticality is given by Helbig et al. [
17].
3. Results
For the present study, we have evaluated criticality for 2012 for Australia, the United States, and the world for aluminum, iron, nickel, copper, zinc, and indium. The numerical values for the three criticality dimensions (on a scale of 0–100, with higher values indicating more concern) are given in
Table 1, which also reproduces previous 2008 results for the United States and the world [
19,
20,
21,
22], and adds those for Australia generated in this work. To our knowledge, criticality results for Australia (for both 2008 and 2012) are the first determinations for the six metals for this country. In fact, the Australian Government’s assessment relied on previous criticality results of overseas studies [
8], while Australia-specific data and metrics are used as inputs in this analysis.
We compare the results for different years, different countries, and different metals in the sections below. The numeric values for the indicators and metrics that underlie the
Table 1 aggregated values are given and discussed in the
Supplementary Materials.
3.1. Comparing Criticality over Time
We utilize the information derived in the present study to compare criticality values at two points in time. At the global and United States levels, we have a 2008 determination available from previous work [
19,
20,
21,
22] and the 2012 determination accomplished herein. In the case of Australia, we have generated 2008 and 2012 determinations for consistency purposes. We note that the EI evaluation has not changed between 2008 and 2012 for any of the metals because the underlying databases have not been revised during that period, and because the processes that are employed during metal extraction and processing have long lifetimes. Therefore, we can ignore the EI axis in displaying and discussing the results of this study.
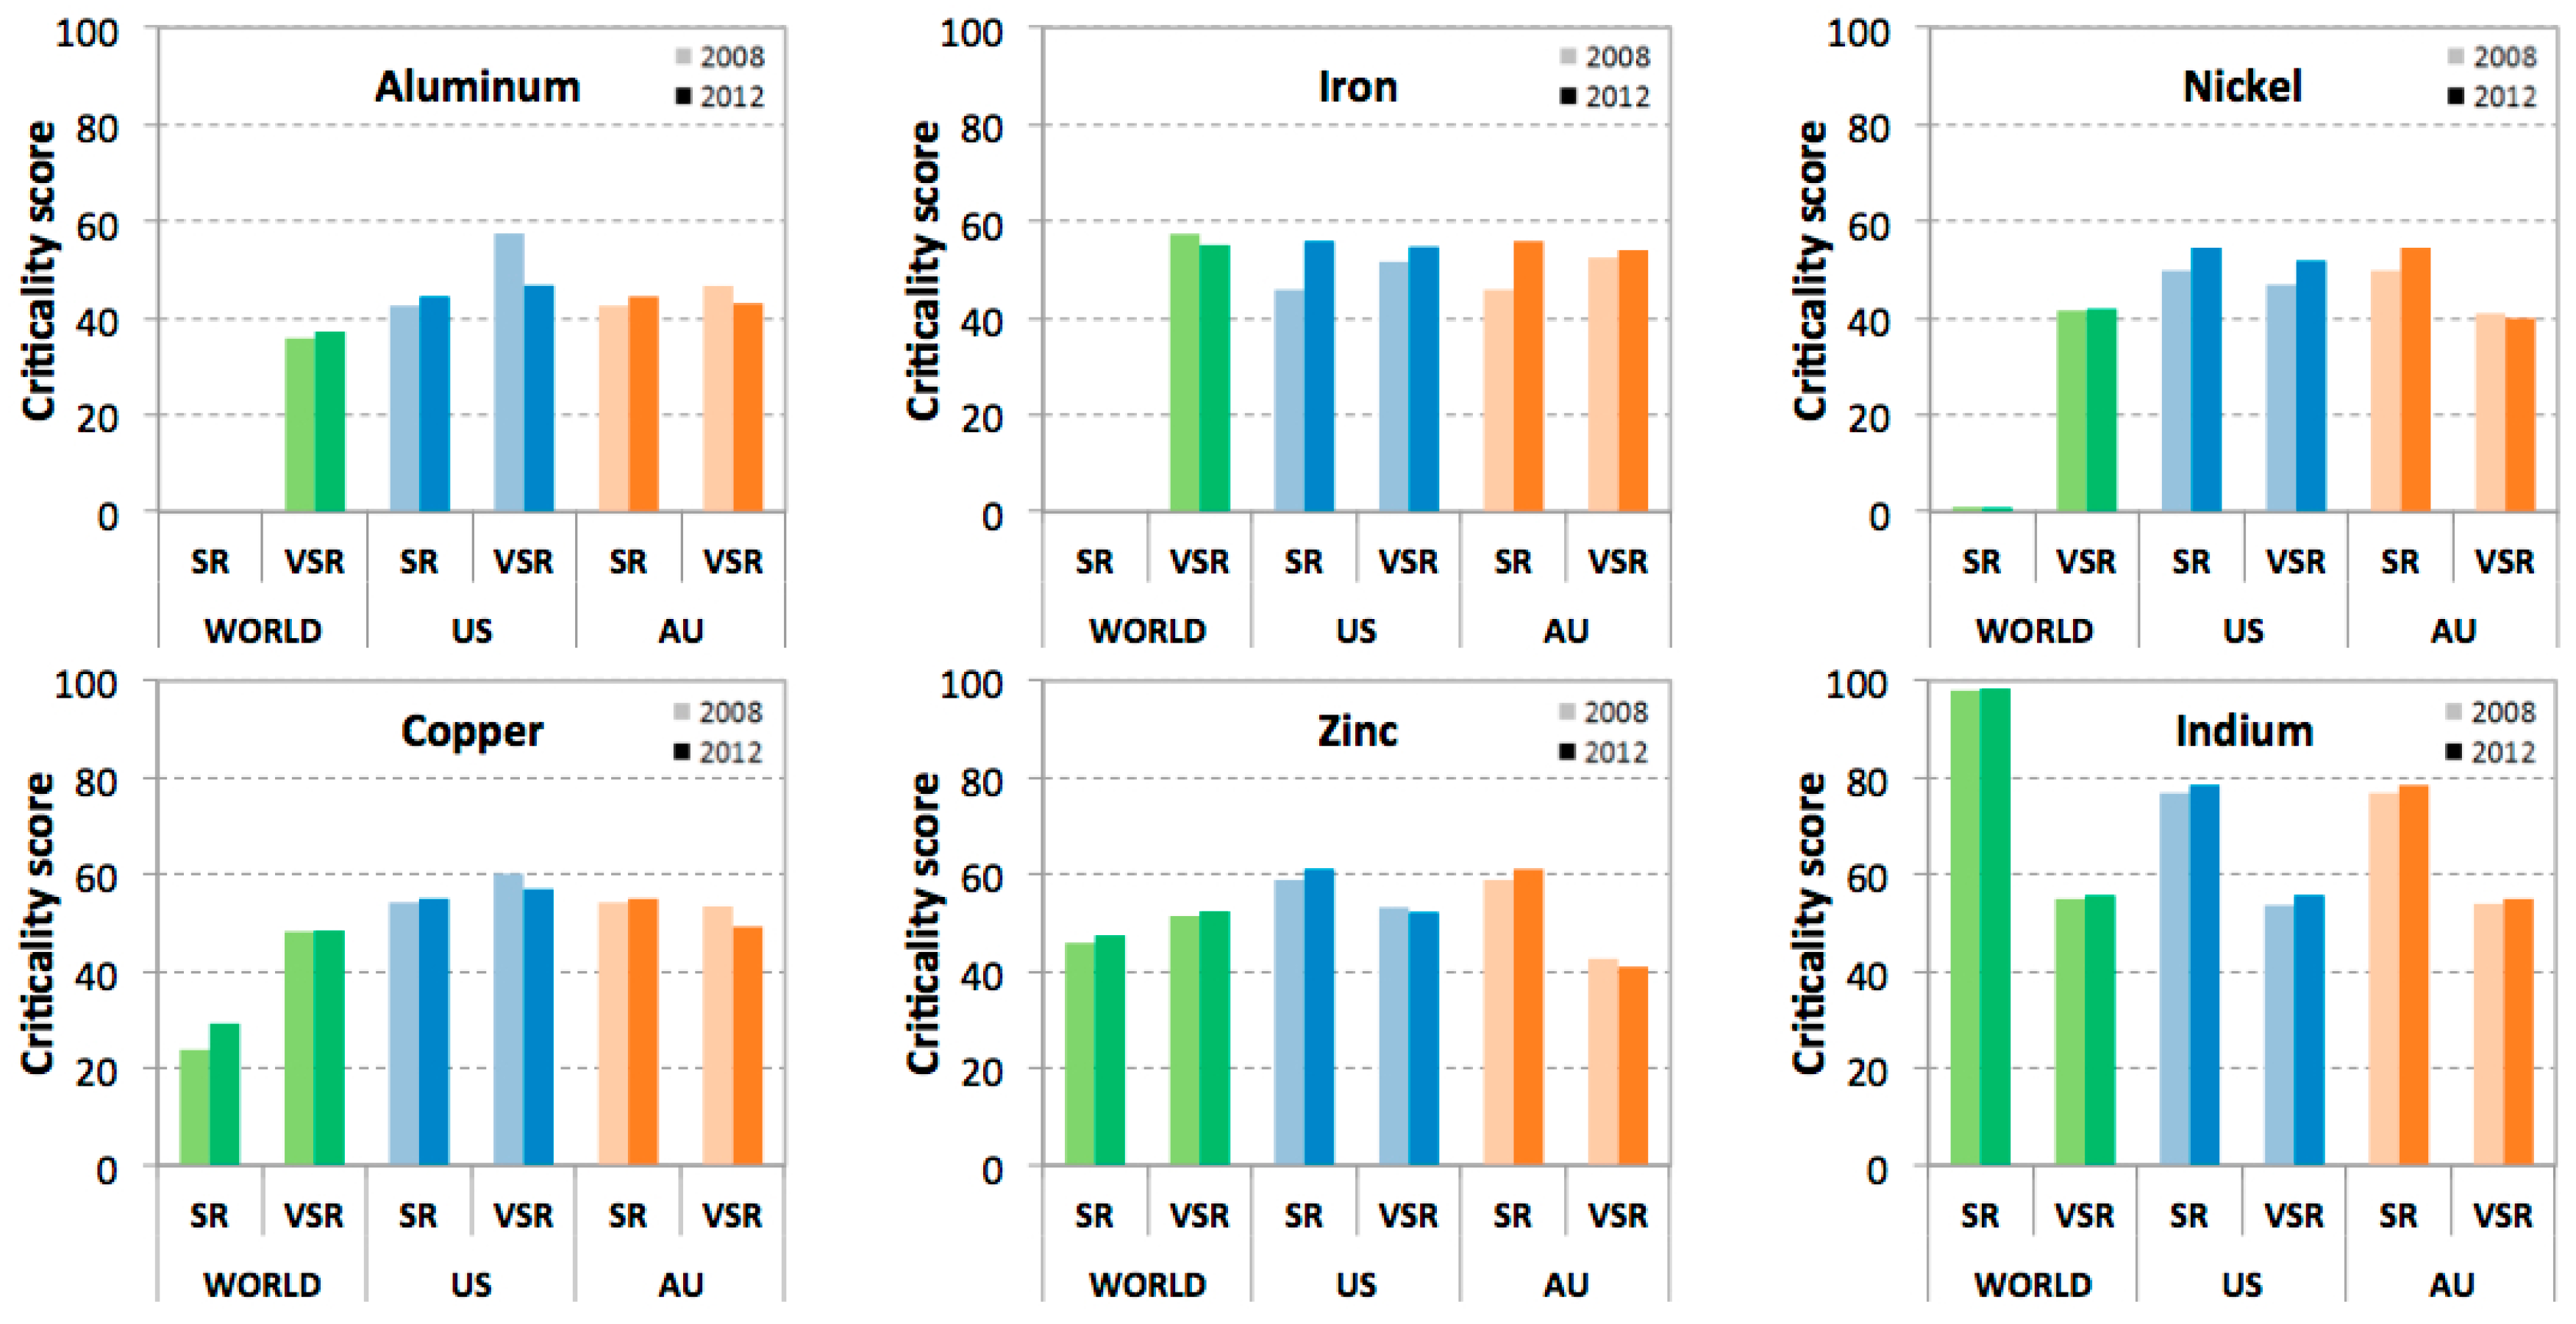
In
Figure 2 (and
Table 1) we give the SR-VSR results for the six metals as evaluated for the world, the United States, and Australia for the two different years. Most of the differences are certainly not dramatic. Overall, there is a modest increase in SR for a couple of the metals, and VSR becomes more uniform at levels between 50 and 60.
The global level results (green bars shown in
Figure 2) are dramatically different from those of the United States and Australia. In general, SR is less of a concern at the global level, with the exception of indium and the numeric values of the metals are considerably more diverse. There is little concern of SR for iron, aluminum, and nickel. SR for copper is markedly higher (though lower than is the case for the United States) and SR of zinc is higher still, near that of the United States. SR for indium remains of very high concern at the global level, but substantially lower scores are computed for the United States and Australia. There is little variation in either SR or VSR between 2008 and 2012 at the global level.
3.2. Comparing Country Level Criticality
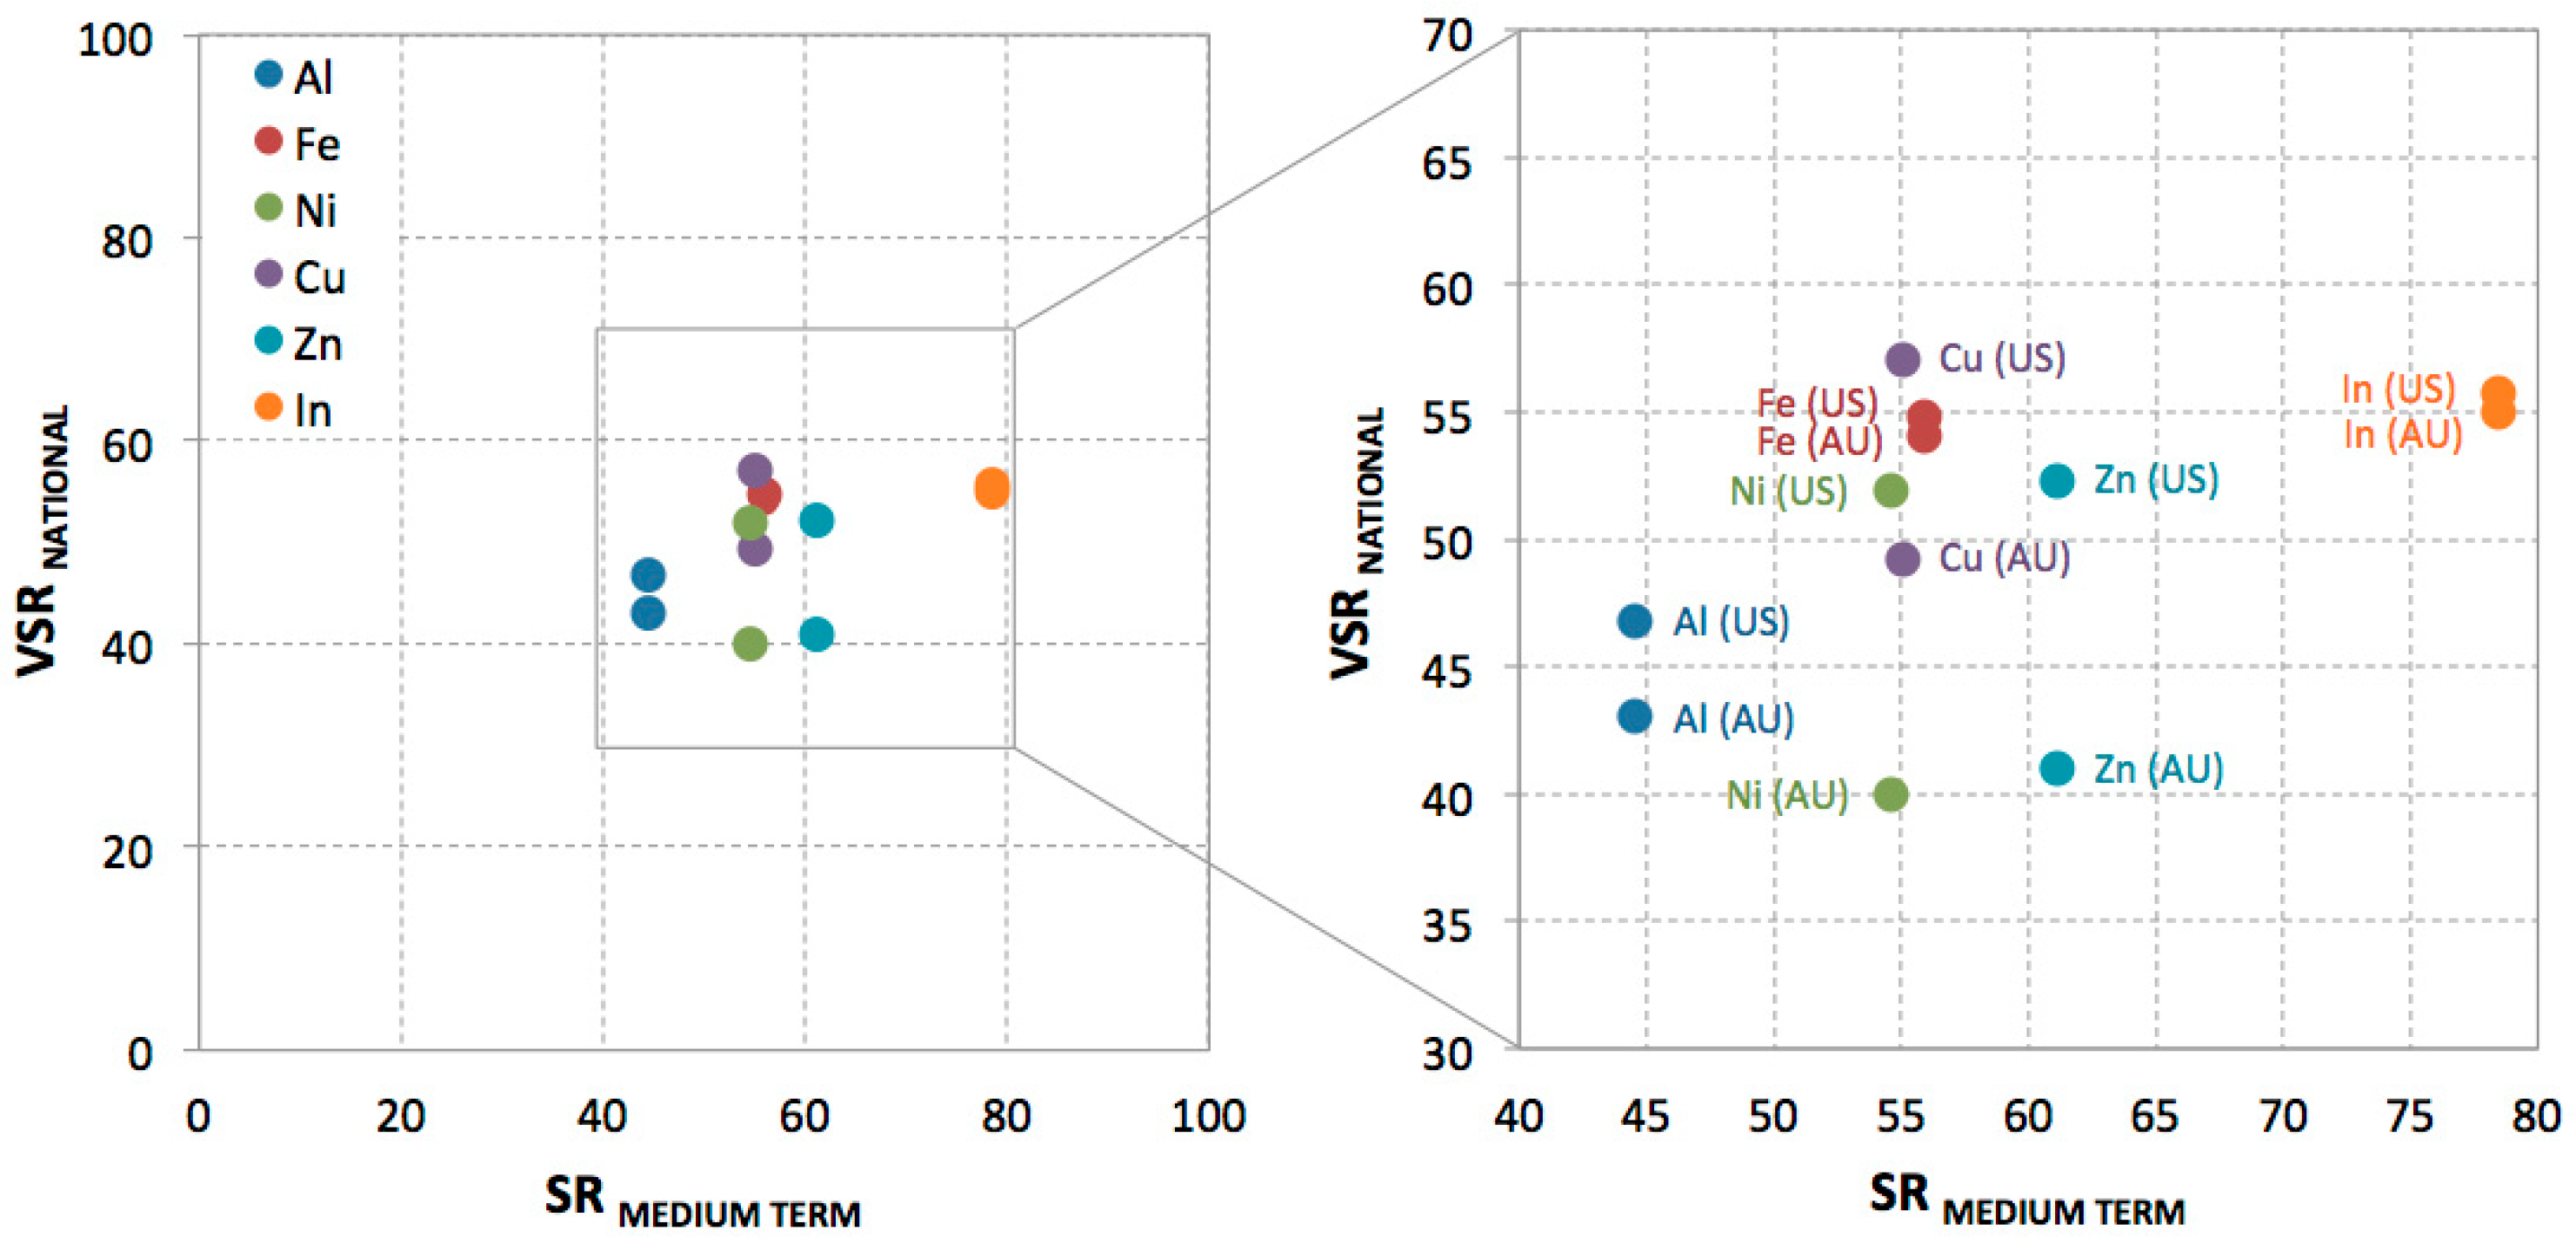
The results displayed in
Figure 2 and
Figure 3 enable a comparison of the criticality assessments between the United States and Australia in 2012 as a snapshot of the “current” criticality determinations. As mentioned above, SR and EI values for all countries are identical (SR is weight-averaged by using global-average metal supply rather than using an individual country’s import source mix because potentially a using country’s import sources are not constant). For VSR, there are small differences (both in Australia’s favor) for aluminum, iron and indium. For copper, zinc, and nickel, however, VSR differences are larger, with Australia’s VSR for these metals 23%–33% lower than those for the United States. This is due largely to Australia’s large domestic ore stocks of these metals [
23]. The United States also has geological stocks of copper and zinc (but not of nickel); however, the domestic metal production is not sufficient to avoid imports of all three metals.
3.3. Comparing Criticality Metal to Metal
The criticality values for the United States and Australia illustrate various features of more general results for the metals evaluated in our research (
Figure 3). The five major metals in our study are extensively used in global buildings and infrastructure: because these sectors have long lifetimes of products in use and a well-established demand-supply pattern worldwide it would be anticipated that vulnerability to supply restriction would be moderate or lower at both spatial levels and for both countries, and that is what is observed in the present study. In the United States, for the six metals and the two years of assessment, all VSR values are between 47 (aluminum) and 60 (copper). Australia’s VSR values are lower for both years because this country dominantly relies on domestic metal sources, falling between 40 (nickel) and 55 (indium).
SR results for the medium-term perspective, used in conjunction with the country level assessment [
11], are influenced by several geological, technological, economic, social, regulatory, and geopolitical metrics (see
Supplementary Materials). In particular, the relative availability of a metal is determined by the amount of time that it would take to deplete the geological reserves (according to the USGS definition [
23]) at the current level of demand and secondary metal supply (i.e., recycling). For the five major metals of our study, SR values are in the 40–60 range. SR for indium is much higher (78), as (i) its reserves are lower than those of the other metals; (ii) it is mainly extracted as a by-product of zinc, tin, and copper; and (iii) because indium recycling at end-of-life is very limited.
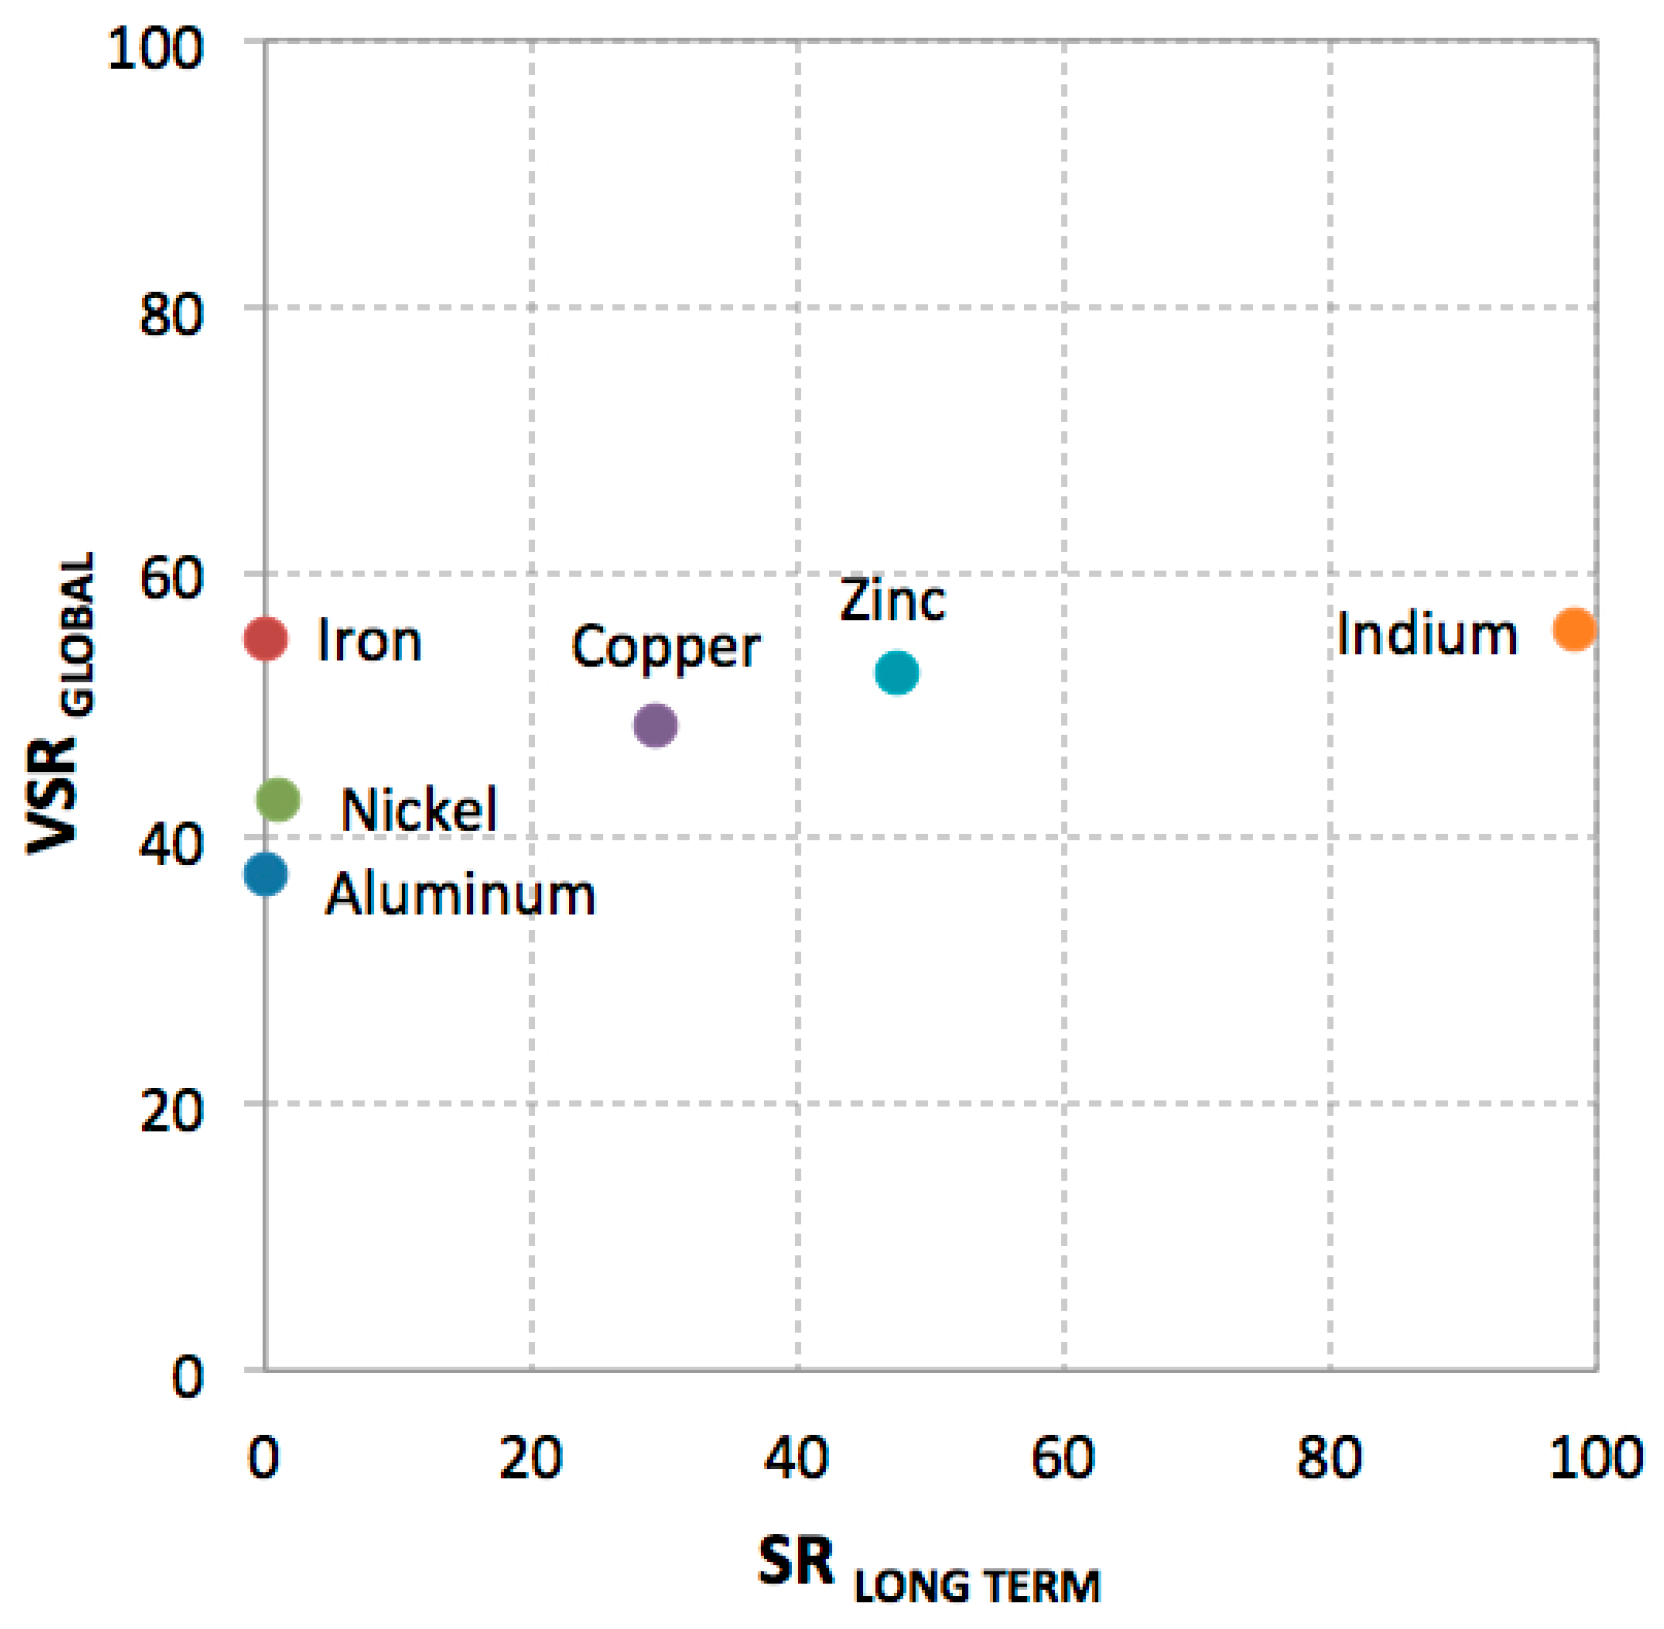
Similar variations exist among the metals at the global level (
Figure 4). Supply risk for aluminum, iron, and nickel is negligible as a consequence of their large global abundance (in the global level assessment, the reserve base is used [
11]), small for copper, and moderate for zinc. Supply risk for indium is much higher as its reserves are lower than those of the other metals, confirming the challenge of securing access to this (by-product) metal worldwide.
VSR levels for four of the metals (iron, copper, zinc, and nickel) are squarely in the midrange values of 37–56. Iron has the highest VSR as a result of its very wide use in buildings and infrastructure. VSR is lowest (though quite moderate) for aluminum and nickel, which is somewhat less widely used than the other metals. Indium has a VSR score comparable to that of other metals investigated. One could expect a higher result following the outcomes for SR, but indium is much less prevalent in modern society compared to the major metals, which reduces concerns due to global vulnerability to potential supply shortages.
4. Discussion
The modest criticality changes seen over time in this study of five major metals and the high criticality evaluation for indium are consistent with European Union studies, in both cases using a consistent methodology over a four-year interval [
4,
5]. Results from the British Geological Survey are also similar over a four-year period [
6,
7], although changes in methodology make that conclusion less robust. In any case, these results from three different research groups provide strong support for assuming that changes in criticality over a several year time period (and perhaps longer?) are likely to be relatively small.
When comparing criticality across countries at a similar time period, significant differences are seen in the present work for major metals in Australia and the United States, and in Nassar et al. for rare earths in China and the United States [
24]. The country level differences are largely related to the presence or absence of domestic ore deposits sufficient to meet domestic demand and to the presence or absence of a well-established production chain for the most common forms of metals employed in the creation of finished products. Thus, Australia possesses low criticality for major metals, for which it holds large deposits and it is a major global exporter, and China for the rare earths, with which it is well endowed. However, notwithstanding that Australia has the world’s largest reserves of zinc and bauxite from which indium and gallium (which is potentially a good substitute of indium in solder and alloy applications, electrical components and semiconductor manufacturing [
20]) are mainly extracted, the current Australian indium and gallium refinery capacity is very limited and constrains the exploitation of this potential. As a result, indium criticality is greater than what would likely be determined in the event that extensive indium recovery took place to match the possible magnitude of indium resources in this country [
8]. This is, in turn, influenced by several technological, economic, and policy developments that will likely change over time and could influence the country’s reliance on domestic sources to provide goods and services (and hence Australian vulnerability to potential indium supply restriction). On a wider level, because Australia is a major contributor to global base metal production, such a change would also have effects in the global supply of critical commodities.
Comparing criticality evaluations for different metals is somewhat more nuanced than between years or countries. In particular, metals have very different properties with regard to principal uses, recycling potential, substitution potential, sourcing countries, by-product production, and so forth. For abundant metals, especially those with deposits widely distributed around the planet, a high degree of criticality is unlikely, and indeed neither this study nor those of the European Commission [
4,
5] or the British Geological Survey [
6,
7] find aluminum, iron, nickel, copper, or zinc to be of substantial concern. The situation changes, however, when considering by-product metals (e.g., indium or rhenium), or metals with no workable substitutes for their major uses (e.g., rhodium or selenium). Given these additional complexities, methodological differences assert themselves to a greater degree, and the relative level of concern for elements such as vanadium and molybdenum varies significantly among different assessments. However, even though some variation would be expected, it is clear that methodological variation is a legitimate concern in assessing the criticality of the scarcer elements.
5. Conclusions
This study has demonstrated that criticality results for the six metals assessed do not appear to change markedly over a four-year interval at the global level. The results do, however, differ significantly at the country level. Analysis of a more diverse set of countries using a consistent methodology is necessary to determine the possible extent of differences between countries. Various studies of the criticality of different metals demonstrate differences among geographical entities (countries, regions); some of this is understandable as inherent country/region differences, but variations may be attributable as well to different analytical methodologies, as noted in the Introduction.
Finally, we note that even though the changes in the criticality parameters for Australia, the US, and the planet are not great over this four-year time period, some were significant enough to be noticeable in the results obtained. This fact emphasizes that criticality is not a fixed set of parameters, although criticality may be relatively stable year to year and perhaps even longer time periods. Periodic updates, perhaps at five years intervals, would seem a judicious practice.


