
A Comparison of Single and Multi-Stream Recycling Systems in Ontario, Canada

Department of Geography, Wilfrid Laurier University, Waterloo, ON L6S 2X5, Canada
Resources 2015, 4(2), 384-397; https://doi.org/10.3390/resources4020384
Submission received: 17 March 2015
/
Revised: 12 June 2015
/
Accepted: 12 June 2015
/
Published: 17 June 2015
Abstract
:This study examines differences in cost and recycling performance between single and multi-stream recycling systems in Ontario, Canada. Using panel data from 223 provincial municipalities spanning a ten year period, focus is placed on analyzing: (a) Are material management costs for municipalities who implement single stream collection less than those that implement multi stream collection? (b) Are recycling rates for single stream municipalities higher than municipalities with multi stream collection? (c) Do municipalities with multi stream collection realize higher revenues from the sale of recyclable material? The results of the analysis show that while single stream recycling programs recycle more than multi stream programs, they face significantly higher material management costs. This was contrary to the prevailing opinion that single stream recycling is a cheaper alternative to multi-stream recycling. As far as can be ascertained, this is one of the few studies of its kind to examine the differences in material management costs and recycling performance between single and multi-stream recycling systems. This topic is of increasing importance, as single stream recycling is being touted as preferred waste management option in both Ontario and abroad.
1. Introduction
The management of municipal solid waste remains at the forefront of policy planning debate and discourse in North America. Increases in urban waste generation, coupled with decreases in available landfill space, necessitates the implementation of comprehensive and cost effective waste diversion programs. However, the terms comprehensive and cost effective are often (but not always) dichotomous with one another. Recycling is an enormously costly waste management strategy for municipalities, particularly when compared to conventional land filling and incineration options. As such, many jurisdictions have chosen to implement policy measures designed to increase both waste diversion and the operational efficiency of household recycling programs.
One such policy is the implementation of single stream recycling, a recycling system in which household recyclables are collected in a single commingled container. Waste generators (primarily households) are asked to place all eligible recyclables in a designated bin/cart provided by the municipality. Collection vehicles then collect and transport commingled recyclables to a material recycling facility (MRF) that is specially configured to sort and process commingled loads of recyclables. Single stream collection is an alternative to the more conventional multi-stream recycling, where recyclables are source separated into their respective material types at the point of generation (paper fibers, glass, plastics, etc.). There is an increasing trend by municipalities in Ontario, Canada to move towards single stream systems, as it is seen as a means to:
- Reduce material management costs—collection costs are reduced, as collection vehicles only have to pick up one container per pickup, reducing stop times;
- Increase recycling convenience for households, and by proxy, recycling participation—the time investment on the part of households is reduced, as they are not required to source separate recyclables into their respective material types;
- Process greater quantities of material at the MRF. The increased levels mechanization at single stream MRFs allows more material to be sorted in a shorter period of time.
This study seeks to test these assumptions, examining whether single stream recycling is a more cost effective approach for managing recyclables in Ontario. This study also examines whether single stream collection promotes residential recycling more so than multi-stream systems.
Using comprehensive panel data from 223 municipalities spanning a ten year period, this study examines the following:
- (1)
- Are material management costs for municipalities who implement single stream collection less than those that implement multi-stream collection?
- (2)
- Are recycling rates for single stream municipalities higher than municipalities with multi-stream collection?
- (3)
- Do municipalities with multi-stream collection realize higher revenues from the sale of recyclable material?
As far as can be ascertained, this is one of the few studies of its kind to examine the differences in material management costs and recycling performance between single and multi-stream recycling systems—particularly in a Canadian context. This topic is of increasing importance, as single stream recycling is being touted as preferred waste management option in both Ontario and abroad.
2. Literature Review
At this time, there is a paucity of academic literature that specifically examines the effectiveness of single and multi-stream recycling. What little work done in this area has generally been “grey literature”—consulting reports, trade magazine articles, technical papers, etc.—carried out by local governments. Much of the information that is currently available comparing multi and single stream programs has reflected either local circumstances that can differ substantially from one area to the next and/or has reflected a particular focus or interest of the author. As a result, this research attempted to expand the research focus to the greatest extent possible to include system performance documented both inside and outside Ontario, and to identify the specific rationale supporting the findings regarding system performance.
2.1. Differences between Single and Multi-Stream Recycling
As noted in Section 1, single stream recycling is a system in which a household (or waste generator) places recyclables in a single commingled container. This material is then collected together in specially configured recycling trucks, and transported to a single stream MRF. Single stream MRFs rely on increased levels of mechanization to sort commingled material. Investments in processing technology such as optical sorters (to sort mixed plastics), corrugated cardboard and mixed paper screens and glass breakers are often required in single stream material recycling facilities (MRF) to ensure commingled material is appropriately sorted.
Multi-stream recycling is a collection method in which waste generators are required to source separate recyclables in to two (or more) separate bins (generally, paper fibers are placed in one bin and all other containers (plastics, aluminum, etc.) are placed in other bins). Multi-stream collection vehicles (that have separate compartments for each bin) then collect and transport recyclables to a multi-stream MRF that is specially configured to sort and process source separated recyclables. Multi-stream MRFs do not require the same level of mechanization as a single stream MRF, as materials have already been pre-sorted into their respective categories by households. As such, there is a tendency to rely more on manual sorting which requires fewer investments in processing technology.
Both recycling types have their respective advantages and disadvantages. While which system to implement is largely contingent on site specific conditions, single stream recycling often requires significant investments in capital and results in higher levels of recycling contamination and reduced commodity prices as a result of contamination. Manufacturers have reported problems with single stream recycling created by poor quality materials being shipped to their downstream processors [1]. Conversely, multi-stream collection is generally seen as having much lower levels of contamination and requiring fewer capital investments at the MRF to sort material. However, multi-stream recycling systems are assumed to have higher collection costs, reduced levels of household participation (as a result of households having to take additional time to source separate recyclables into their respective streams) and limited capacity to process large quantities of recyclable material [2].
2.2. Findings on Performance of Single vs. Multi-Stream Recycling
There is a general consensus in the available literature that single stream recycling offers the potential for more efficient collection and reduced collection costs. [3,4] found that the increased adoption of single stream recycling systems in the United States is largely driven by increased waste diversion rates for participating communities. In [4]’s review of several communities across multiple states, it was found that the change from multi-stream to single stream recycling resulted in an approximately 50% increase in the production of recyclable commodities and an accompanying decrease in per tonne material management costs. Similar results were observed by [5], which found that the collection savings from single stream systems ranged from $10 to $20 per tonne, while [6] reported that the potential savings associated with single stream collection can vary from 5% to 25%. In contrast to these findings, an examination of the collection costs by [7] concluded that the savings from single stream collection was much lower, with estimates ranging from $0 to $3 a tonne.
While single stream collection costs are presumed to be lower than multi-stream systems, it is generally accepted and demonstrated that the capital and operating costs for single stream processing are more expensive. In a study by [8], processing costs for single stream systems were 10% higher on average when compared to multi-stream systems. These findings were echoed in studies by [9,10], which observed differences in processing costs ranging from 7% to 50% (with single stream systems being more expensive). However, there have been some studies that have estimated that the annual operating cost for single stream facilities could be lower than a multi-stream facility when operating at the same throughput. In a study undertaken by [10], it was estimated that processing costs would be $107/tonne for a single stream facility versus $116/tonne for a multi-stream system.
Reports evaluating the effectiveness of single stream recycling systems have also found that the commodities recovered from single stream programs are of lower quality than those recovered from multi-stream systems. This results in decreased value and/or difficulties in finding end-markets. The authors of [10] found that single stream systems had eight times the yield loss compared to multi-stream systems for paper fibers collected curbside. Plastics processors reported that material from single stream MRFs had a yield rate 10% lower than multi-stream MRFs.
This paper does not attempt to offer any definitive guidance regarding which recycling system (single vs. multi-stream) is more appropriate. The effectiveness of single/multi-stream recycling is contingent on a variety of site specific factors. It does however test some of the assumptions surrounding the perceived efficacy of single stream recycling systems using data from 223 municipalities over a ten year period. The robustness of the data used in this study enables meaningful and credible analysis related to the performance of single and multi-stream systems.
3. Material and Methods
3.1. Case Study
Ontario is Canada’s most populous province, situated between 41°85' N and 51°28' N and 95°48' W and 74°74' W, with a total land mass of 1,076,395 km2. Ontario remains at the forefront of recycling initiatives and legislation, recognized as one of only three provinces in Canada to implement an extended producer responsibility scheme (EPR) for household recyclables. Residential and commercial waste diversion programs exist for MHSW (Material Hazardous or Special Waste), WEEE (Waste Electrical and Electronics Equipment), automobile tires, and printed paper and packaging (Blue Box) materials. Each of these programs exist under the oversight of Waste Diversion Ontario (WDO), a non-crown corporation created under Ontario’s 2002 Waste Diversion Act [11]. The WDO was established to develop, implement and manage waste diversion programs for stakeholders from both private and public sectors. Stewardship Ontario is the industry funded organization designated by the WDO to collect fees on behalf of packaging producers to finance the operation of the Blue Box program.
Under provincial regulation O. Reg. 101/94, Every municipality with a population of 5000 or more residents are obligated to operate a Blue Box program accepting at least five mandatory materials, plus three optional materials [12]. In 2013, the Blue Box program recycled 892,214 tonnes of printed paper and packaging from residential sources, with a provincial recycling rate of 62.8%.
In Ontario, there are presently 53 active material recovery facilities. Of these facilities, 28 are publicly owned and operated, with the remainder being privately owned. Facilities range in size from 90,000 Tonne “Mega MRFs” that service multiple municipalities, to manually operated facilities managing less than 50 tonnes per year [13]. All of the MRFs in Ontario are classified as “clean” MRFs, where commingled recycled material has already been source separated at the point of generation (households and commercial/industrial establishments). 36 of the province’s 53 MRFs are classified as multi-stream facilities. While the majority of the MRFs in the province are multi-stream, single stream MRFs manage approximately half of the total tonnes recycled in the province (444,883 tonnes) [13]. Of note, 47 of Ontario’s MRFs are located in southern regions of the province. This is largely due to logistics—98.3% of all recyclable material generated in Ontario are from municipalities south of the 46° parallel. Generally speaking, municipalities in Northern Ontario will transport their recyclable material to a local transfer station, who will in turn transport material to the nearest available MRF.
3.2. Description of the Data
Data for Ontario’s residential recycling system was obtained from the Waste Diversion Ontario (WDO) municipal data call. Each year, the WDO requests that every municipality within Ontario report detailed recycling and cost information regarding the management of their waste diversion programs [11]. Municipalities are required to log into the Waste Diversion Ontario web site and fill out an electronic questionnaire that solicits information that includes information on the amount of material recovered, the types of material recovered and the operating and capital costs associated with the management and collection of recyclables. All data used in this study pertains to printed paper and packaging recyclables found in the residential recycling stream, i.e., newsprint, cardboard, glass, aluminum, steel, composite packaging and plastics.
Information regarding municipal groupings and collection classifications have been obtained from the WDO’s “Performance Factor by Municipal Group” reports that are accessible to the public via the Waste Diversion Ontario website.
The recycling and P&E expenditure data collected by the WDO for each of Ontario’s 223 municipalities between 2003 and 2012 are analyzed in this study. Data pertaining to best practice P&E provisions have been calculated and made available for public use by WDO staff.
Data pertaining to population size, population density, median age, and education levels were obtained from the Stats Canada 2006 and 2011 census.
3.3. Integrity of the WDO Data Call
While the WDO data call is regarded as a “robust and comprehensive” source for data on municipal program costs and characteristic, the nature of self-reported data may lead to errors in reporting and data accuracy. Municipalities may be inclined to overstate diversion levels or misinterpret the questions being asked by the municipal data call survey. To maintain data integrity and ensure that municipalities are correctly interpreting and answering data call questions, the WDO, in collaboration with the Municipal Industry Program Committee (MIPC) and Stewardship Ontario, provide data call support and 3rd party verification of the information reported into the data call. Municipalities work directly with a MIPC representative to ensure that the data call survey is filled out and submitted correctly [11]. Stewardship Ontario finances 3rd party audits of municipal recycling programs to ensure that cost and recovery information is accurate. However, due to the administrative burden and costs of verifying data for all 223 provincial municipalities, these audits are normally conducted at random, and consist of approximately 10–15 samples per year. While every reasonable effort is made to ensure that the data reported to the data call is accurate, there have been (and continue to be) instances in which information is misreported.
As such, every year, the information reported by municipalities in to the data call under goes a “reconciliation” period. All municipal data is reviewed by WDO staff, who in turn compare year over year changes in municipal costs and diversion to flag any “peculiar” or “unexpected” results. These red flags are then investigated by WDO staff or a MIPC representative, who contact the municipalities in question to identify whether there were any issues in data reporting or the operation of the program. In the event that municipalities are unable to provide a satisfactory explanation for anomalies in reported costs, they may be targeted for follow up audits or forfeit a percentage of their municipal waste funding (under Ontario’s EPR program, municipalities are reimbursed 50% of the costs for operating and maintaining their residential recycling program).
This study operates under the assumption that the data extracted from the WDO data call is valid and consistent with actual municipal costs and recycling performance. Generally speaking, discrepancies between self-reported and actual costs/diversion levels are identified and rectified during the reconciliation process. The WDO performs ongoing data integrity checks to ensure that the information contained within the data call is accurate, and will amend historical data entries should new information become available that suggests a reporting error has been made. While it is impossible to know with absolute certainty that the WDO data call is wholly accurate, it can be said that all reasonable efforts have been made to ensure data credibility [14].
3.4. Methodology
3.4.1. Evaluating the Recycling Performance of Single and Multi-Stream Recycling Systems
To determine whether single stream recycling systems result in higher municipal recycling rates, recycling rates were modeled as a function of whether municipalities implement single or multi-stream recycling, the presence of PAYT systems in a given community, waste management policy, income and demographic variables. This was done to establish whether a statistically significant relationship exists between single/multi-stream recycling and recycling rates. Our expectation is that municipalities who implement single stream recycling systems will achieve higher recycling rates than those that do not (as noted in the reports by [15,16,17]).
As our focus is to examine the effect of single and multi-stream recycling on municipal recycling rates, policy variables were limited to the presence of pay as you throw schemes, promotion and education expenditures and curbside recycling collection. Demographic variables include age, income, education and population density. This approach is consistent with the literature and captures the most commonly identified behavioral antecedents [18]. The list below provides a definition of the variables included in the statistical models.
RR = Municipal Recycling Rates;
PC = Municipal Program Costs;
SS = 1 if municipality implements single stream collection (0 otherwise);
PAYT = 1 if municipality implements pay as you throw scheme (0 otherwise);
PE = Municipal promotion and education expenditures (per household) ($);
CURB = Percentage of households with access to curbside recycling collection;
INC = Median household income Per Capita ($);
AGE = Median Age;
EDUC = % of Population with College education or higher;
DEN = Population Density per square kilometer.
Table 1 below provides the summary statistics for each of the variables considered in this study. Salient findings include:
- Recycling rates from for 0.05% to 100% across provincial municipalities.
- Investments in recycling promotion and education ranges from $0 to $47.50.
- 49% of Municipalities implement pay as you throw pricing for garbage disposal.
- 41% of Municipalities have curbside waste collection.
- Median age and income in Ontario are 40.4 years and $47,780 respectively.
- 29.2% of Ontarian’s have a college education or higher.
- Population density in Ontario ranges from 0.141 people per km2 to 1127.7 people per km2.

| Variable | Mean | Std. Dev | Min | Max |
|---|---|---|---|---|
| RR | 0.4850 | 0.2262 | 0.0052 | 1 |
| PC | $410,513 | $15,775 | $152 | $30,597,125 |
| SS | 0.3724 | 0.4147 | 0 | 1 |
| PAYT | 0.4890 | 0.5000 | 0 | 1 |
| PE | 0.8518 | 2.263 | 0 | 47.5 |
| CURB | 0.4107 | 0.1921 | 0 | 1 |
| INC | 47,780 | 4011 | 38,006 | 57,993 |
| AGE | 40.40 | 2.906 | 32.00 | 41.99 |
| EDUC | 0.2929 | 0.0778 | 0.1314 | 0.5229 |
| DEN | 14.14 | 132.9 | 0.1410 | 1128 |
3.4.2. Comparing Costs between Single and Multi-Stream Recycling Systems
To compare material management costs between single and multi-stream recycling systems, municipal cost data was extracted from the WDO data call and organized in Microsoft Excel to best facilitate program performance comparisons.
Data for each of Ontario’s 223 municipalities was organized by recycling system type (single vs. multi-stream), collection costs, processing costs, revenue from sale of recyclable material and net recycling costs (calculated as total cost of material management minus revenue). This data was then aggregated for each of the 10 years for which data was made available by the WDO. A total of 2007 data points were included in the cost analysis. Of note: Not all municipalities had entries for every data year. This could be due to the following: (1) some municipalities failed to report costs into the WDO data call, or (2) municipal amalgamations over time.
Weighted average collection costs per tonne, processing costs per tonne, revenue per tonne and net costs per tonne were calculated for both single and multi-stream recycling systems. These results were then graphed (shown in Figure 1, Section 4.1) to illustrate differences in cost for municipalities with single vs. multi-stream recycling. The results and discussion section summarizes and elaborates on these findings.
4. Results and Discussion
4.1. Relationship between Single Stream Recycling Systems and Municipal Recycling Rates
As noted earlier, a goal of this study was to determine the effect of single and multi-stream recycling systems on municipal recycling rates. To do so, we specify the municipal recycling rate function as follows:
where municipal recycling rates are a function of single and multi-stream recycling systems, PAYT schemes, promotion and education expenditures, income, age and education levels as well as population densities. Time is the dummy variable for each year except for the first year, and ai and uit are the components for the unobserved disturbance for municipality i at time t.
RR = β0 + PEitβ2 + SSitβ3 +PAYTit β4 + CURBit β5 + INCitβ6 + AGEitβ7 + EDUCitβ8 + DENit β9 + TIMEt β10 +ai + uit
Municipal recycling rates are calculated by dividing the amount of recyclables collected and marketed by municipalities by the amount of total recyclable waste generated in the municipality. It should be noted that the amount of recyclables generated and recycled in municipalities are aggregated across all Blue Box material types to arrive at a final municipal recycling rate.
SS is a dummy variable indicating whether a municipality implements either single stream or multi-stream recycling (1 for single stream, 0 for multi-stream). CURB measures the percentage of a municipalities’ population with access to curbside recycling pickup. Municipal promotion and education (PE) expenses are expressed on a per household basis. This the total amount spent by a municipality in promoting household recycling initiatives divided by the number of households in the municipality. PAYT is a dummy variable representing whether a municipality implements some form of volume/weight based pricing for garbage disposal. Since data on the actual amount charged by the municipality was unavailable, by necessity, PAYT was coded as a dummy variable. INC, AGE and DEN refer the median income, age and density levels for a municipality.
Consistent with the methodology employed by Sidique et al. [19] and Lakhan [20], Using a Breusche-Pagan Lagrange (LM) multiplier test, we test to see whether a random or fixed effects regression should be used in place of a pooled OLS analysis. The testing reveals that the null hypothesis is rejected, as the variance across entities is greater than zero. As such, pooled OLS is dismissed as an appropriate regressive technique. To determine whether a fixed or random effects model should to be used, a Hausman test of a random effects model was estimated against the fixed effects model to see whether the municipality-level errors unique errors (ui) were correlated with the regressors. The results show that cross-sectional variance components are zero, suggesting that a random effects regressive model is the best available choice given the characteristics of the dataset.
For the purposes of comparison, a pooled OLS model is also estimated—as it is the most commonly employed regressive model in related literature. The results of this analysis are shown in Table 2.
Table 2.
Relationship between recycling rates and single stream recycling. Dependent variable = municipal recycling rates; Number of observations = 2007.
| Variable | Random Effects | Std. Error | Z score | Pooled OLS | Std. Error | T score |
|---|---|---|---|---|---|---|
| SS | 4.1165 | 0.613 | 7.11 | 3.945 | 0.249 | 9.98 |
| PE | 0.0014 | 0.021 | 0.54 | −0.004 | 0.003 | −1.45 |
| PAYT | 2.4145 | 0.588 | 4.10 | 2.014 | 0.225 | 8.94 |
| CURB | 6.1122 | 0.700 | 8.73 | 4.838 | 0.368 | 13.14 |
| INC | 0.0002 | 0.123 | 0.44 | 1.38 × 10⁻⁶ | 9.22 × 10⁻⁸ | 0.96 |
| AGE | 0.1892 | 0.095 | 1.99 | 0.200 | 0.088 | 2.27 |
| EDUC | 0.1281 | 0.077 | 1.66 | 0.127 | 0.006 | 1.97 |
| DEN | 0.0144 | 0.008 | 1.77 | 0.014 | 0.001 | 2.14 |
| Correlation Coefficient | R2 = 0.2941 | R2 = 0.2497. | ||||
In both models, the presence of a single stream recycling was found to have a statistically significant effect on municipal recycling rates. On average, the presence of a single stream recycling system increased recycling rates by 4.11% and 3.94% relative to communities who implemented multi-stream recycling. This result is consistent with our expectation that single stream recycling systems recycle at a higher rate than multi-stream systems as it is more convenient for households to place all recyclables in one bin. PAYT systems were also found to have a statistically significant positive impact on recycling rates. The presence of PAYT systems was found to increase municipal recycling rates by 2.4% and 2% depending on which regression model was used. This result is consistent with other findings from the literature, namely [21]’s examination of unit based pricing in Korean communities and [22]’s study looking at the effect of unit based pricing on household garbage and recycling generation.
Implementation of curbside recycling collection was found to have a significant impact on this model, increasing the recycling rate by 6.11% and 4.84% respectively. Similar findings were observed [18], Callan and Thomas [22], the USEPA [23], Kinnaman and Fullerton [24], Oskamp et al. [25] and Vicente and Reis [26]). Population density, age and education levels were also found to positively affect municipal recycling rates, although to a lesser degree.
Income and promotion and education expenditures (P&E) do not have a statistically significant impact in our model.
4.2. Comparison of Costs between Single and Multi-Stream Recycling Systems
As noted above, one of the purposes of this study is to evaluate the effect of single vs multi stream recycling systems on municipal program costs. First, program costs are modeled as a function of the presence of single or multi-stream recycling, curbside collection, and municipal income, age, education and density levels. This is then followed by a comparison of collection and processing costs and realized revenue per tonne for municipalities who implement single and multi-stream recycling in Ontario.
The linear econometric specification of the program cost function is as follows (the results of the regression are shown in Table 3):
PC = β0 + β1 SSit-1 + β2CURBit + β3INCit + β4AGEi + β5EDUCi + β6DENit + β7 TIMEit + ai + uit
Table 3.
Relationship between program costs and single stream recycling. Dependent variable = municipal recycling rates; Number of observations = 2007.
| Variable | Random Effects (PC) | Std. Error | Z Score | Pooled OLS | Std. Error | T Score |
|---|---|---|---|---|---|---|
| SS | 5121.8 | 21 | 5.8 | 4101.4 | 0.0003 | 14.3 |
| CURB | 11586.4 | 493.03 | 23.5 | 9887.5 | 0.5099 | 19.6 |
| PAYT | 2484.3 | 142.77 | 17.4 | 2798.1 | 0.2618 | 15.8 |
| P&E | 1.21 | 0.2520 | 4.8 | 1.05 | 0.3260 | 3.22 |
| INC | 0.000 | 0.0000 | 0.00 | 0.000 | 0.0000 | 0.00 |
| AGE | 0.000 | 0.0000 | 0.00 | 0.000 | 0.0000 | 0.00 |
| EDUC | 0.000 | 0.0000 | 0.00 | 0.000 | 0.0000 | 0.00 |
| DEN | −57.86 | 16.29 | −3.55 | −44.49 | 17.24 | −2.58 |
| Correlation Coefficient | R2 = 0.269 | R2 = 0.313 | ||||
While single stream recycling was to have a statistically significant impact on program costs, they were shown to have the opposite of their intended effect. The presence of single stream recycling in our models increase municipal program costs by $5,121 and $4,101 in our respective models. Curbside recycling and PAYT schemes are also shown to positively influence material management costs for municipalities. Income, age and education levels have no influence on municipal program costs—the costs of material management incurred by the municipality are independent of socio-demographic variables.
Figure 1 compares the collection and processing costs, realized revenues and total net costs for single and multi-stream recycling systems in Ontario, Canada.
As shown above, municipalities who implement single stream recycling face higher material management costs when compared to those who opt for multi-stream systems. This is contrary to our expectation that single stream recycling is cheaper than multi-stream systems. While collection costs for single stream collection are lower when compared to multi-stream municipalities, this savings is offset by significantly higher processing costs (48.7% higher) and lower realized revenue from sale of recyclable material (9.6% lower).
Figure 1.
Comparison of costs between single and multi-stream systems (sourced and adapted from [14]).
Figure 1.
Comparison of costs between single and multi-stream systems (sourced and adapted from [14]).
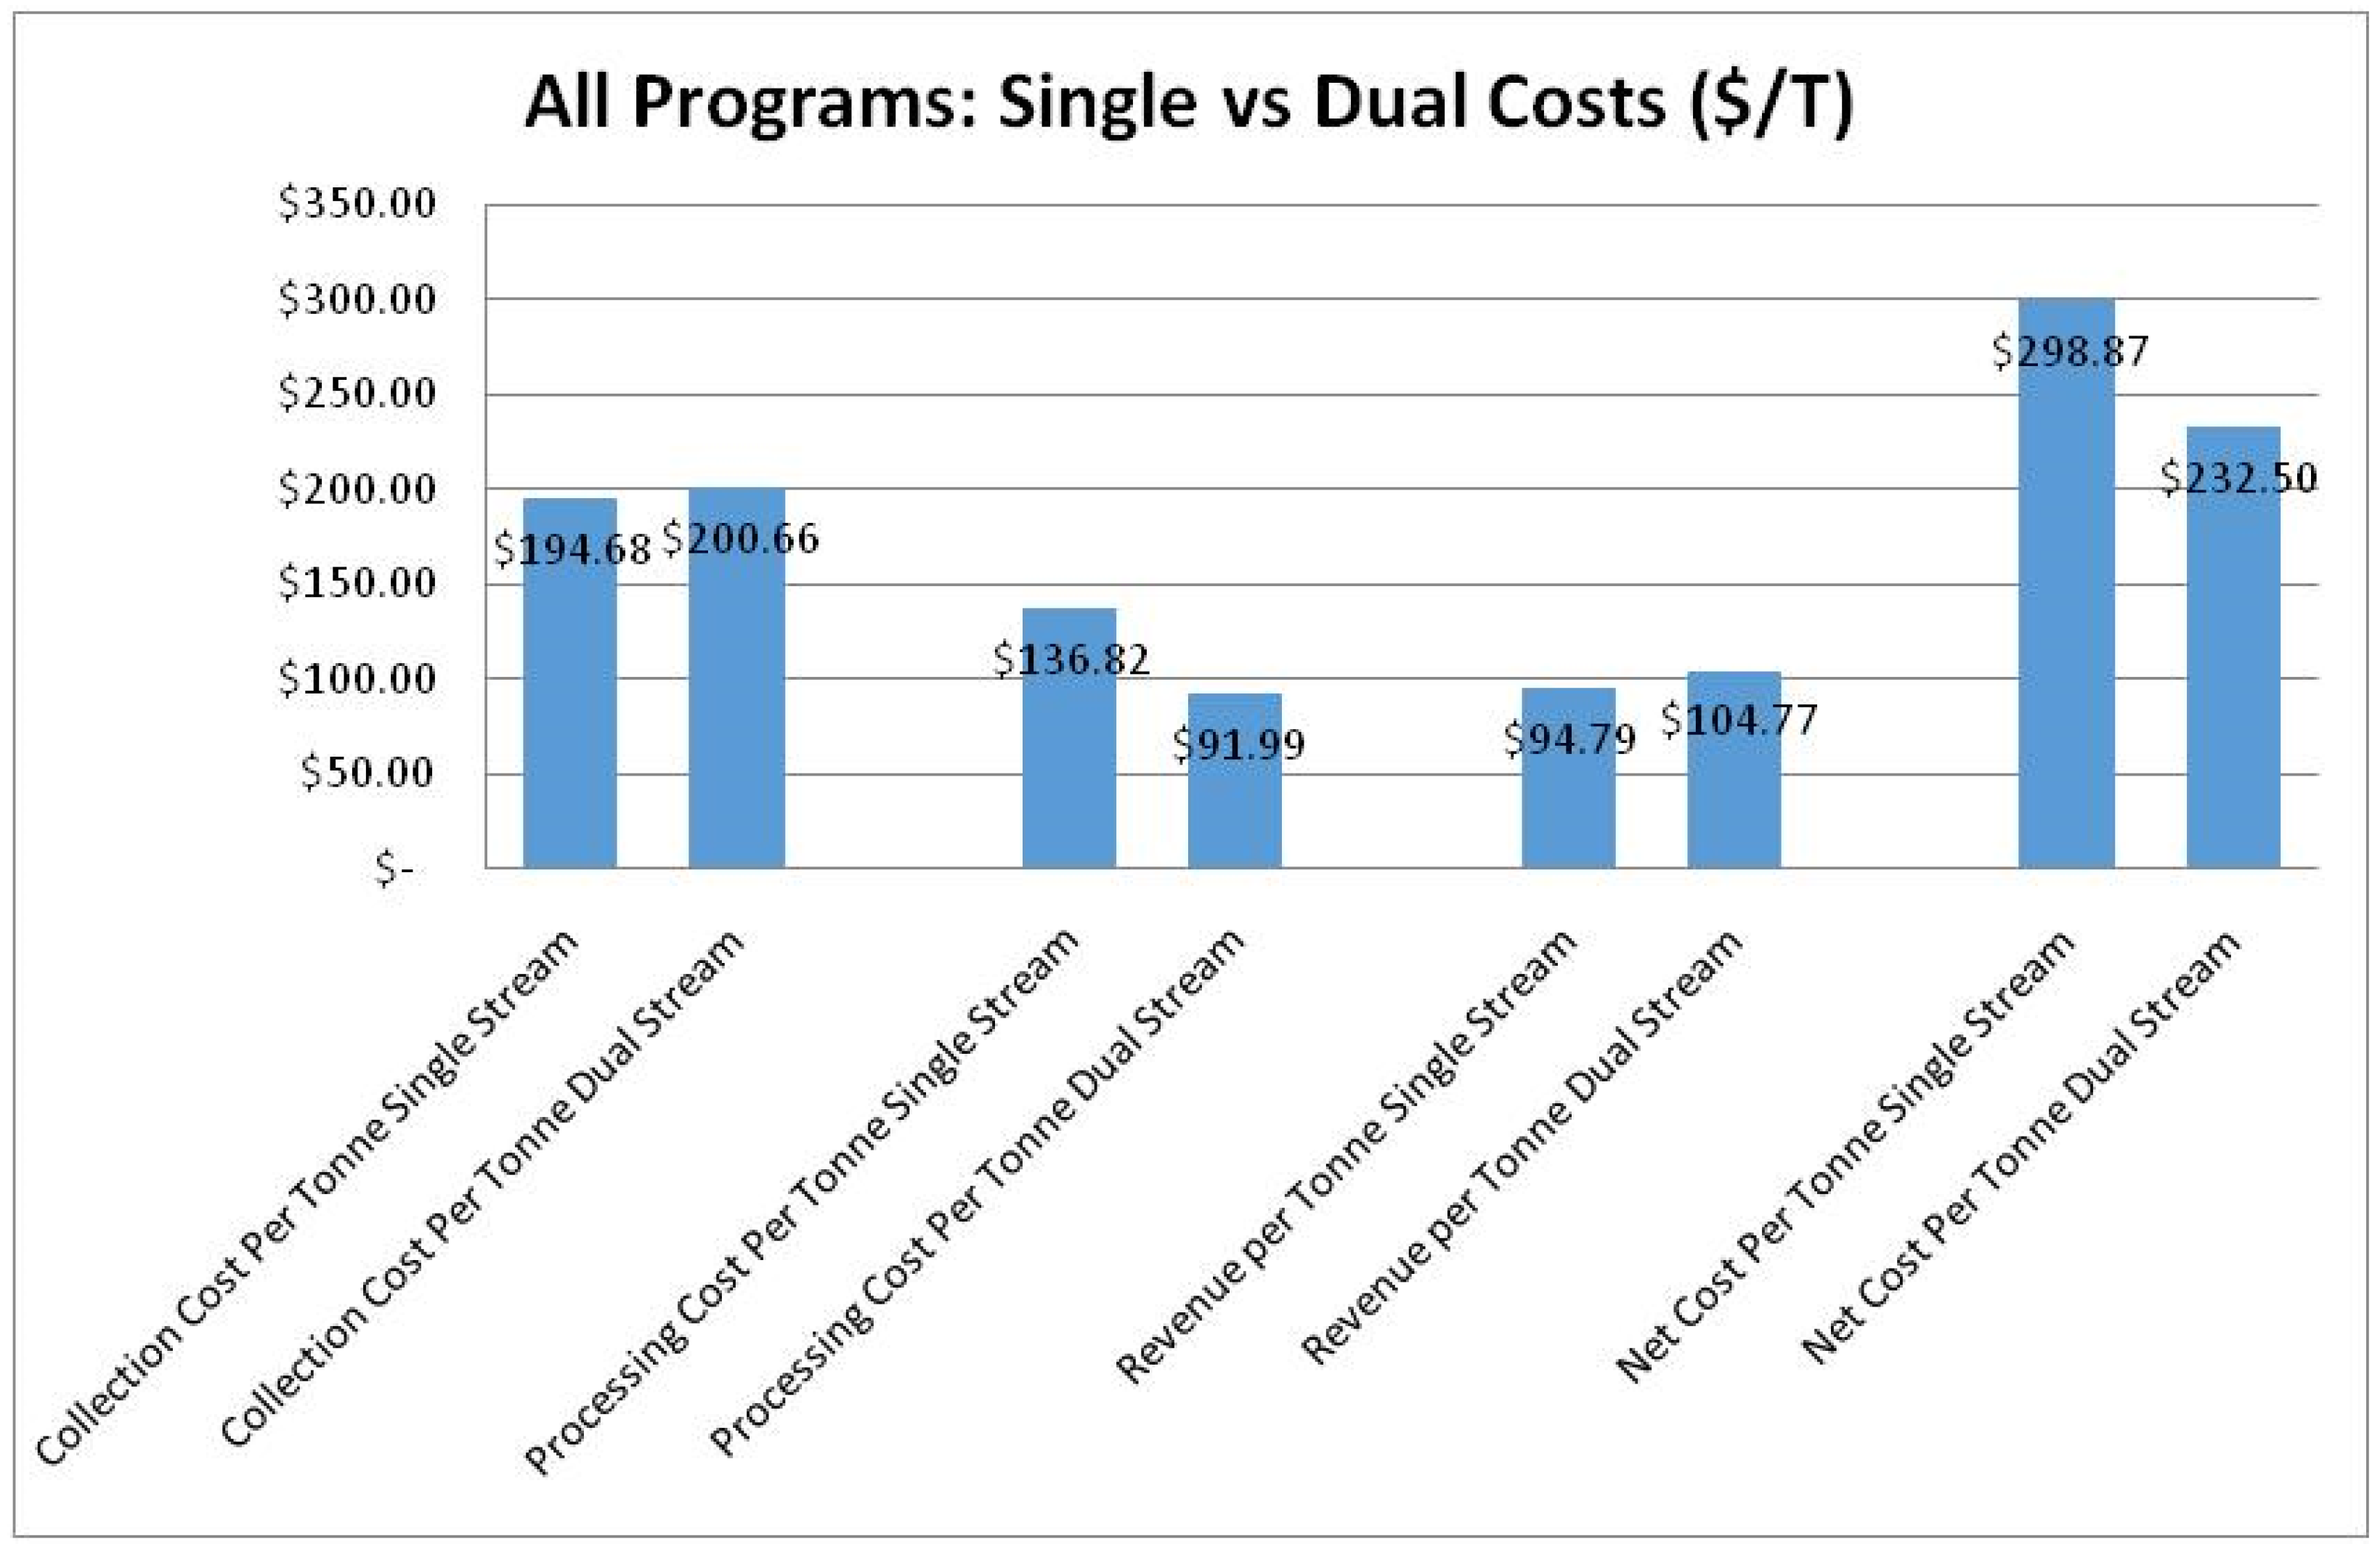
There is a general assumption held by municipal waste planners that the reduction in single stream collection costs will compensate for increased capital investments at the MRF. However, the analysis in this study found that the difference in collection costs between single and multi-stream systems was only 3%. Differences in processing costs between single and multi-stream systems was significant, which was consistent with previous findings from the literature. Additional investments in single stream MRF equipment (corrugated cardboard screens and optical sorters) inflate municipal processing costs. The general intuition behind increased mechanization at single stream MRFs is that greater volumes of material can be processed, reducing the per tonne cost of material management (costs are distributed across a greater quantity of material). While this study found that single stream MRFs are capable of processing more tonnes relative to multi-stream MRFs, the difference in processing capacity was insufficient at offsetting additional costs from investments in sorting technology. Furthermore, the quality of the recycled materials being processed in single stream materials is of inferior quality when compared to multi-stream MRFs (due to higher levels of contamination) resulting in lower realized revenues. While proponents of single stream recycling recognize that contamination and residue is higher in single stream systems, there is the assumption that savings in collection costs will more than compensate any loss in revenue (this study found that this was not the case).
5. Conclusion and Recommendations
This study highlights the differences in cost and recycling performance between single and multi-stream recycling systems in Ontario, Canada. Using data from 223 provincial municipalities over a 10 year period, it was found that municipalities who implement single stream recycling face higher material management costs than those that opt for multi-stream recycling. To date, municipal policy planning decisions have been predicated on single stream recycling being cheaper than multi-stream recycling. This study found the opposite to be true, with single stream recycling, on average, being 28.5% more expensive than multi-stream recycling. As such, the assertion that single stream recycling is a preferred waste management system needs to be revisited, as single stream recycling is demonstrably more costly for municipalities in Ontario.
Given that these findings not only contravene conventional wisdom, but directly contradict findings from previous investigations in this area, it begs the question as to why? Canada, and specifically Ontario, have unique infrastructural and operational characteristics that may result in differences in material management costs relative to other jurisdictions. The most salient of which are the inclusion of 23 materials in the residential recycling program. Many of these materials cannot be sorted at conventional MRFs (namely composite packaging, plastic laminants, polystyrene and plastic film), and often require significant investments in mechanized equipment/technology in order to sort/bale said materials. Such investments include optical sorters, plastic resin guns and air sorters. Given that these investments are often exclusive to single stream facilities (as multi stream facilities tend to rely more heavily on manual sortation), processing costs tend to be much higher. Further to that point, the revenue realized for the “difficult to manage” material is negligible—for example, one tonne of baled plastic film has a revenue of less than $10 a tonne. As such, there is very little return on investment for sorting technology at single stream MRFs. While these facilities are diverting more material, that material has little to no value on the open market. This upwards pressure on processing costs is sufficient to offset whatever savings are realized on the collection side.
This study also found that municipalities who implement single stream recycling divert more material than those that do not. The results of the regression analysis found that the presence of single stream recycling increased municipal recycling rates by 4.11%. This finding is consistent with previous expectations that single stream recycling increases recycling convenience for households, subsequently encouraging household participation in recycling activity. However, increasing recycling convenience for households does not necessarily result in increased levels of recycling awareness. As observed in [8], one of the issues associated with single stream recycling is that households may use recycling bins as a “catch all” container. Non-recyclable items may be erroneously placed in the recycling bin under the presumption that the items in question are accepted by the Blue Box program. Given that households are not expected to source separate recyclables into their respective material streams, awareness of “what goes in the bin” remains low. This results in greater quantities of contaminated material entering the MRF, and lower realized revenues for municipalities.
While this study is reluctant to offer guidance regarding which approach (single vs. multi-stream recycling) is more effective, some general recommendations are offered. These include:
- (1)
- Single stream recycling is most appropriate in densely populated urban areas where there are large quantities of recyclable material generated. The mechanization of single stream MRFs allow for significant material processing capacity. The greater the number of tonnes entering the MRF, the lower the processing costs per tonne will be. Having a critical mass of recyclable material available for collection and processing is integral in realizing the potential cost efficiencies of single stream recycling.
- (2)
- In areas where single stream recycling is offered, significant efforts should be made in educating households about what constitutes acceptable Blue Box materials. This is done to minimize levels of contamination at the MRF level and increase processing efficiency.
- (3)
- Municipalities with single stream recyclable collection should provide households with bins/carts that have sufficient space to accommodate for the generation of recyclables. Given that all recyclable materials are being placed in one bin/cart, there is a risk that there may be inadequate capacity for household recyclables.
- (4)
- Multi-stream recycling may be appropriate for municipalities who lack the requisite financial resources to invest in additional sorting technology. Alternatively, municipalities who wish to minimize costs at the expense of overall diversion may find multi-stream recycling preferable.
While there is no one “right approach” when choosing between single and multi-stream recycling, the results of this study find that municipalities should be cautious when touting single stream recycling as a preferred waste management strategy. As noted above, long held assumptions surrounding the cost competitiveness of single stream recycling are largely unfounded. There are site and situation specific factors that ultimately impact the effectiveness of both single and multi-stream recycling. These factors need to be carefully considered by municipalities when choosing which recycling system to implement.
Acknowledgments
Special thanks to Scott Slocombe for his guidance and input throughout the project.
Conflicts of Interest
The author declares no conflict of interest.
References
- Morawski, C. Single Stream Uncovered. Resour. Recycl. 2010, 3, 17–39. [Google Scholar]
- SWANA. To Single Stream or Not to Single Stream? In Proceedings of the US EPA Meeting, Philadelphia, PA, USA, 19 July 2007.
- Berenyi, E. Materials Recycling and Processing in the United States: 2007–2008 Yearbook and Directory; Governmental Advisory Associates, Inc.: Westport, CT, USA, 2007. [Google Scholar]
- Fitzgerald, G.; Krones, J.; Themelis, N. Greenhouse gas impact of dual stream and single stream collection and separation of recyclables. Resour. Conserv. Recycl. 2012, 69, 50–56. [Google Scholar] [CrossRef]
- Kinsella, S.; Gertman, R. Single Stream Recycling Best Practices Implementation Guide; Conservatree: San Francisco, CA, USA; Environmental Planning: San Jose, CA, USA, 2008. [Google Scholar]
- Technical White Paper: An Examination of Single Stream Recycling Systems; Solid and Hazardous Waste Education Centre, University of Wisconsin: Madison, WI, USA, 2005.
- Escambria County. Single Stream Report; SCS Engineers: Orlando, FL, USA, 2008. [Google Scholar]
- Waukesha County. Waukesha County Recycling System and Capacity Study; RRT Design and Construction: Madison, WI, United States, 2007. [Google Scholar]
- Recycling Collection Operations Review; CIF Project 176; Stantec Ltd.: Niagara Region, ON, Canada, 2009.
- Lantz, D. Metro Waste Paper Recovery Study. Resour. Recycl. 2008, 12, 24–30. [Google Scholar]
- Waste Diversion Ontario. About WDO. 2012. Available online: http://www.wdo.ca/content/?path=page81+item35937 (accessed on 25 July 2014).
- Ministry of the Environment. Ontario Environmental Protection Act: Ontario Regulation 101/94. Recycling and Composting of Municipal Waste. Available online: http://www.e-laws.gov.on.ca/html/regs/english/elaws_regs_940101_e.htm (accessed on 21 August 2014).
- Waste Diversion Ontario. Ontario Residential Diversion Rates. 2014. Available online: http://www.wdo.ca/files/8413/9040/6230/Datacall_Diversion_Rates_2012.pdf (accessed on 20 July 2014).
- Waste Diversion Ontario. Blue Box Financial Highlights and Summary. 2013. Available online: http://www.wdo.ca/content/?path=page82+item35932 (accessed on 25 July 2014).
- Kinsella, S.; Gertman, R. Performance Analysis High Volume of Single Stream Recycling Systems; Conservatree: San Francisco, CA, USA; Environmental Planning: San Jose, CA, USA, 2010. [Google Scholar]
- Tim Goodman & Associates. Single-stream and Dual-stream Recycling, Comparative Impacts of Comingled Recyclables Processing; Minnesota Pollution Control Agency: Minneapolis, MN, USA, 2006. [Google Scholar]
- Beck, R.W. Pennsylvania Recovered Material Study; Pennsylvania Department of Environmental Protection: Philadelphia, PA, USA, 2005. [Google Scholar]
- Sidique, S.F.; Lupi, F.; Joshi, S.V. The effects of behavior and attitudes on drop-off recycling activities. Resour. Conserv. Recycl. 2010, 54, 163–170. [Google Scholar] [CrossRef] [Green Version]
- Sidique, S.F.; Lupi, F.; Joshi, S.V. Factors influencing the rate of recycling: An analysis of Minnesota counties. Resour. Conserv. Recycl. 2009, 54, 242–249. [Google Scholar] [CrossRef]
- Lakhan, C. Exploring the relationship between municipal promotion and education investments and recycling rate performance: An Ontario case study. Resour. Conserv. Recycl. 2014, 92, 222–229. [Google Scholar] [CrossRef]
- Hong, S. The effects of unit pricing system upon household solid waste management: The Korean experience. J. Environ. Manag. 1999, 57, 1–10. [Google Scholar] [CrossRef]
- Callan, S.J.; Thomas, J.M. Analyzing demand for disposal and recycling services: A systems approach. East Econ. J. 2006, 32, 221–240. [Google Scholar]
- US EPA. Municipal Solid Waste in America—A Review. 1994. Available online: http://es.epa.gov/program/iniative/waste/wexrev.html (accessed on 21 July 2014). [Google Scholar]
- Kinnaman, T.C.; Fullerton, D. Garbage and recycling with endogenous local policy. J. Urban Econ. 2000, 48, 419–442. [Google Scholar] [CrossRef]
- Oskamp, S.; Harrington, M.J.; Edwards, T.C.; Sherwood, D.L.; Okuda, S.M.; Swanson, D.C. Factors influencing household recycling behavior. Environ. Behav. 1991, 23, 494–519. [Google Scholar] [CrossRef]
- Vicente, P.; Reis, E. Factors Influencing Households’ Participation in Recycling. Waste Manag. Res. 2008, 26, 140–146. [Google Scholar] [CrossRef] [PubMed]
© 2015 by the authors; licensee MDPI, Basel, Switzerland. This article is an open access article distributed under the terms and conditions of the Creative Commons Attribution license (http://creativecommons.org/licenses/by/4.0/).
Share and Cite
MDPI and ACS Style
Lakhan, C. A Comparison of Single and Multi-Stream Recycling Systems in Ontario, Canada. Resources 2015, 4, 384-397. https://doi.org/10.3390/resources4020384
AMA Style
Lakhan C. A Comparison of Single and Multi-Stream Recycling Systems in Ontario, Canada. Resources. 2015; 4(2):384-397. https://doi.org/10.3390/resources4020384
Chicago/Turabian StyleLakhan, Calvin. 2015. "A Comparison of Single and Multi-Stream Recycling Systems in Ontario, Canada" Resources 4, no. 2: 384-397. https://doi.org/10.3390/resources4020384