Article

Total Material Requirement of Growing China: 1995–2008

1
State Environmental Protection Key Laboratory of Eco-Industry, Northeastern University, No.11, Lane 3, Wen Hua Road, He Ping District, Shenyang, Liaoning 110819, China
2
Material Flows and Resource Management, Wuppertal Institute, P.B. 100480, Wuppertal 42004, Germany
*
Author to whom correspondence should be addressed.
Resources 2013, 2(3), 270-285; https://doi.org/10.3390/resources2030270
Submission received: 9 July 2013 / Revised: 4 August 2013 / Accepted: 9 August 2013 / Published: 20 August 2013

Abstract

:
This article presents the accounts of China’s Total Material Requirement (TMR) during 1995–2008, which were compiled under the guidelines of Eurostat (2009) and with the Hidden Flow (HF) coefficients developed by the Wuppertal Institute. Subsequently, comparisons with previous studies are conducted. Using decomposition, we finally examine the influential factors that have changed the TMR of China. The main findings are the following: (1) During 1995–2008 China’s TMR increased from 32.7 Gt to 57.0 Gt. Domestic extraction dominated China’s TMR, but a continuous decrease of its shares can be observed. In terms of material types, excavation constituted the biggest component of China’s TMR, and a shift from biomass to metallic minerals is apparent; (2) Compared with two previous studies on China’s TMR, the amounts of TMR in this study are similar to the others, whereas the amounts of the used part of TMR (Direct Material Input, DMI) are quite different as a result of following different guidelines; (3) Compared with developed countries, China’s TMR per capita was much lower, but a continuous increase of this indicator can be observed; (4) Factors of Affluence (A) and Material Intensity (T), respectively, contributed the most to the increase and decrease of TMR, but the overall decrease effect is limited.

1. Introduction

The remarkable economic and population growth of the 20th century was closely coupled to substantial increases in the extraction of natural resources, leading to increasing environmental impact [1]. Decoupling natural resource use from economic growth is crucial to the implementation of sustainable development [2]. Economy-wide material flow analysis (EW-MFA) has been regarded as a more and more important method of accounting for resource use [3,4]. These derived indicators, with their strength of generating highly aggregated information, can provide us with the basis to examine the resource use conditions, though the meaning of them is often questioned [5]. This contribution will focus on the input indicators, the total material requirement (TMR) and its main components, direct material input (DMI) and hidden flows (HF).
As an overall indicator, TMR was developed by the Wuppertal Institute to measure all of the material input required by a national economy [6]. The TMR of national economies comprises two major components: domestic resource flows and foreign resource flows [7,8], which can be further subdivided into direct material input (DMI) and hidden material flows (or ecological rucksacks [9]). TMR accounts for the primary material requirement of the production and consumption system of a country. Thus, TMR measures the material basis of a national economy, and it indicates the magnitude of the potential environmental pressures resulting from resource extraction and use.
Since the Wuppertal Institute introduced the accounting method of TMR, a growing number of studies on TMR has been conducted for Austria [10], China [11,12,13], the Czech Republic [14], Denmark [15], Germany [16,17], Finland [18], Italy [19], Japan [7,20], the Netherlands [7,21], Poland [22], Spain [23], Sweden [24], the United Kingdom [25,26] and the United States [7,21,27]. These studies cover a long time period and have enriched our knowledge of TMR. Most of these studies followed the methodological guidelines prepared by Statistical Office of the European Communities (EUROSTAT) [3] and Bringezu and Schuetz [8] to compile the accounts of DMI and HF, respectively. In the EUROSTAT (2001) guide [3], the concept of material flow accounting and the design of material flow indicators are specified. Subsequently, EUROSTAT published two revised versions of the guidelines of EW-MFA in 2007 and 2009 [28,29], which provide practical step-by-step procedures for the compilation of material flow accounts and improve the practicability of estimation procedures for domestic extraction of grazed biomass, limestone, sand and gravel, etc. These two versions significantly strengthen the methodological harmonization, in particular for the accounting of DMI. As for the hidden flows, after the publication of a technical report on TMR [8], more differentiated HF coefficients have been developed by the Wuppertal Institute. However, with the development of the accounting methods, few empirical studies on China’s TMR have been conducted since 2007. Thus, it is interesting and meaningful to examine the latest condition of China’s TMR and make comparison with previous studies.
The goals of this article are the following: (1) to quantify the resource use indicator, total material requirement (TMR), for the Chinese economy under the guidelines of EUROSTAT (2009) [29] and the newly developed HF coefficients; (2) to make comparison with previous studies on the TMR of China and developed countries; and (3) to elucidate factors that have changed the recent TMR in China. This study, a new MFA study on China’s TMR, is expected to provide the reference for international comparison and to contribute to the design of resource policies for China.

2. Methods

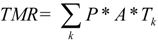
2.1. Accounting Method of TMR

The indicator, TMR, was accounted following three guidelines: the Technical Report of European Environment Agency “Total material requirement of the European Union: Technical part” [8], the EUROSTAT Methodological Guide “economy-wide material flow accounts and derived indicators” [7], and the “Economy-wide material flow accounts: Compilation guidelines for reporting to the 2009 EUROSTAT questionnaire” [29]. According to the first two reports, TMR comprises two major components: domestic material flows and foreign material flows. As shown in Table 1, they can be further subdivided into direct material input [DMI = Domestic Extraction Used (DEU) + Imports] and hidden flows (HF). Hidden flows were originally called “ecological rucksacks” in the MIPS-concept [9], and the EUROSTAT (2001) guide [3] addresses HF as indirect flows. Domestic hidden flows are usually called unused extraction, which will not enter the economy as raw materials (e.g., mining overburden, excavation in the construction of infrastructure). Foreign hidden flows comprise both used and unused extraction linked to imports and exports.
Table 1. Components of total material requirement (TMR); HF: hidden flows; DEU: domestic extraction used.
Components Material categories
DEUbiomass, metallic minerals, non-metallic minerals and fossil fuels
Importsbiomass, metallic minerals, non-metallic minerals, fossil fuels and others
Domestic HFbiomass, metallic minerals, non-metallic minerals, fossil fuels and excavations
Foreign HF (from Imports)HF from biomass, metallic minerals, non-metallic minerals, fossil fuels and others
According to MFA conventions, the DEU of biomass is expected to include all biomass of vegetable origin harvested by humans and their livestock, as well as fish capture and hunted animals [29]. In this study, the biomass extraction includes the amount of harvested primary crops (up to 190 items), used crop residues (10 items), harvest of fodder crops and grazed biomass (five items), wood extraction (seven items) and fish capture (two items). Hunted animals are not included, because no related data is available. The DEU of metallic minerals distinguishes data of iron ores and non-ferrous metal ores (eight items). The accounts for non-metallic minerals include stone and industrial use (17 items) and construction materials (three items: limestone, gravel and sand and clays and kaolin). The accounts of fossil fuels include solid energy resources and liquid and gaseous petroleum resources.
International trade material flows and monetary flows between China and its partners are well-recorded in the United Nations Commodity Trade Statistics Database [30]. At the most differentiated product level, we collected China’s imported goods (about 42,000 items) during 1995–2008. As the physical data (i.e., weight in kilograms) of imported goods is incomplete in the UN Comtrade, we estimated the missing part of the physical flows of imported goods (reported in monetary units) for China based on the calculation of the average global annual price per kilogram for each commodity group (see [31] for details). More than 3000 items of imported goods for China were estimated, which accounts for around 5% of the total weight of China’s imported goods in the studied period.
To account for the hidden flows associated with DEU, we found only direct data of hidden flows for non-ferrous metal ores and country-specific coefficients for hard coal and brown coal. For the other materials, we used the coefficients provided by the Wuppertal Institute, which stand for Germany. The soil excavations in China’s domestic hidden flows include excavation of building construction, excavation of road construction, excavation of water infrastructure and excavation of irrigation. As for the soil excavation of building construction and road construction, we used the coefficients from [32] (0.91 ton per finished square meter) and the coefficients for each class of road provided by the Wuppertal Institute. In terms of excavation of water infrastructure and irrigation, we can find direct data in China’s statistical yearbooks.
With regard to hidden flows of imports, the EUROSTAT (2001) guide [3] suggests converting the imported materials and commodities into Raw Material Equivalents (RME), firstly, and, then, the hidden flows of unused extraction associated to this RME. In this study, the hidden flows from imports of China were directly calculated from the imported materials and commodities with the coefficients provided by Wuppertal Institute, which also stand for Germany, because insufficient data can support the calculation of RME of China’s Imports for each year of the studied period.
In the technical report provided by Bringezu and Schuetz [8], domestic erosion was included in the accounting of TMR. However, only very roughly estimated data of domestic erosion can be found in China’s statistical books. As the conditions of domestic erosion differs significantly between countries [25,33], we decided not to include domestic erosion into China’s TMR. For the comparison with other countries, the domestic erosion was also removed from their TMR. As for the erosion of imports, we also excluded it in China’s TMR for consistency.
As the hidden flows of China were mostly calculated with the coefficients from Germany and the other European countries, an underestimation might be caused considering the relatively lower level of technology of China.

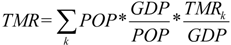
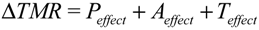
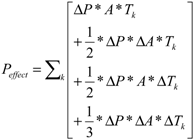
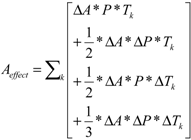
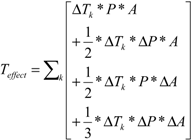
2.2. Decomposition Equation and Method

Decomposition analysis has been used since the 1970s, and recently, it has been applied to material flow analyses [34,35]. In this study, we used this technique to examine the influence factors of China’s TMR. The decomposition equations we used are in the following.
Resources 02 00270 i001
Resources 02 00270 i002
Therein, k represents the type of material (five types: TMR of biomass, metallic minerals, non-metallic minerals, fossil fuels and excavation). As the share of others (other products from imports) in TMR was negligible (see Figure 1), we allocated the values of other products into the other four categories based on their proportions to the total amount. POP represents population, GDP is given in US dollars for the price of 2000 and TMRk is TMR (ton) of material, k.
Equation (1) was developed from the well-known IPAT (Impacts = Population × Affluence × Technology) identity [36], which has been regarded as the “master equation” in industrial ecology [37]. Based on Equation (1), we divided the influence factors of TMR into three: The first factor (P) in Equation (2) represents population. We regard population as a main influential factor of China’s TMR. The second factor (A) in Equation (2) represents affluence, which can be expressed as GDP per capita. With the increase of Chinese people’s income, more materials are required, and it will influence TMR domestically. Thus, the factor of affluence is regarded as a key driving force for increasing China’s TMR. The third factor (Tk) represents the TMR of material k (TMRk) per unit of GDP. This factor is called material intensity for the purposes of this study. In Equation (2), factor T is the residual, which represents everything that affects the TMR that is not population and affluence. Therefore, the indirectly influential factors associated with T should also be considered (e.g., economic structure and consumption pattern).
If changes in these three factors described above can explain the variations of TMR, then these variations can be expressed by the following equation:
Resources 02 00270 i003
For this study, we use the additive form for this explanation (see [38] for decomposition methodology). Peffect, Aeffect and Teffect are respective effects of factors P, A and T on changes in TMR. The effects of each factor were calculated with a complete decomposition model [39]:
Resources 02 00270 i004
Resources 02 00270 i005
Resources 02 00270 i006
Based on the above equations, the respective effects of factors P, A and T on changes in TMR can be calculated.

2.3. Data Preparation

With regard to data collection of DEU, we used Chinese national data to account for fossil fuels, metallic minerals and non-metallic minerals. For the accounting of biomass and international trade flows, we used datasets of Food and Agriculture Organization (FAO) [40] and UN Comtrade [30]. The details are introduced in the following.
For all biomass extraction, we used data reported by FAO [40], except for data of fish capture, because data of fish capture for China in this dataset is insufficient. Thus, we collected relevant data from the 1996–2009 China Statistical Yearbooks [41]. Crop residues were estimated using harvest factors and recovery rates for the most common crop residues in Europe [42]. In the dataset of FAO, no data of fodder crops is provided for China. Therefore, we estimated the extracted fodder crops and grazed biomass based on livestock numbers [40] and daily roughage intake factors of different livestock species in Europe [29]. It is noteworthy that according to the guide of EUROSTAT (2009) [29], the amount of imported fodder crops was not subtracted. For China, this amount is only about two million tons in 2008, compared with 700 million tons of the total demand of fodder crops and grazed biomass. Thereby, little influence could be made by this double accounting. In addition, for this study, we adopted the daily biomass intake factors of livestock species in Europe, because no such factor was found for China, although the biomass intake factors might vary considerably within one species in different regions. This represents another data gap, which needs to be resolved in future work. Wood harvest is reported in terms of volume (solid cubic meters, scm). Then, we converted the volume data into weight data using factors provided by Penman and colleagues (2003) [43]. According to the guidelines of EUROSTAT (2009) [29], wood bark should be included; it accounts for approximately 10% of stem wood weight. All biomass flows were reported in fresh weight at the time of harvest, except for the harvest of fodder crops and grazed biomass, which were assumed to contain 15% moisture.
The DEU of metallic minerals distinguishes data of iron ores and non-ferrous metal ores, which were obtained from the 1996–2009 China Steel Industry Yearbooks [44] and China Nonferrous Metal Industry Yearbooks [45].
Material flow accounts for non-metallic minerals comprise two categories: non-metallic minerals for stone and industrial use and bulk materials used primarily for construction (limestone, gravel and sand and clays and kaolin). For the first category, we used data from the 1996–2009 China Land and Resources Statistical Yearbook [46]. A gap of missing physical data for a few years was estimated based on the relevant economic values. No sufficient data exists for extracted construction materials in China’s official statistical yearbooks. Therefore, we estimated their quantities according to the guidelines of EUROSTAT (2009) [29]. The estimation of limestone was based on data of cement production, which was presented in the 1996–2009 China Statistical Yearbooks [41]. The ratio of 1.19 tons of limestone for the production of one ton of cement was used [29]. The estimation of gravel and sand was based on concrete production and road construction. With respect to concrete production, the necessary input of sand and gravel to produce one ton of concrete is 6.09-times the input of cement [47]. Regarding road construction, we used the requirement factors of sand and gravel per kilometer of road construction [48]. Data of road construction length for China was obtained from the official website of the Ministry of Transport of China [49]. The estimate for clays and kaolin was based on the production of normal bricks and roof bricks. According to the guidelines of EUROSTAT (2009) [29] and the Chinese production standard of bricks, we estimated that 3.2 kg of crude clay was necessary to produce one piece of normal brick and that 16.5 kg of crude clay and kaolin were necessary to produce one square metre of roof brick. The brick production data was collected from the 1996–2009 China Construction Materials Industry Yearbooks [50].
The fossil fuel data was from the 1996–2009 China Energy Statistical Yearbooks [51].
Regarding imports, we first distinguished imported materials of biomass, metallic minerals, non-metallic minerals, fossil fuels and other products according to the guidelines of EUROSTAT (2009) [29], and then, we allocated the values of other products into the other four categories based on their proportions to the total amount.
To account for the hidden flows associated with DEU, we used direct data of hidden flows for non-ferrous metal ores from China Nonferrous Metal Industry Yearbooks [45]. For the other materials, the coefficients used are provided by the Wuppertal Institute. For the accounting of soil excavation of building construction, we collected data of the completed floor space from the 1996–2009 China Statistical Yearbooks [41]. For the accounting of soil excavation of road construction, we collected data of road construction length for China from the official website of the Ministry of Transport of China [48]. For the accounting of excavation of water infrastructure and irrigation, we collected data from the 1996–2009 China Water Resources Yearbooks [52].
As for the estimation of hidden flows from imports, we also used the coefficients provided by Wuppertal Institute.
For the decomposition analysis of China’s TMR, we collected data of GDP (at the constant price of 2000) and population from World Development Indicators 2010 [53] and the 1996–2009 China Statistical Yearbooks [41], respectively.
Finishing the data collection and estimation, we compiled the accounts for China’s TMR for 1995–2008. In the next section, we will present the indicator of the TMR for Chinese economy, with a subsequent general comparison with results from previous studies and the TMR of foreign countries.

3. China’s TMR and Its Comparison with Previous Studies

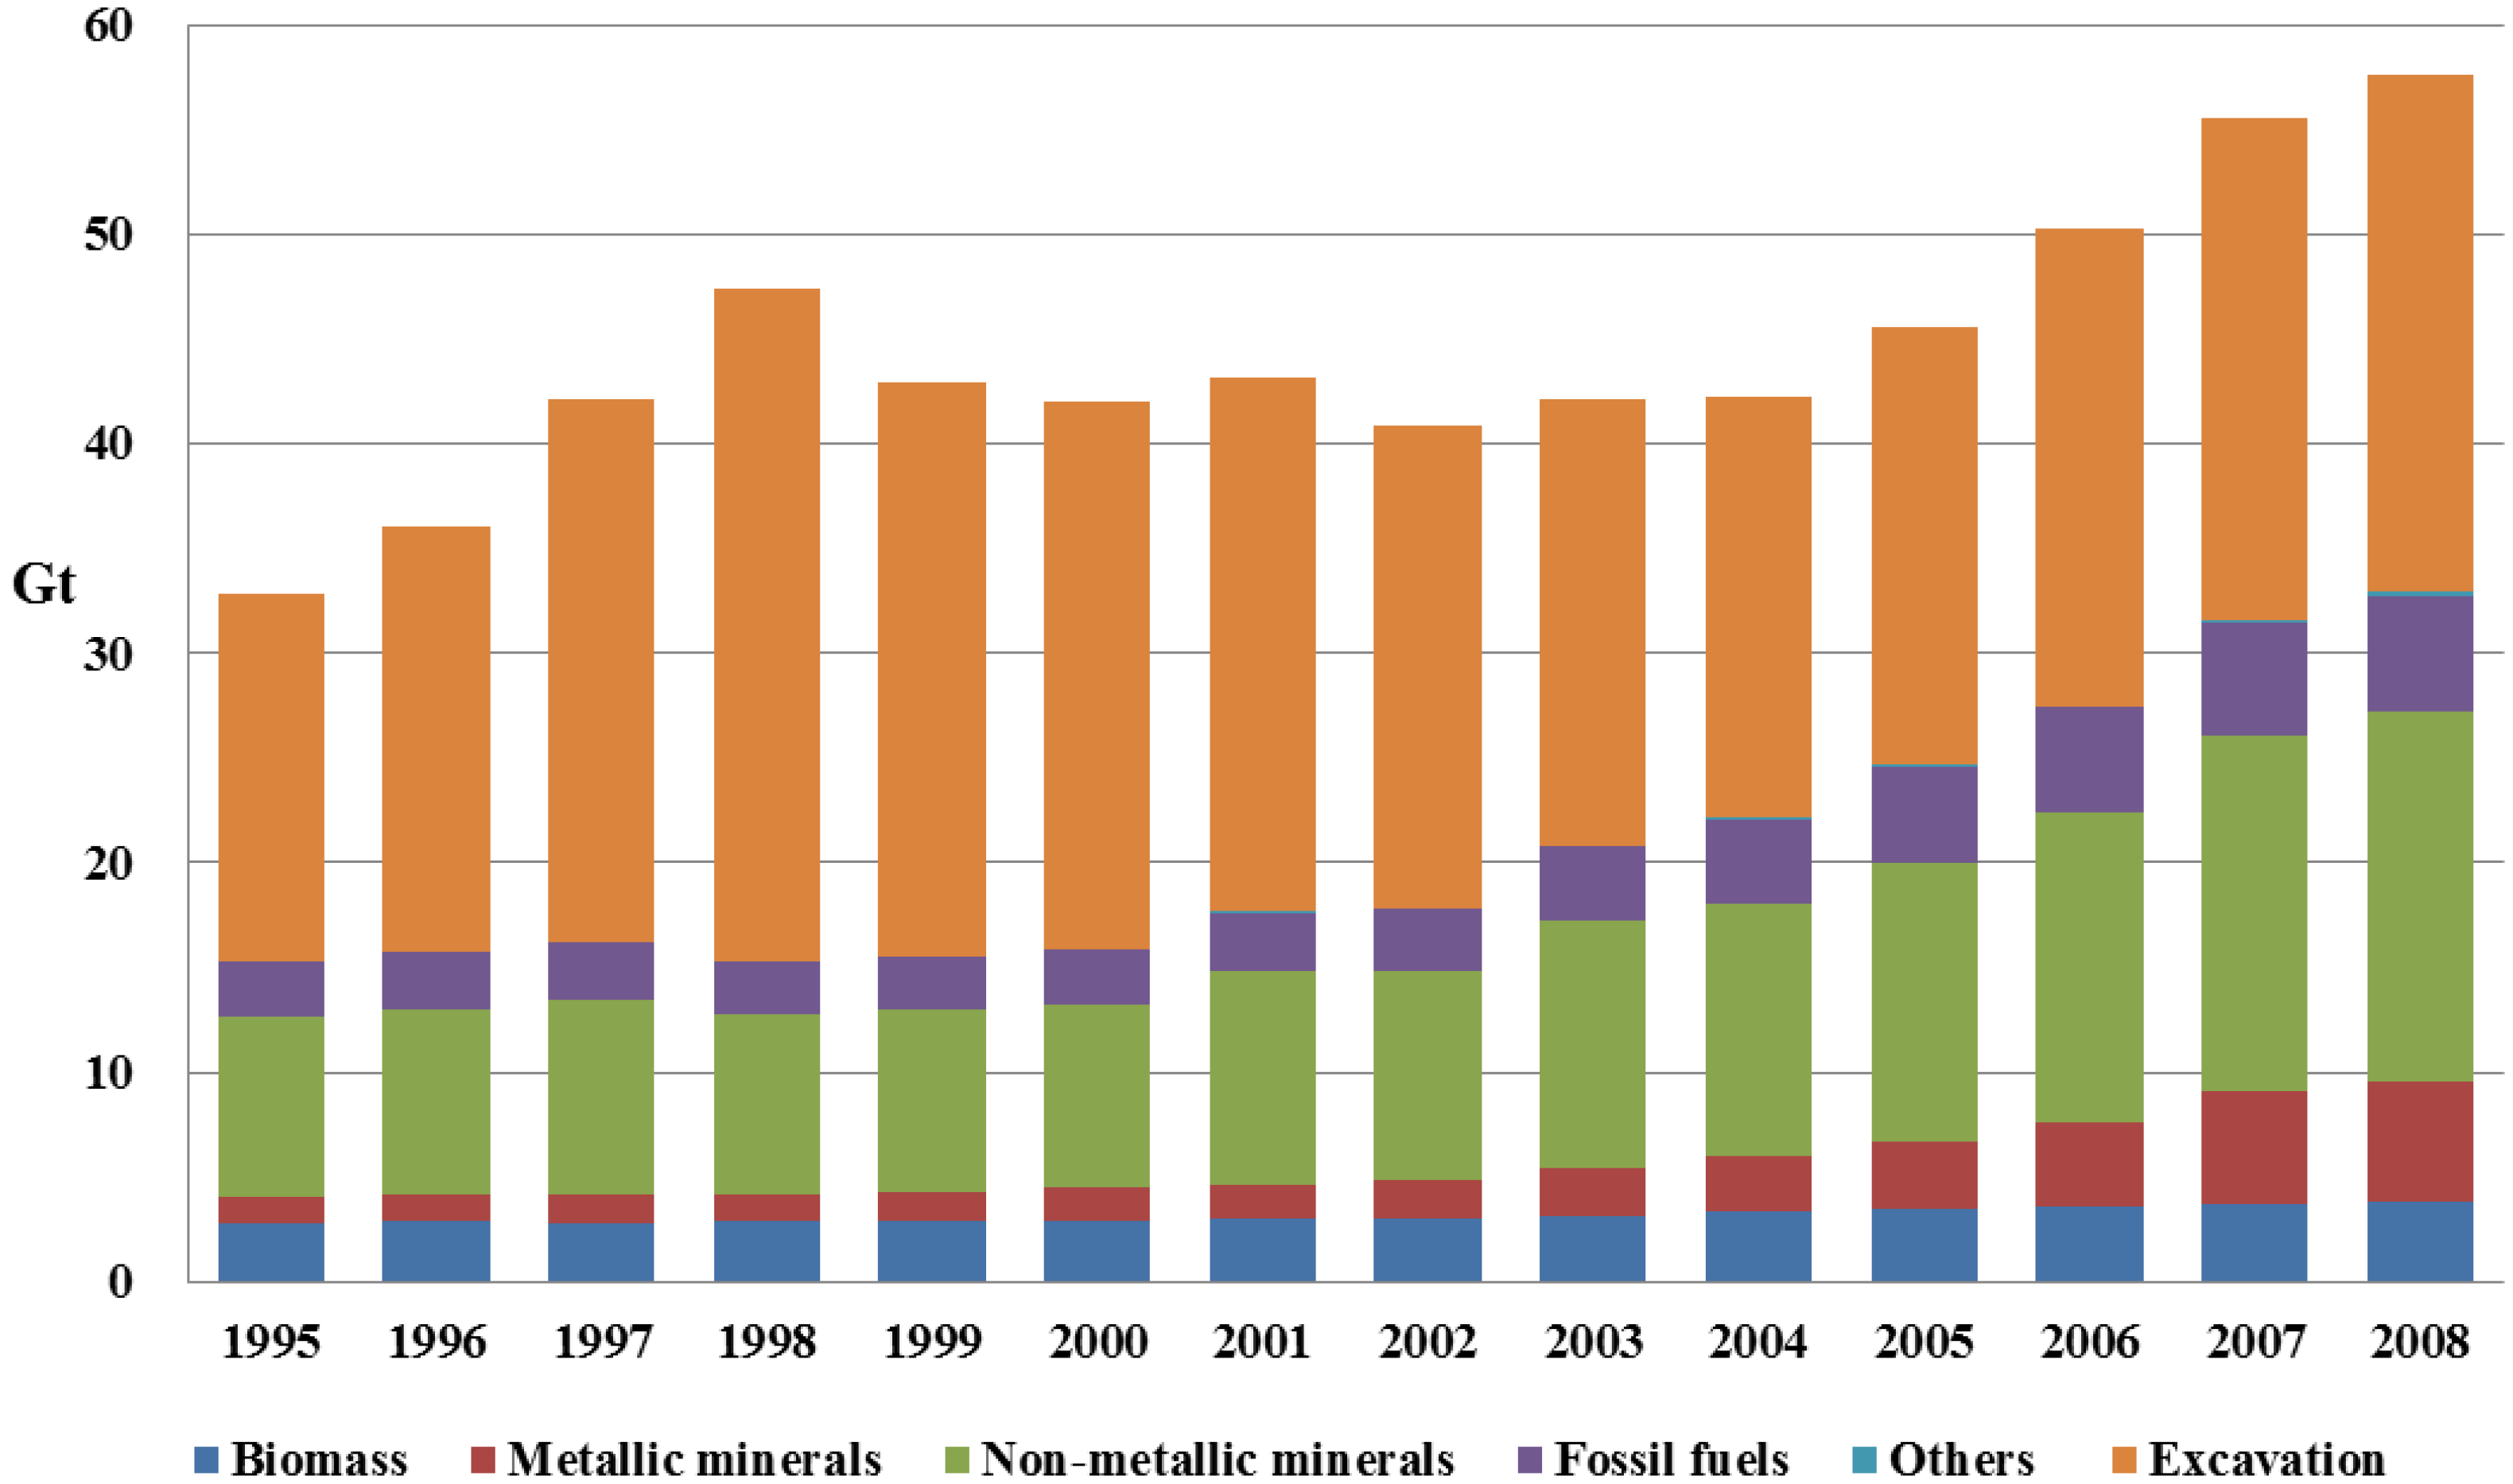
3.1. Composition of China’s TMR

Table 2 shows China’s TMR and its composition for 1995 to 2008. During this period the TMR of China more than doubled, rising from 32.7 Gt to 57.0 Gt. The average annual growth rate is about 4.4%.
Domestic extraction accounted in total for 91% to 98% of the TMR. A continuous decrease of its shares from 1995 to 2008 is apparent. The direct reason is that the imported materials (used and unused) increased more rapidly than domestic extraction, especially after 2001, when China entered the World Trade Organization (WTO).
DMI indicates the used part of the TMR, and it ranged between 24% and 39% of the TMR in the period from 1995 to 2008. A continuous increase of DMI from 1995 to 2008 is apparent, except for a slight slump in 1998 and 2002. The domestic DMI (DEU) and foreign DMI (imports) increased by a factor of 1.9 and 5.6, respectively.
The domestic hidden flows increased by about 50%, rising from 20.7 Gt in 1995 to 31.1 Gt in 2008. Hidden (i.e., indirect) flows associated with imports increased more quickly than domestic hidden flows, rising from 0.6 Gt to 3.8 Gt. The increase factor was 6.7, which is slightly larger than that of the direct flows of imports. This indicates that the general hidden flow coefficients of imported goods increased.
Table 2. Components of China’s TMR during 1995–2008; DMI: Direct Material Input.
Component19951996199719981999200020012002200320042005200620072008
Domestic Extraction Used DEU (Gt)11.311.611.811.311.411.312.612.514.314.916.318.120.221.0
Imports (Gt)0.20.20.20.20.20.30.40.40.50.60.70.81.01.0
DMI (Gt)11.411.812.011.511.611.713.012.914.815.517.018.921.222.1
Domestic HF (Gt)20.723.529.335.130.429.128.726.325.224.325.728.230.131.1
HF from Imports (Gt)0.60.60.70.70.81.11.31.41.82.02.42.73.83.8
TMR (Gt)32.735.942.047.342.841.842.940.641.841.945.149.855.057.0
Domestic share (%)97.797.797.998.097.596.696.195.694.693.693.193.091.491.4
Share of DMI in TMR (%)35.032.828.724.327.127.930.231.935.537.137.837.938.538.7
Figure 1 shows China’s TMR during 1995–2008 in a break-down by six major material types. Excavation dominates China’s TMR, and their share ranged between 43% and 68%. Among the four categories of excavation (excavations of roads construction, buildings construction, water infrastructure and irrigation), the excavation of irrigation accounts for 53%–86% of the total amount of excavations. Non-metallic minerals contribute second to China’s TMR, and their share ranged between 18% and 31%. We can observe an apparent shift from biomass to metallic minerals. During 1995–2008, the share of biomass decreased markedly, from 8.2% to 5.8%, whereas the TMR of metallic minerals increased substantially, more than doubling their share from 3.7% to 10.1%. It is noteworthy that the share of metallic minerals did not increase much until 2002. The share of fossil fuels increased from 8.0% to 9.8% during 1995–2008. The contribution of others (i.e., other imported goods) ranged between 0.1% and 0.2%, which was negligible.
Figure 1. Variations of China’s TMR in material types during 1995–2008.
Resources 02 00270 g001

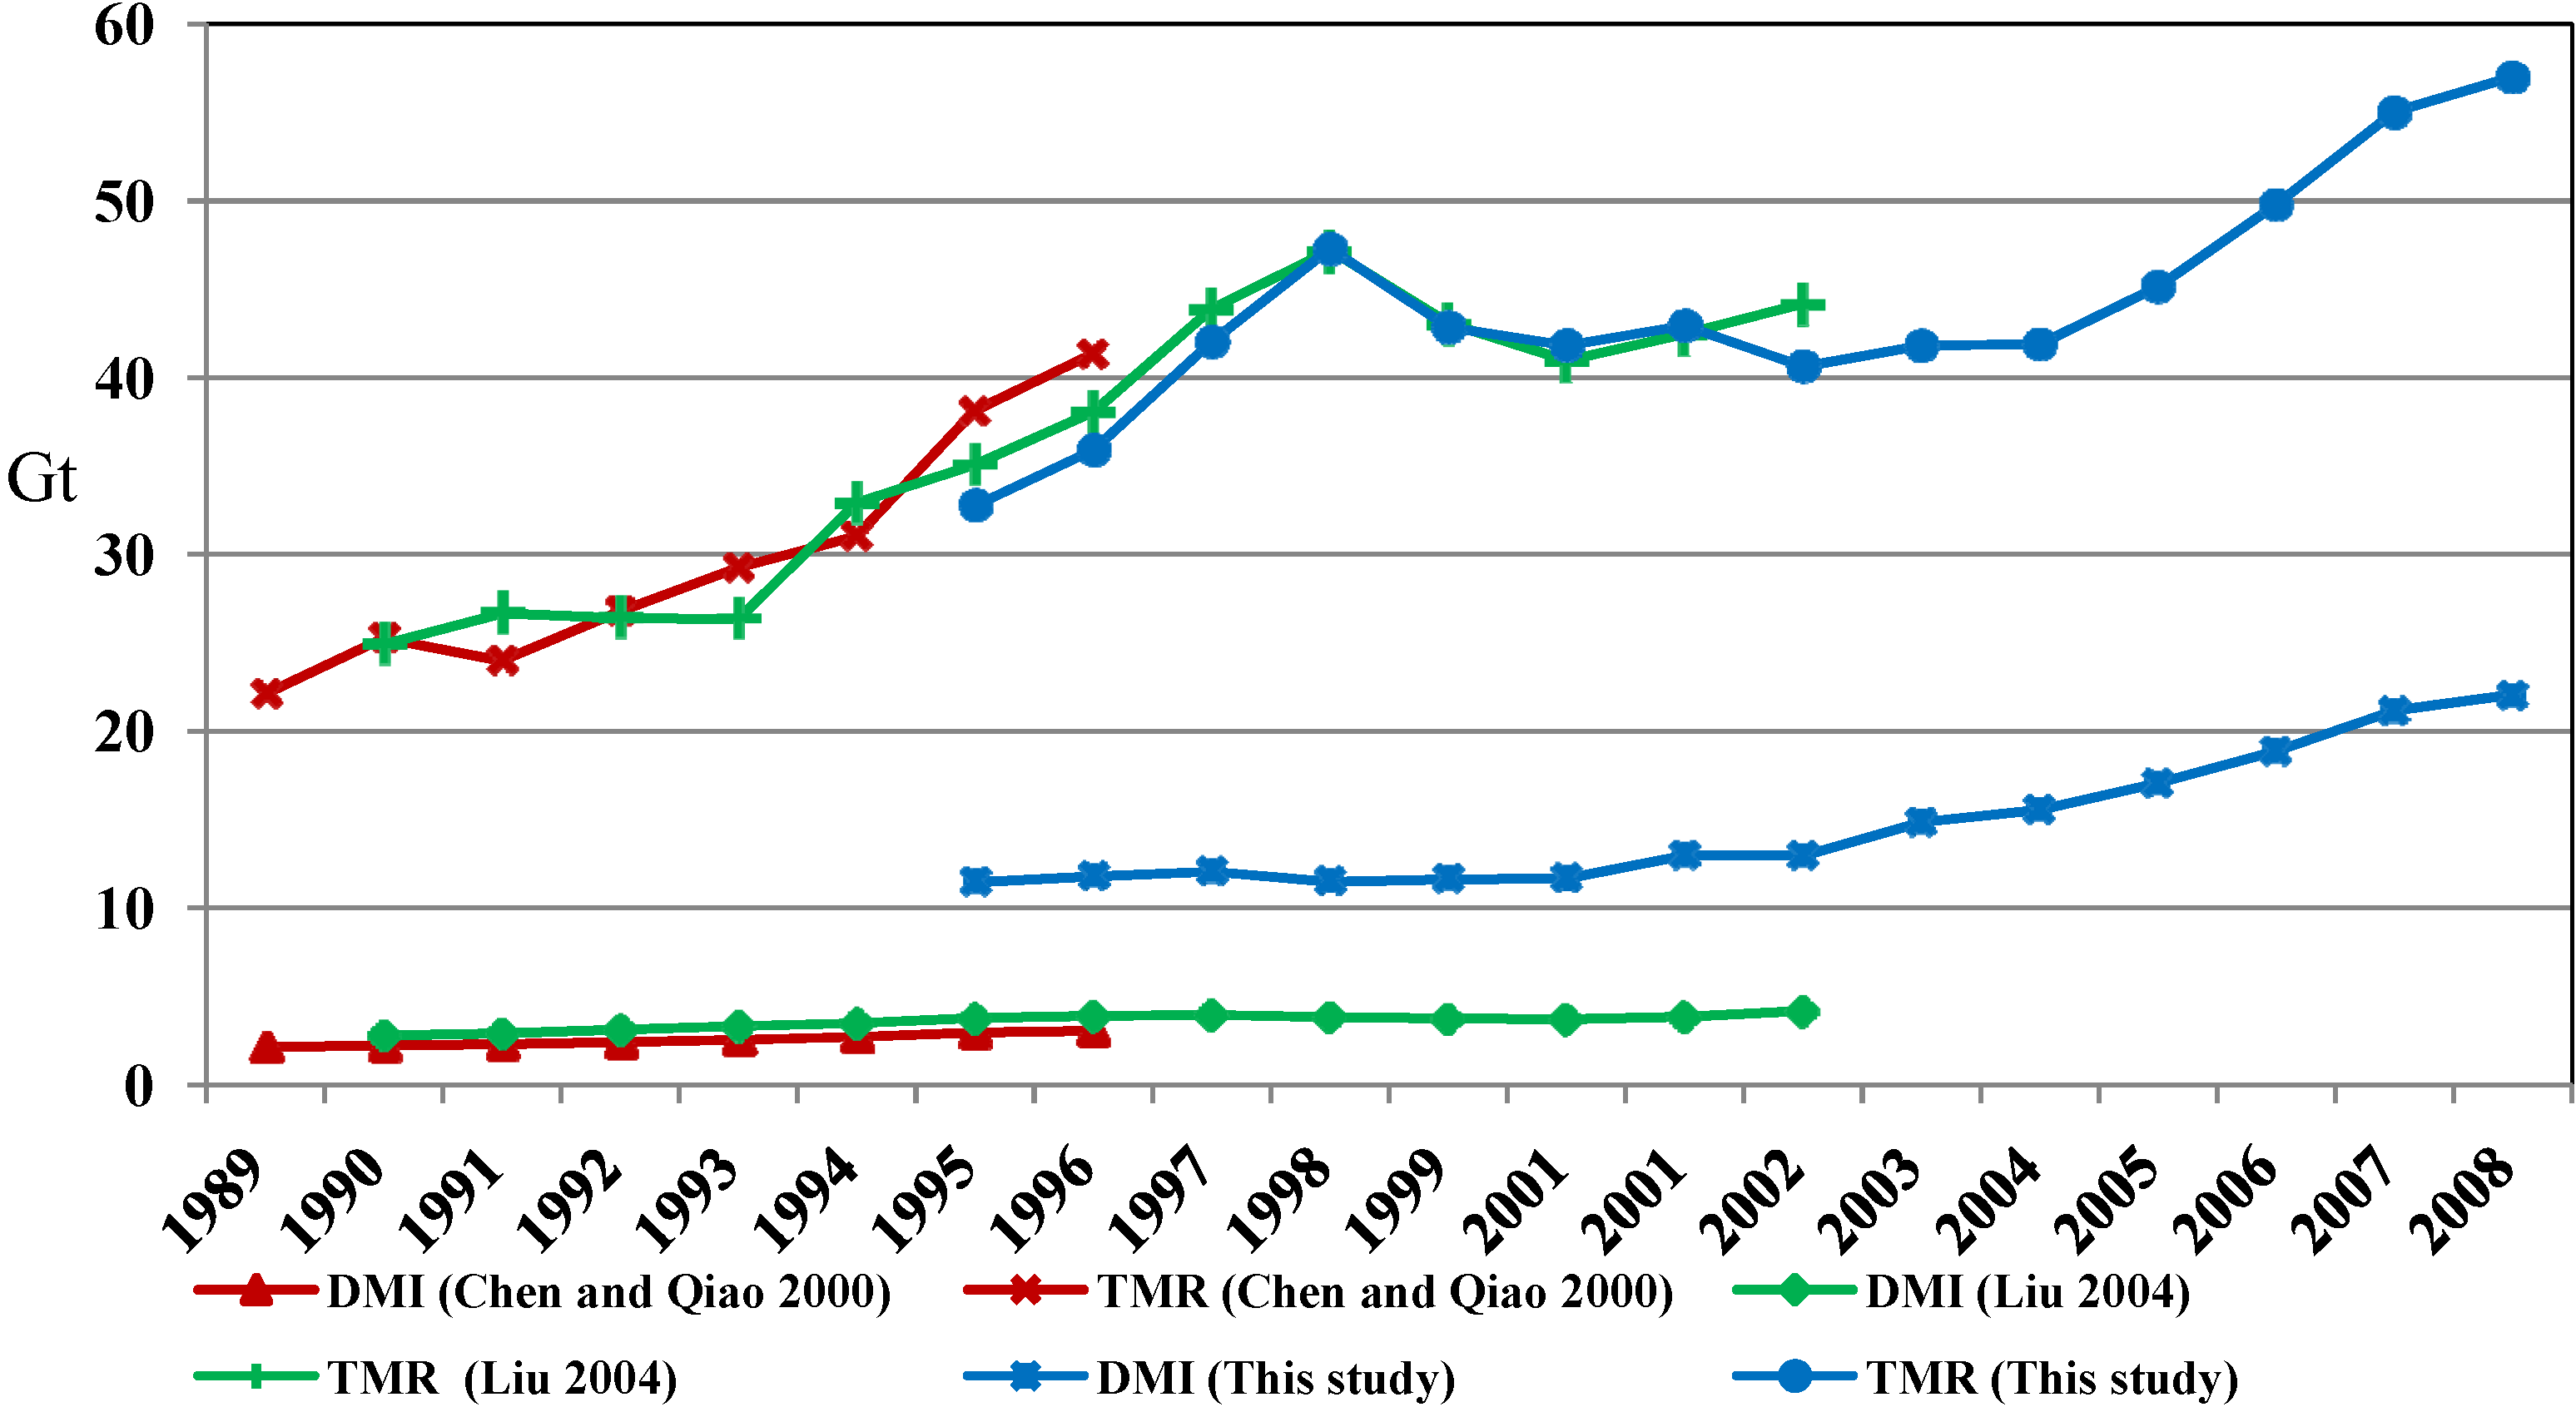
3.2. Comparison with Previous Studies

Because we followed the EUROSTAT 2009 guide to compile the material flow accounts for China’s DMI and we calculated China’s HF at the most differentiated level with new HF coefficients from the latest research, it would be interesting to compare our results with those of previous studies. As introduced above, three studies included the accounting of China’s TMR [11,12,13], but in [13], the soil excavations were not accounted for, so we would like to make a comparison between this work and the previous studies [11,12]. These studies cover a long time period and have enriched our knowledge of the TMR of China.
The comparison of China’s TMR between this work and previous studies is presented in Figure 2. In this comparison, erosion is not included in the TMR.
The amounts of TMR in this study are quite similar to the others, whereas the amounts of DMI in this work are much larger than the others. This is mainly because this study followed the EUROSTAT (2009) guide [29], which provides much more detailed and standard estimation procedures for construction materials (a main part of DMI), in particular, for sand and gravels. The estimated amounts of construction materials extracted domestically are much larger than the other studies [54]. As the HF coefficients of construction materials are much lower than the other materials, the increasing of construction materials would narrow the gap between TMR and DMI. In addition, this study estimated the hidden flows at the most differentiated level, in particular, for imported goods. The HF coefficients used in this study are relatively lower than the others.
Figure 2. Comparison of TMR and DMI of China between this study and previous studies. Data sources: [11,12].
Resources 02 00270 g002
Table 3 shows the comparison of main material components of TMR per capita between China and several developed countries. Data of TMR for the other countries were organized by Bringezu et al. [33]. Before 2000, China’s TMR per capita was much lower than the studied developed countries, but in 2008, it reached the UK’s (1999) and Japan’s (1994) level. However, compared to the other developed countries, in particular. Finland, Germany and the United States, the TMR per capita of China in 2008 is still at a low level.
Table 3. Main material components of TMR per capita for China and selected countries (tons/capita).
ComponentChinaChinaChinaFinlandGermanyNetherlandsUKEU-15USAJapan
1995200020081999200019931999199719941994
Biomass2.22.22.521.07.06.06.06.06.03.0
Used1.91.92.015.04.06.04.06.04.02.0
HF0.30.20.46.03.00.02.00.12.00.8
Minerals8.28.117.651.028.011.016.022.020.019.0
Used6.26.012.024.011.48.06.29.212.011.0
HF2.02.15.627.017.03.010.514.08.18.0
Fossil fuels2.22.14.210.029.015.014.015.031.013.0
Used1.31.32.56.06.010.06.04.08.03.0
HF0.90.81.74.023.04.08.011.023.09.0
Others0.020.010.095.01.011.00.40.31.40.6
Used0.010.010.010.80.64.00.40.20.40.1
HF0.010.010.084.00.08.00.00.10.90.4
Excavations14.520.618.68.03.07.03.03.013.09.0
DMI9.59.216.645.822.028.016.619.424.416.1
TMR27.033.042.995.068.050.039.446.371.444.6
Note: erosion is not included in TMR for these studies.
In terms of the contribution of each component, excavations accounted for around 50% of TMR for China, mainly because during the studied period, a huge amount of infrastructure was constructed (e.g., irrigation channels, the Three Gorges Dam, express highways and dwellings). This is also the reason why China’s requirement of minerals increased rapidly. For Finland, there is a tradition in mining and manufacturing of these materials, and its requirement of materials accounted for more than 50% of TMR. Fossil fuels constituted the biggest component of TMR for the other developed countries, but in China, it ranked third, behind excavations and minerals in 2008. It can be concluded that the components of TMR among countries differed widely as a result of different economic structures and development stages.

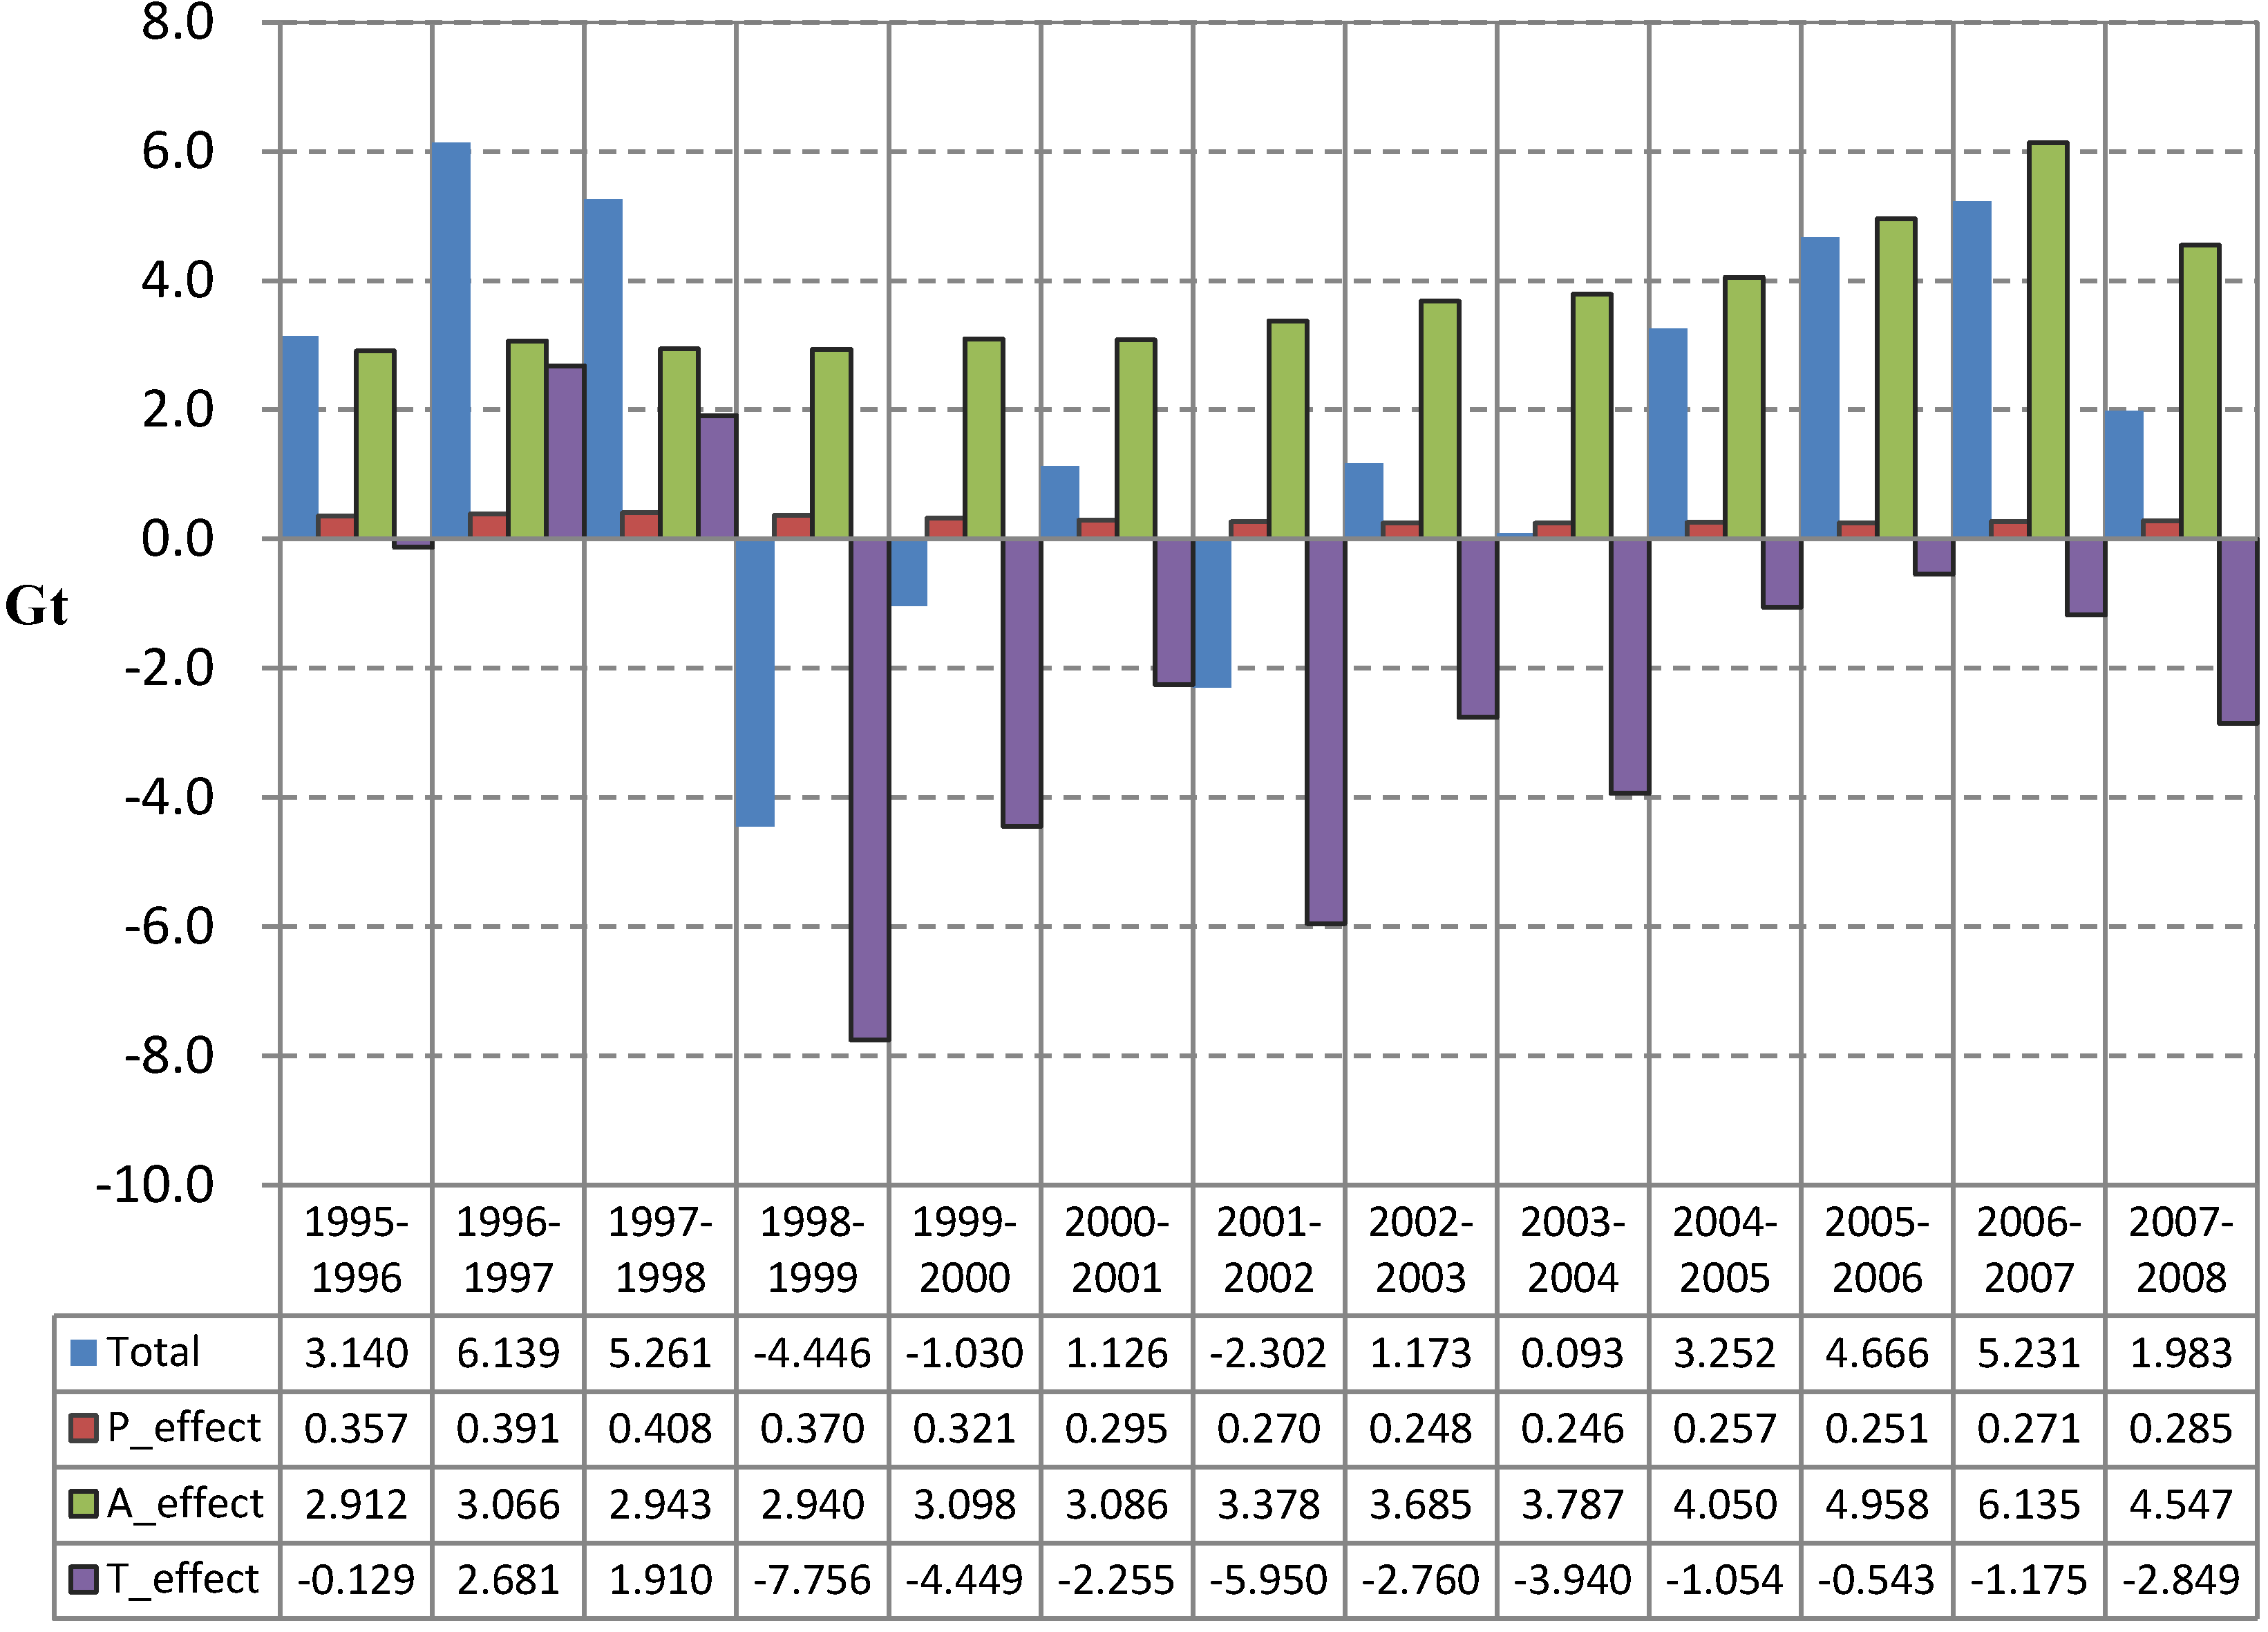
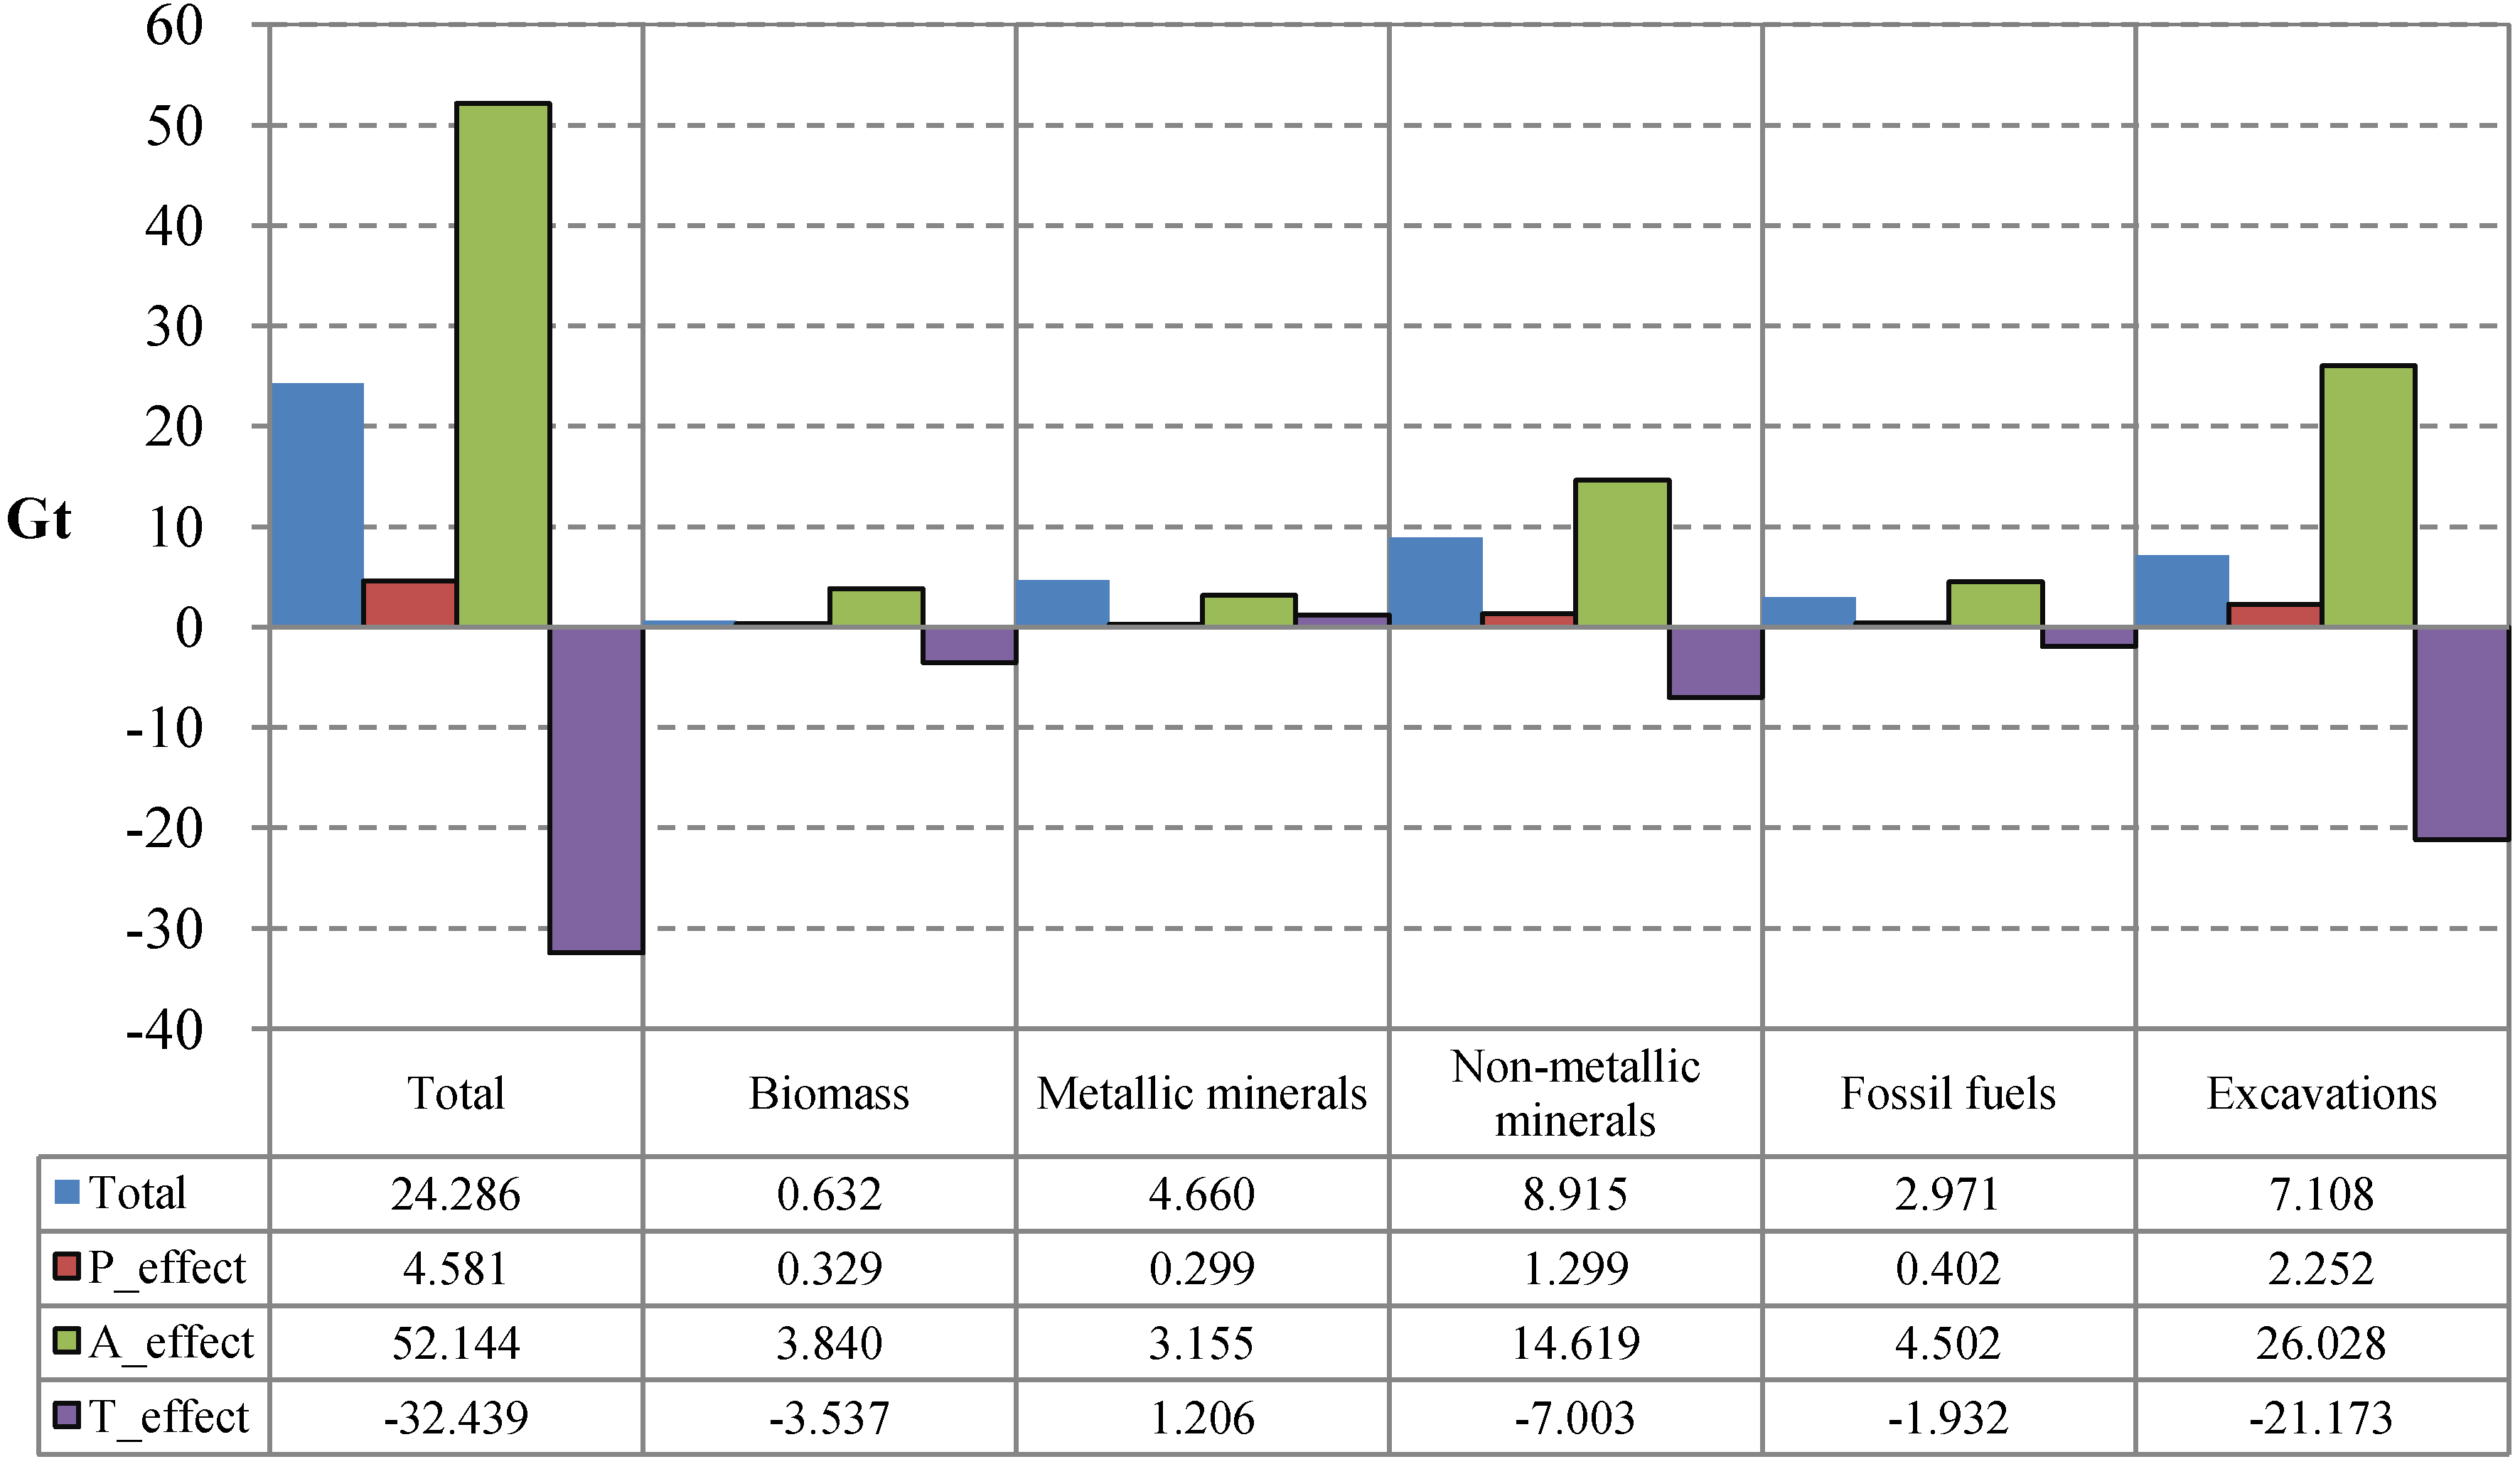
4. Decomposition Analysis of China’s TMR

Contributions by the three factors to the changes in China’s TMR are shown in Figure 3. During 1995–2008, affluence (A), raising from 650 $/capita in 1995 to 1,960 $/capita in 2008 (constant price of 2000), made the largest contribution to the increase of China’s TMR by more than 50 Gt; the slight increase of population (P) from 1.21 billion in 1995 to 1.33 billion in 2008 contributed 4.6 Gt of DMI. Conversely, the decrease in material intensity (T) from 41.3 t/1,000 $ in 1995 to 21.9 t/1,000 $ in 2008 lessened the increase in TMR. The effect of T is −32.4 Gt. Consequently, with the effects of these three factors, China’s TMR increased by around 24 Gt.
With respect to material groups, the biggest contribution was from non-metallic minerals, which increased by 8.9 Gt, accounting for more than 36% of the total increase of China’s TMR. Excavations, metallic minerals, fossil fuels and biomass increased by 7.1 Gt, 4.7 Gt, 3.0 Gt and 0.6 Gt, accounting, respectively, for 29%, 19%, 12% and 3% of the total increase of TMR. For all these three material groups, the effect of factor A accounted for the largest proportion of their increasing amounts. Factor P had little effect on changes of TMR, because only a relatively small growth rate in population happened. From Figure 3, it can also be observed that the effect of factor T accounted for a considerable decrease amount for all material groups, except for metallic minerals, whose intensity increased during the studied period.
Figure 3. Changes in China’s TMR and contributions of respective factors during 1995–2008. P_effect, A_effect and T_effect represent the respective effects of factor P (population), A (affluence) and T (material intensity) on changes in China’s TMR.
Resources 02 00270 g003
Furthermore, the trends of the effects for respective factors during 1995–2008 are examined on an annual basis. As shown in Figure 4, the effect of affluence (A) increased gradually and reached its peak value during 2006–2007 and decreased slightly during 2007–2008. This trend is nearly identical to that of China’s GDP growth. The effect of population (P) fluctuated between 0.24 Gt and 0.40 Gt, and a much wider fluctuation is observed for the effect of material intensity (T), which ranged between −7.8Gt and 2.7Gt. For most years, the effect of T played a positive role, but in the periods of 1996–1997 and 1997–1998, it played a negative role. The main reason is that during these periods, China finished a lot of irrigation construction and generated a huge amount of soil excavation.
In general, affluence (GDP per capita) contributed the most to the increase of China’s TMR, whereas the material intensity (T) had a considerable effect on its reduction. Considering that China’s GDP per capita remains at a lower level than those of developed countries, the increasing of Chinese people’s income would bring more demand from households, new infrastructure, buildings and vehicles. Consequently, more natural resources would be required for the Chinese economy. Therefore, it is crucial and urgent for China to strengthen the moderating effect of T.
Figure 4. Changes in TMR and contributions of respective factors for each year during 1995–2008. P_effect, A_effect and T_effect represent the respective effects of factor P (population), A (affluence) and T (material intensity) on changes in China’s TMR.
Resources 02 00270 g004

5. Conclusions

The derived indicators from economy-wide MFA provide the possibility of examining the physical performance of economies. The present article has shown the accounts of China’s TMR during 1995–2008, which were compiled under the guidelines of EUROSTAT (2009) and used more differentiated HF coefficients developed by the Wuppertal Institute. The analysis also examines influential factors that have changed the TMR of China, using decomposition of the TMR into factors of population (P), affluence (A), and material intensity (T). Conclusions drawn from the analyses described above are the following:
  • During 1995–2008, China’s TMR increased by 74%, rising from 32.7 Gt to 57.0 Gt. Domestic extraction dominated China’s TMR, but a continuous decrease of its shares can be observed. In terms of material types, excavation constituted the biggest component of China’s TMR, and a shift from biomass to metallic minerals is apparent.
  • Compared with two previous studies on China’s TMR, the amounts of TMR in this study are similar to the others, whereas the used part (DMI) shows quite different results. This is mainly because this study comprehensively estimated the construction materials, and different HF coefficients were used among these studies.
  • Compared with developed countries, China’s TMR (excluding erosion) per capita was much lower; however, a continuous increase of this indicator can be observed, and in 2008, it reached the UK’s (1999) and Japan’s (1994) level.
  • The factors of affluence (A) and material intensity (T) contributed most to the increase and decrease of TMR, respectively, with economic growth clearly overcompensating technological progress towards higher resource productivity. The population (P) factor had little effect on changes in China’s TMR. It is crucial and urgent for China to strengthen the moderating effect of T and enhance the decoupling of resource use from economic growth through higher efficiency.

Acknowledgments

This research was supported by the National Natural Science Foundation of China (71003018), the Key Programs on Social Development of Liaoning Province (2012201011), MOE Project of Humanities and Social Sciences (13YJCZH172, 13YJC790106) and Fundamental Research Funds for the Central Universities (N120302004). This support is greatly appreciated.

Declare

In 2005, the National Bureau of Statistics of China changed the statistical rules for road construction: before 2005, China did not include “rural roads” in “local roads”, but from 2005, the unaccounted rural roads before 2005 were included in the local roads. This change obviously enlarged the data gap of the length of built local roads between 2005 and previous years. Therefore, we estimated the length of built rural road during 1995–2004 according to the following assumption: the proportion of the sum of highways, national roads, federal state roads and district roads to rural roads during 1995–2004 is equal to that in 2005.

Conflicts of Interest

The authors declare no conflict of interest.

References

  1. United Nations Environment Programme (UNEP), Decoupling Natural Resource Use and Environmental Impacts from Economic Growth, A Report of the Working Group on Decoupling to the International Resource Panel; Fischer-Kowalski, M.; Swilling, M.; von Weizsäcker, E.U.; Ren, Y.; Moriguchi, Y.; Crane, W.; Krausmann, F.; Eisenmenger, N.; Giljum, S.; Hennicke, P.; Romero Lankao, P.; Siriban Manalang, A. (Eds.) UNEP: Paris, France, 2011.
  2. Wang, H.; Yue, Q.; Hashimoto, S.; Moriguchi, Y.; Lu, Z. Decoupling analysis of four selected countries: China, Russia, Japan and the USA during 2000–2007. J. Ind. Ecol. 2013, 17, 618–629. [Google Scholar] [CrossRef]
  3. Statistical Office of the European Communities (EUROSTAT), Economy–Wide Material Flow Accounts and Derived Indicators: A Methodological Guide; EUROSTAT: Luxembourg, 2011.
  4. Bringezu, S.; Moriguchi, Y. Material flow analysis. In A Handbook of Industrial Ecology; Ayres, R.U., Ayres, L., Eds.; Edward Elgar Publishers: Cheltenham, UK, 2002. [Google Scholar]
  5. Fischer-Kowalski, M.; Krausmann, F.; Giljum, S.; Lutter, S.; Mayer, A.; Bringezu, S.; Moriguchi, Y.; Schuetz, H; Schandl, H.; Weisz, H. Methodology and indicators of economy-wide material flow accounting. J. Ind. Ecol. 2011, 15, 855–876. [Google Scholar] [CrossRef]
  6. Bringezu, S.; Schuetz, H.; Moll, S. Rationale for and interpretation of economy-wide materials flow analysis and derived indicators. J. Ind. Ecol. 2003, 7, 43–64. [Google Scholar] [CrossRef]
  7. Adriaanse, A.; Bringezu, S.; Hammond, A.; Moriguchi, Y.; Rodenburg, E.; Rogich, D.; Schuetz, H. Resource Flows: The Material Base of Industrial Economics; World Resource Institute: Washington, DC, USA, 1997. [Google Scholar]
  8. Bringezu, S.; Schuetz, H. Total Material Requirement of the European Union, Technical Part; European Environment Agency: Copenhagen, Denmark, 2001. [Google Scholar]
  9. Schmidt-Bleek, F. Wieviel Umwelt Braucht Der Mensch? MIPS, Das Mass Fuer Oekologisches Wirtschaften; Birkhauser: Berlin, Germany, 1994. [Google Scholar]
  10. Gerhold, S.; Petrovic, B. Material Flow Accounts, Material Balance and Indicators, Austria 1960–1997; Eurostat Working Papers 2/ 2000/B/6; Office of Eurostat: Luxembourg, 2000. [Google Scholar]
  11. Chen, X.; Qiao, L. Material flow analysis of Chinese economic-environmental system. J. Nat. Resour. 2000, 15, 17–23. [Google Scholar]
  12. Liu, J. Material Flow Account and Resource Efficiency Revolution of China. Master’s Thesis, Northeastern University, Shenyang, China, 2004. [Google Scholar]
  13. Xu, M.; Zhang, T. Material flows and economic growth in developing China. J. Ind. Ecol. 2007, 11, 121–140. [Google Scholar]
  14. Scasny, M.; Kovanda, J.; Hak, T. Material flow accounts, balances and derived indicators for the Czech Republic during the 1990s: Results and recommendations for methodological improvement. Ecol. Econ. 2003, 45, 41–57. [Google Scholar] [CrossRef]
  15. Pedersen, O.G. Physical Input–Output Tables for Denmark: Products and Materials 1990,Air Emissions 1990–92; Statistics Denmark: Kobenhavn, Denmark, 1999. [Google Scholar]
  16. Bringezu, S.; Schuetz, H. How to measure the ecological sustainability of an economy? A contribution of materials flow accounting for the example of Germany. In New Approaches to Environmental Statistics; Bringezu, S., Berlin, S., Eds.; Birkhäuser Verlag, Basel, Switzerland, 1995. [Google Scholar]
  17. Bringezu, S. Industrial ecology: Material flow analyses for sustainable materials and resource management in Germany and Europe. In Handbook of Industrial Ecology; Ayres, R.U., Ayres, L., Eds.; Edward Elgar Publishers: Cheltenham, UK, 2002; pp. 288–300. [Google Scholar]
  18. Statistics Finland, Finland’s Natural Resources and the Environment 1999; Statistics Finland: Helsinki, Finland, 1999.
  19. De Marco, O.; Lagioia, G.; Mazzacane, E.P. Material flow analysis of the Italian economy. J. Ind. Ecol. 2000, 4, 55–70. [Google Scholar] [CrossRef]
  20. Moriguchi, Y. Material flow analysis and industrial ecology studies in Japan. In Handbook of Industrial Ecology; Ayres, R.U., Ayres, L., Eds.; Edward Elgar Publishers: Cheltenham, UK, 2002. [Google Scholar]
  21. Matthews, E.; Bringezu, S.; Fischer-Kowalski, M.; Huttller, W.; Kleijn, R.; Moriguchi, Y.; Ottke, C.; Rodenburg, E.; Rogich, D.; Schandl, H.; et al. The Weight of Nations: Material Outflows from Industrial Economies; World Resources Institute: Washington, DC, USA, 2000. [Google Scholar]
  22. Schuetz, H.; Welfens, M.J. Sustainable Development by Dematerialization in Production and Consumption—Strategy for the New Environmental Policy in Poland; Wuppertal Institute: Wuppertal, Germany, 2000. [Google Scholar]
  23. Arto, I. Using total material requirement to reduce the global environmental burden. J. Ind. Ecol. 2009, 13, 775–790. [Google Scholar] [CrossRef]
  24. Isacsson, A.; Jonson, K.; Linder, I. Material Flow Accounts, DMI and DMC for Sweden 1987–1997; Working Papers 2/2000/B/2; EUROSTAT: Luxembourg, 2000. [Google Scholar]
  25. Bringezu, S.; Schuetz, H. Material Use Indicators for the European Union,1980–1997: Economy-Wide Material Flow Accounts and Balances and Derived Indicators of Resource Use; Working paper 2/2001/B/2; EUROSTAT: Luxembourg, 2001. [Google Scholar]
  26. Schandl, H.; Schulz, N. Using Material Flow Accounting to Operationalize the Concept of Society’s Metabolism. A Preliminary MFA for the United Kingdom for the Period of 1937–1997; ISER Working Papers Number 2000-3; Office of Institute for Social and Economic Research: Essex, UK, 2000. [Google Scholar]
  27. Rogich, D.; Matos, G.R. Material flow accounts: The United States and the world. In Handbook of Industrial Ecology; Ayres, R.U., Ayres, L., Eds.; Edwar Elgar Publishers: Cheltenham, UK, 2002; pp. 260–287. [Google Scholar]
  28. Statistical Office of the European Communities (EUROSTAT), Economy-Wide Material flow Accounting: A Compilation Guide; European Statistical Office: Luxembourg, 2007.
  29. Statistical Office of the European Communities (EUROSTAT), Economy-Wide Material flow Accounts: Compilation Guidelines for Reporting to the 2009 EUROSTAT Questionnaire; European Statistical Office: Luxembourg, 2009.
  30. United Nations Commodity Trade Statistics Database Home Page. Available online: http://comtrade.un.org/ (accessed on 11th November 2010).
  31. Dittrich, M.; Bringezu, S. The physical dimension of international trade. Part 1: Direct global flows between 1962 and 2005. Ecol. Econ. 2010, 69, 1838–1847. [Google Scholar] [CrossRef]
  32. Hu, M.; van der Voet, E.; Huppes, G. Dynamic material flow analysis for strategic construction and demolition waste management in Beijing. J. Ind. Ecol. 2010, 14, 440–456. [Google Scholar] [CrossRef]
  33. Bringezu, S.; Schuetz, H.; Steger, S.; Baudisch, J. International comparison of resource use and its relation to economic growth: The development of total material requirement, direct material inputs and hidden flows and the structure of TMR. Ecol. Econ. 2004, 51, 97–124. [Google Scholar] [CrossRef]
  34. Hoffrén, J.; Luukkanen, J.; Kaivo-Oja, J. Decomposition analysis of Finnish material flows: 1960–1996. J. Ind. Ecol. 2000, 4, 105–125. [Google Scholar] [CrossRef]
  35. Hashimoto, S.; Matsui, S.; Matsuno, Y.; Nansai, K.; Murakami, S.; Moriguchi, Y. What factors have changed Japanese resource productivity? A decomposition analysis for 1995–2002. J. Ind. Ecol. 2008, 12, 657–668. [Google Scholar] [CrossRef]
  36. Commoner, B. The environmental cost of economic growth. In Population, Resources, Environment; Ridker, R.G., Ed.; U.S. Government Printing Office: Washington, DC, USA, 1972; pp. 339–363. [Google Scholar]
  37. Graedel, T.; Allenby, B. Industrial Ecology; Prentice Hall: Englewood Cliffs, NJ, USA, 1995. [Google Scholar]
  38. Ang, B.W.; Zhang, F.Q. A survey of index decomposition analysis in energy and environmental studies. Energy 2000, 25, 1149–1176. [Google Scholar]
  39. Sun, J.W. Changes in energy consumption and energy intensity: A complete decomposition model. Energy Econ. 1998, 20, 85–100. [Google Scholar] [CrossRef]
  40. FAO Statistical Databases Home Page. Available online: http://faostat.fao.org (accessed on 20th January 2011).
  41. National Bureau of Statistics of China, China Statistical Yearbook 1996–2009; China Statistics Press: Beijing, China, 1996.
  42. Wirsenius, S. Human Use of Land and Organic Materials: Modeling the Turnover of Biomass in the Global Food System. Master’s Thesis, Chalmers University of Technology, Gothenburg, Sweden, 2000. [Google Scholar]
  43. Penman, J.; Gytarsky, M.; Hiraishi, T.; Krug, T.; Kruger, D.; Pipatti, R.; Buendia, L.; Miwa, K.; Ngara, T.; Tanabe, K.; et al. Good Practice Guidance for Land Use, Land–Use Change and Forestry; Institute for Global Environmental Strategies: Kanagawa Prefecture, Japan, 2003. [Google Scholar]
  44. Editing Committee of China Steel Industry Yearbook, China Steel Industry Yearbooks 1996–2009; China Metallurgy Press: Beijing, China, 1996–2009.
  45. Editing Committee of China Nonferrous Metal Industry Yearbook, China Nonferrous Metal Industry Yearbooks 1996–2009; China Statistics Press: Beijing, China, 1996–2009.
  46. Ministry of Land and Resources of China, China Land and Resources Statistical Yearbooks 1996–2009; China Geology Press: Beijing, China, 1999–2009.
  47. PCA (2007): Cement and Concrete Basics. Available online: http://www.cement.org/basics/concretebasics_concretebasics.asp (accessed on 25th January 2011).
  48. Steger, S.; Fekkak, M.; Erren, M.; Lischka, S.; Bringezu, S.; Scharp, M. Determining the Current Stock Size and the Material Memory of the Reference Systems; Office of Wuppertal Institute for Climate, Environment and Energy: Wuppertal, Germany, 2009. [Google Scholar]
  49. Ministry of Transport of China. Available online: http://www.moc.gov.cn/zhuzhan/tongjigongbao/hangyenianjian/201009/t20100927_844402.html (accessed on 20th January 2011).
  50. Editing Committee of China Construction Materials Industry Yearbook, China Construction Materials Industry Yearbooks 1996–2009; China Construction Materials Industry Press: Beijing, China, 1996–2009.
  51. Editing Committee of China Energy Statistical Yearbook, China Energy Statistical Yearbooks 1996–2009; China Statistics Press: Beijing, China, 1996–2009.
  52. Editing Committee of China Water Resources Yearbook, China Water Resources Yearbooks 1996–2009; China Statistics Press: Beijing, China, 1996–2009.
  53. The World Bank. World Development Indicators. Available online: http://data.worldbank.org/data-catalog/world-development-indicators (accessed on 12 November 2010).
  54. Wang, H.; Hashimoto, S.; Moriguchi, Y.; Yue, Q.; Lu, Z. Resource use in growing China: Past trends, influence factors and future demand. J. Ind. Ecol. 2012, 16, 481–492. [Google Scholar] [CrossRef]

