Article

The Circularity of Materials from the Perspective of a Product Life Cycle: A Life Cycle Assessment Case Study of Secondary Fence Boards—Part 1 (Baseline Scenario)

by
Joanna Kulczycka
1,
Anna Lewandowska
2,
Katarzyna Joachimiak-Lechman
2,* and
Przemysław Kurczewski
3
1
Mineral and Energy Economy Research Institute, Polish Academy of Sciences, 31-261 Kraków, Poland
2
Institute of Management, Poznan University of Economics and Business, 61-875 Poznań, Poland
3
Faculty of Civil and Transport Engineering, Poznan University of Technology, 60-965 Poznań, Poland
*
Author to whom correspondence should be addressed.
Resources 2024, 13(4), 50; https://doi.org/10.3390/resources13040050
Submission received: 28 December 2023 / Revised: 13 March 2024 / Accepted: 27 March 2024 / Published: 1 April 2024

Abstract

:
In the era of the circular economy, solutions aimed at increasing the circularity of materials and products are highly welcome. Eco-design and waste management strategies are crucial for ensuring circularity and resource-saving. Strategies should be driven by assessing life cycle-based environmental performance. Tools to measure this performance should take into account two recycling-oriented parameters: recycled content and recycling rate. This paper presents the results of a life cycle assessment case study for a secondary fence board (baseline scenario). The circular footprint formula has been used to allocate burdens and credits between the supplier and the user of recycled materials. The potential environmental impact and the most significant issues have been calculated, identified, and presented. A general recommendation for further environmental development of the secondary fence board is to improve the production-related energy efficiency of recycling processes and increase the recycling rate of the board (to avoid landfilling).

1. Introduction

Waste constitutes one of the main challenges of today’s world and is of great environmental, social, and economic importance. In recent years, the total mass of waste generated by all NACE activities and households within the 27 European Union countries amounted to around 2 billion tonnes per year, with a total of 2.152 billion tonnes in 2020 [1]. This represents an average of almost 5 tonnes of waste per year per European Union inhabitant, with a large variation between countries (e.g., in Finland, it is 21 tonnes, while in Latvia, it is only 1.5 tonnes per capita). The waste volume is expected to increase by 70% by 2050 [2,3]. A new Circular Economy Action Plan (CEAP) aims to reduce the consumer footprint over the next decade and double the rate of materials used in a closed circuit, which affects waste directly, as it is intended to be an important source of raw materials [3]. Packaging waste management systems can be considered important pillars in national waste management. Based on packaging waste models from the following countries: Germany, France, the United Kingdom, the Netherlands, Portugal, Denmark, Spain and Italy, it can be deduced that people play a role in creating a more circular economy in relation to the minimisation of packaging waste and recycling. One of the most important drivers of product design and usage is public acceptance [4]. The importance of policymakers in this field is growing.
To support the circular economy, policymakers have a whole set of tools in the form of taxes, subsidies, approval of materials and eco-design standards. The special report 17/2023: Circular economy–Slow transition by member states despite EU action included a note that under the cohesion policy, the European Commission should consider the scope for providing more incentives for the development of projects targeting circular product design [5]. The Commission accepted this recommendation and will analyse investment needs for the circular economy for 2030 and beyond with a view to integrating the results into its future policy developments [6]. Sustainability requirements supporting the circular economy, which stem from the proposal for a regulation on eco-design for sustainable products, are also subject to negotiations between the co-legislators with a view to their final adoption by 2024 [6].
Eco-design is one of the elements of the CEAP, and its role is highlighted in the European Green Deal. The European Green Deal has announced initiatives along the entire life cycle of products. For this reason, the role of measuring environmental performance over the life cycle of products and their packaging is expected to increase significantly in the coming years. With the adoption of the EU’s targets for a circular economy, intensive development of recycling technologies is expected. Tools that measure environmental performance by taking into account the recycled content (R1) and the recycling rate (R2) may become particularly important. Both relate to the material structure and product design, but they relate to two distinct life cycle stages. Recycled content refers to the beginning of the life cycle and the acquisition of raw materials (the cradle), reflecting the manufacturers’ decisions to use recycled materials for production. On the other hand, the recycling rate relates to the end of life (EoL) and reflects the manufacturers’ decisions regarding the choice of recyclable materials. Both parameters are indicative of the condition of waste management systems. On the one hand, what matters is the producers’ will and the design of products, but on the other hand, producers’ design decisions must be supported by technological development and effectively functioning waste management systems.
The main aim of this article is to present the results of an environmental life cycle assessment of secondary fence boards made from 100% waste. Additional research questions are as follows: what are the key drivers affecting the environment, and what actions should be taken to improve the environmental performance of secondary fence boards? Recommendations for further environmental development of the product investigated provide the main practical value of the study that can be offered to recycling plants. The results obtained can be applied in process management at a recycling plant and help increase environmental performance. The environmental hotspots identified indicate an important role for both process- and modelling-oriented decisions. LCA analysis has been used in waste processing-oriented studies for many years (e.g., [7,8,9,10,11,12]). The overall conclusions are similar to the conclusions of the case study presented. It has been proven that from a life cycle perspective, the benefit of recycling is the improvement of material utilisation efficiency by avoiding further resource extraction and waste management [11]. It is also worth mentioning that if the future energy mix emits fewer greenhouse gasses, the energy input required for recycling will become less relevant [12].
The paper Is presented in two parts. The first part presents the results of a baseline scenario in which the fence boards are not recycled after use. The second part refers to a comparative analysis using different EoL scenarios. In the case study presented, contaminated and mixed packaging waste is reprocessed via open-loop recycling into secondary final products—fence boards—that are ready (after assembly and installation) to fulfil a new function for their final users. No examples have been found in the literature relating to the use of the circular footprint formula to handle multifunctionality in a life cycle assessment of recycled fence boards. The case study presented aimed to fill this research gap. The scientific value of this research is its provision of an example of circularity and a case study of open-loop recycling, where mixed and contaminated waste are reprocessed into valuable market products.
Both theoretical and practical implementations of environmental life cycle assessment have issues relating to multifunctionality and allocation procedures [13,14,15,16]. Several approaches can be distinguished [17]. One of the approaches to modelling recycling is the cut-off method (called the recycled content approach). According to the British Standard for Carbon Footprint, the method should be applied in cases where the recycled material does not maintain the same inherent properties as the virgin material input [18]. The recycled content approach is also called the Allocation to Virgin Material Use method or 100/0 method because 100% of the virgin material production is allocated to the product using virgin material (with no burdens from recycling operations allocated to the upstream product) [17]. The opposite method is called the Allocation to Material Losses method (0/100 method). The 0/100 method does not differentiate according to the type of raw material used (primary or recycled) when collected for recycling or between primary and recycled content when no collection takes place [19]. The recycling impact is allocated to products that can be used to produce a recycled material (with no burdens allocated to downstream products using the recycled materials as input) [17].
In addition to the methods described above, there are several methods that distribute the environmental credit or burden between primary and secondary material production. One of these is called the 50/50 method, which means that 50% of the recycling impact is allocated to the product producing a recycled material and 50% to the product using the recycled material [17]. This method can also be interpreted as a closed-loop approach, where the flow in the closed loop is defined as the average of the input and output of recycled material across the boundary of the life cycle and should be understood as a compromise between Allocation to Material Losses and Allocation to Virgin Material Use [19]. The 50/50 method is divided into two variants: without credit and with credit for avoided virgin production. Another variant of the 50/50 method was proposed by Allacker et al. [17] and is called the BPX 50/50-based approach or the Quality-Adjusted 50/50 method. This method includes the quality of the material recycled from the product investigated, and the environmental benefit is proportional to the quality of the recycled material.
The above-mentioned method is asymmetric because the environmental credit assigned to recycled material leaving a product system is different from the environmental burden assigned to the recycled material when it enters the next product system, and this was one of the reasons why the BPX 50/50-based approach was replaced by the circular footprint formula (CFF) [19]. Some papers have investigated CFF vs. other different LCA allocation methods based on specific case studies (e.g., [20,21]). They focused more on comparing allocation procedures than analysing different scenarios of a given product system, which is the intention of our research. It is interesting that the complexity of using the CFF method compared to other allocation methods was noted. It was also noted that CFF does not address some aspects of specific circular systems (e.g., bioeconomy) [20]. The CFF was developed by the European Commission as part of the Environmental Footprint Initiative [22]. The CFF covers many issues relating to recycling, e.g., the type of material, the point of substitution quality losses, etc., and requires the consideration of many specific parameters. The concept of the CFF formula is presented below.

2. Materials and Methods

This paper presents a case study based on a new and already functioning recycling technology (Recycling process I). The study focused on contaminated, mixed waste. Due to its heterogeneity, it is very difficult to process this waste to separate individual polymers and produce a homogeneous regranulate. The level of contamination in the secondary material under study excludes certain applications. According to the Commission Regulation on recycled plastic materials and articles intended to come into contact with food, only plastics containing recycled plastics manufactured using the appropriate recycling technology may be placed on the market [23]. The contamination level in the plastic input should never exceed the maximum levels at which the process can ensure sufficient decontamination; therefore, it should be ensured that the input quality consistently meets the relevant specifications. Substances used in the manufacture of plastic layers in plastic materials and articles shall be of a technical quality and a purity suitable for the intended and foreseeable use of the materials or articles [24].
PlasticEurope reports that in 2018, of the 5 million tons of recycled plastic produced in Europe, 80% was returned to make new products. The 4 million tons of recyclates from post-consumer waste went mainly to the construction industry (46%) as road construction components but also as insulation panels, boards and profiles, panels, and floor coverings [25]. In the recycling plant under study, boards are produced from a stream of multi-material waste, mainly packaging waste consisting of plastic packaging (EWC 15 01 02) and mixed packaging (15 01 06). The boards can be used as protective panels and fence panels in horticulture and agriculture. It is possible that their application could be much wider (e.g., small-scale architecture).
The analysis was undertaken in four phases: defining the goal and scope, establishing a life cycle inventory (LCI), conducting a life cycle impact assessment (LCIA), and interpretation. More about LCA methodology can be found in many literature sources (e.g., [26,27,28]). In order to calculate the potential environmental impact of the life cycle of a secondary fence board, the Environmental Footprint impact assessment method was used (EF 3.0 method (adapted) v. 1.02). With this method, the environmental impact is assessed within 16 impact categories, reflecting various environmental problems. The interpretation of the results was carried out in a way inspired by a procedure developed by the Joint Research Centre as part of the Environmental Footprints methodology, as described in Annex I in Section 6.3 of the Commission Recommendation (EU) 2021/2279 [22]. The procedure is designed to identify the main sources of environmental impact in the life cycle of products. The relevant issues can be defined as follows:
  • Impact categories, which are defined as “class representing environmental issues of concern to which life cycle inventory analysis results may be assigned” [29]. The impact categories represent specific environmental problems, such as climate change;
  • Life cycle stages, which are defined as “consecutive and interlinked stages of a product system, from raw material acquisition or generation from natural resources to final disposal” [29]. These are the phases of the product life cycle that affect the environment;
  • Processes, which are defined as “a set of interrelated or interacting activities that transforms inputs into outputs” [29]. These are smaller elements of the product life cycle for which data are quantified;
  • Elementary flows, which are defined as “material or energy entering the system being studied that has been drawn from the environment without previous human transformation, or material or energy leaving the system being studied that is released into the environment without subsequent human transformation” [29]. These relate to material or energy directly derived from the environment or released directly into the environment, such as air emissions.
According to the Environmental Footprint methodology, the most relevant issues (impact categories, life cycle stages, processes, or elementary flows) are those that together contribute to at least 80% of the environmental impact [22]. The procedure used to identify hotspots consisted of the four following steps [22]:
  • The identification of the most relevant impact categories—all of the impact categories that together contribute to at least 80% of the single overall score (based on the normalised and weighted results);
  • Th identification of the most relevant life cycle stages–all of the life cycle stages that together contribute more than 80% to the most relevant impact category (based on the characterised results),
  • The identification of the most relevant processes–all of the processes that together contribute (along the entire life cycle) more than 80% to the most relevant impact category (based on the characterised results, considering absolute values);
  • The identification of the most relevant elementary flows–all of the elementary flows that together contribute to at least 80% of the total impact of a most relevant impact category for each most relevant process (based on the characterised results)
To calculate the life cycle environmental performance of the fence boards, the recycling processes must be modelled accordingly. These are standard technological processes that entail negative environmental consequences due to the use of certain resources (e.g., water, energy, and land) and the generation of pollution. The first issue to be resolved is the problem of allocating these environmental burdens between the previous and the subsequent product systems as being either a supplier or a user of recycled materials, respectively. For the previous system, recycling is a way of managing waste (EoL), and for the subsequent system, it is a way of obtaining raw materials for production (the cradle). In practice, this means setting boundaries between adjacent product systems. In our example, Recycling process I needs to be assigned to the life cycle of individual packaging (EoL) and the life cycle of fence boards (the cradle) to some extent. In our case study, the circular footprint formula (CFF) was used. It was used to model the end of life of products as well as the recycled content and is a combination of “material + energy + disposal” (Equation (1)) [19]. The concept of this formula is presented below.
M a t e r i a l   1 R 1 E v + R 1   × A E r e c y c l e d   + 1 A E v × Q s i n Q   p +   1 A R 2 × ( E r e c y c l i n g E o L   E V × Q s o u t Q p ) E n e r g y   1 B R 3 × E E R   L H V × X E R   h e a t × E S E   h e a t L H V × X E R   e l e c × E S E   e l e c   D i s p o s a l   1 R 2 R 3 × E D
Equation (1). The circular footprint formula [22]
where
  • A—represents the allocation factor of burdens and credits between the supplier and the user of recycled materials;
  • B—represents the allocation factor of energy recovery processes;
  • QSin—represents the quality of the ingoing secondary material, i.e., the quality of the recycled material at the point of substitution;
  • QSout—represents the quality of the outgoing secondary material, i.e., the quality of the recyclable material at the point of substitution;
  • Qp—represents the quality of the primary material, i.e., the quality of the virgin material;
  • R1—represents the recycled content, which is the proportion of material input to the production that has been recycled from a previous system;
  • R2—represents the recycling rate, which is the proportion of the material in the product that will be recycled (or reused) in a subsequent system. R2 shall be measured at the output of the recycling plant;
  • R3—represents the proportion of the material in the product that is used for energy recovery at EoL;
  • Ev—represents the specific emissions and resources consumed arising from the acquisition and pre-processing of virgin material;
  • E*v—represents the specific emissions and resources consumed arising from the acquisition and pre-processing of virgin material assumed to be substituted by recyclable materials;
  • Erecycled—represents the specific emissions and resources consumed arising from the recycling process of the recycled (reused) material, including collection, sorting, and transportation processes;
  • Erecycling_EoL—represents the specific emissions and resources consumed arising from the recycling process at EoL, including collection, sorting, and transportation processes;
  • EER—represents the specific emissions and resources consumed arising from the energy recovery process (e.g., incineration with energy recovery, landfill with energy recovery, etc.);
  • ESE elec ESE heat —represents the specific emissions and resources consumed that would have arisen from the specific substituted energy source: heat and electricity, respectively;
  • ED—represents the specific emissions and resources consumed arising from the disposal of waste material at the EoL of the product being analysed, without energy recovery;
  • XER elec XER heat—represents the efficiency of the energy recovery process for both heat and electricity;
  • LHV—represents the lower heating value of the material in the product that is used for energy recovery.
The choice of research approach is related to three elements that are important to current product policy in the European Union. These include ensuring the circularity of materials and energy, creating a single market for green products, and managing the life cycle of products. Among the features of the CEF considered important when selecting the research approach were the possibility of considering two different substitution points and the multifunctionality occurring at different stages of the life cycle. Moreover, this case study focuses on open-loop recycling, and the CFF approach is recommended for use in cases of open-loop recycling.

3. Case Study

3.1. Goal and Scope Definition

This study aimed to determine the environmental impact generated during the life cycle of a secondary fence board and what causes the greatest environmental impact. A single board weighs 70 kg, and it has the dimensions 2.0 m × 1.4 m × 0.02 m. In the analysed period, 3073 boards were produced, with a total weight of 215,140 kg of waste. Therefore, the recycling process reached 99.9% efficiency. In the reference year, the produced fence boards contained six waste materials (mainly waste packaging plastics): high-density polyethylene (HDPE) = 30%; polypropylene (PP) = 30%; polycarbonate (PC) = 10%; polyamide (PA) = 1\0%; acrylonitrile–butadiene–styrene (ABS) = 10%; and aluminium (ALU) = 10%. A potential area of application for the secondary boards is their use in protective fence panels for horticultural and agricultural purposes. The functional unit has been defined as “a space separation and protection provided by 1 m2 of fencing with durability of 15 years”. The reference flow is 1 m2 of the secondary fence board, with a mass of 25 kg.
The system boundaries include the following life cycle stages:
  • Materials and production—secondary fence board (manufacturing of secondary boards with Recycling process I);
  • Materials—auxiliary materials (generation of raw materials to be included in auxiliary products used to install the secondary board, e.g., screws, bolts, wooden posts);
  • Transport of the secondary board and auxiliary materials to the place of installation;
  • Installation and use (assembly and maintenance);
  • End of life (EoL)—secondary fence board (transport, landfilling, and incineration);
  • End of life (EoL)—auxiliary materials.
The analysed secondary fence boards were manufactured in the recycling plant. Since the waste processed in the plant is packaging waste, the recycling process links the life cycle of multi-material packaging with the life cycle of the resulting fence boards. Recycling process I is the last stage in the life cycle of the packaging used to contain and protect the product and enable its transport and storage. At the same time, Recycling process I is the first stage (the cradle) in the life cycle of fence boards with a function of space separation and protection. The fact that the collection of the waste and the production of the fence boards were undertaken in the same place by the same company in common operations makes defining a clear boundary between the life cycle of the packaging and fence boards complicated. What makes this case study unique is the fact that the recycling processes analysed generate neither secondary raw materials nor secondary intermediate products. It generates secondary final products that are ready—after assembly and installation—to fulfil their function for a final user.
A starting point for modelling is baseline scenario 1A, which is presented in Figure 1. In this scenario, 25.025 kg of the packaging waste goes to Recycling process I, which makes a connection between two life cycles—the multi-material packaging and the secondary fence board. As the efficiency of this process is 99.9%, from 25.025 kg going to the recycling plant, 25 kg of secondary boards is produced. The fence board is made entirely from recycled materials (R1_fence_board = 1). After production, the secondary fence board is to be transported to the place of installation, installed, used (for 15 years), and finally, disposed of as waste. In baseline scenario 1A, at the end of its use, 99% of the board (24.75 kg) is landfilled without energy recovery, and 1% is incinerated (0.2475 kg). As the baseline scenario does not provide for recycling at the end of life, the recycling rate is 0 (R2_fence_board = 0).

3.2. Allocation

According to the CFF formula [22], a given recycling process is to be “split” (allocated) between two adjacent product systems (the provider and user of the recycled materials). In our case study, Recycling process I is to be split between the packaging and fence boards. In the CFF formula, the proportions between recycling allocated to the previous and subsequent life cycles depend on the value of the allocation factor (A). The A factor is pre-determined for different materials and/or applications; its value depends on the situation of the raw material market and the evolution of its prices. Parameter A can take one of three values: 0.2, 0.8, and 0.5. In our example, for all packaging plastics used, the value of A = 0.5, and for aluminium, A = 0.2 (EF method-Annex C). Therefore, 50% of Recycling process I should be allocated to plastic packaging and the other 50% to fence boards (similarly, 80% to aluminium packaging and 20% to fence boards). Allocation factor A indicates to what extent the specific emissions and resources consumed arising from the recycling process should be allocated between the supplier and user of recycled materials. It allocates burdens of recycling at the cradle with the following part of the CFF formula R1 × (AErecycled + (1 − A)Ev × QSin/Qp).
The use of recycled materials by the analysed user (producer of the secondary fence board) makes the recycled materials unavailable for other users operating on the market. As a consequence, the other users need to use corresponding (primary) substitutes, and additional primary production is needed to cover the demand of these other users. For this reason, recycling at the cradle should be debited with a portion of increased virgin production Ev × QSin/Qp. The following question seems to be essential to our case study: what is “the debited virgin production”? In fact, this is a question about substitution modelling. In baseline scenario 1A, it was assumed that the use of recycled materials in manufacturing the secondary fence board affects the packaging industry (the production of primary packaging materials is to be increased because of the unavailability of the recycled materials already used in secondary fence board production and absorbed by the fencing market). The specific emissions and consumed resources arising from the recycling of 11.75 kg of packaging waste (Erecycled with Recycling process I) have been allocated to 1 m2 of the secondary fence boards. Additionally, recycling at the cradle is debited with a virgin production of 10.625 kg of primary packaging materials (30% primary HDPE; 30% primary PP; 10% primary PC; 10% primary PA; 10% primary ABS; and 10% primary aluminium).
In this case study, the values of allocation factor A and quality corrections QSin/Qp are taken from Annex C (EF method, Annex C):
  • For plastics, the allocation factor A equals 0.5; and for aluminium, it equals 0.2;
  • The quality correction factors (QSin/Qp) for all plastics are assumed to be 0.9, and for aluminium, they are assumed to be 1.0.

3.3. Life Cycle Inventory

The calculations for recycling at the cradle were based on primary inventory data taken from a recycling company operating in the Wielkopolska region, Poland, which participated in the CIRCE2020 project that was realised in the scope of the INTERREG CENTRAL EUROPE 2014–2020 Program. The calculations presented in this paper go beyond the substantive scope of the CIRCE2020 project. Data regarding the use of auxiliary materials and installation have been estimated based on the general instructions taken from the installation guide of the fencing panels (installation guide). The mass of the auxiliary materials has been estimated by using information from shops. Background processes have been modelled with secondary data taken from the ecoinvent v. 3.8 database. The names of the datasets presented in Table 1 and Table 2 are taken from the ecoinvent database (ecoinvent). SimaPro software was used to carry out the LCA calculations. The most important LCI results are presented in Table 1 and Table 2 (results per FU, 1 m2 of fence board). The rest of the data are presented in the Supplementary Information provided in Tables S1–S5.
The quality of the data was evaluated by applying a semi-quantitative Pedigree Matrix [30] using the approach suggested by Lewandowska, Foltynowicz, and Podleśny [31]. In this approach, Data Quality Goals (DQGs) and Data Quality Indicators (DQIs) are applied. In this case study, data quality was assessed by taking into account several criteria: reliability, completeness, temporal correlation, geographical correlation, and technological correlation. For each inventory item, the difference between the DQGs and the selected DQIs was calculated, obtaining a parameter called the Data Quality Distance (DQD). The higher the value of the DQD, the lower the quality of the data and the quality class (class A means the best quality, class E means the worst quality). In this case study, the total DQD (expressed as mean) is 0.86, which corresponds to quality class B. Quality class B indicates the relatively high quality of the data used in this study.

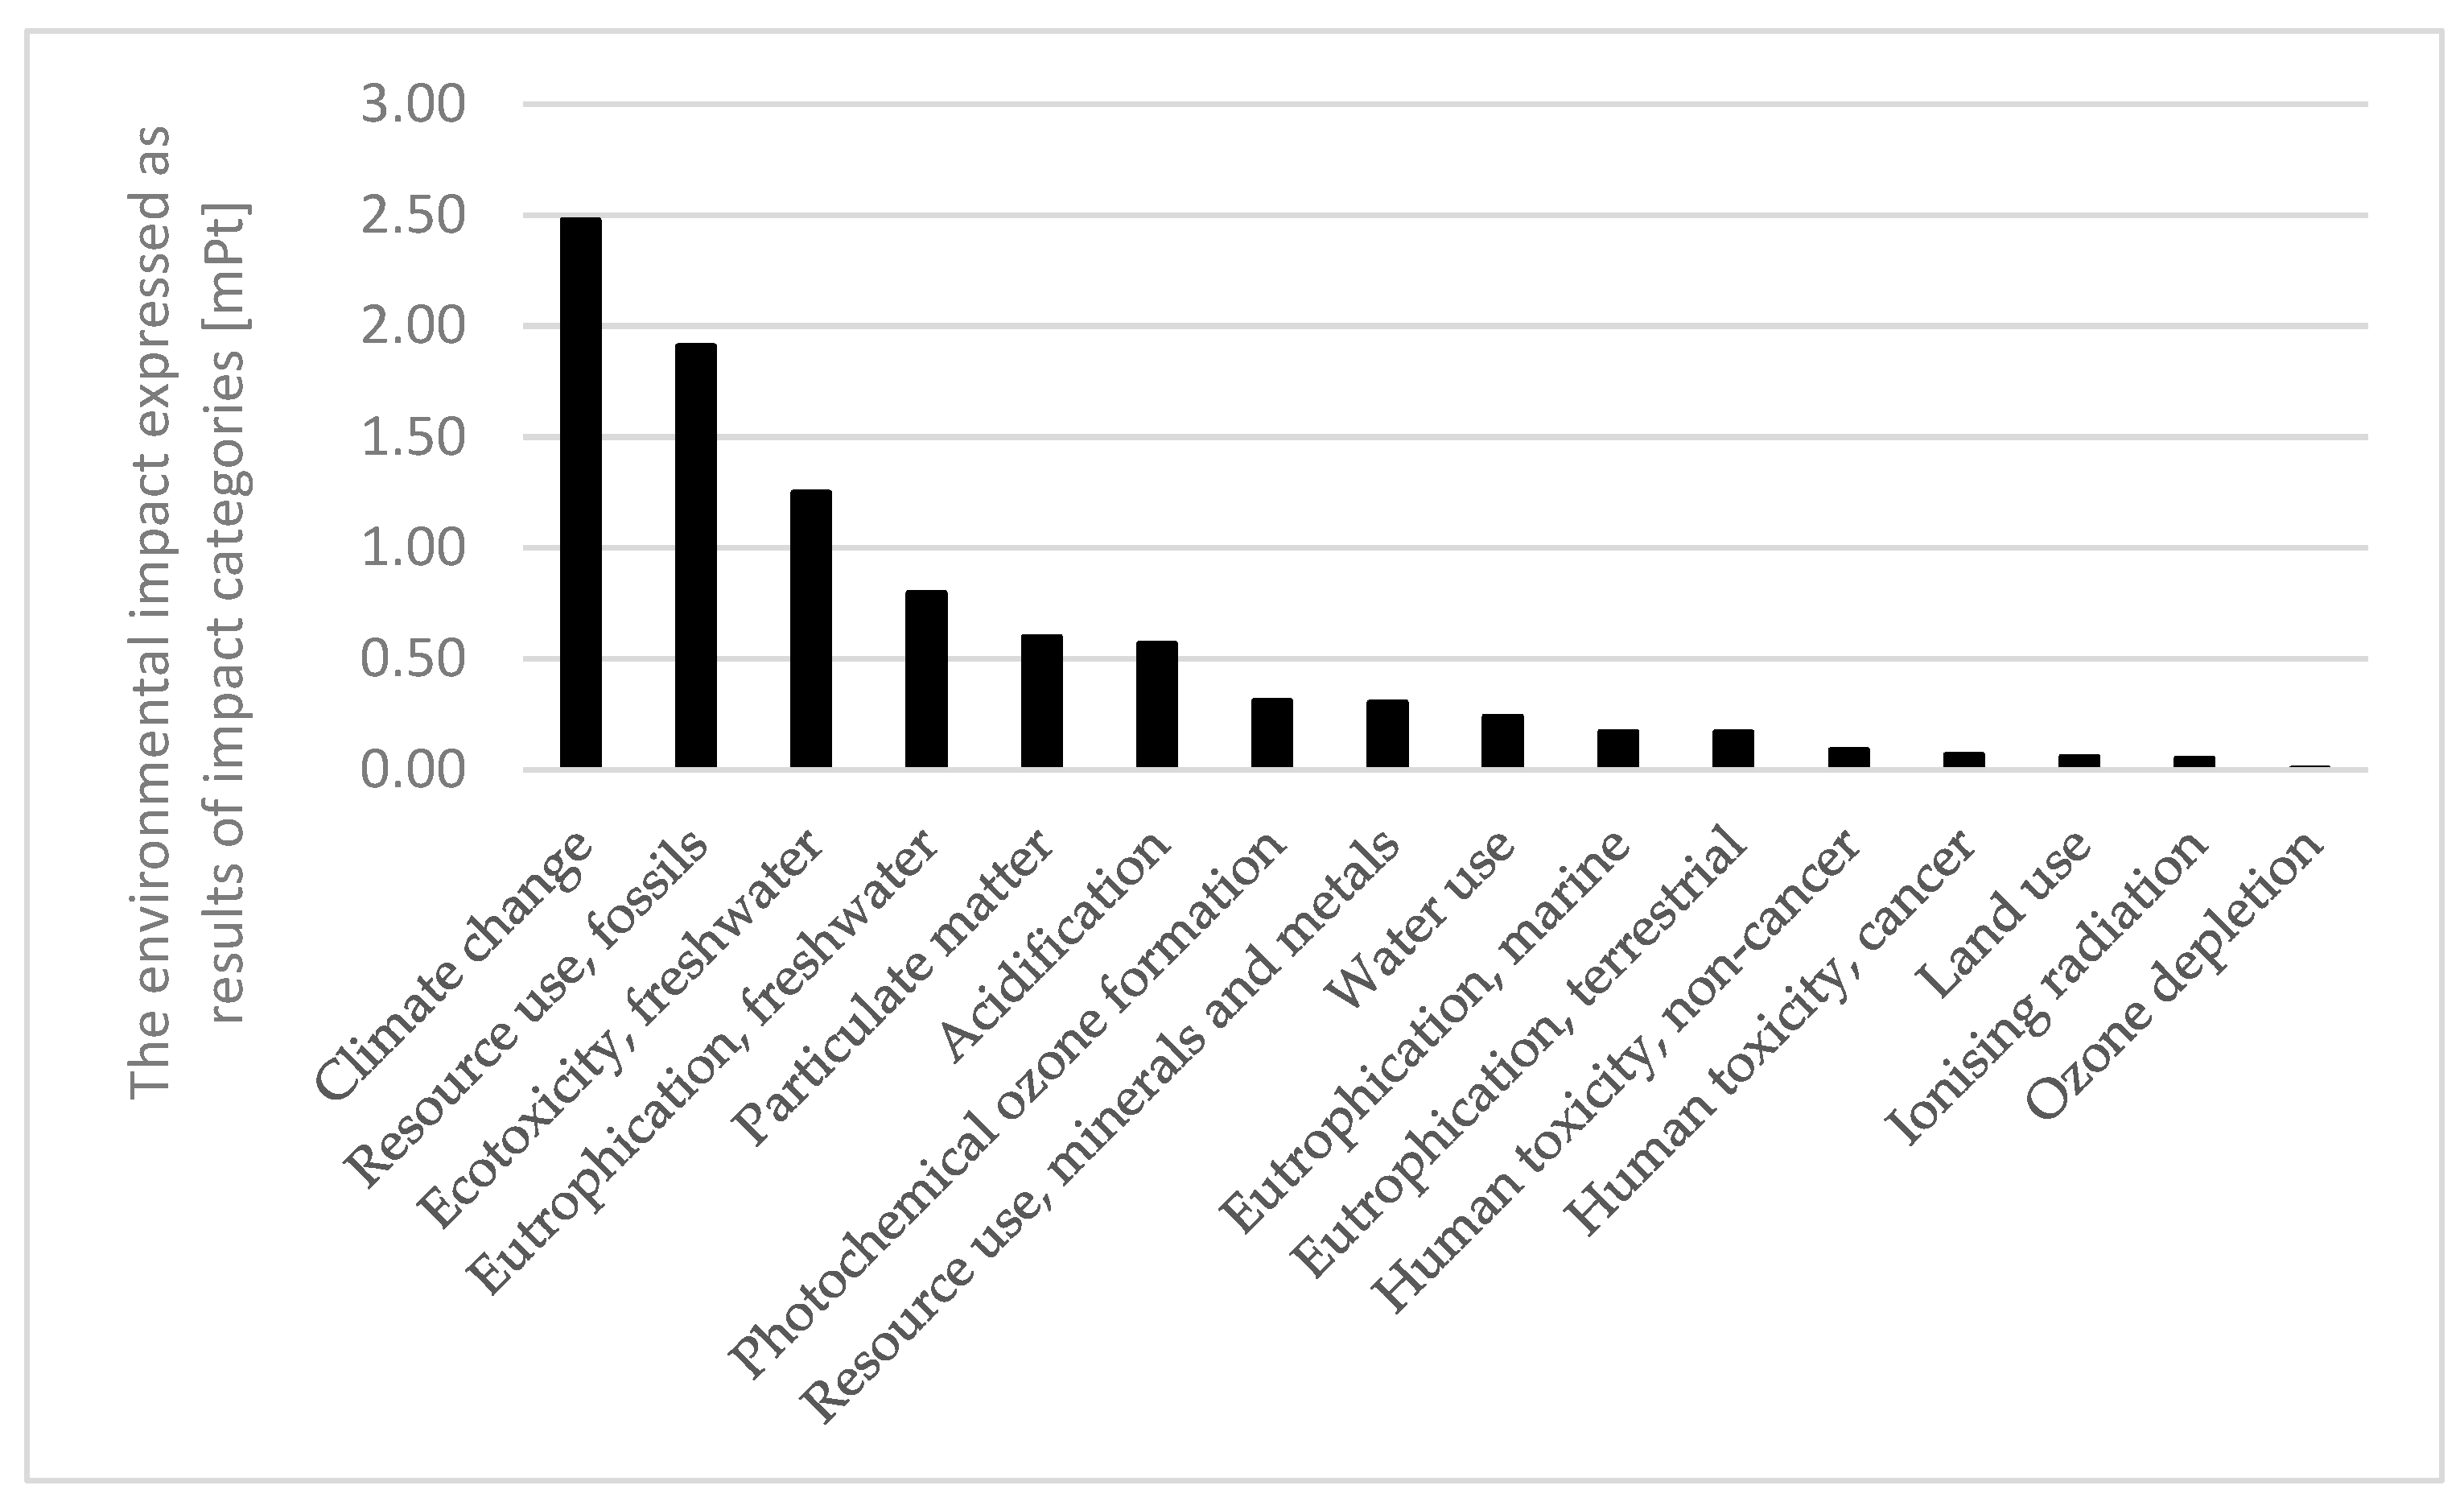
3.4. Results of the Life Cycle Impact Assessment (LCIA)

As mentioned, this study aimed to determine the environmental impact generated during the life cycle of secondary fence boards and what causes the greatest environmental impact. The total environmental impact of the product analysed related to the functional unit (defined as the space separation and protection provided by 1 m2 of fencing with a durability of 15 years), which is 9.05 mPt (miliPoints). Another research issue was the identification of hotspots. Below, the results are presented as weighted results of 16 impact categories (Figure 2). Six of the most relevant impact categories were identified, which together contribute 84% of the total environmental impact (the single score):
  • Climate change—27.4% (2.48 mPt);
  • Resource use, fossil fuels—21.1% (1.91 mPt);
  • Ecotoxicity, freshwater—13.8% (1.25 mPt);
  • Eutrophication, freshwater—8.8% (0.80 mPt);
  • Particulate matter—6.6% (0.60 mPt);
  • Acidification—6.3% (0.57 mPt).
The main sources of environmental impact potentially generated within all six relevant impact categories relate to materials acquisition and the production of the secondary fence boards (the life cycle stage of materials and production of secondary fence boards). Except for ecotoxicity in freshwater, all of the remaining relevant impact categories of this stage contribute more than 90% (Table 3). In the case of ecotoxicity in freshwater, the two most important life cycle stages have been identified: the end of life of secondary fence boards and materials and the production of secondary fence boards.
The next step was to identify the processes that cumulatively (along the entire life cycle) contribute more than 80% to each relevant impact category (considering absolute values). Except for ecotoxicity in freshwater, two main sources of impact have been identified for the remaining relevant impact categories: electricity and primary packaging materials. Electricity consumption occurs in different places in the life cycle of the secondary boards, mostly during Recycling process I (23.36 kWh/FU), the debited injection moulding of plastics (8.16 kWh/FU), and during the debited production of aluminium (6.92 kWh/FU). Depending on the impact category, different processes in the life cycle are the main contributors in terms of electricity consumption. In the case of climate change, particulate matter, and acidification, the activity of power plants and electricity generation (mostly based on fossil fuels) are the main reasons for the impact. In the case of resource use, fossil fuels, ecotoxicity, freshwater, and eutrophication, the impact is generated mostly at the cradle during mining activity. The second important driver of the environmental impact is related to the primary production of packaging materials. Production has been added (debited) to the life cycle of the secondary fence boards as a result of using the CFF formula. The life cycle of the packaging materials includes the cradle (crude oil extraction and refining and mining activities for aluminium), the production of the raw materials (plastics granulates and liquid aluminium), and their processing (injection moulding). Concerning the impact in terms of resource use, fossil fuels are mostly used at the cradle. The debited production of the packaging materials generates impacts related to all of the remaining relevant impact categories. The landfilling of the aluminium included in the waste secondary fence boards is an exception, as it comes from the EoL (the grave). It is the most relevant contributor to ecotoxicity in freshwater. More than half (54%) of the impact of ecotoxicity is related to the landfilling of waste aluminium. The results concerning the identification of the most relevant processes in the life cycle of secondary fence boards are presented in Table 4. The table presents the results obtained for the two most relevant impact categories. The rest of the data are presented in the Supplementary Information in Table S6.
The next step is to identify the most relevant elementary flows (Table 5). During the generation of electricity in power plants and the production of plastics (e.g., nylon and polycarbonate), fossil fuel-derived carbon dioxide is emitted into the air (climate change). Crude oil and natural gas are extracted and used to manufacture plastics (resource use of fossil fuels). Hard coal is extracted in coal mines for later electricity generation (resource use of fossil fuels). Direct emissions of aluminium to the environment occur during the landfilling of aluminium at the end-of-life stage (emission to water) and in coal mines during blasting (emission into the air). Aluminium releases contribute to the impact category of ecotoxicity in freshwater. Another source of impact is also related to coal mining—the treatment of spoil. During the disposal of mining waste, phosphate is released into water, which contributes to eutrophication in freshwater. The generation of electricity in coal-fired power plants and the production of plastics lead to the release of more pollutants, such as particulates, sulfur dioxide, and nitrogen oxides. These have been recognised as the most relevant elementary flows for two impact categories: particulate matter and acidification. The results can be found in Table 5.

4. Discussion and Conclusions

In the paper, an open-loop recycling case study is presented. The contaminated and mixed packaging waste is reprocessed into secondary final products—fence boards. To handle a multifunctionality problem, the circular footprint formula was used. It is a complex and multi-parametric equation. This case study showed that the application of CFF is difficult and requires specific data (e.g., allocation factor of burdens and credits between the supplier and the user of recycled materials, the quality correction factors, etc.) that may impact the results. Methodological considerations were not the purpose of this article. However, the results obtained are a starting point for a discussion of the importance of end-of-life modelling in environmental life cycle analyses. The relevance of Part I lies in practical recommendations for increasing the environmental performance of the product analysed. The total environmental impact of the fence board is 9.05 mPt per 1 m2. As mentioned, the recycling at the cradle (Recycling process I) is debited with the production of primary packaging materials. After 15 years of use, the board is landfilled (99%) and incinerated (1%). The most important conclusions are described below.
In this case study, three key general drivers of the environmental impact have been identified:
  • Electricity consumption—relating to the direct use of power during the production of the secondary boards in Recycling process I and consumption during the processing of debited primary packaging materials;
  • Debited primary production of the packaging materials—relating to the direct consumption of resources and emission of pollutants in the supply chains of the primary packaging materials;
  • The landfilling of waste aluminium included in the waste secondary fence boards—in the case of ecotoxicity in freshwater, the landfilling of waste aluminium during the end-of-life stage of the secondary boards has been found to be the most important issue.
The three main environmental hotspots indicate an important role in either process- and modelling-oriented decisions. In terms of process-related decisions, a clear recommendation for the analysed company can be formulated to improve the energy efficiency of Recycling process I and to increase the recycling rate of the secondary fence boards. The first can be achieved by reducing electricity consumption and/or using renewable power. Environmental improvements could be achieved at the end-of-life stage via energy or material recovery instead of landfilling.
The importance of the three hotspots depends strongly on modelling choices. In our LCA analysis, the electricity usage in Recycling process I has been modelled with the national consumption electricity mix for Poland. There are some guidelines for LCA practitioners [22,32,33] where a rule stipulates the use of a market-based approach for electricity modelling, with a preference for electricity tracked by Guarantees of Origin and the residual grid mix. As the analysed company bought electricity lacking attributes of renewable energy, according to this approach, the electricity consumption during Recycling process I should be modelled with the residual grid mix of Poland. In the reference year, the share of renewable energy was twice lower in the residual mix than in the supplier mix [34]. It means that, if using the market-based approach, the environmental impact of the life cycle stage concerning the production of secondary fence boards (Recycling process 1) would be higher than that presented in Table 3.
In addition to electricity, the debited production of primary packaging materials is another key driver in the life cycle of fence boards. Debits strongly depend on the modelling choice. The allocation with the circular footprint formula was made. The extent to which the cradle is debited with the primary production results directly from the value of allocation factor A in the CFF formula. In the case of plastics, factor A equals 0.5 (50:50), and for aluminium, it is equal to 0.2. This means that 50% of the construction packaging plastics included in the secondary boards were modelled as secondary and 50% as virgin materials (in the case of aluminium, the ratio is 20% and 80%, respectively). However, other approaches also exist (e.g., 0:100 and 100:0) [35], and they can be used by LCA practitioners. It can be expected that the choice of allocation procedure may significantly impact the results.
Modelling-related decisions can also be important for the end-of-life stage. In baseline scenario 1A, no recycling occurs at EoL. The question is what would happen if the secondary fence boards were sent for recycling? In order to check the importance of recycling at the end of life, the comparative analysis for various EoL scenarios and for different variants of substitution modelling for the fence board analysed are presented in a separate paper: Part 2.

Supplementary Materials

The following supporting information can be downloaded at: https://www.mdpi.com/article/10.3390/resources13040050/s1, Table S1: Inventory results for life cycle stage Materials—auxiliary materials; Table S2: Inventory results for life cycle stage Transport to the installation place; Table S3: Inventory results for life cycle stage Installation and maintenance (15 years of lifetime); Table S4: Inventory results for life cycle stage End of life—auxiliary materials (based on calculations with the CFF formula, R2_wood = 0.38, Awood = 0.8, R2_steel = 0.85, Asteel = 0.2, the fraction of the waste not sent for recycling is to be disposed of as follows: 99% landfilled and 1% incinerated); Table S5: Inventory results for life cycle stage End of life—secondary fence board (based on calculations with the CFF formula, R2_fence_board = 0.499, A_fence_board = 0.5 the fraction of the waste not sent for recycling is to be disposed of as follows: 99% landfilled and 1% incinerated); Table S6: The results of identification of the most relevant processes in the life cycle of secondary fence board (for the other most relevant impact categories).

Author Contributions

Conceptualisation, A.L., K.J.-L., P.K. and J.K.; methodology, A.L. and K.J.-L.; software, A.L.; validation, A.L. and J.K.; formal analysis, A.L.; investigation, A.L.; resources, A.L. and K.J.-L.; data curation, A.L.; writing—original draft preparation, A.L.; writing—review and editing, A.L., K.J.-L., P.K. and J.K.; visualisation, A.L.; supervision, P.K.; project administration, P.K. All authors have read and agreed to the published version of the manuscript.

Funding

This research received no external funding.

Data Availability Statement

The specific company’s primary data for Recycling process I have been gathered from the analysed company and are presented in Table 1. Data regarding the use of auxiliary materials and installation was estimated based on the general instructions taken from the fencing panels installation guide (https://jagram.com.pl/blog/instrukcja-ogrodzenia-panelowego-na-twardej-powierzchni1, accessed on 5 April 2023). The mass of auxiliary materials was estimated using information gathered from shops. Background processes have been modelled with secondary data taken from the ecoinvent v. 3.8 database available in SimaPro software (ecoinvent v3.8-ecoinvent).

Acknowledgments

Some of the presented research related to Recycling process I was conducted as a part of the CIRCE2020 Project, financed by the INTERREG CENTRAL EUROPE program. This project was implemented by an international consortium. AM Trans Progres sp.z o.o. was the Polish partner.

Conflicts of Interest

The authors declare no conflicts of interest. Company AM Trans Progres sp. z o.o. was not involved in the study design, collection, analysis, interpretation of data, the writing of this article, or the decision to submit it for publication.

References

  1. Generation of Waste by Economic Activity. Eurostat Database. Available online: https://ec.europa.eu/eurostat/databrowser/view/ten00106/default/table?lang=en (accessed on 5 December 2023).
  2. Kaza, S.; Yao, L.; Bhada-Tata, P.; Van Woerden, F. What a Waste 2.0: A Global Snapshot of Solid Waste Management to 2050. Urban Development; World Bank: Washington, DC, USA, 2018; pp. 1–295. Available online: https://openknowledge.worldbank.org/entities/publication/d3f9d45e-115f-559b-b14f-28552410e90a (accessed on 5 December 2023).
  3. COM(2020) 98 Final Communication from the Commission to the European Parliament, the Council, the European Economic and Social Committee and the Committee of the Regions. A New Circular Economy Action Plan for a Cleaner and More Competitive Europe. Brussels. Available online: https://eur-lex.europa.eu/resource.html?uri=cellar:9903b325-6388-11ea-b735-01aa75ed71a1.0017.02/DOC_1&format=PDF (accessed on 5 December 2023).
  4. Di Foggia, G.; Beccarello, M. An Overview of Packaging Waste Models in Some European Countries. Recycling 2022, 7, 38. [Google Scholar] [CrossRef]
  5. European Court of Auditors. Special Report 17/2023: Circular Economy—Slow Transition by Member States Despite EU Action. Available online: https://www.eca.europa.eu/en/publications/sr-2023-17 (accessed on 5 February 2024).
  6. Replies of the European Commission to the European Court of Auditors. Circular economy—Slow transition by member states despite EU action. Special Report. Available online: www.eca.europa.eu/Lists/ECAReplies/COM-Replies-SR-2023-17/COM-Replies-SR-2023-17_EN.pdf (accessed on 5 February 2024).
  7. Bajdur, W. Application of Environmental Assessment of Product Life Cycle in Shaping Waste Recycling. In The Role of Business in Achieving Sustainability, Part 2: Implication for Industry; Modrak, V., Ślusarczyk, B., Eds.; Published by Technical University Košice: Presov, Slovakia, 2010; pp. 175–192. [Google Scholar]
  8. Koci, V.; Trecakova, T. Mixed municipal waste management in the Czech Republic from the point of view of the LCA method. Int. J. Life Cycle Assess. 2011, 16, 113–124. [Google Scholar] [CrossRef]
  9. den Boer, J.; Obersteiner, G.; Gollnow, S.; den Boer, E.; Bodnárné Sándor, R. Enhancement of Food Waste Management and Its Environmental Consequences. Energies 2021, 14, 1790. [Google Scholar] [CrossRef]
  10. Kucukvar, M.; Egilmez, G.; Tatari, O. Life Cycle Assessment and Optimization-Based Decision Analysis of Construction Waste Recycling for a LEED-Certified University Building. Sustainability 2016, 8, 89. [Google Scholar] [CrossRef]
  11. Shen, L.; Worrell, E.; Patel, K.M. Open-loop recycling: A LCA case study of PET bottle-to-fibre recycling. Resour. Conserv. Recycl. 2010, 55, 34–52. [Google Scholar] [CrossRef]
  12. Rosenberg, S.; Kurz, L.; Huster, S.; Wehrstein, S.; Kiemel, S.; Schultmann, F.; Reichert, F.; Wörner, R.; Glöser-Chahoud, S. Combining dynamic material flow analysis and life cycle assessment to evaluate environmental benefits of recycling—A case study for direct and hydrometallurgical closed-loop recycling of electric vehicle battery systems. Resour. Conserv. Recycl. 2023, 198, 107145. [Google Scholar] [CrossRef]
  13. Fugiel, A.; Śliwińska, A.; Burchart-Korol, D. Possibilities of Using Tools Supporting the Life Cycle Assessment of Multi-Functional Systems. Sci. Pap. Silesian Univ. Technol.—Organ. Manag. Ser. Organ. Manag. 2017, 100, 133–143. (In Polish) [Google Scholar] [CrossRef]
  14. Toniolo, S.; Mazzi, A.; Pieretto, C.; Scipioni, A. Allocation strategies in comparative life cycle assessment for recycling: Considerations from case studies. Resour. Conserv. Recycl. 2017, 117, 249–261. [Google Scholar] [CrossRef]
  15. Cherubini, E.; Franco, D.; Zanghelini, G.M.; Soares, S.R. Uncertainty in LCA case study due to allocation approaches and life cycle impact assessment methods. Int. J. Life Cycle Assess. 2018, 23, 2055–2070. [Google Scholar] [CrossRef]
  16. Aleisa, E.; Heijungs, R. Leveraging Life Cycle Assessment to Better Promote the Circular Economy: A First Step Using the Concept of Opportunity Cost. Sustainability 2022, 14, 3451. [Google Scholar] [CrossRef]
  17. Allacker, K.; Mathieux, F.; Pennington, D.; Pant, R. The search for an appropriate end-of-life formula for the purpose of the European Commission Environmental Footprint initiative. Int. J. Life Cycle Assess. 2017, 22, 1441–1458. [Google Scholar] [CrossRef]
  18. PAS 2050—Specification for the Assessment of the Life Cycle Greenhouse Gas Emissions of Goods and Services; The British Standards Institution: London, UK, 2008; pp. 1–43. Available online: http://www.carbonconstruct.com/pdf/pas_2050.pdf (accessed on 5 December 2023).
  19. Ekvall, T.; Björklund, A.; Sandin, G.; Jelse, K. Modeling recycling in life cycle Assessment. In Technical Report: Towards Sustainable Waste Management; The Swedish Life Cycle Centre: Gothenburg, Sweden, 2020; pp. 1–138. Available online: https://www.lifecyclecenter.se/wp-content/uploads/2020_05_Modeling-recyling-in-life-cycle-assessment-1.pdf (accessed on 6 December 2023).
  20. Farrapo, A.C., Jr.; Matheus, T.T.; Lagunes, R.M.; Filleti, R.; Yamaji, F.; Lopes Silva, D.A. The Application of Circular Footprint Formula in Bioenergy/Bioeconomy: Challenges, Case Study, and Comparison with Life Cycle Assessment Allocation Methods. Sustainability 2023, 15, 2339. [Google Scholar] [CrossRef]
  21. Krexner, T.; Kral, I.; Gronauer, A.; Medel-Jiménez, F.J.; Baue, A. Comparison of a system expansion and allocation approach for the handling of multi-output processes in life cycle assessment—A case study for nano-cellulose and biogas production from elephant manure. Special Issue. In Proceedings of the 48th International Symposium Actual Tasks on Agricultural Engineering (ATAE), Zagreb, Croatia, 2–4 March 2021; Available online: https://atae.agr.hr/ (accessed on 5 February 2024).
  22. Recommendation 2021/2279/EU Commission Recommendation (EU) of 15 December 2021 on the use of the Environmental Footprint Methods to Measure and Communicate the Life Cycle Environmental Performance of Products and Organisations. Available online: https://eur-lex.europa.eu/legal-content/EN/TXT/PDF/?uri=CELEX:32021H2279 (accessed on 5 December 2023).
  23. Commission Regulation (EU) 2022/1616 of 15 September 2022 on Recycled Plastic Materials and Articles Intended to Come into Contact with Foods, and Repealing Regulation (EC) No 282/2008. Available online: https://eur-lex.europa.eu/legal-content/EN/TXT/PDF/?uri=CELEX:32022R1616 (accessed on 7 February 2024).
  24. Commission Regulation (EU) No 10/2011 of 14 January 2011 on Plastic Materials and Articles Intended to Come into Contact with Food (Non-Legislative Acts). Available online: https://eur-lex.europa.eu/legal-content/EN/TXT/HTML/?uri=CELEX%3A32011R0010 (accessed on 7 February 2024).
  25. Plastic—the Facts. The report. Available online: https://plasticseurope.org/pl/wp-content/uploads/sites/7/2021/11/Tworzywa-Fakty-2020_PL_do-pobrania.pdf (accessed on 7 February 2024).
  26. Wenzel, H.; Hauschild, M.Z.; Alting, L. Environmental Assessment of Products: Volume 1: Methodology, Tools and Case Studies in Product Development, 1st ed.; Springer: New York, NY, USA, 2000; pp. 1–543. [Google Scholar]
  27. Guinée, J.B.; Gorrée, M.; Heijungs, R.; Huppes, G.; Kleijn, R.; Koning, A.; de Oers, L.; van Wegener Sleeswijk, A.; Suh, S.; Udo de Haes, H.A.; et al. Handbook on Life Cycle Assessment. Operational Guide to the ISO Standards. III: Scientific Background, 1st ed.; Kluwer Academic Publishers: Dordrech, The Netherlands, 2002; pp. 1–314. [Google Scholar]
  28. European Commission, Joint Research Centre, Institute for Environment and Sustainability. ILCD International Reference Life Cycle Data System (ILCD) Handbook—General Guide for Life Cycle Assessment—Detailed Guidance, 1st ed.; Office of the European Union: Luxembourg, 2010; pp. 1–417. Available online: https://eplca.jrc.ec.europa.eu/uploads/ILCD-Handbook-General-guide-for-LCA-DETAILED-GUIDANCE-12March2010-ISBN-fin-v1.0-EN.pdf (accessed on 5 December 2023).
  29. ISO 14040; Environmental Management—Life Cycle Assessment—Principles and Framework. The International Organisation for Standardization: Brussels, Belgium, 2006.
  30. Weidema, B.P.; Wesnaes, M.S. Data quality management for life cycle inventories-an example of using data quality indicators. J. Clean. Prod. 1996, 4, 167–174. [Google Scholar] [CrossRef]
  31. Lewandowska, A.; Foltynowicz, Z.; Podlesny, A. Comparative LCA of Industrial Objects Part 1: LCA Data Quality Assurance—Sensitivity Analysis and Pedigree Matrix. Int. J. Life Cycle Assess. 2004, 9, 86–89. [Google Scholar] [CrossRef]
  32. More Specific Rules for Defining the Electricity Market. Available online: https://www.environdec.com/news/more-specific-rules-for-defining-the-electricity-market (accessed on 6 December 2023).
  33. BRE Global Product Category Rules (PCR). Available online: https://www.greenbooklive.com/filelibrary/EN_15804/PN514-BRE-EN-15804-PCR.pdf (accessed on 6 December 2023).
  34. Association of Issuing Bodies. Available online: https://www.aib-net.org/facts/european-residual-mix/2018 (accessed on 6 December 2023).
  35. Corona, B.; Shen, L.; Reike, D.; Carreón, J.R.; Worrell, E. Towards sustainable development through the circular economy—A review and critical assessment on current circularity metrics. Resour. Conserv. Recycl. 2019, 151, 104498. [Google Scholar] [CrossRef]
Figure 1. The figure shows the system boundaries in the life cycle of the secondary fence board—baseline scenario 1A.
Resources 13 00050 g001
Figure 2. The figure shows the impact categories ranked by environmental impact (weighted results). Source: own elaboration based on calculations using SimaPro 9.5. software.
Resources 13 00050 g002
Table 1. The table shows the inventory results for the production of secondary fence boards (Recycling process 1).
Production of Secondary Fence Boards (Recycling Process I)
Ecoinvent Dataset (https://ecoinvent.org/database/, accessed on 10 July 2023)AmountUnit
Inputs
Polypropylene, granulate {GLO}| market for|Cut-off, U0.06kg
Injection moulding {GLO}| market for|Cut-off, U0.06kg
Steel, chromium steel 18/8 {GLO}| market for|Cut-off, U1.89g
Silicone product {RER}| market for silicone product|Cut-off, U0.45g
Ethylene glycol {GLO}| market for|Cut-off, U0.4g
Lubricating oil {RER}| market for lubricating oil|Cut-off, U1.71g
Liquefied petroleum gas {GLO}| market group for liquefied
petroleum gas|Cut-off, U
0.08kg
Electricity, low voltage {PL}| market for|Cut-off, U48.65kWh
Outputs
Mixed plastics (waste treatment) {GLO}| recycling of mixed plastics|Cut-off, U0.06kg
Hazardous waste for incineration {Europe without Switzerland}| market for hazardous waste, for incineration|Cut-off, U2.11g
Waste plastic, mixture {RoW}| treatment of waste plastic, mixture, municipal incineration | Cut-off, U0.45g
Steel and iron (waste treatment) {GLO}| recycling of steel and iron|Cut-off, U1.89g
Mixed plastics (waste treatment) {GLO}| recycling of mixed plastics|Cut-off, U0.06g
Hazardous waste for incineration {Europe without Switzerland}| market for hazardous waste, for incineration|Cut-off, U2.11g
Table 2. The table shows the inventory results for life cycle stage materials and production of secondary fence boards (based on calculations using the CFF formula, R1_fence_board = 1.0 and Afence_board = 0.5).
Materials and Production—Secondary Fence Board—Baseline Scenario 1a
(Primary Production of Packaging Debited)
Ecoinvent Dataset (https://ecoinvent.org/database/, accessed on 10 July 2023)AmountUnit
Inputs
Production of secondary fence board (Recycling process I)3.75kg
Polyethylene, high density, granulate {GLO}| market for|Cut-off, U (debit)3.375kg
Injection moulding {GLO}| market for|Cut-off, U (debit)3.375kg
Production of secondary fence board (Recycling process I)3.75kg
Polypropylene, granulate {GLO}| market for|Cut-off, U (debit)3.375kg
Injection moulding {GLO}| market for|Cut-off, U (debit)3.375kg
Production of secondary fence board (Recycling process 1)1.25kg
Polycarbonate {GLO}| market for|Cut-off, U (debit)1.125kg
Injection moulding {GLO}| market for|Cut-off, U (debit)1.125kg
Production of secondary fence board (Recycling process I)1.25kg
Nylon 6-6 {RER}| market for nylon 6-6|Cut-off, U (debit)1.125kg
Injection moulding {GLO}| market for|Cut-off, U (debit)1.125kg
Production of secondary fence board (Recycling process 1)1.25kg
Acrylonitrile-butadiene-styrene copolymer {GLO}| market for|Cut-off, U (debit)1.125kg
Injection moulding {GLO}| market for|Cut-off, U (debit)1.125kg
Production of secondary fence board (Recycling process I)0.5kg
Aluminium, primary, liquid {GLO}| market for|Cut-off, U (debit)0.5kg
Total Production of secondary fence board (Recycling process I):11.75kg
Total debited primary production:10.625kg
Table 3. The table shows the results of the identification of the most relevant life cycle stages in the life cycle of secondary fence boards in baseline scenario 1A.
The Most Relevant Impact CategoriesThe Most Relevant Life Cycle Stages
Life Cycle StageEnvironmental Impact
(Characterised Results)
Share
Climate changeMaterials and production of secondary fence boards88.40kg CO2 eq93%
Resource use of fossil fuelsMaterials and production of secondary fence boards1437.65MJ96%
Ecotoxicity in freshwaterEnd of life of secondary fence boards1553.53CTUe56%
Materials and production of secondary fence boards1165.15CTUe42%
Eutrophication in freshwaterMaterials and production of secondary fence boards0.04kg P eq98%
Particulate matterMaterials and production of secondary fence boards3.58 × 10−6disease inc.90%
AcidificationMaterials and production of secondary fence boards0.49mol H+ eq97%
Source: own elaboration based on calculations using SimaPro 9.5. software.
Table 4. The table shows the results of the identification of the most relevant processes in the life cycle of secondary fence boards (for the two most relevant impact categories)—baseline scenario 1A.
The Most
Relevant Impact
Categories
The Most Relevant Processes
(Only Processes with the Highest Contribution are Listed)
Ecoinvent dataset (https://ecoinvent.org/database/, accessed on 10 July 2023)Share
(Based on Characterised Results,
Recalculated by Considering
Absolute Values)
Climate
change
Electricity, high voltage {PL}|heat and power co-generation, hard coal|Cut-off, U12%
Nylon 6-6 {RER}| production|Cut-off, U10%
Electricity, high voltage {PL}|heat and power co-generation, lignite|Cut-off, U8%
Polycarbonate {RoW}|production|Cut-off, U7%
Electricity, high voltage {RoW}|electricity production, hard coal|Cut-off, U6%
Ethylene {RoW}|ethylene production, average|Cut-off, U5%
Propylene {RoW}|production|Cut-off, U4%
Polycarbonate {RER}|production|Cut-off, U3%
Acrylonitrile-butadiene-styrene copolymer {RoW}|production|Cut-off, U3%
Heat, district or industrial, other than natural gas {RoW}|heat production, at hard coal industrial furnace 1–10 MW|Cut-off, U2%
Acrylonitrile-butadiene-styrene copolymer {RER}|production|Cut-off, U2%
Heat, district or industrial, other than natural gas {RoW}|heat production, at hard coal industrial furnace 1–10 MW|Cut-off, U2%
Acrylonitrile-butadiene-styrene copolymer {RER}|production|Cut-off, U2%
+32 other processes with very low individual contribution (0.2–1%)
Resource use, fossil fuelsEthylene {RoW}|ethylene production, average|Cut-off, U12%
Propylene {RoW}|production|Cut-off, U11%
Nylon 6-6 {RER}|production|Cut-off, U9%
Lignite {RER}|mine operation|Cut-off, U6%
Polycarbonate {RoW}|production|Cut-off, U5%
Acrylonitrile-butadiene-styrene copolymer {RoW}|production|Cut-off, U4%
Hard coal {CN}|hard coal mine operation and hard coal preparation|Cut-off, U4%
Hard coal {Europe, without Russia and Turkey}|hard coal mine operation and hard coal preparation|Cut-off, U3%
Hard coal {ID}|hard coal mine operation and hard coal preparation|Cut-off, U3%
Ethylene {RER}|ethylene production, average|Cut-off, U3%
Propylene {RER}|production|Cut-off, U3%
+9 other processes with low individual contributions (1–2%)
Source: own elaboration based on calculations using SimaPro 9.5. software.
Table 5. The table shows the results of the identification of the most relevant elementary flows in the life cycle of secondary fence boards—baseline scenario 1A.
The Most Relevant Impact CategoriesThe Most Relevant Elementary Flows
Name of Elementary FlowCompartmentShare
Climate changeCarbon dioxide, fossil fuelOutput to air83%
Resource use of fossil fuelsOil, crudeInput of raw material34%
Gas, natural/m3Input of raw material28%
Coal, hardInput of raw material24%
Ecotoxicity in freshwaterAluminiumOutput to water57%
AluminiumOutput to air23%
ChlorideOutput to water9%
Eutrophication in freshwaterPhosphateOutput to water99%
Particulate matterParticulates < 2.5 μmOutput to air59%
Sulfur dioxideOutput to air23%
AcidificationSulfur dioxideOutput to air72%
Nitrogen oxidesOutput to air26%
Source: own elaboration based on calculations using SimaPro 9.5. software.
Disclaimer/Publisher’s Note: The statements, opinions and data contained in all publications are solely those of the individual author(s) and contributor(s) and not of MDPI and/or the editor(s). MDPI and/or the editor(s) disclaim responsibility for any injury to people or property resulting from any ideas, methods, instructions or products referred to in the content.

