
Hydrochar as an Alternative to Coal: A Comparative Study of Lignocellulosic and Nonlignocellulosic Biomass

Graduate School of Bioresources, Mie University, Tsu 514-8507, Japan
*
Author to whom correspondence should be addressed.
Resources 2024, 13(4), 49; https://doi.org/10.3390/resources13040049
Submission received: 1 February 2024
/
Revised: 5 March 2024
/
Accepted: 12 March 2024
/
Published: 31 March 2024
Abstract
:Hydrothermal carbonization (HTC) is a widely used process for converting biomass with a wide range of moisture. Biomass selection poses challenges in producing hydrochar with desired properties because of their different constituents. In this study, we investigated the fuel properties of hydrochar of sorghum bagasse (SB) and microalgae (MA) at different severity factors (SFs = 4.08, 4.43, 5.56, 5.90, and 6.63) and their potential as alternatives to coal. The results show that during HTC, both biomasses underwent dehydration, in addition to the noticeable decarboxylation of MA. Fixed carbon increasingly developed in the SB hydrochar, in contrast to the MA hydrochar, which formed volatile hydrocarbon; thus, the MA hydrochar released heat values of 26.7–36.2 MJ·kg−1, which was higher than that of SB at 19.7–28.0 MJ·kg−1. However, owing to the stable hydrocarbons, SB hydrochar is assumed to combust more stably and ignite more decently, as indicated by its fuel ratio (0.83), approaching 0.9–1.5. Moreover, the greater number of solids recovered in SB after carbonization makes its conversion more techno-commercially viable, retaining 1.8 times more of the original energy. Conflating these fuel properties reveals that SB hydrochar (SF = 6.63) is a promising alternative to steam coal, and MA hydrochar is an attractive alternative to both steam (SF = 4.08–5.90) and coking coals (SF = 6.63). Concisely, both biomasses are practically promising as value-added hydrochars, but only SB can be developed beyond the current HTC severity owing to the thermal stability of its hydrocarbons.
1. Introduction
Hydrothermal carbonization (HTC) is a thermal treatment that adds value to solid products or so-called hydrochar [1]. The system typically adopts a subcritical water medium to prevent high bio-oil and syngas production at temperatures between 150 °C and 250 °C and autogenous pressures of 2–6 MPa [1,2,3]. Reactions involving dissolution–polymerization and pyrolysis-like decomposition occur and then allow the formation of carbonaceous solids [4]. To date, the valorization of hydrochars has been developing in many industrial and environmental applications, one of which is for energy production [5]. Compared with pyrolysis and gasification, HTC is preferred in solid fuel production due to the following reasons [6]: (1) utilization of wet biomass without pre-drying, (2) less pollution owing to dilution in the aqueous phase, (3) higher carbon recovery rate, and (4) lower energy cost related to smaller carbonization temperature. Corresponding to the high carbon recovery and inorganic leaching during HTC, hydrochar innately exhibits some desirable fuel properties, including high heating value and low ash content [7,8], thus making it comparable to coals and beneficial as a combustor feedstock.
The feasibility of hydrochar varies depending on the biomass precursor. In a study by Wilk et al. [8], hydrochars derived from lignocellulosic (LBM) and nonlignocellulosic biomass (NLBM), such as acacia wood, pine wood, and sewage sludge, differed in the higher heating values (HHVs = 21.51, 23.88, and 11.40 MJ·kg−1) and ash content (AC = 0.20%, 0.47%, and 55.80%). However, in contrast to LBM, sewage sludge did not alter any increment in HHV (∆HHV = −2.94 MJ·kg−1) when HTC was induced at 200 °C. Nzediegwu et al. [6] similarly reported that the carbonization of NLBM using manure pellets from 180 °C to 300 °C reduced the HHV of the resulting hydrochar from 7.90 to 5.60 MJ·kg−1, despite the initial increase in the raw state. Lee et al. [9] also observed such an adverse effect on hydrochar derived from aquatic NLBM, lipid-extracted microalgae, at 200–240 °C, which reduced the HHV from 27.8 to 23.6 MJ·kg−1. Although the heating values of those NLBM hydrochars negatively changed, the dehydration and decarboxylation reactions that occurred during HTC reduced the atomic ratios to about 1.0–0.2 for O/C and 1.8–1.0 for H/C, hence at least converting them into peat- and lignite-like hydrochars [6,8,9]. Equivalently, the lignite-like hydrochar can be utilized as an alternative fuel for domestic power generation [10]. Given that some biomasses face challenges to become value-added hydrochars and yet are still applicable as coal alternatives, a comparative study of organically different biomasses is essential to assess the fuel properties of hydrochars and map their potential applications compared with coal.
Classified as holocellulose- and lignin-based materials, LBM is typically found in fibrous agricultural residues, whereas NLBM, which consists of proteins and lipids, is found in aquatic biomasses and animal manure [11]. Sorghum bagasse (SB) and microalgae (MA) are among those biomasses representing LBM and NLBM, respectively. The average organic constituents of SB are 71.52% fiber, 3.73% protein, and 1.38% lipid [12,13], and those of MA are 8.73% fiber, 43.35% protein, and 9.26% lipid [14,15]. Moreover, these biomasses are attractive because of their high productivity and resistance to hostile environments. On average, SB can be collected in amounts of up to 4.89 tons·ha−1 from harvesting full-grown plants [16], and MA shows dry biomass productivity of 2–5 g·L−1·d−1 through mixotrophic cultivation [17]. SB is also capable of growing in arid and highly saline land [18], while MA can survive in brackish water without competing for terrestrial space [19].
As a fuel benchmark, coal generally differs by its ranking. Low-rank coal is attributed to low heating value and high volatilization upon combustion, exemplified by lignite and sub-bituminous coals. These attributions contrast high-rank coal, such as those of bituminous and anthracite coals. Meanwhile, their tar, ash, and sulfur contents vary considerably [20,21]. Based on its utilization, some coals, called steam coal, are used to generate steam to drive turbines in power plants for electricity production. A small amount of this coal is also demanded by industrial consumers. Some others with caking properties, or coking coal, are commonly fed to a blast furnace of smelting iron ore to produce pig iron [10,20]. Caking is a behavior of coal to melt and resolidify under inert heating to form a coherent porous plastic mass, thus enhancing the permeability and sturdiness properties when combusted [22].
To the best of our knowledge, few fuel characteristics from hydrochar studies have been mapped to their practical applications, especially by contrasting the two main types of biomass, namely LBM and NLBM. Therefore, we aim to fill the knowledge gap on the solid fuel potential of hydrochars, which are derived from SB and MA biomasses as the representatives in this study. The analytical objectives are (1) to assess the fuel properties of hydrochars (i.e., mass yield (MY), higher heating value (HHV), and proximate–ultimate composition) and (2) to benchmark their applicability against coal standards.
2. Materials and Methods
2.1. Sample Preparation
Postharvest SB parts (Sorghum sp.), including stems, leaves, and panicles, were collected from the research farm of Mie University, Japan. SB was washed and air-dried to inhibit decay. Subsequently, the air-dried SB was pulverized using a high-speed blender (YKB, AS ONE Corp., Osaka, Japan) with a rotation speed of 28,000 rpm for 1 min and sieved to obtain a particle size of less than 150 μm. Meanwhile, MA powder (Chlorella sp.) was commercially obtained from Sunlife Co., Ltd., Nagoya, Japan. The moisture contents of all biomasses were homogenized by drying in a laboratory oven (OF-300V, AS ONE Corp., Osaka, Japan) at 105 °C for 24 h. The dried SB and MA biomasses were stored in airtight sample bottles and kept in a desiccator before proceeding to further experiments (see Figure 1).
2.2. Hydrothermal Carbonization Experiment
The HTC experiment was performed in a 45 mL synthesis vessel (Model 4744, Parr Instrument Co., Moline, IL, USA) and thermally induced in a laboratory oven (see Figure 2b). A mixture of biomass and deionized water was loaded at a ratio of 1:10 (3.5 g of dried biomass and 35 g of water) (see Figure 2a). Four factorial points of temperature (175 °C and 225 °C) and residence time (1.25 and 2.75 h) were set as the operating parameters, following our previous research design [23]. An additional point of 250 °C for 2.75 h was added to represent the most severe HTC condition (see Table 1). After the HTC process, the vessel was removed and cooled to 27 °C using a fan. The solid phase was then separated from the aqueous phase by gravity filtration of the obtained slurry (see Figure 2c,d). The residual solids were dried at 105 °C for 24 h to recover the hydrochar. Three samples were prepared for each analysis to ensure reproducibility. Ground SB and MA biomasses and hydrochars are shown in Figure 2e. The hydrochars produced were labeled by their severity factor (SF). SF represents the integration of temperature, T (in °C), and residence time, t (in min) [24]. It is expressed as shown in Equation (1), where RO is the ordinate reaction defined by Overend et al. [25] to describe the impact of steam-aqueous pretreatment on biomass fractionation.
2.3. Hydrochar Analysis Methods
2.3.1. Mass Yield
Gravimetric analysis was conducted to measure the change in the mass ratio between the hydrochar produced, mH (in g), and the dried biomass, mB (in g). The ratio represents the number of recoverable solids or MY (in %) and is expressed as follows [23]:
2.3.2. Higher Heating Value
An adiabatic calorimeter (O.S.K 150, Ogawa Sampling Co., Ltd., Tokyo, Japan) was used to determine HHV (in MJ·kg−1) by burning a 0.3 g sample in a pressurized bomb, into which O2 gas was injected at 3 MPa. The released heat is a gross value involving the latent heat of evaporation. The HHV was calculated using the following equation [23]:
where mS and mP are the masses of the sample and wrapping paper (in g), respectively, while mW is the mass of water in the bucket (1500 g herein). ∆mR is the mass loss of burned-out wire (in g). M is the calibrated mass of water determined by burning benzoic acid (322.2 g herein). cW is the specific heat capacity of water (1 cal·g−1·°C−1). CP and CR are the standardized heat capacities of the wrapping paper and conducting wire (15,070 and 3035 J·g−1), respectively. ∆T is the temperature change in water (in °C), which increases due to combustion. The energy yield, EY (in %), was determined to show the remaining energy of the original state after HTC. EY was calculated by multiplying MY by the HHV ratio of hydrochar (HHVH) and raw biomass (HHVB), as expressed in Equation (4).
2.3.3. Proximate Composition
The proximate analysis provides the portion of the sample that burns in the gaseous (volatile matter; VM) and solid states (fixed carbon; FC), as well as the unburned inorganic residue (ash content; AC). Following the two-step heating method described by Czajka [26], the VM was determined using a thermal analyzer (EXSTAR 6000 TG/DTA 6200, Seiko Instruments Inc., Chiba, Japan). Approximately 6–7 mg of a sample was heated under a flowing N2 gas at 200 mL min−1. The heating was set from ambient temperature to 110 °C at a rate of 10 °C min−1 and held for 40 min. The process continued at a heating rate of 30 °C min−1 until the temperature reached 900 °C without being held. Subsequently, the VM (in %) was calculated using Equation (5) by referring to Figure 3:
where m110 and m900 are the masses of the sample after drying at 110 °C and pyrolyzed at 900 °C (in mg), respectively. AC analysis was conducted based on ASTM D 1762-84 (2007) [27]. A sample of 0.5 g was loaded into a ceramic crucible and subjected to complete combustion in a muffle furnace (HPM-0G, AS ONE Corp., Osaka, Japan). The temperature was increased to 750 °C and held for 6 h. Next, the mass of the sample after combustion was measured, showing the mass of ash remaining. The AC (in %) was calculated by dividing the final mass of the sample by the initial mass of the dried sample. FC (in %) was then obtained by subtracting the total VM and AC from 100%. Finally, the ratio of FC to VM could be calculated to define the fuel ratio (FR), which is an indicator of combustion performance and coal rank [28].
2.3.4. Ultimate Composition
Ultimate analysis reveals the elemental constituents of organic samples, such as carbon (C), hydrogen (H), nitrogen (N), and oxygen (O). Approximately 5–10 mg of a sample was placed in an aluminum boat and subjected to high combustion using an elemental analyzer (Vario EL Cube, Elementar Analysensysteme GmbH, Langenselbold, Germany). O2 gas was allocated with a dosing time of 90 s. Once the C, H, and N elements (in %) of the sample were obtained, the percentage of O could be calculated by subtracting all other elements and AC from 100%. To depict the Van Krevelen diagram, H/C and O/C atomic ratios were equivalently plotted as the ratio of the number of moles. The number of moles was obtained by dividing the element percentage by their molar mass.
2.3.5. Surface Morphology
Scanning electron microscopy (SEM) was used to show the outer planes of biomasses and hydrochars. A sample was placed on a carbon-tipped metal stub and coated evenly with osmium tetroxide (OSO4) using a coating machine. An electron microscope (S-4300, Hitachi High-Tech Corp., Tokyo, Japan) was employed at an accelerating voltage of 10.0 kV to image an organic sample.
3. Results and Discussion
3.1. Distribution of Mass and Energy Yields
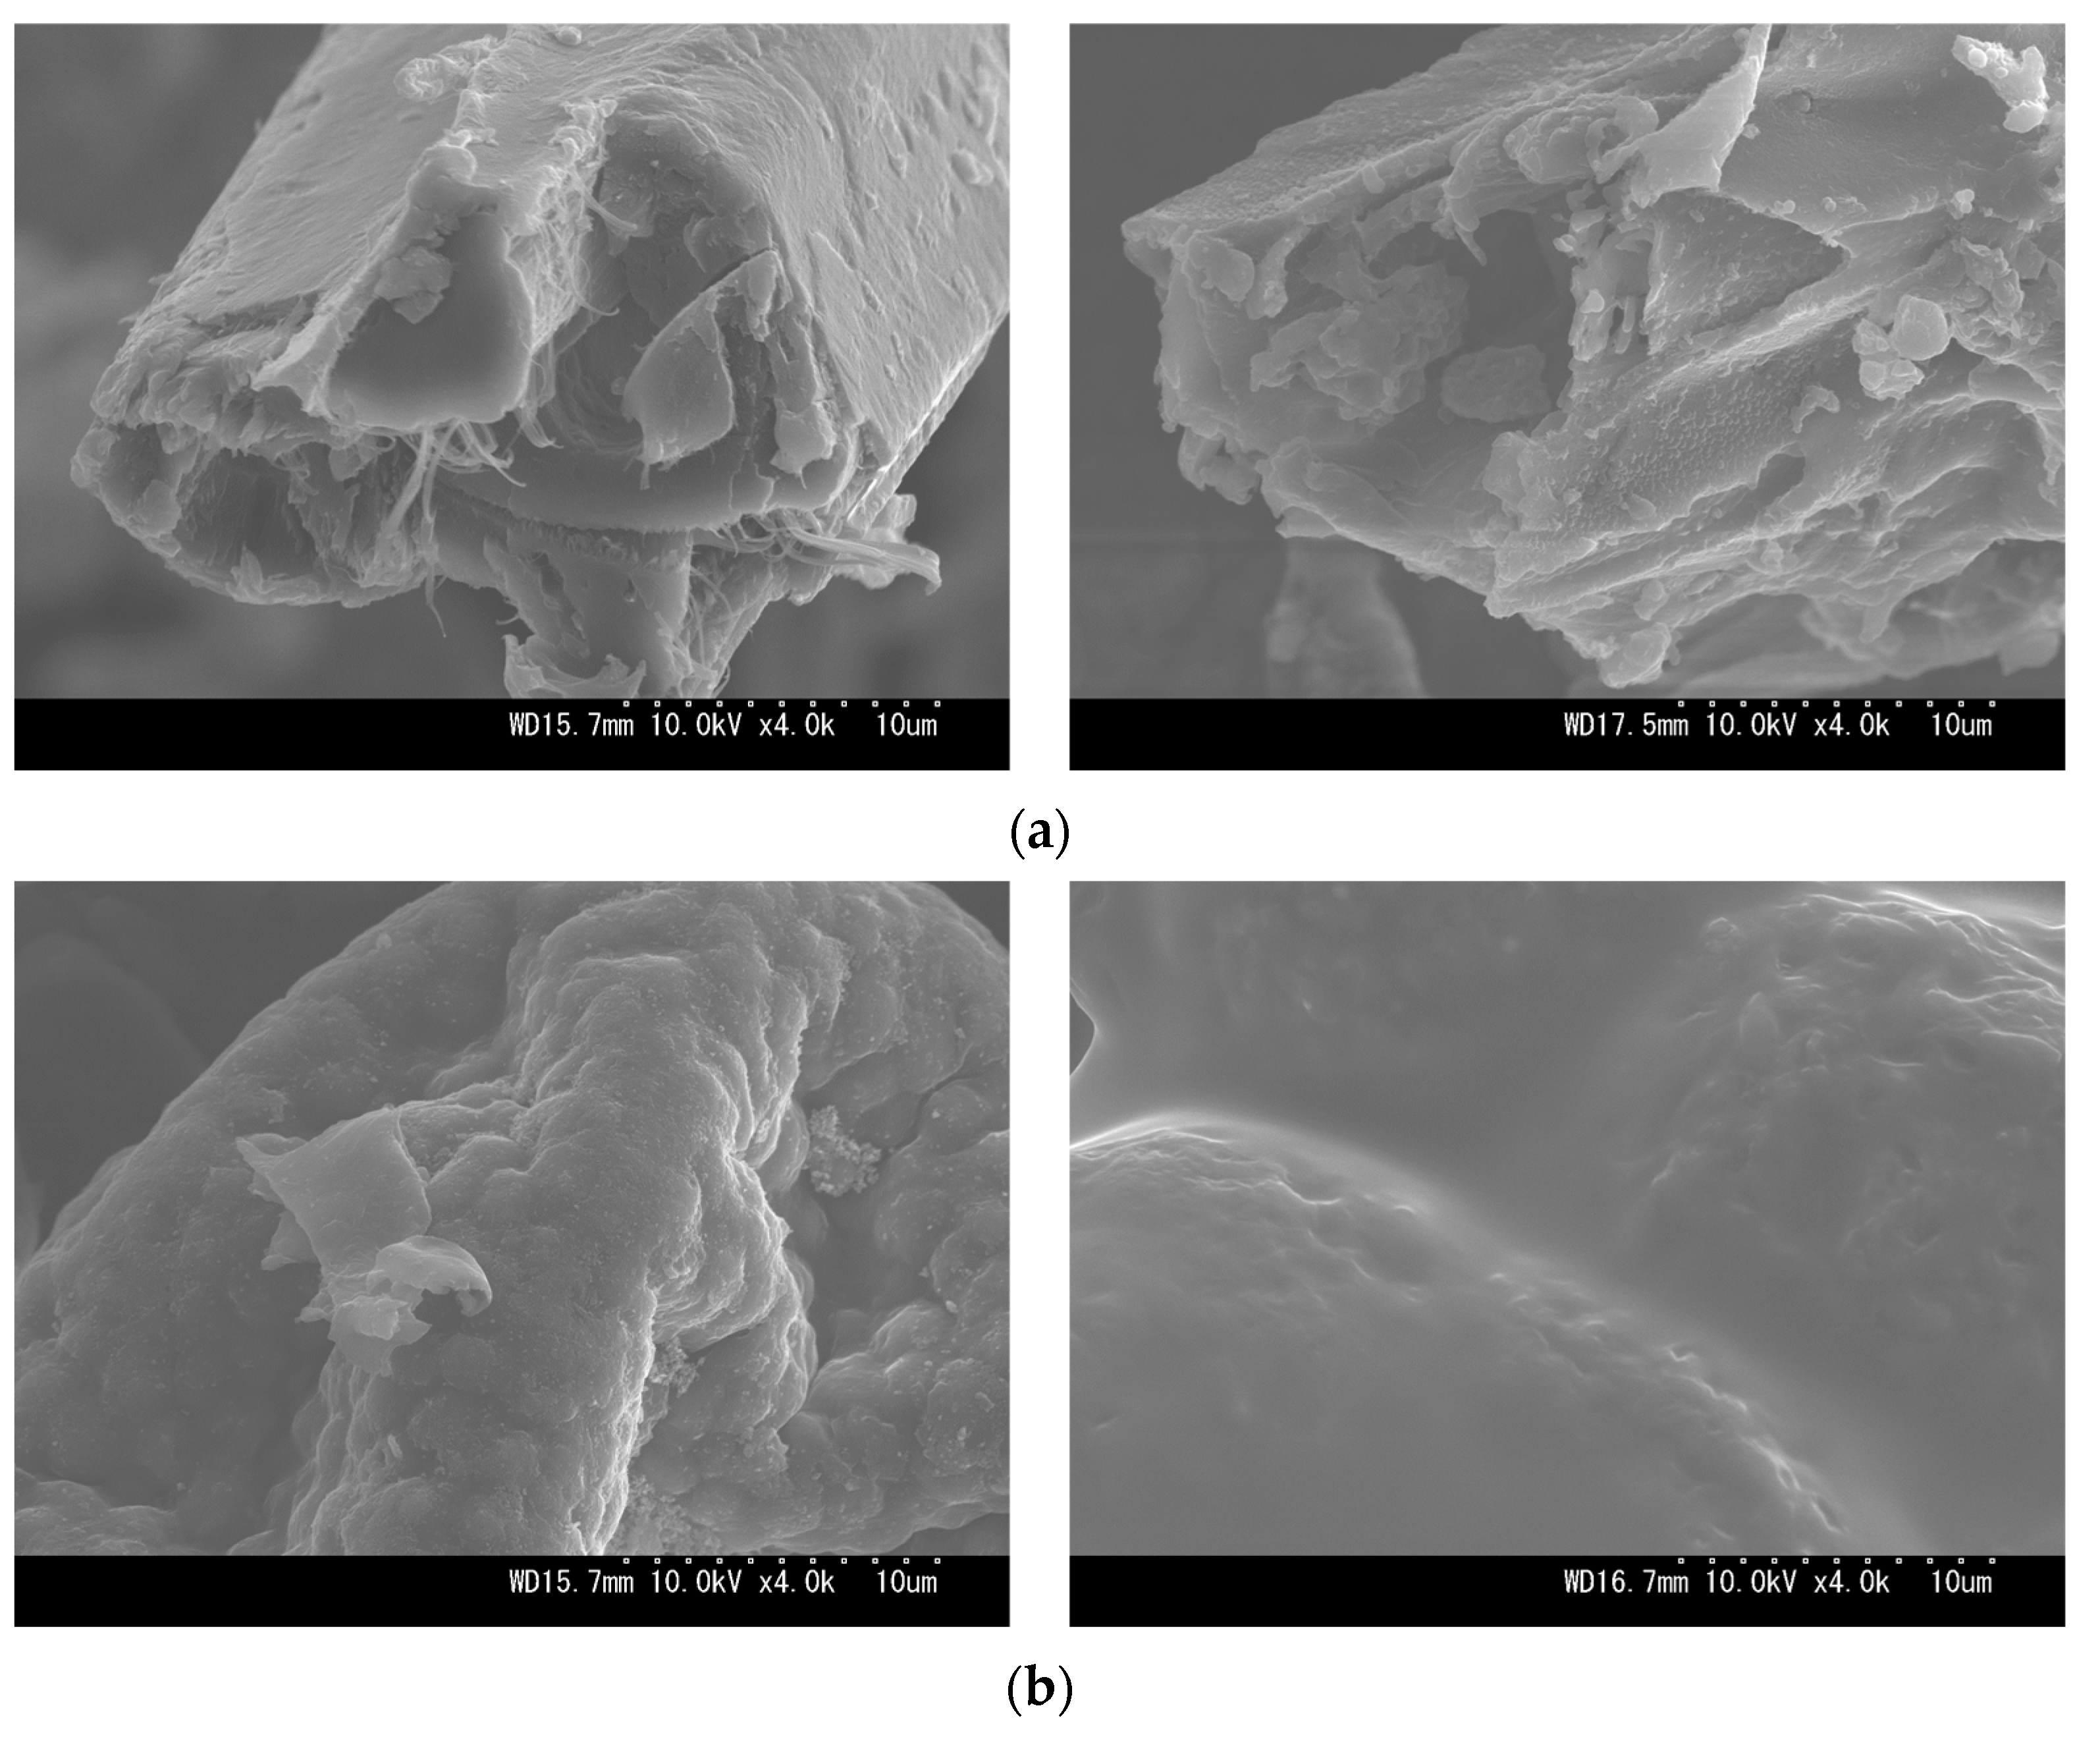
The number of recovered solids in hydrochars was observed to depend on the HTC severity (see Figure 4). As SF increased, the MY of SB hydrochars decreased from 79.5% to 46.2%, and that of MA decreased from 71.6% to 30.2%. The downward trends confirm hydrous degradation before char formation, which is driven by ionic reactions and low-viscosity penetration [29]. This is evidenced by the SEM images (see Appendix A, Figure A1), where the gradual destruction of the original biomass matrices occurred alongside the formation of irregular block-shaped (SB) and oil-like hydrocarbons (MA). However, the MA hydrochar between SFs 5.90 and 6.63 exhibited no observable decrease in MY with a deviation of 1.1%. The insets of Figure 4 reveal that the corresponding MA hydrochar underwent a phase transition by forming an emulsion due to high bio-oil production. The transition implies that the operating limit between hydrothermal carbonization (HTC) and liquefaction (HTL) was attained, and the bio-oil separation may require a solvent extraction, hence hindering solid production and making solid conversion uneconomical for HTC of MA beyond the SF 6.63.
Comparing the magnitude of MY between both biomasses, SB suffered less thermal degradation than MA, resulting in a greater MY of SB hydrochar with deviations of 7.9–29.3%. The greater MY suggests that SB conversion might recover more incompletely carbonized solids with less conversion into other phases. The incomplete carbonization is attributed to the high thermal stability of the organic constituents of SB, which degraded at different temperatures. Based on our unpublished TGA, the pseudo-peak temperatures of degradation were ordered as follows [30]: hemicellulose < protein < cellulose < lipid < lignin, evidencing the greater stability of LBM constituents. Such distinctive stabilities were also responsible for the maximum MY losses. SB showed a maximum MY loss (ΔMY = 14.3%) at higher SFs from 5.90 to 6.63, compared with MA (ΔMY = 25.5%) at SFs from 4.43 to 5.90, by observing the time-controlled SFs 4.43, 5.90, and 6.63. The interdependent reactions of the organic constituents also suppressed the reincorporation of carbonized solids and promoted the loss of some fragments to other phases, which was partially the reason for the lower MY of MA hydrochar. Xiao et al. [31] and Li et al. [32] reported that HTC of complex biomass that was solely impregnated with a protein isolate lowered the solid distribution by producing more liquid, in contrast to the case in which the biomass was impregnated with a saccharide, lignin, or lipid isolate.
The quality of carbonization, determined by MY and HHV, surely demonstrates the applicability of a fuel to a combustor but at the expense of energy loss [33]. To consider the techno-commercial feasibility of SB and MA, the energy losses of their hydrochars were quantified by calculating EY. Figure 5 shows that the EY of SB hydrochar was higher than that of MA, and both trends were relatively decreasing as SF increased from 4.08 to 6.63. The EY of SB and MA hydrochars amounted to 82.1–67.8% and 77.7–44.3%, respectively. The higher EY of SB hydrochar indicates that the solids of SB retained more energy-rich components while losing some energy-lean components during HTC. Therefore, SB hydrochar is more promising for practical importance by balancing the heat output of a combustor (maximizing HHV generation) and the availability of feedstock (minimizing MY loss) [34].
3.2. Organic Composition of Solid Fuel
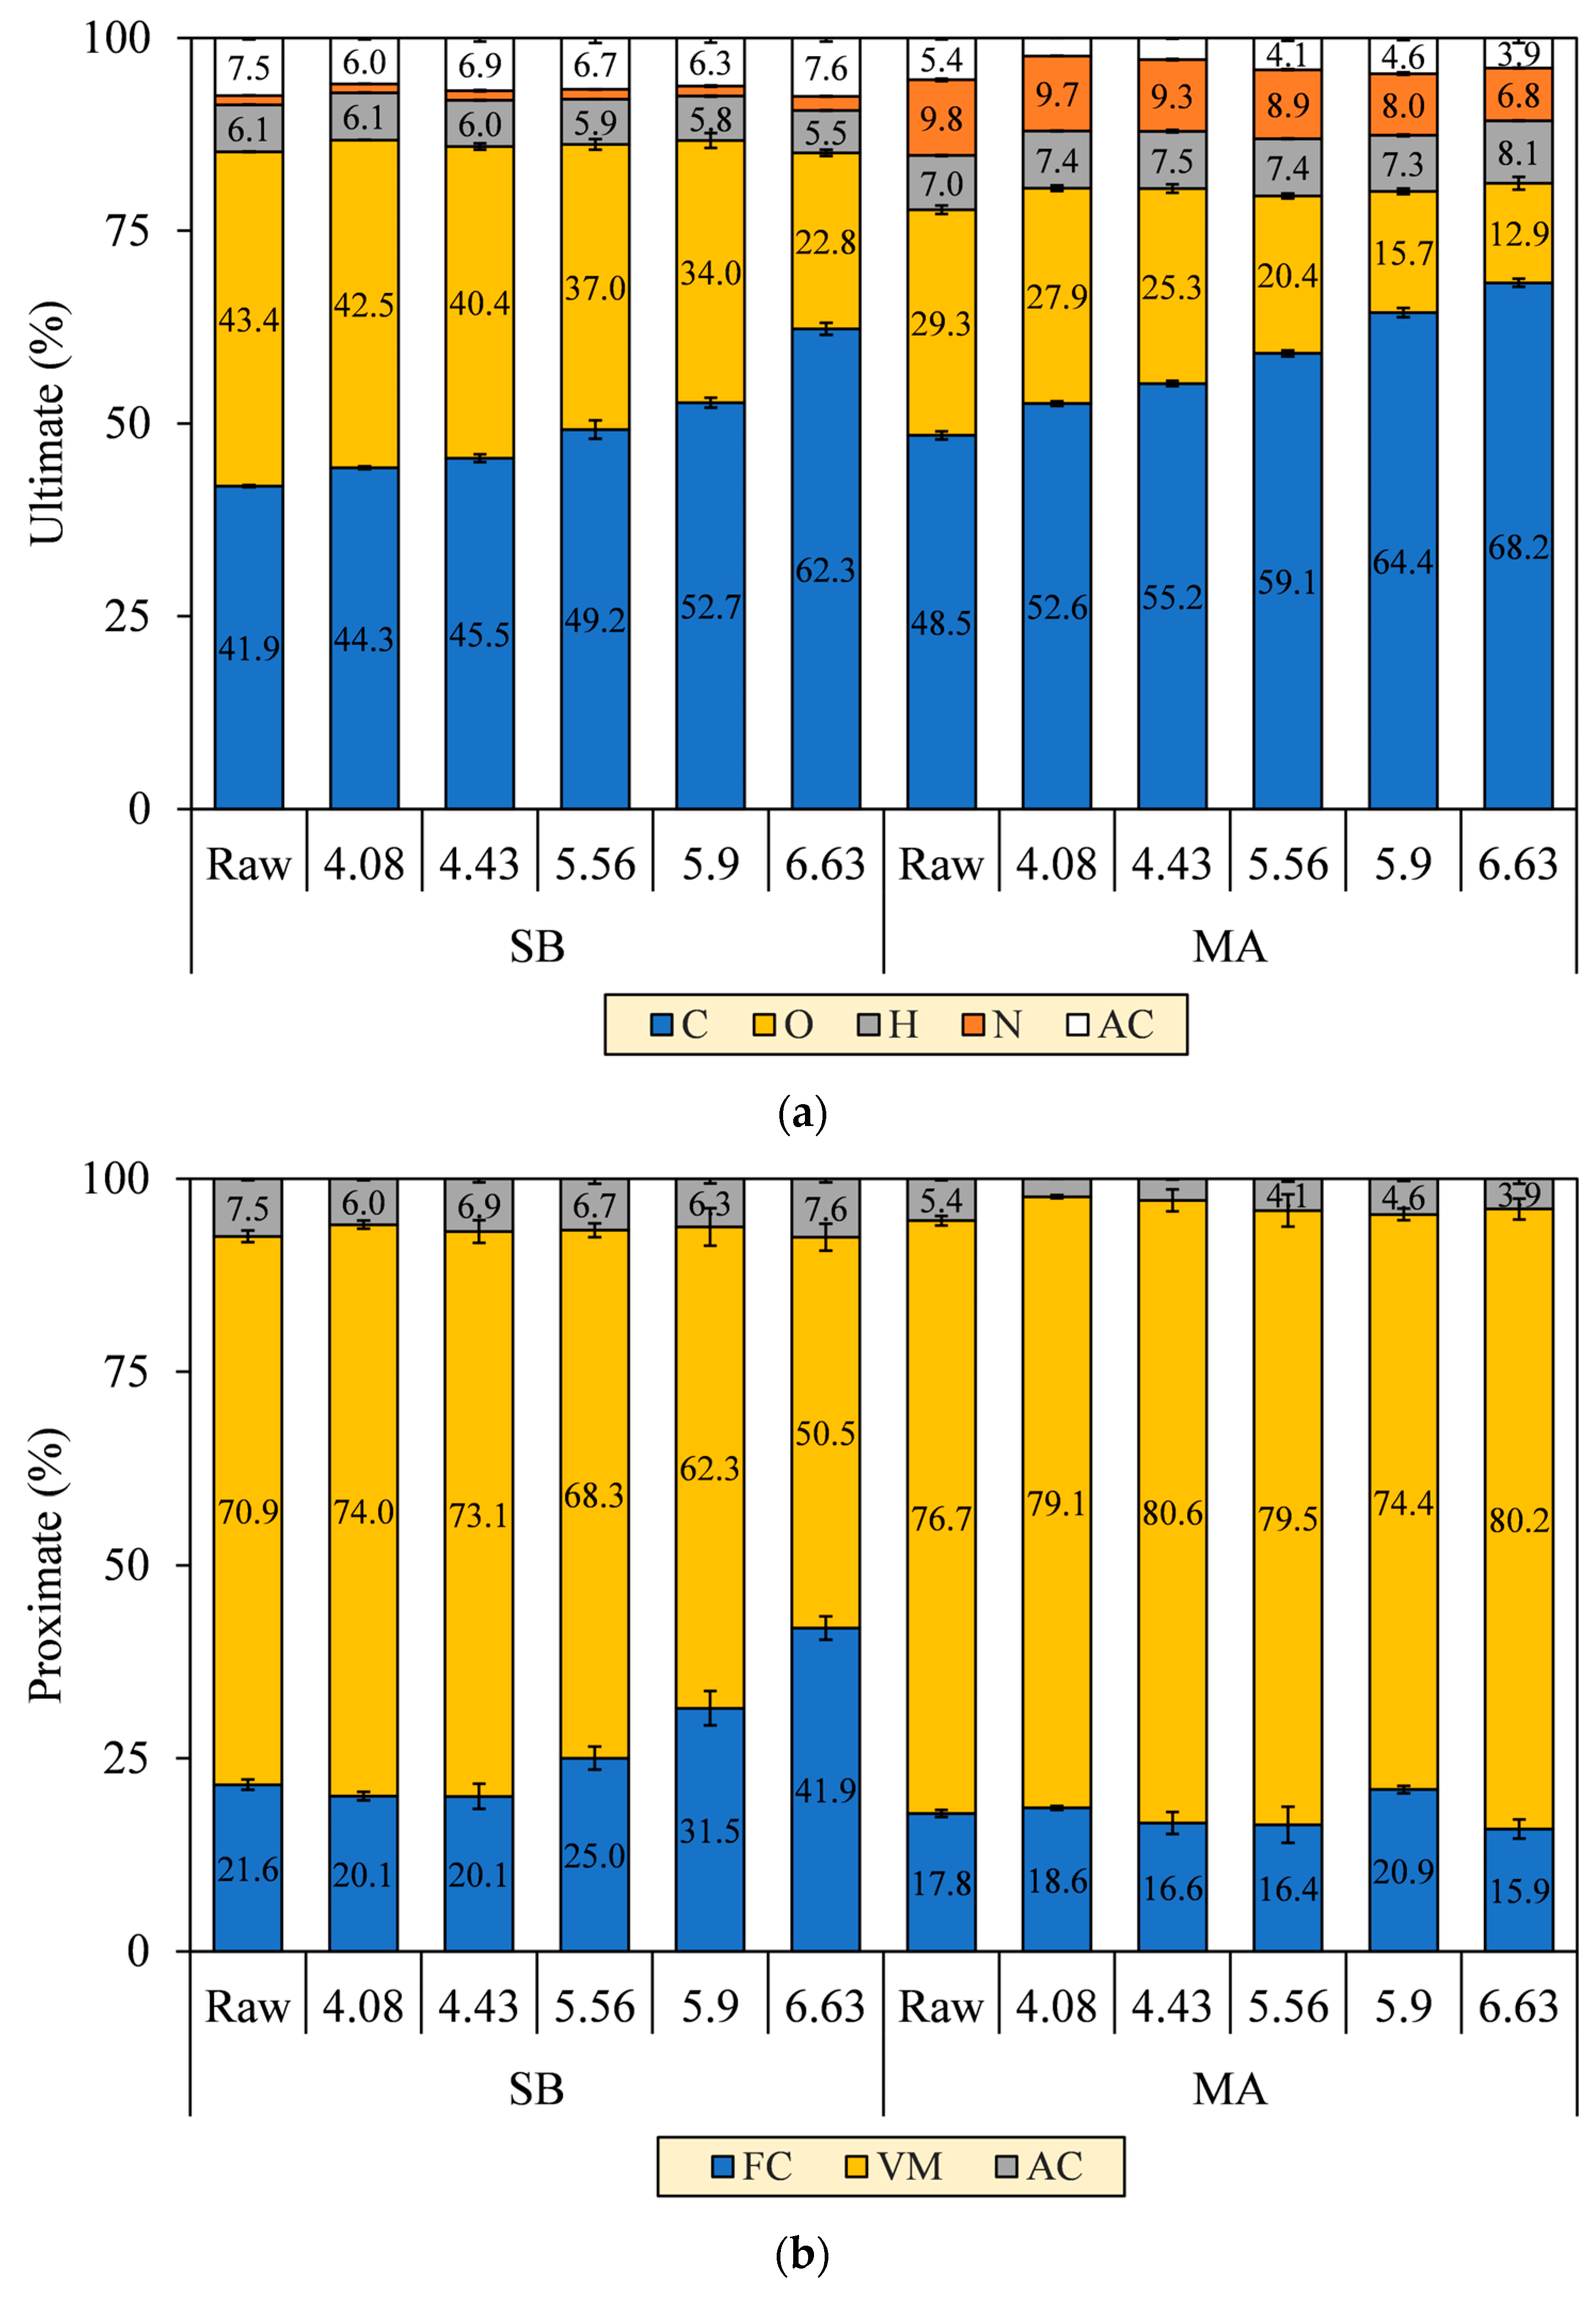
The formalism of the Van Krevelen diagram was proposed to grasp the atomic alteration in C, H, and O by the deoxygenation and demethylation reactions likely involved during HTC [35]. The diagrams in Figure 6 show intense decreases in O/C (0.78–0.28 (SB), 0.46–0.19 (MA)), and H/C ratios (1.75–1.06, 1.74–1.35) (see Table 2), indicating that dehydration dominated the other reactions. Noticeably, between SF 5.90 and 6.63, the H/C ratio of MA hydrochar sharply increased from 1.35 to 1.42 as O/C decreased from 0.19 to 0.14. In addition to the generally smaller reduction in H/C of MA compared with SB, these results provide an insight that decarboxylation participated more intensely during HTC of MA, thus explaining the diagram of MA that looks less dehydrated than SB. In principle, dehydration cleaves the hydroxyl groups (–OH) and releases water vapor (H2O) as a by-product, causing the hydrochars to have hydrophobic surfaces. On the other hand, decarboxylation acts to degrade the carboxyl (–COOH) and carbonyl groups (C=O) while forming carbon dioxide (CO2) and carbon monoxide (CO), respectively [36]. Meanwhile, in the recent study, there was no clear evidence for demethylation; hence the reaction is negligible.
Changes in the N element of the hydrochars were merely observed based on the ultimate analysis, as shown in Figure 7a. The N element of MA decreased from 9.8% to 6.8%, whereas, interestingly, that of SB increased from 1.2% to 1.8% as SF progressed. Deamination of amino acids indeed liberated primary and secondary amines (–NH2/–NH–) and ammonia (NH3), thus promoting the N removal from both biomasses into the aqueous phase [37]. However, the N-containing fragments of SB further reacted and accumulated in solids, potentially by forming Mannich bases and alkanolamines in the presence of aldehydes, phenols, and epoxides [38,39]. Those pyrolyzates were also evident in our unpublished Py-GC/MS chromatogram [30]. Consequently, the emissions of nitrogen oxides (NOX) and nitrous oxides (N2O) cannot be limited to some extent for the combustion of SB hydrochars.
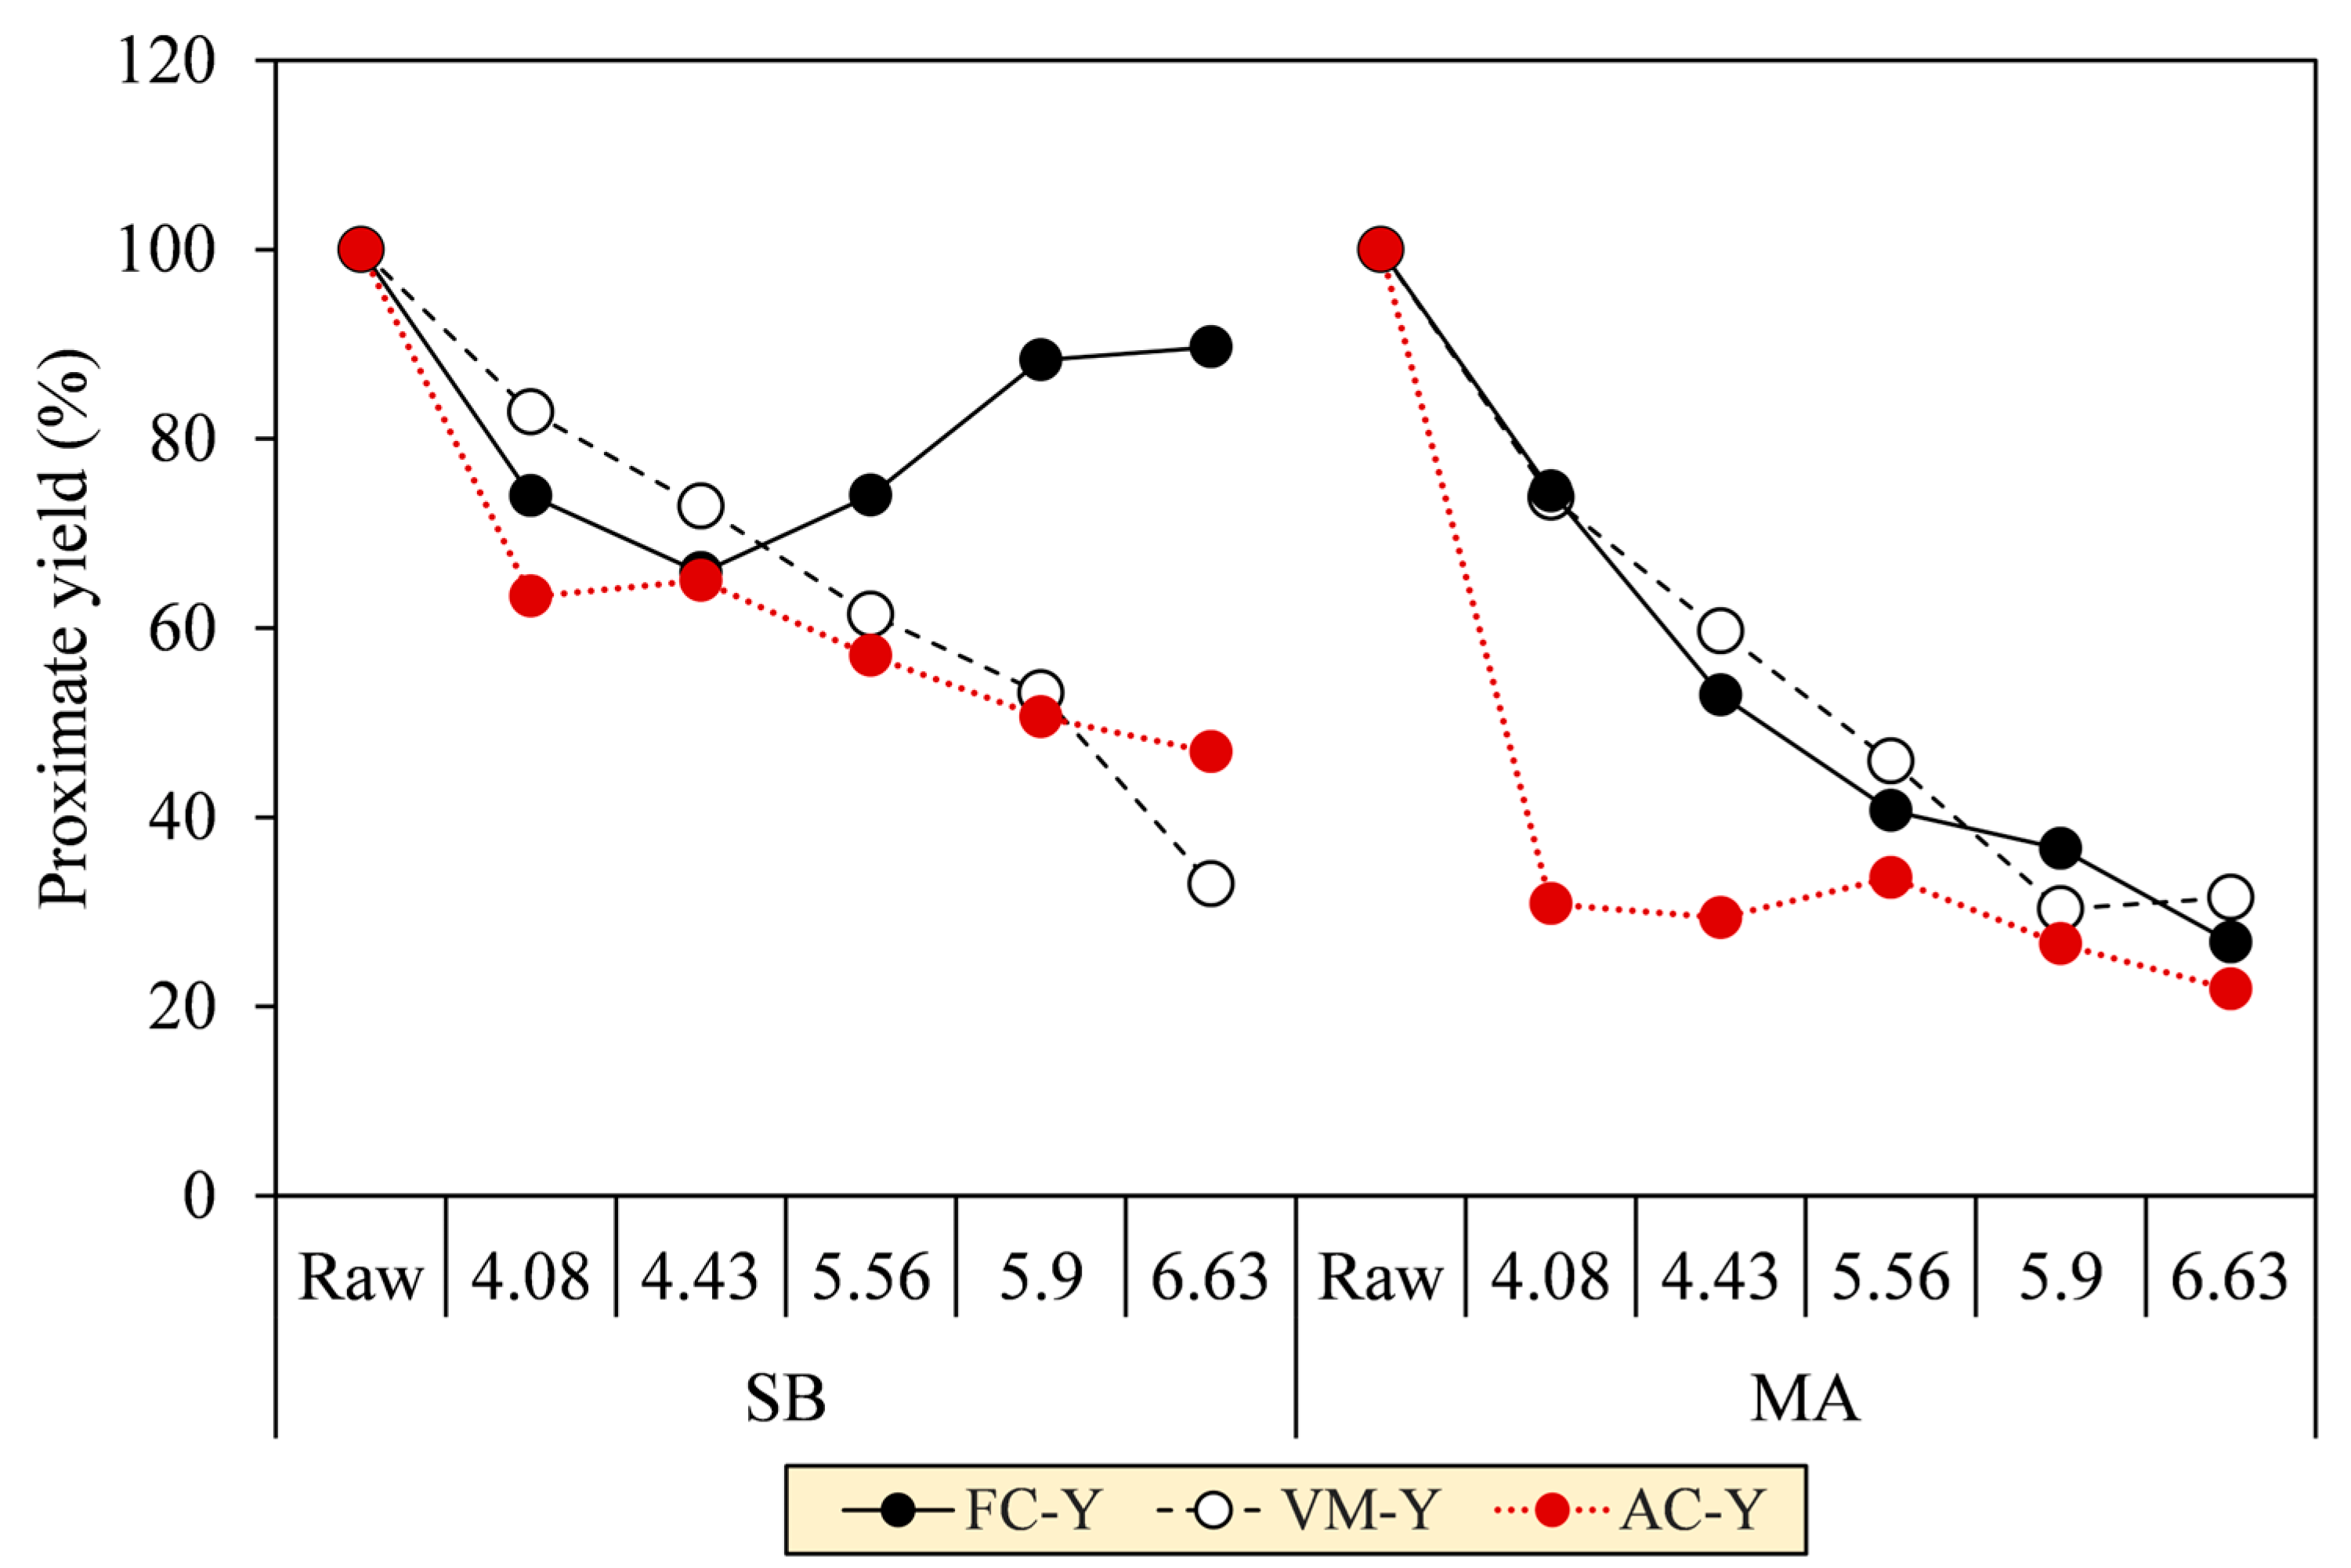
Regarding the proximate analysis in Figure 7b, VM in the SB hydrochar mainly decreased to 50.5% throughout SF progression, although a slight increment at SF 4.08 was observed to precede the decrease due to the deposition of oxygenated hydrolysis fragments [40]. At the turning point (SF = 4.43), the FC formation was initiated to increase from 20.1% to 41.9%. The initiation is a clear onset of aromatization during carbonization, as confirmed by the increase in fixed carbon yield (FC–Y) in Figure 8. FC–Y was calculated by multiplying the FC ratio of hydrochar and raw biomass by MY. Considering the tendency of dehydration in SB conversion, the reaction is thought of as the process of assimilating the hydrolyzed monosaccharides of labile carbohydrates (VM) into furanic intermediates before finally condensed into stable aromatic hydrocarbons (FC) [41]. This explains the increase in the C element from 41.9% to 62.3% in Figure 7a. The speculation is consistent with the growing number of the aromatic and furanic pyrolyzates in our unpublished Py-GC/MS results [30].
The VM and FC of MA hydrochars, however, did not change significantly with the increasing SF. Reasonably, the aromatization was inferior during carbonization, as indicated by the decreasing FC–Y. The lower aromatization allegedly allowed other reactions to form labile hydrocarbons, thereby preserving the proportion of VM amidst the intense devolatilization and making the VM and FC trends seem constant (VM = 76.7–80.2% and FC = 17.8–15.9%). Considering the decarboxylation observed in MA conversion, we speculated that the hydrolyzed fatty acids of labile lipids (VM) were transformed into aliphatic hydrocarbons (VM) and adsorbed on the core solids [32,42]. This explains the increases in the C and H elements from 48.5% to 68.2% and 7.0% to 8.1%, respectively. The speculation was reassured by the aliphatic pyrolyzates, such as long-chain alkanes, alkenes, and fatty amides, increasingly detected in our unpublished Py-GC/MS results [30]. The presence of these pyrolyzates was also evident in SEM images of the MA hydrochar surface that was covered with an oily layer, which was similarly observed by Li et al. [32] when performing HTC of lipid-impregnated biomass.
The VM and FC are two aspects that govern the ease of ignition and flaming stability of fuels, which are commonly specified in terms of FR. As shown in Figure 9, the FR of SB hydrochar increased from 0.27 to 0.83 as the HTC severity increased, particularly starting from SFs 4.43 to 6.63. Meanwhile, the FR of MA was relatively constant before a notable increase was observed from SFs 5.56 to 5.90 (FR = 0.21–0.28), followed by a decrease at SF 6.63 (FR = 0.28–0.20). The smaller the FR, the easier the fuel burns, but the more unstable the combustion [43]. Reasonably, the high VM concentrations intensify devolatilization and gas oxidation, where the oxidation occurs locally in the gas mixing zone between VM and O2. Unfortunately, the presence of this zone results in an insufficient O2 concentration that is supposed to diffuse into the solids, thus limiting the FC oxidation [44,45]. The balanced condition for FR is accordingly proposed to range between 0.90 and 1.50 [43], in which, with a slight increase in severity, only SB hydrochar complies with the condition. It is also worth noting that FR may not definitively signify the combustibility due to the different functional groups present in VM and FC. This is supported by a study by Zhang et al. [46] reporting that oxygen-bearing groups (i.e., –OH/–COOH) exhibited higher spontaneity and reactivity than aliphatic and aromatic hydrocarbons (i.e., –CH3/–CH2–/C=C) during combustion.
3.3. Inorganic Composition of Solid Fuel
As depicted by the decreases in ash content yields (AC–Y) in Figure 8, HTC was validated to remove the ash-forming inorganic elements from the biomass matrix as SF increased. AC–Y was calculated by multiplying the AC ratio of hydrochar and raw biomass by MY. The AC–Y continuously decreased up to 46.9% (SB) and 21.8% (MA) at SF 6.63. Notably, the AC–Y of MA dropped immediately at a low SF of 4.08, indicating a raid release of inorganic elements due to the low thermal stability of the biomass, in contrast to SB, which experienced relatively gradual ash removal. In this regard, the inorganic elements can be extracted by co-devolatilization alongside the biomass tissues (VM-Y), as are common for magnesium (Mg), calcium (Ca), and phosphorous (P), because they are organically associated through [36] (1) precipitation within crystalline or amorphous structures and (2) metal ionic or covalent bonding. In another way, the inorganic elements can be more easily leached into the aqueous phase as ionic salts, 90% of which comprise potassium (K) and sodium (Na) in their nitrate and chloride forms.
Following the drops in AC at SF 4.08 from 7.5% (SB) and 5.4% (MA) to 6.0% and 2.4%, the ashes of both hydrochars tended to increase to a maximum of 7.6% and 4.6%, respectively (see Figure 7b). The increase in AC is generally attributed to the amplification of the inorganic proportion to the intense VM degradation [43]. On the other hand, a previous study by Atallah et al. [47] pointed out that the retention of metal elements on hydrochar during HTC can also contribute to the increase in AC, as depicted in Figure 10, due to (1) electrostatic attraction owing to temporarily induced dipoles, (2) growth of carboxyl and hydroxyl groups on the hydrochar surfaces, leading to metal readsorption by an increase in the cation exchange capacity, (3) blockage of the biomass surfaces by hydrolysis-derived products, reducing the extraction efficiency of low-soluble salts, and (4) co-reincorporation via oligomeric cross-linking, promoted by the divalent cations. This presence of ash may reduce heat release as a noncombustible portion to some extent [43], and its alkali metal content potentially induces undesirable fouling and slagging, resulting in low combustor efficiency and economic losses [36,48]. However, the overall AC of SB and MA hydrochars not exceeding 8% means that both hydrochars meet the maximum permissible ash of less than 15% for renewable solid fuels and are equivalent to low-ash coal, with ash ranging from 5–15% [9,49]. Concisely, the AC trends imply that HTC can address the ash issue in energy conversion, and the early stage of hydrolysis (SF = 4.08) is preferable over the prolongation of HTC severity for maximum ash extraction.
3.4. Heating Value and Its Correlation to Chemical Composition
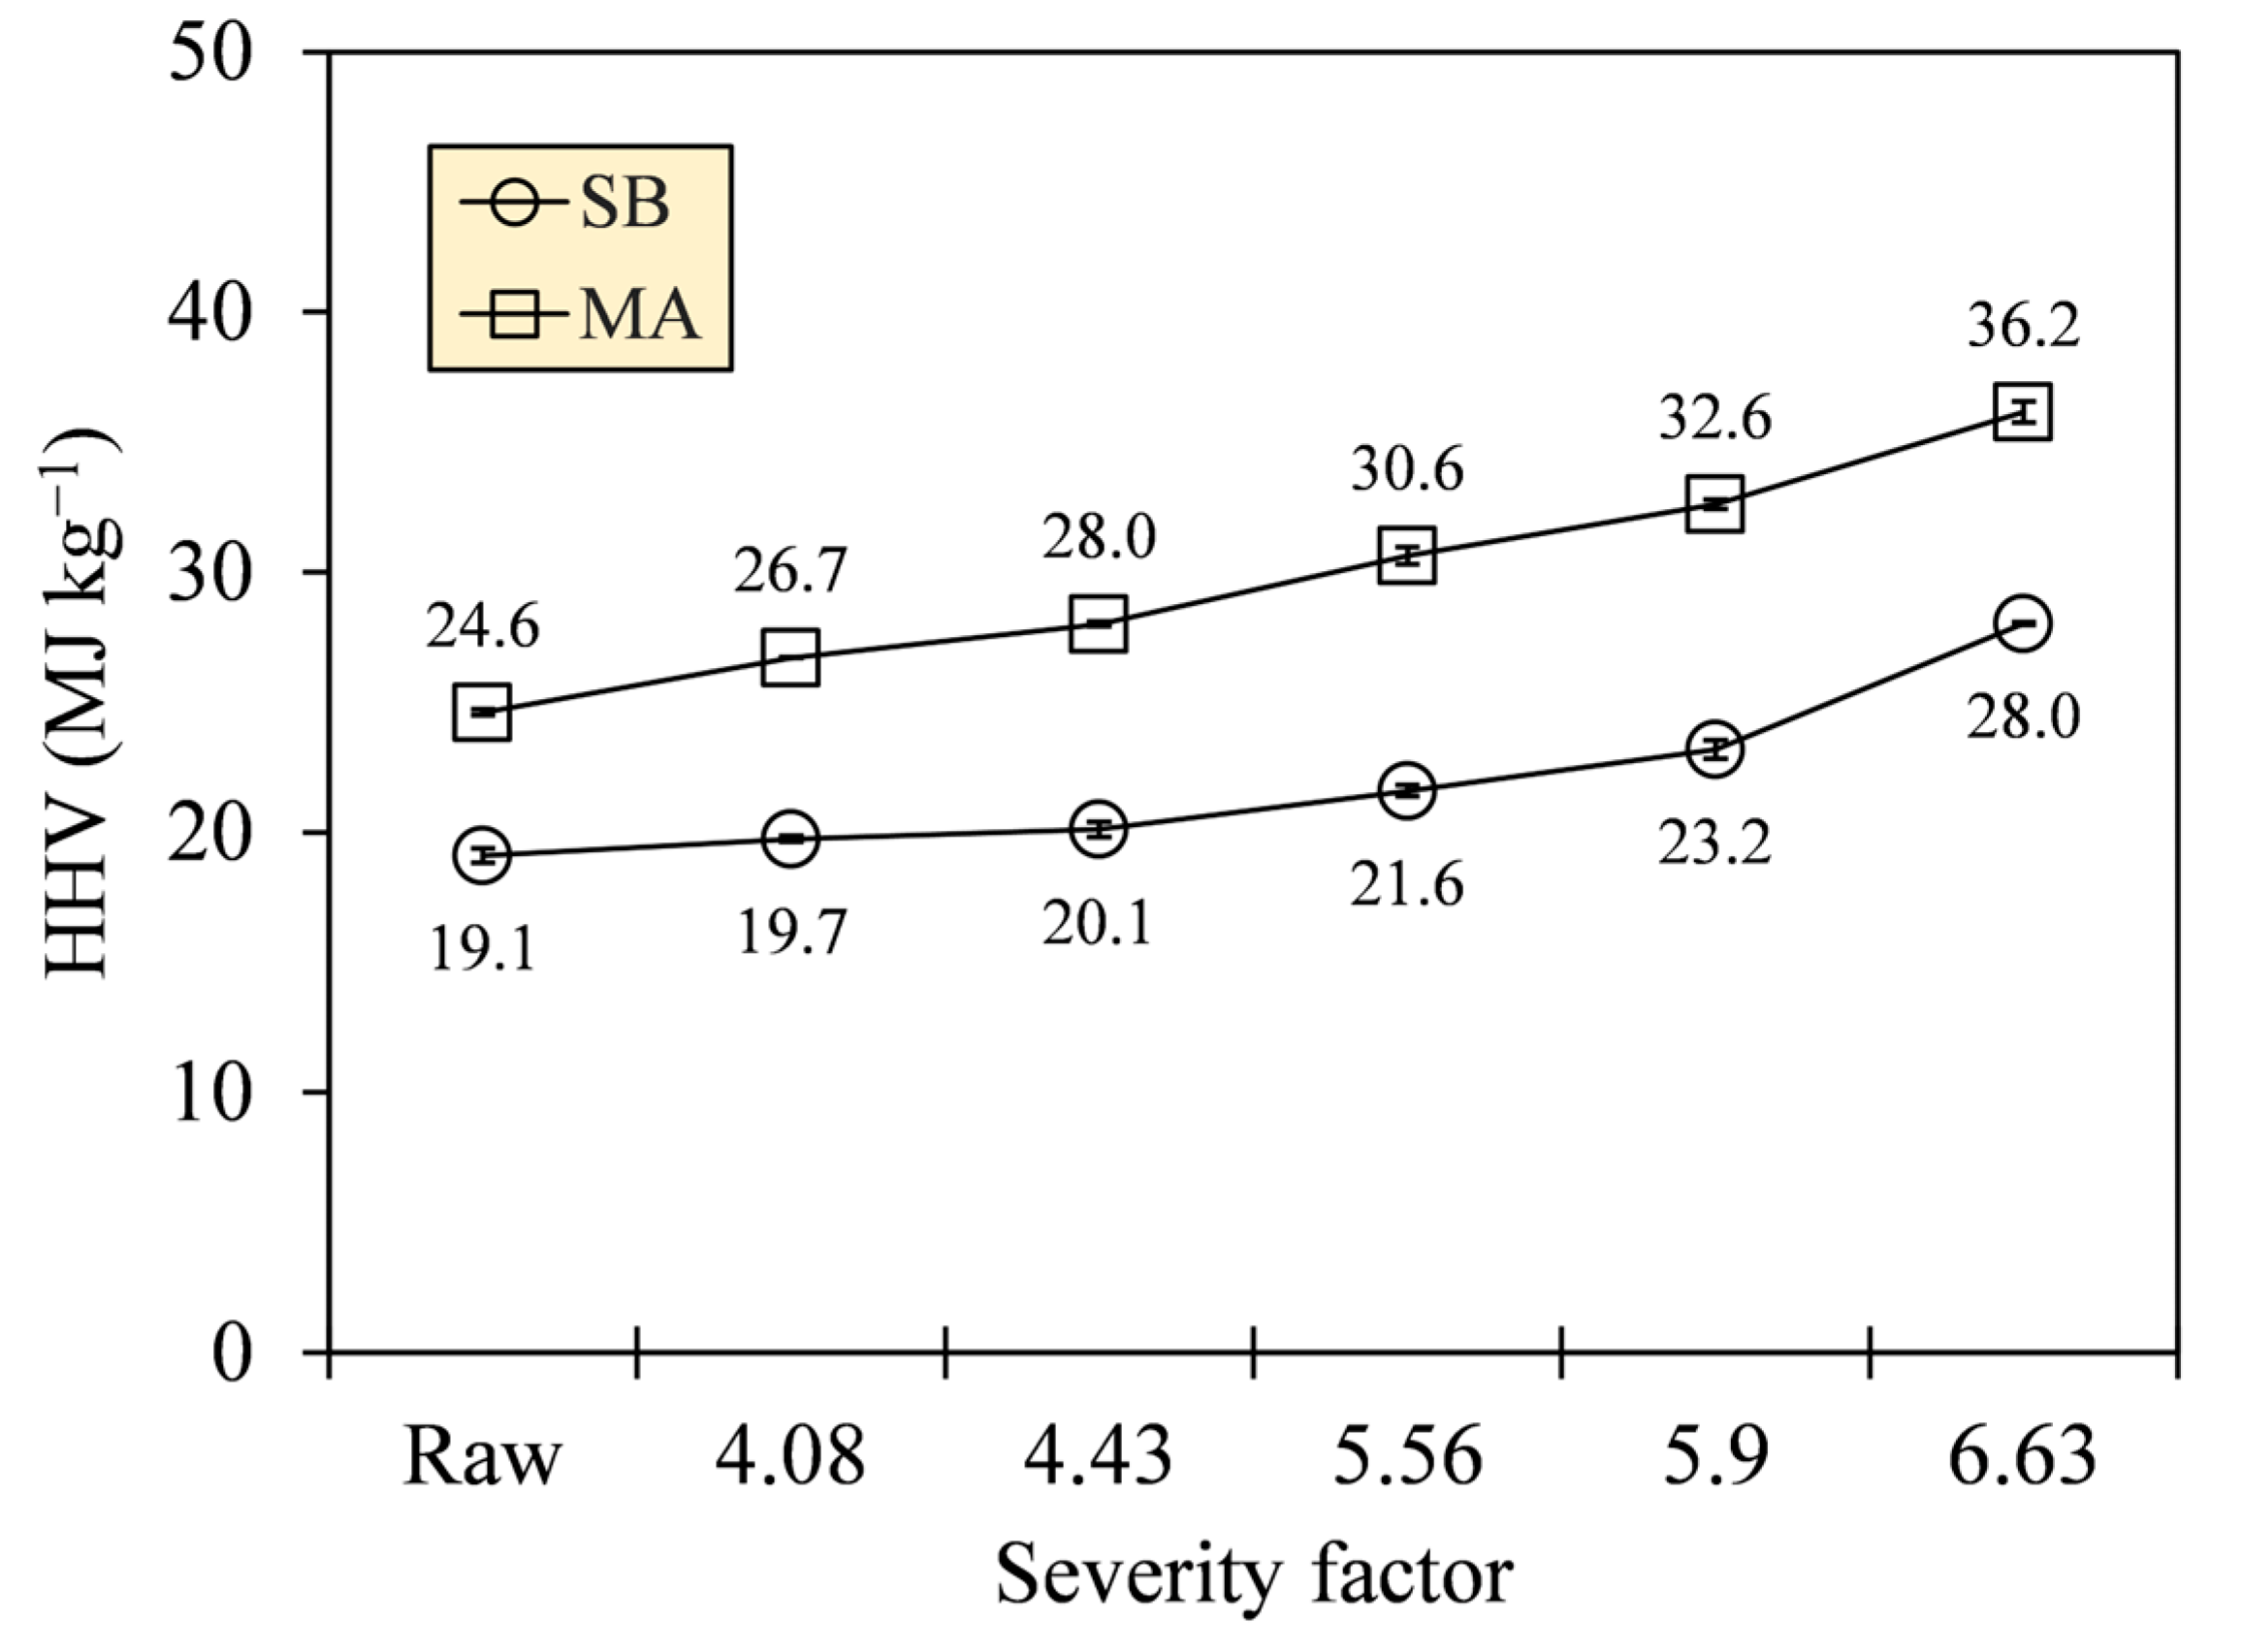
The improvement in carbonization quality was manifested in the increase in heat released by a unit mass of hydrochar produced. Figure 11 depicts an appreciable HHV generation with gross values reaching up to 28.0 (SB) and 36.2 MJ·kg−1 (MA) at the most severe HTC (SF = 6.63). These values indicate 46.7% and 46.9% increments relative to their raw states; interestingly, HTC did not alter the HHV deviations of the different biomass types.
The key factors that affect HHV were tested by Pearson correlation, which involved the proximate and ultimate composition. The correlation size (r) is interpreted into several categories following the conventional approach of Schober et al. [50], namely negligible (0.00–0.10), weak (0.10–0.40), moderate (0.40–0.70), strong (0.70–0.90), and very strong correlation (0.90–1.00). A confidence interval of 95% was calculated for the reference of significance flag (p) and correlation size interval (R) in the population (see Appendix A, Table A1). From Figure 12, the proximate composition varied in size, with some having insignificantly negligible and weak correlations to HHV (r = |0.04–0.32|; p = 0.20–0.88), except for FC and VM of SB (r = |0.97|; p = 0.00). The ultimate composition, meanwhile, was significantly correlated to HHV with strong to very strong categories (r = |0.76–0.99|; p = 0.00). Size values approaching 1 indicate a linear relationship exists between the two continuous parameters, while low p-values (<0.05) suggest the probability of size possibly occurring by chance more than 95% [51]. Furthermore, the correlation directions of some chemical compositions varied for different biomasses, except for C and O, which were directly (+) and inversely proportional (–) to HHV, respectively.
Observing the high correlation sizes and the same correlation directions for SB and MA, only C and O elements were identified to share common relationships to affect HHV in a positive and negative way, respectively. Therefore, a low oxidation state by reducing the O/C ratio is reasonably desired to produce hydrochars with higher heat release. The lower the oxidation state, the smaller the electronegativity of carbon-bonded atoms, and the higher the energy stored [52]. As a result, the HHV of MA biomass and its derived hydrochars was 5.5–9.4 MJ·kg−1 greater than that of SB in difference. The fluctuating correlation sizes and the nondirectional correlations of the proximate composition between SB and MA further clarify that HHV was not necessarily enhanced by high FC and low VM, as is a common notion, but rather, FC and VM possibly depended on the unexplained parameters, such as elemental constituents or chemical structures that compose them. In terms of chemical structures, the higher HHV can be partly attributed to the elongation and saturation of open-chain hydrocarbons, in contrast to the cyclization that has an implication on thermal stability [53,54]. The poor crystalline structures can also facilitate degradation upon combustion, improving heat release [55]. The presence of these structures is evident in our unpublished Py-GC/MS and XRD findings for SB and MA hydrochars [30]. Meanwhile, for AC, the adverse effects of the noncombustible portion did share common relationship with HHV, as indicated by the same correlation directions between SB and MA. However, the effect might be compensated by the high heat generation and low ash retention, making it less and positively correlated with HHV.
3.5. Fuel Applications Compared with Coal Standards
The ranking and usage of hydrochars were assessed by comparing the HHV, FR, and AC with those of coal standards, based on JIS M 1002:1978 [21], JCOAL [56], and Gianfrancesco [10] classifications (see Appendix A, Table A2 and Table A3). As shown in Table 3, only SB hydrochar at SF 6.63 meets the classification and corresponds to lignite F2, which potentially replaces steam coal B as a fuel for domestic power generation. Meanwhile, MA hydrochar falls into several classifications, including (1) lignite F2 at SFs 4.08 and 4.43, (2) sub-bituminous E at SFs 5.56 and 5.90, and (3) bituminous B2 at SF 6.63. MA hydrochars classified as lignite and sub-bituminous serve the same applications as the SB hydrochar at SF 6.63, and the ash of sub-bituminous MA hydrochar can also be utilized in cement manufacturing. Furthermore, besides being widely applicable to the other applications, the bituminous MA hydrochar is more attractive as coking coal A or C in iron and steel manufacturing, considering its low AC, regardless of its unknown caking properties.
4. Conclusions
SB and MA hydrochars were successfully prepared via HTC at different severities. The fuel properties of the hydrochars were assessed to further map their potential as alternatives to coal. The following conclusions are drawn from the obtained results:
- SB and MA biomasses processed via HTC undergo dehydration as O/C and H/C atomic ratios intensely decrease, in addition to the noticeable decarboxylation of MA in the presence of H/C spike at SF 6.63;
- HTC of MA prompts a phase transition to emulsion at SF 6.63, thereby limiting the development of MA to produce solids upon a higher HTC severity;
- SB hydrochar recovers more solids, as indicated by MYs in the ranges of 79.5–46.2% (SB) and 71.6–30.2% (MA), whereas MA hydrochar releases higher heat, as indicated by HHVs in the ranges of 26.7–36.2 MJ·kg−1 (MA) and 19.7–28.0 MJ·kg−1 (SB);
- The conflation of MY and HHV considers the HTC of SB to be more techno-commercially viable since it dissipates less original energy as SF progresses to 6.63 (EY = 82.1–67.8% (SB) and 77.7–44.3% (MA));
- Stable hydrocarbons or FC are formed 1.1–2.6 times more in SB hydrochars, compared with MA hydrochars, which develop 1.1–1.6 times more labile hydrocarbons or VM. Furthermore, the inorganic matter or AC of both hydrochars gradually increase to 1.3 (SB) and 1.9 times (MA) greater than the AC after the immediate drops at SF 4.08;
- The conflation of FC and VM assumes that SB hydrochar at SF 6.63 exhibits more stable combustion and more decent ignition than MA hydrochars, as indicated by FR of 0.83, approaching the balanced FR of 0.9–1.5;
- The Pearson correlation reveals that FC, VM, and AC depend on the constituents C and O and other unexplained compensating parameters in affecting HHVs.
- SB hydrochar (SF = 6.63) potentially replaces steam coal, whereas MA hydrochar is widely attractive to utilize as both steam (SFs = 4.08–5.90) and coking coal (SF = 6.63).
Author Contributions
Conceptualization, N.L. and K.T.; methodology, N.L.; software, N.L. and K.T.; validation, N.L., T.F. and K.T.; formal analysis, N.L.; investigation, N.L.; resources, K.T.; data curation, N.L.; writing—original draft preparation, N.L.; writing—review and editing, K.T.; visualization, N.L.; supervision, T.F., X.W. and K.T.; project administration, K.T.; funding acquisition, K.T. All authors have read and agreed to the published version of the manuscript.
Funding
This research was funded by the Japan Society for the Promotion of Science (JSPS) under the Grants-in-Aid for Scientific Research (KAKENHI) program, grant number JP22K05905.
Data Availability Statement
All data used are referenced and are available within the manuscript and Appendix A.
Conflicts of Interest
The authors declare no conflicts of interest.
Appendix A
Figure A1.
Scanning electron microscopy (SEM) at 4000× magnification (10 μm scale) of (a) SB and (b) MA biomasses (left) and their representative hydrochars at SF 5.90 (right).
Figure A1.
Scanning electron microscopy (SEM) at 4000× magnification (10 μm scale) of (a) SB and (b) MA biomasses (left) and their representative hydrochars at SF 5.90 (right).


Table A1.
Correlation size interval and their significance flags.
| Parameter | p-Value | R-Value (95% Confidence Interval) | ||||
|---|---|---|---|---|---|---|
| SB | MA | |||||
| SB | MA | Lower | Upper | Lower | Upper | |
| HHV–FC | 0.00 * | 0.68 | 0.92 | 0.99 | −0.55 | 0.38 |
| HHV–VM | 0.00 * | 0.78 | −0.99 | −0.91 | −0.41 | 0.52 |
| HHV–AC | 0.20 | 0.88 | −0.18 | 0.68 | −0.44 | 0.50 |
| HHV–C | 0.00 * | 0.00 * | 0.97 | 1.00 | 0.98 | 1.00 |
| HHV–H | 0.00 * | 0.00 * | −0.99 | −0.91 | 0.46 | 0.91 |
| HHV–O | 0.00 * | 0.00 * | −1.00 | −0.99 | −0.99 | −0.95 |
| HHV–N | 0.00 * | 0.00 * | 0.84 | 0.98 | −0.99 | −0.91 |
* Shows statistical significance at p-value < 0.05 (confidence level of 95%).
Table A2.
Coal classification by utilization as steam and coking coal. Adapted from [56].
Table A2.
Coal classification by utilization as steam and coking coal. Adapted from [56].
| Classification 1 | AC (%) | |||
|---|---|---|---|---|
| Utilization | Type | Ranking | Caking Property | |
| Coking coal | A | Bituminous | Strong caking | <8.0 |
| B | >8.0 | |||
| C | Other for coke | <8.0 | ||
| D | >8.0 | |||
| Steam coal | A | Bituminous | Other for steam | >8.0 |
| B | Lignite and sub-bituminous | <8.0 | ||
| C | >8.0 | |||
1 Classification is valid for coal with volatile matter (VM) > 14%.
| Classification | HHV (MJ·kg−1) | FR | Application | |
|---|---|---|---|---|
| Ranking | Type | |||
| Anthracite | A1 | Indistinctive | >4.0 | (1) Domestic/industrial including smokeless fuel |
| A2 | Indistinctive | >4.0 | ||
| Bituminous | B1 | >35.16 | >1.5 | (1) Manufacture of iron and steel (coking coal) |
| B2 | >35.16 | <1.5 | (2) Power generation (steam coal) | |
| C | 33.91–35.16 | Indistinctive | (3) Cement manufacture, industrial uses, and so on (steam coal) | |
| Sub-bituminous | D | 32.65–33.91 | Indistinctive | (1) Power generation (steam coal) |
| E | 30.56–32.65 | Indistinctive | (2) Cement manufacture, industrial uses, and so on (steam coal) | |
| Lignite | F1 | 29.47–30.56 | Indistinctive | (1) Largely domestic power generation (steam coal) |
| F2 | 24.28–29.47 | Indistinctive | ||
References
- Shen, Y. A review on hydrothermal carbonization of biomass and plastic waste to energy products. Biomass Bioenergy 2020, 134, 105479. [Google Scholar] [CrossRef]
- Kannan, S.; Gariepy, Y.; Raghavan, G.S.V. Optimization and characterization of hydrochar produced from microwave hydrothermal carbonization of fish waste. Waste Manag. 2017, 65, 159–168. [Google Scholar] [CrossRef] [PubMed]
- Boutaieb, M.; Guiza, M.; Roman, S.; Cano, B.L.; Nogales, S.; Ouderni, A. Hydrothermal carbonization as a preliminary step to pine cone pyrolysis for bioenergy production. Comptes Rendus Chim. 2020, 23, 607–621. [Google Scholar] [CrossRef]
- Wang, T.; Zhai, Y.; Zhu, Y.; Li, C.; Zeng, G. A review of hydrothermal carbonization of biomass waste for hydrochar formation: Process conditions, fundamentals, and physicochemical properties. Renew. Sustain. Energy Rev. 2018, 90, 223–247. [Google Scholar] [CrossRef]
- Kambo, H.S.; Dutta, A. A comparative review of biochar and hydrochar in terms of production, physico-chemical properties and applications. Renew. Sustain. Energy Rev. 2015, 45, 359–378. [Google Scholar] [CrossRef]
- Nzediegwu, C.; Naeth, M.A.; Chang, S.X. Carbonization temperature and feedstock type interactively affect chemical, fuel, and surface properties of hydrochars. Bioresour. Technol. 2021, 330, 124976. [Google Scholar] [CrossRef]
- Li, J.; Zhu, X.; Li, Y.; Tong, Y.W.; Ok, Y.S.; Wang, X. Multi-task prediction and optimization of hydrochar properties from high-moisture municipal solid waste: Application of machine learning on waste-to-resource. J. Clean. Prod. 2021, 278, 123928. [Google Scholar] [CrossRef]
- Wilk, M.; Magdziarz, A.; Jayaraman, K.; Chargot, M.S.; Gokalp, I. Hydrothermal carbonization characteristics of sewage sludge and lignocellulosic biomass. A comparative study. Biomass Bioenergy 2019, 120, 166–175. [Google Scholar] [CrossRef]
- Lee, J.; Lee, K.; Sohn, D.; Kim, Y.M.; Park, K.Y. Hydrothermal carbonization of lipid extracted algae for hydrochar production and feasibility of using hydrochar as a solid fuel. Energy 2018, 153, 913–920. [Google Scholar] [CrossRef]
- Gianfrancesco, D.A. 13–Worldwide overview and trend for clean and efficient use of coal. In Materials for Ultra-Supercritical and Advance Ultra-Supercritical Power Plants; Gianfrancesco, A.D., Ed.; Woodhead Publishing: Duxford, UK, 2017; pp. 643–687. [Google Scholar]
- Nanda, S.; Rana, R.; Sarangi, P.K.; Dalai, A.K.; Kozinski, J.A. A broad introduction to first-, second-, and third-generation biofuels. In Recent Advancements in Biofuels and Bioenergy Utilization; Sarangi, P., Nanda, S., Mohanty, P., Eds.; Springer: Singapore, 2018; pp. 1–25. [Google Scholar]
- Arif, A.B.; Budiyanto, A.; Diyono, W.; Hayuningtyas, M.; Marwati, T.; Sasmitaloka, K.S.; Richana, N. Bioethanol production from sweet sorghum bagasse through enzymatic process. IOP Conf. Ser. Earth Env. Environ. Sci. 2019, 309, 012033. [Google Scholar] [CrossRef]
- Wahyono, T.; Firsoni, F. The changes of nutrient composition and in vitro evaluation on gamma irradiated sweet sorghum bagasse. A Sci. J. Appl. Isot. Radiat. 2016, 12, 69–77. [Google Scholar] [CrossRef]
- Cabrita, A.R.J.; Fernandes, J.G.; Valente, I.M.; Almeida, A.; Lima, S.A.C.; Fonseca, A.J.M.; Maia, M.R.G. Nutritional composition and untargeted metabolomics reveal the potential of Tetradesmus obliquus, Chlorella vulgaris and Nannochloropsis oceanica as valuable nutrient sources for dogs. Animals 2022, 12, 2643. [Google Scholar] [CrossRef] [PubMed]
- Coelho, D.; Pestana, J.; Almeida, J.M.; Alfaia, C.M.; Fontes, C.M.G.A.; Moreira, O.; Prates, J.A.M. A high dietary incorporation level of Chlorella vulgaris improves the nutritional value of pork fat without impairing the performance of finishing pigs. Animals 2020, 10, 2384. [Google Scholar] [CrossRef]
- Sutiawan, J.; Hartono, R.; Hermawan, D.; Hadi, Y.S.; Nawawi, D.S.; Abdillah, I.B.; Syahfitri, A.; Kusumah, S.S.; Adi, D.S.; Kusumaningrum, W.B.; et al. Properties of table tennis blade from sorghum bagasse particleboard bonded with maleic acid adhesive at different pressing temperatures and times. Polymers 2023, 15, 166. [Google Scholar] [CrossRef]
- Safi, C.; Zebib, B.; Merah, O.; Pontalier, P.Y.; Garcia, C.V. Morphology, composition, production, processing and applications of Chlorella vulgaris: A review. Renew. Sustain. Energy Rev. 2014, 35, 265–278. [Google Scholar] [CrossRef]
- Hossain, M.S.; Islam, M.N.; Rahman, M.M.; Mostofa, M.G.; Khan, M.A.R. Sorghum: A prospective crop for climatic vulnerability, food and nutritional security. J. Agric. Food Res. 2022, 8, 100300. [Google Scholar] [CrossRef]
- Changi, S.M.; Faeth, J.L.; Mo, N.; Savage, P.E. Hydrothermal reactions of biomolecules relevant for microalgae liquefaction. Ind. Eng. Chem. Res. 2015, 54, 11733–11758. [Google Scholar] [CrossRef]
- Lange, I. Steam versus coking coal and the acid rain program. Energy Policy 2010, 38, 1251–1254. [Google Scholar] [CrossRef]
- JIS M 1002:1978; Calculation of Coal Reserves. Japanese Standards Association: Tokyo, Japan, 2016. Available online: https://webdesk.jsa.or.jp/books/W11M0090 (accessed on 4 September 2023).
- Shui, H.; Zhao, W.; Shan, C.; Shui, T.; Pan, C.; Wang, Z.; Lei, Z.; Ren, S.; Kang, S. Caking and coking properties of the thermal dissolution soluble fraction of a fat coal. Fuel Process Technol. 2014, 118, 64–68. [Google Scholar] [CrossRef]
- Luthfi, N.; Fukushima, T.; Wang, X.; Takisawa, K. Significance and optimization of operating parameters in hydrothermal carbonization using RSM–CCD. Thermo 2024, 4, 82–99. [Google Scholar] [CrossRef]
- Jeder, A.; Sanchez, A.S.; Gadonneix, P.; Masson, E.; Quederni, A.; Celzard, A.; Fierro, V. The severity factor as a useful tool for producing hydrochars and derive carbon materials. Env. Environ. Sci. Pollut. Res. 2018, 25, 1497–1507. [Google Scholar] [CrossRef]
- Overend, R.P.; Chornet, E. Fractionation of lignocellulosic by steam-aqueous pretreatments. Philos. Trans. R. Soc. Lond. A 1987, 321, 523–536. [Google Scholar]
- Czajka, K.M. Proximate analysis of coal by micro-TG method. J. Anal. Appl. Pyrolysis 2018, 133, 89–90. [Google Scholar] [CrossRef]
- ASTM D 1762-84; Standard Test Method for Chemical Analysis of Wood Charcoal. ASTM International: West Conshohocken, PA, USA, 2007. Available online: https://www.astm.org/d1762-84r07.html (accessed on 22 September 2022).
- Zhang, J.; Wang, C.; Jia, X.; Wang, P.; Che, D. Experimental study on combustion and NO formation characteristics of semi-coke. Fuel 2019, 258, 116108. [Google Scholar] [CrossRef]
- Moller, M.; Nilges, P.; Harnisch, F.; Schroder, U. Subcritical water as reaction environment: Fundamentals of hydrothermal biomass transformation. ChemSusChem 2011, 4, 566–579. [Google Scholar] [CrossRef]
- Luthfi, N.; Fukushima, T.; Takisawa, K. A comparative study of solid fuels from lignocellulosic and non-lignocellulosic biomass via hydrothermal carbonization. Doctoral Dissertation, Mie University, Tsu, Japan, 2024. To be submitted. [Google Scholar]
- Xiao, K.; Liu, H.; Li, Y.; Yi, L.; Zhang, X.; Hu, H.; Yao, H. Correlations between hydrochar properties and chemical constitution of orange peel waste during hydrothermal carbonization. Bioresour. Technol. 2018, 265, 432–436. [Google Scholar] [CrossRef] [PubMed]
- Li, Y.; Liu, H.; Xiao, K.; Liu, X.; Hu, H.; Li, X.; Yao, H. Correlations between the physicochemical properties of hydrochar and specific components of waste lettuce: Influence of moisture, carbohydrates, proteins, and lipids. Bioresour. Technol. 2019, 272, 482–488. [Google Scholar] [CrossRef] [PubMed]
- Prabir, B. Biomass Gasification, Pyrolysis and Torrefaction, 2nd ed.; Academic Press: London, UK, 2013. [Google Scholar]
- Dirgantara, M.; Karelius; Cahyana, B.T.; Suastika, K.G.; Akbar, A.R.M. Effect of temperature and residence time torrefaction palm kernel shell on the calorific value and energy yield. J. Phys. Conf. Ser. 2020, 1428, 012010. [Google Scholar] [CrossRef]
- Saha, S.; Islam, M.T.; Calhoun, J.; Reza, T. Effect of hydrothermal carbonization on fuel and combustion properties of shrimp shell waste. Energies 2023, 16, 5534. [Google Scholar] [CrossRef]
- Smith, A.M.; Singh, S.; Ross, A.B. Fate of inorganic material during hydrothermal carbonisation of biomass: Influence of feedstock on combustion behaviour of hydrochar. Fuel 2016, 169, 135–145. [Google Scholar] [CrossRef]
- Zhuang, X.; Huang, Y.; Song, Y.; Zhan, H.; Yin, X.; Wu, C. The transformation pathways of nitrogen in sewage sludge during hydrothermal treatment. Bioresour. Technol. 2017, 245, 463–470. [Google Scholar] [CrossRef]
- Leng, L.; Yang, L.; Leng, S.; Zhang, W.; Zhou, Y.; Peng, H.; Li, H.; Hu, Y.; Jiang, S.; Li, H. A review on nitrogen transformation in hydrochar during hydrothermal carbonization of biomass containing nitrogen. Sci. Total Env. Environ. 2021, 756, 143679. [Google Scholar] [CrossRef]
- Gai, C.; Zhang, Y.; Chen, W.T.; Zhang, P.; Dong, Y. An investigation of reaction pathways of hydrothermal liquefaction using Chlorella pyrenoidosa and Spirulina platensis. Energy Convers. Manag. 2015, 96, 330–339. [Google Scholar] [CrossRef]
- Jain, A.; Balasubramanian, R.; Srinivasan, M.P. Hydrothermal conversion of biomass waste to activated carbon with high porosity: A review. Chem. Eng. J. 2016, 283, 789–805. [Google Scholar] [CrossRef]
- Zhuang, X.; Zhan, H.; Song, Y.; He, C.; Huang, Y.; Yin, X.; Wu, C. Insights into the evolution of chemical structures in lignocellulose and non-lignocellulose biowastes during hydrothermal carbonization (HTC). Fuel 2019, 236, 960–974. [Google Scholar] [CrossRef]
- Barreiro, D.L.; Beck, M.; Hornung, U.; Ronsse, F.; Kruse, A.; Prins, W. Suitability of hydrothermal liquefaction as a conversion route to produce biofuels from macroalgae. Algal Res. 2015, 11, 234–241. [Google Scholar] [CrossRef]
- Song, E.; Kim, H.; Kim, K.W.; Yoon, Y.M. Characteristic evaluation of different carbonization process for hydrochar, torrefied char, and biochar produced from cattle manure. Energies 2023, 16, 3265. [Google Scholar] [CrossRef]
- Miao, M.; Deng, B.; Kong, H.; Yang, H.; Lyu, J.; Jiang, X.; Zhang, M. Effects of volatile matter and oxygen concentration on combustion characteristics of coal in an oxygen-enriched fluidized bed. Energy 2021, 220, 119778. [Google Scholar] [CrossRef]
- Michaletz, S.T.; Johnson, E.A. How forest fires kill trees: A review of the fundamental biophysical processes. Scand. J. For. Res. 2007, 22, 500–515. [Google Scholar] [CrossRef]
- Zhang, Y.; Zhang, J.; Li, Y.; Gao, S.; Yang, C.; Shi, X. Oxidation characteristics of functional groups in relation to coal spontaneous combustion. ACS Omega 2021, 6, 7669–7679. [Google Scholar] [CrossRef]
- Atallah, E.; Zeaiter, J.; Ahmad, M.N.; Kwapinska, M.; Leahy, J.J.; Kwapinski, W. The effect of temperature, residence time, and water-sludge ratio on hydrothermal carbonization of DAF dairy sludge. J. Environ. Chem. Eng. 2020, 8, 103599. [Google Scholar] [CrossRef]
- Reza, M.T.; Lynam, J.G.; Uddin, M.H.; Coronella, C.J. Hydrothermal carbonization: Fate of inorganics. Biomass Bioenergy 2013, 49, 86–94. [Google Scholar] [CrossRef]
- Evans, L.; Harrison, P.; Lawrence, J.; Casell, J.; Thiemann, D.; Kim, J. Coal Ash Primer; Earthjustice: San Francisco, CA, USA, 2023. [Google Scholar]
- Schober, P.; Boer, C.; Schwarte, L. Correlation coefficients: Appropriate use and interpretation. Anesth. Analg. 2018, 126, 1763–1768. [Google Scholar] [CrossRef] [PubMed]
- Akoglu, H. User’s guide to correlation coefficients. Turk. J. Emerg. Med. 2018, 18, 91–93. [Google Scholar] [CrossRef] [PubMed]
- Toscano, G.; Riva, G.; Pedretti, E.F.; Duca, D. Effect of the carbon oxidation state of biomass compounds on the relationship between GCV and carbon content. Biomass Bioenergy 2013, 48, 231–238. [Google Scholar] [CrossRef]
- Sarikoc, S. Fuels of the diesel-gasoline engines and their properties. In Diesel and Gasoline Engines; Viskup, R., Ed.; IntechOpen: London, UK, 2020. [Google Scholar]
- Demirbas, A.; Al-Ghamdi, K. Relationships between specific gravities and higher heating values of petroleum components. Pet. Sci. Technol. 2015, 33, 732–740. [Google Scholar] [CrossRef]
- Gong, C.; Huang, J.; Feng, C.; Wang, G.; Tabil, L.; Wang, D. Effects and mechanism of ball milling on torrefaction of pine sawdust. Bioresour. Technol. 2016, 214, 242–247. [Google Scholar] [CrossRef]
- JCOAL. Clean Coal Technologies in Japan; Japan Coal Energy Center (JCOAL): Tokyo, Japan, 2007. [Google Scholar]
Figure 1.
Dried (a) sorghum bagasse (SB) and (b) microalgae (MA) samples after homogenization.

Figure 2.
Hydrochar synthesis: (a) mixing of biomass and water; (b) thermal induction; (c) slurry filtration; (d) residual solids and aqueous phase of SB (top) and MA (bottom); and (e) ground SB and MA biomasses and hydrochars, with severity factor (SF) increasing from right to left.
Figure 2.
Hydrochar synthesis: (a) mixing of biomass and water; (b) thermal induction; (c) slurry filtration; (d) residual solids and aqueous phase of SB (top) and MA (bottom); and (e) ground SB and MA biomasses and hydrochars, with severity factor (SF) increasing from right to left.

Figure 3.
Two-step heating method of representative (a) SB and (b) MA hydrochars at SF 5.56.

Figure 4.
Mass yields (MYs) of SB and MA hydrochars, with insets showing a phase transition of MA hydrochars between SFs 5.90 and 6.63.
Figure 4.
Mass yields (MYs) of SB and MA hydrochars, with insets showing a phase transition of MA hydrochars between SFs 5.90 and 6.63.

Figure 5.
Energy yields (EY) of SB and MA hydrochars by integrating MY and HHV.

Figure 6.
Van Krevelen diagrams of SB and MA biomasses and their hydrochars, with dashed lines showing reaction tendencies.
Figure 6.
Van Krevelen diagrams of SB and MA biomasses and their hydrochars, with dashed lines showing reaction tendencies.

Figure 7.
(a) Ultimate and (b) proximate composition of SB and MA biomasses and their hydrochars.

Figure 8.
Proximate yields of SB and MA biomasses and their hydrochars.

Figure 9.
Fuel ratios (FR) of SB and MA biomasses and their hydrochars.

Figure 10.
Retention mechanism of inorganic matter during HTC.

Figure 11.
Higher heating values (HHVs) of SB and MA biomasses and their hydrochars.

Figure 12.
Relationship between HHV and proximate–ultimate composition, tested using Pearson correlation.
Figure 12.
Relationship between HHV and proximate–ultimate composition, tested using Pearson correlation.

Table 1.
Experimental design labeled with severity factor (SF).
| Temperature (°C) | - | 175 | 175 | 225 | 225 | 250 |
| Residence Time (h) | - | 1.25 | 1.25 | 2.75 | 2.75 | 2.75 |
| SF | Raw | 4.08 | 4.43 | 5.56 | 5.90 | 6.63 |
Table 2.
Ratio values of H/C and O/C from Van Krevelen diagram at varying SFs.
| Sample | Atomic Ratio | Ratio Value | |||||
|---|---|---|---|---|---|---|---|
| Raw | SF 4.08 | SF 4.43 | SF 5.56 | SF 5.90 | SF 6.63 | ||
| SB | H/C | 1.75 | 1.66 | 1.59 | 1.43 | 1.31 | 1.06 |
| O/C | 0.78 | 0.73 | 0.67 | 0.57 | 0.49 | 0.28 | |
| MA | H/C | 1.74 | 1.69 | 1.62 | 1.51 | 1.35 | 1.42 |
| O/C | 0.46 | 0.40 | 0.35 | 0.26 | 0.19 | 0.14 | |
Table 3.
Matching matrix of SB and MA hydrochars to coal ranking and utilization.
| Classification | SB Hydrochar | MA Hydrochar | |||||||||
|---|---|---|---|---|---|---|---|---|---|---|---|
| Ranking | Type | SF 4.08 | SF 4.43 | SF 5.56 | SF 5.90 | SF 6.63 | SF 4.08 | SF 4.43 | SF 5.56 | SF 5.90 | SF 6.63 |
| Anthracite | A1 | ||||||||||
| A2 | |||||||||||
| Bituminous | B1 | ||||||||||
| B2 | CCA/C | ||||||||||
| C | |||||||||||
| Sub-bituminous | D | ||||||||||
| E | SCB | SCB | |||||||||
| Lignite | F1 | ||||||||||
| F2 | SCB 1 | SCB | SCB | ||||||||
1 SC and CC stand for steam and coking coal, respectively, with the subscripts indicating their utilization types.
Disclaimer/Publisher’s Note: The statements, opinions and data contained in all publications are solely those of the individual author(s) and contributor(s) and not of MDPI and/or the editor(s). MDPI and/or the editor(s) disclaim responsibility for any injury to people or property resulting from any ideas, methods, instructions or products referred to in the content. |
© 2024 by the authors. Licensee MDPI, Basel, Switzerland. This article is an open access article distributed under the terms and conditions of the Creative Commons Attribution (CC BY) license (https://creativecommons.org/licenses/by/4.0/).
Share and Cite
MDPI and ACS Style
Luthfi, N.; Fukushima, T.; Wang, X.; Takisawa, K. Hydrochar as an Alternative to Coal: A Comparative Study of Lignocellulosic and Nonlignocellulosic Biomass. Resources 2024, 13, 49. https://doi.org/10.3390/resources13040049
AMA Style
Luthfi N, Fukushima T, Wang X, Takisawa K. Hydrochar as an Alternative to Coal: A Comparative Study of Lignocellulosic and Nonlignocellulosic Biomass. Resources. 2024; 13(4):49. https://doi.org/10.3390/resources13040049
Chicago/Turabian StyleLuthfi, Numan, Takashi Fukushima, Xiulun Wang, and Kenji Takisawa. 2024. "Hydrochar as an Alternative to Coal: A Comparative Study of Lignocellulosic and Nonlignocellulosic Biomass" Resources 13, no. 4: 49. https://doi.org/10.3390/resources13040049
Note that from the first issue of 2016, this journal uses article numbers instead of page numbers. See further details here.