Plasticity in Standard and Maximum Aerobic Metabolic Rates in Two Populations of an Estuarine Dependent Teleost, Spotted Seatrout (Cynoscion nebulosus)


Abstract
1. Introduction
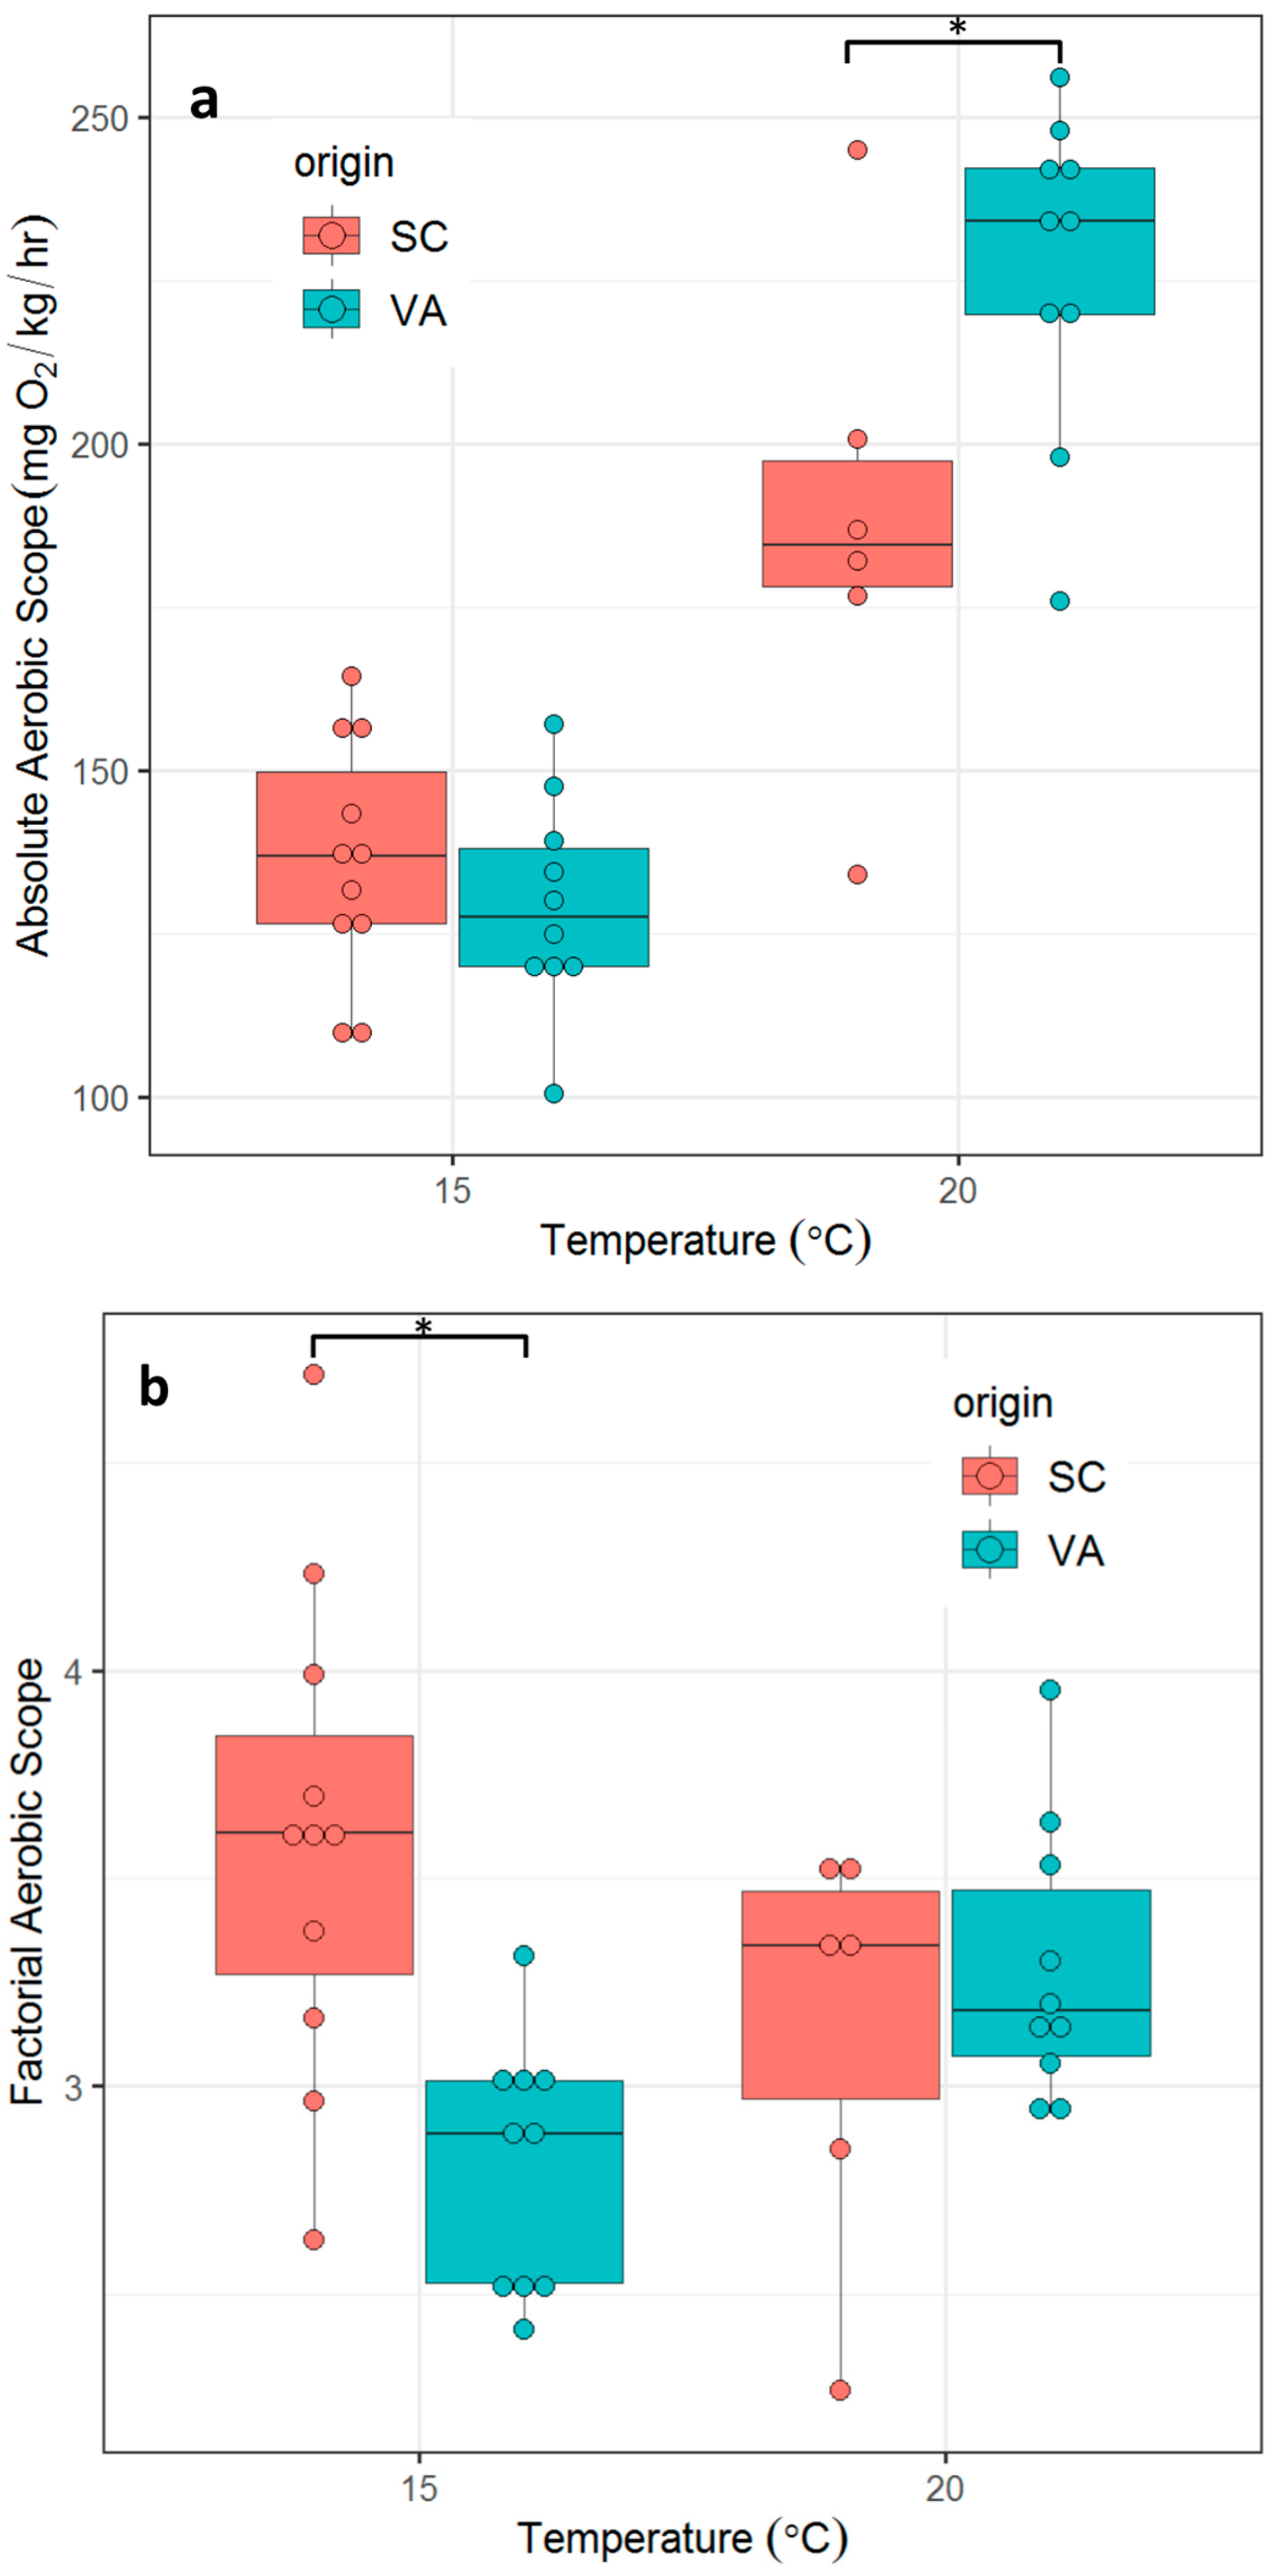
- There are no significant differences in metabolic phenotypes across a range of ecologically-relevant temperatures between the two populations as measured by SMR, MMR, factorial aerobic scope (FAS) or absolute aerobic scope (AAS) (defined as MMR/SMR and MMR-SMR, respectively);
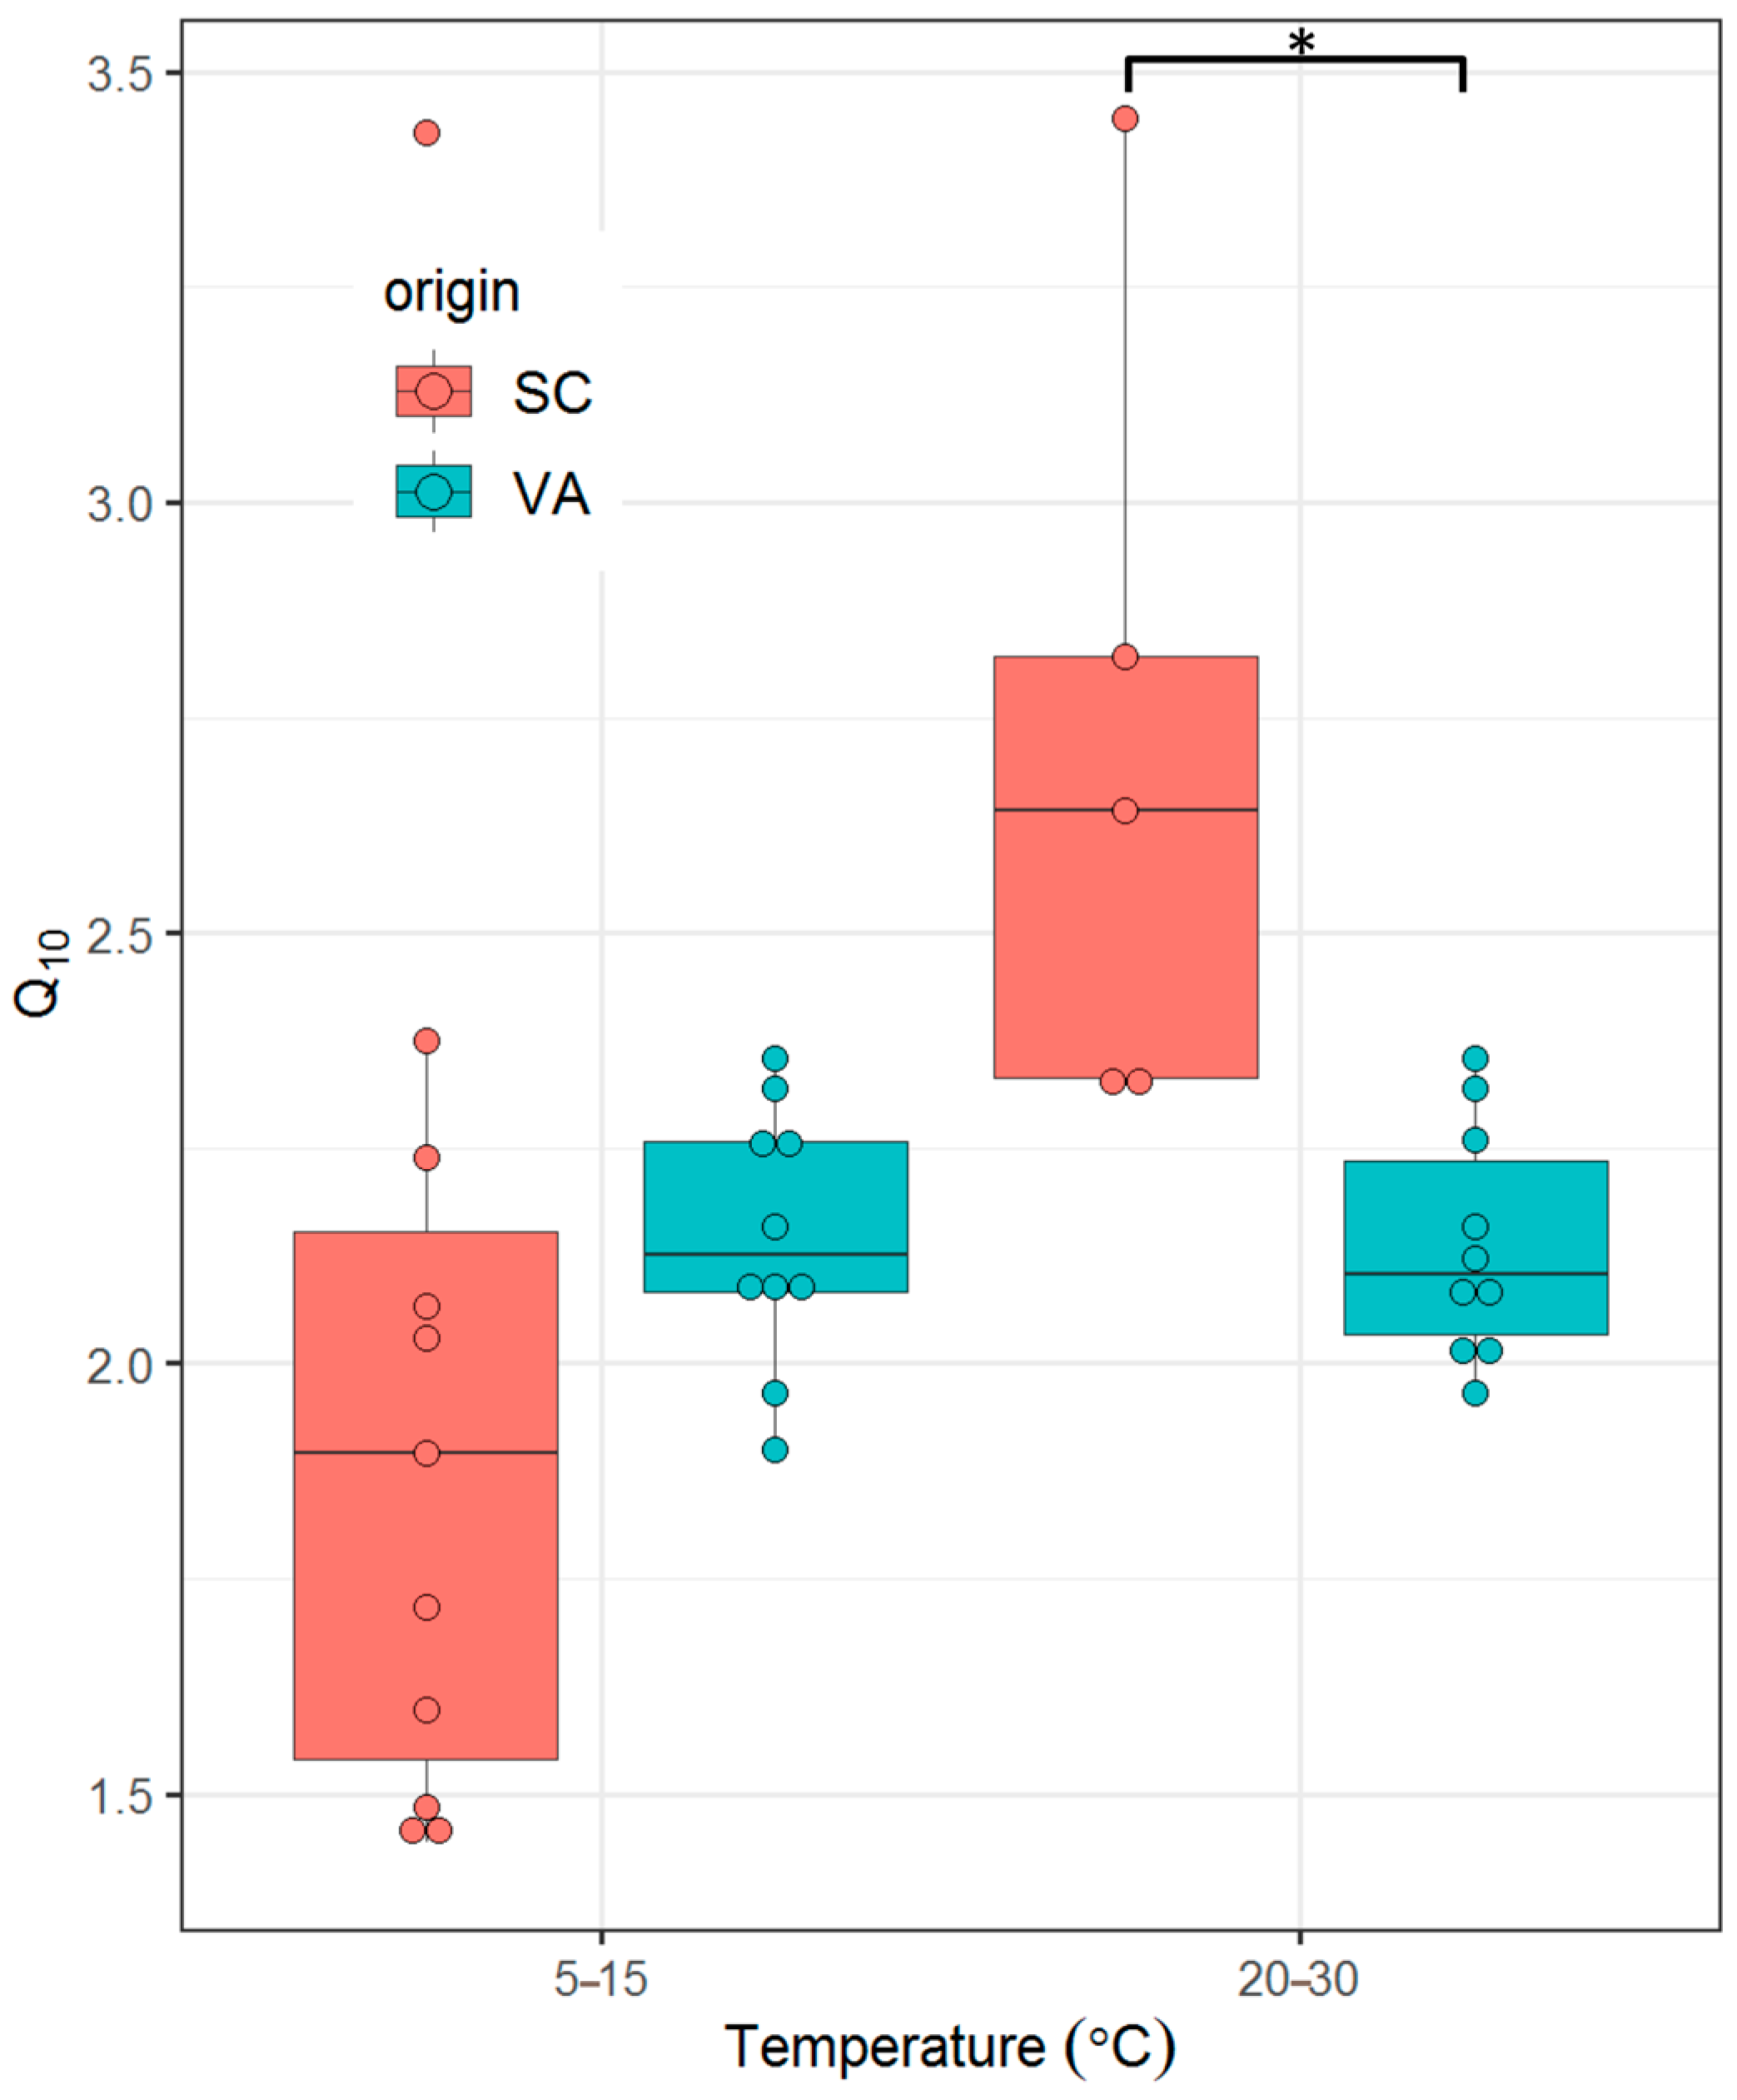
- There is no significant difference in thermal sensitivity of SMR (quantified as Q10 values) between the two populations across a range of ecologically relevant temperatures.
2. Materials and Methods
2.1. Animal Collection and Husbandry
2.2. Experimental Procedures
2.3. Correcting for Body Weight
2.4. Data Analysis and Statistical Procedures
3. Results
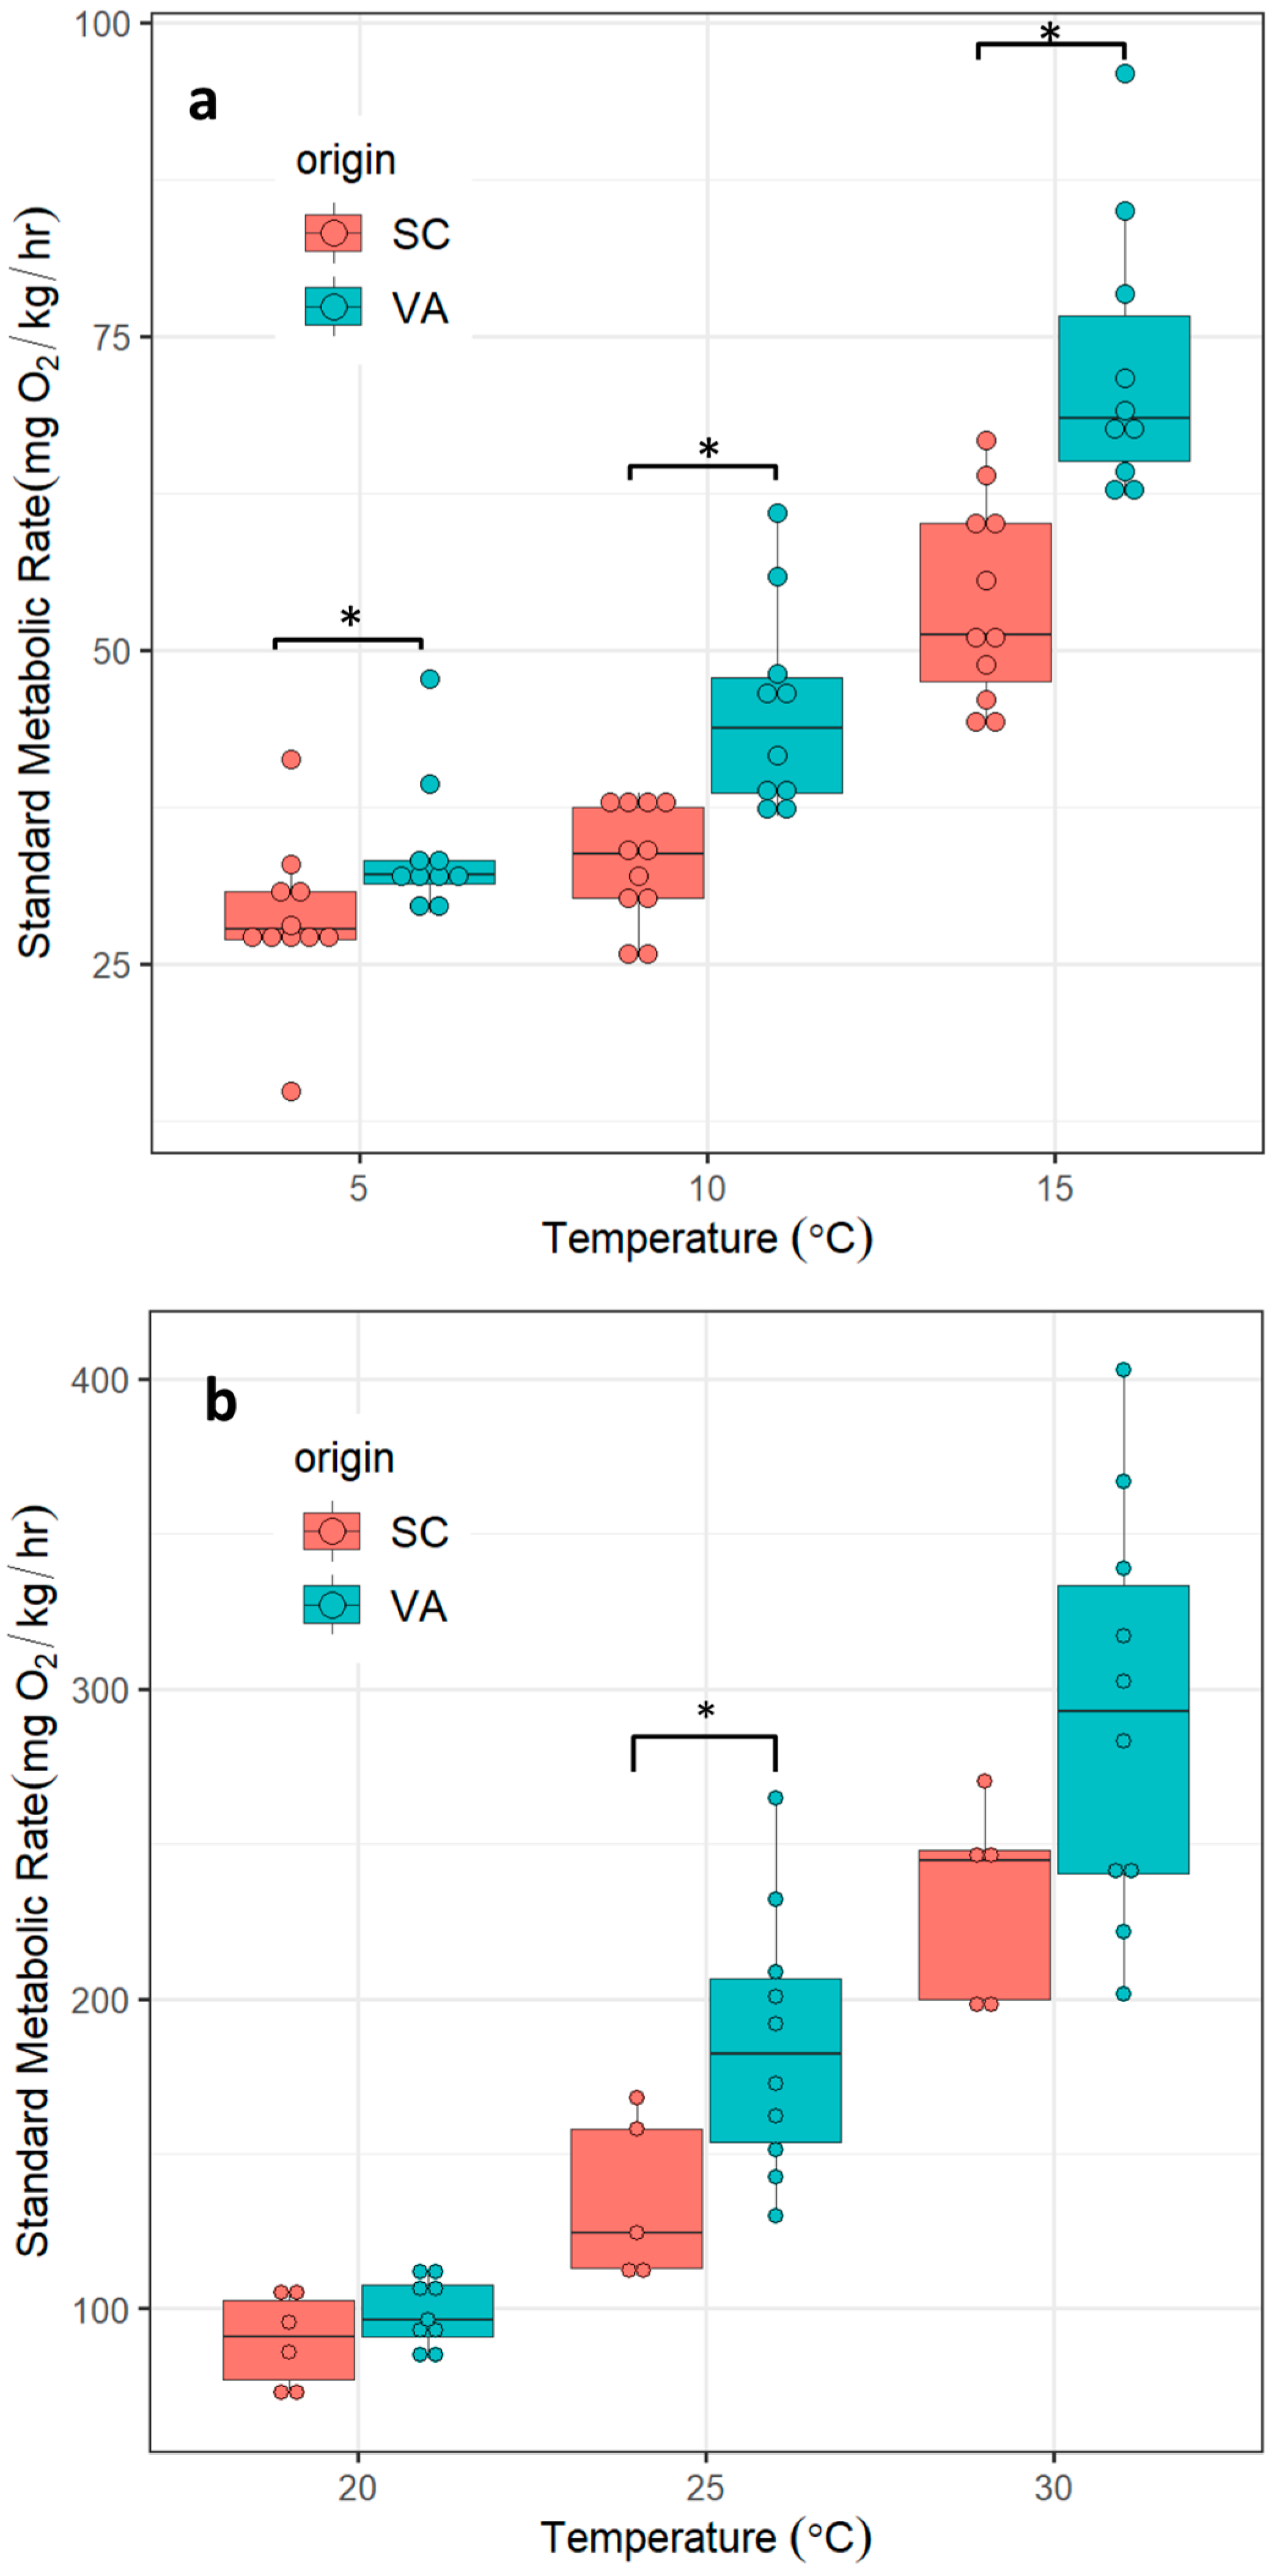
3.1. SMR
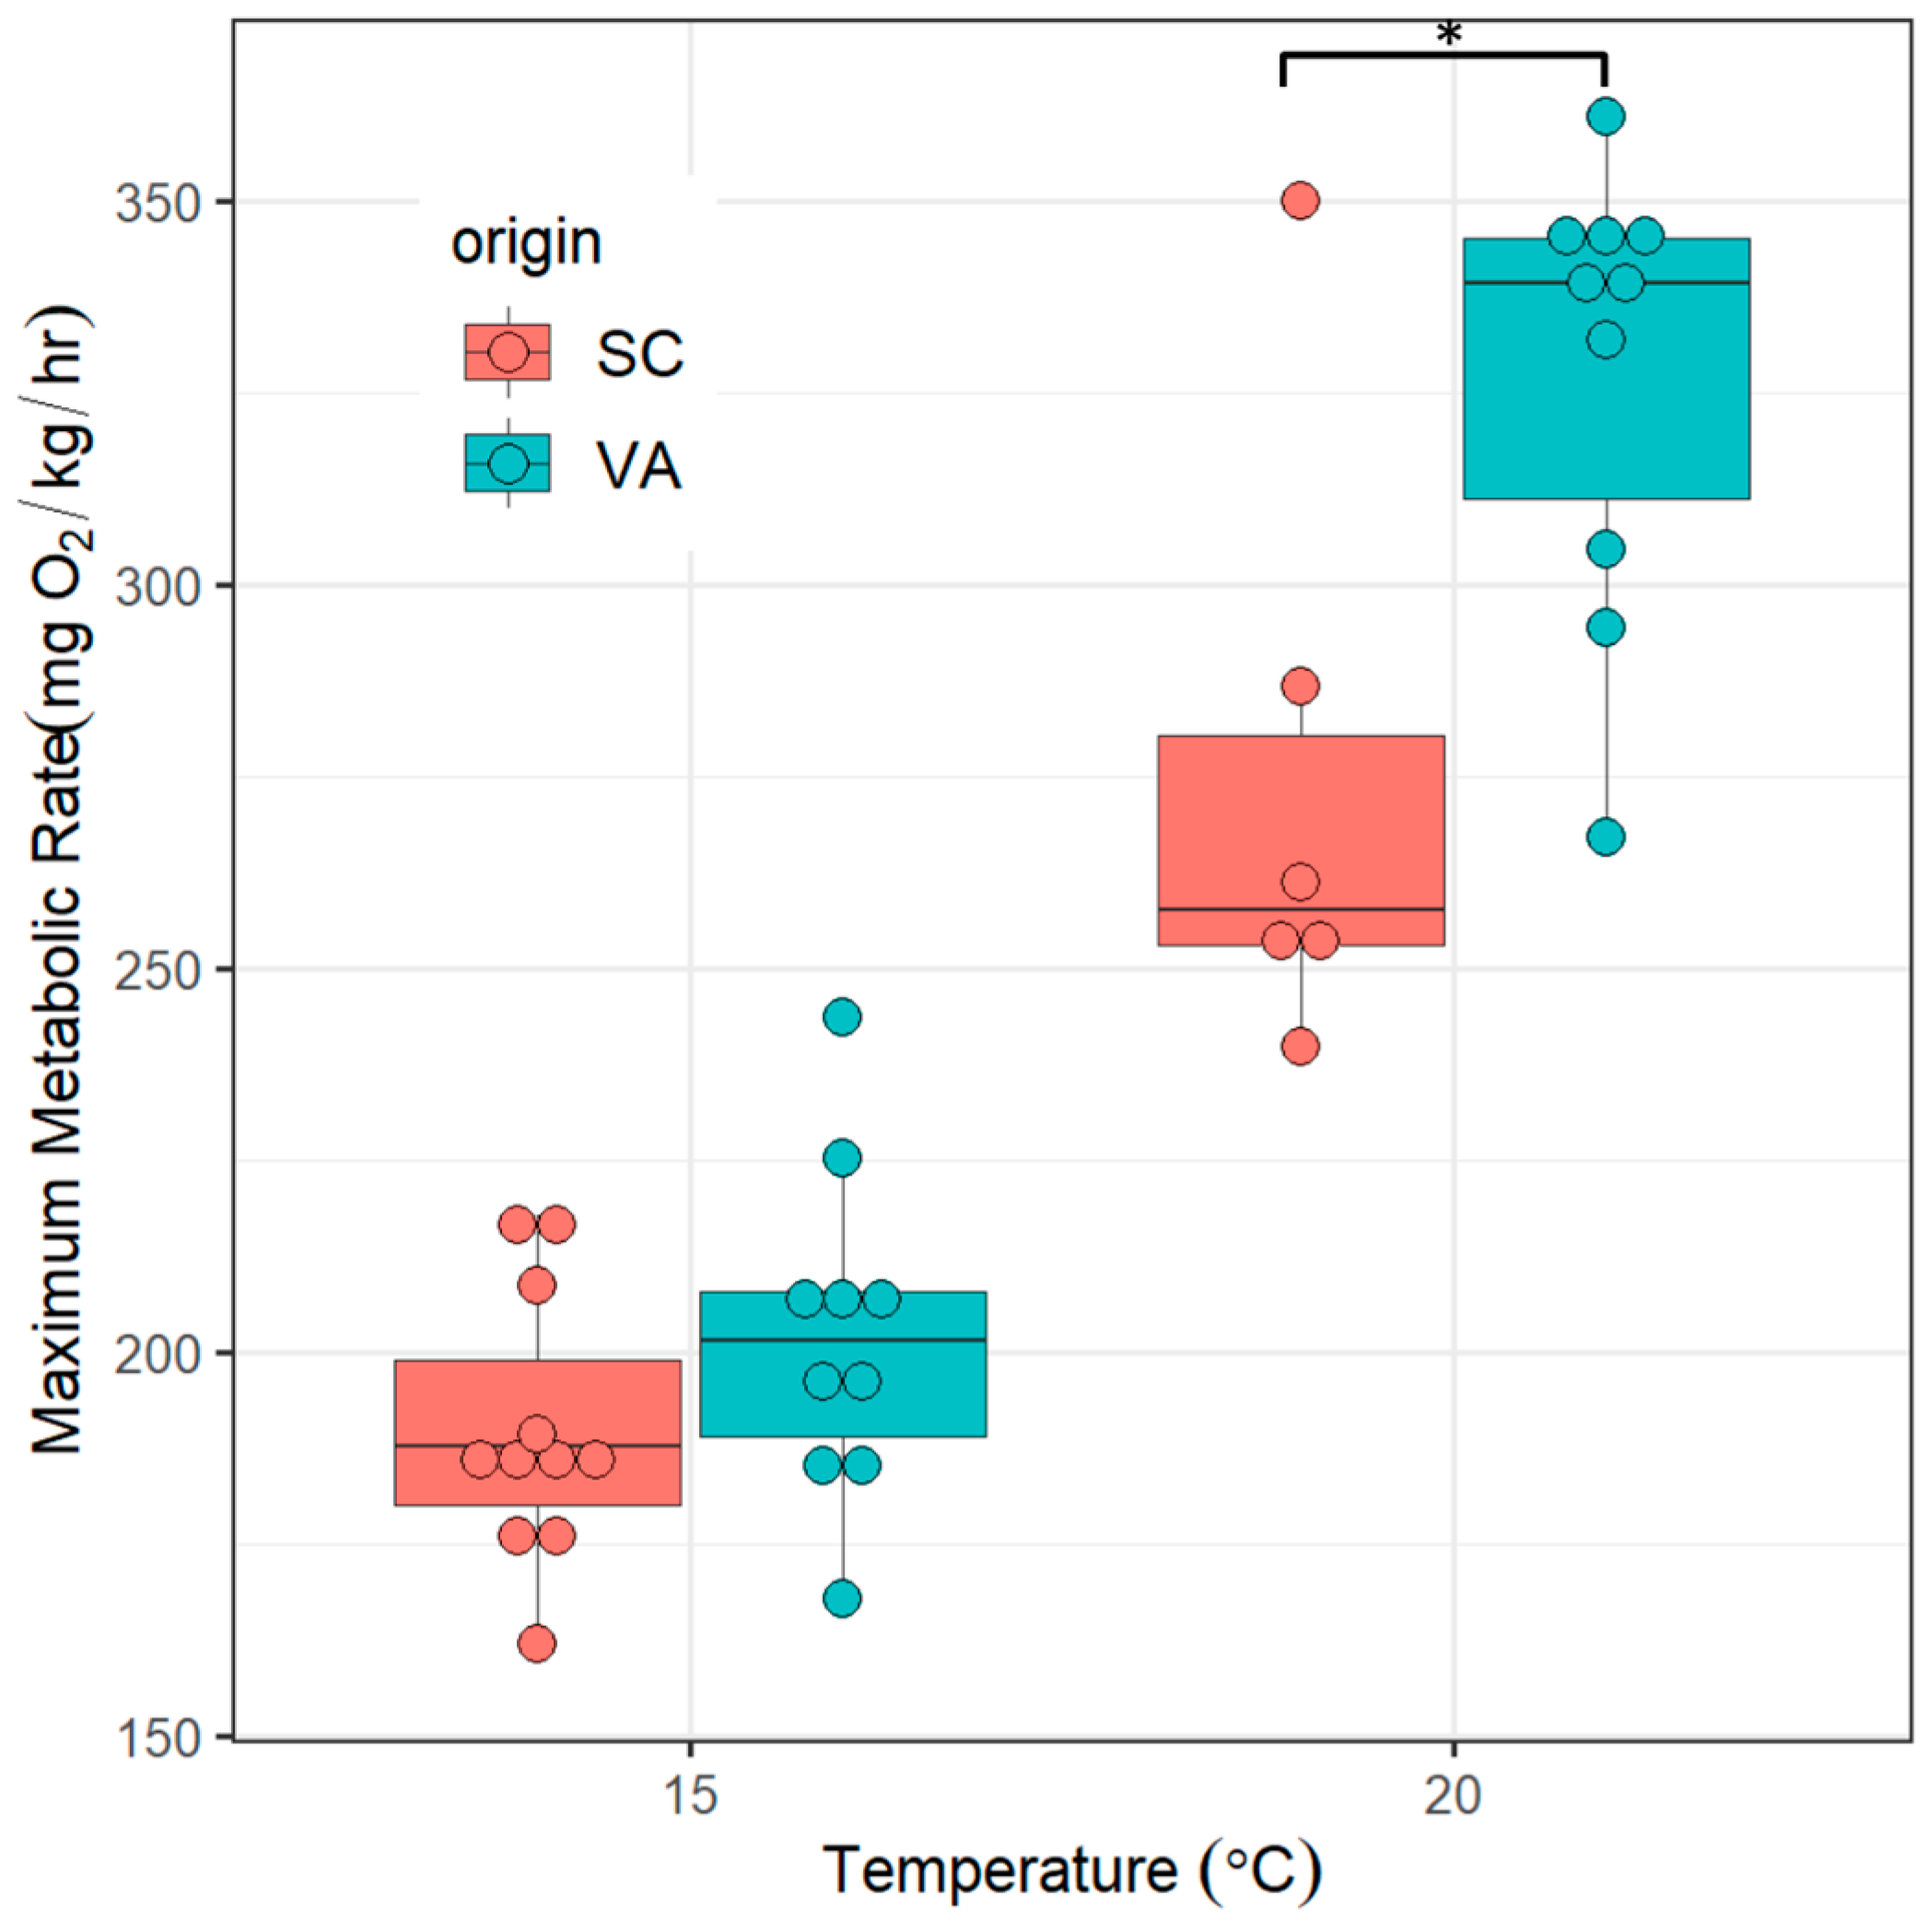
3.2. Maximum Metabolic Rates
3.3. Aerobic Scope
3.4. Q10
4. Discussion
5. Conclusions
Supplementary Materials
Author Contributions
Funding
Acknowledgments
Conflicts of Interest
References
- Fry, F.E.J.; Hart, J.S. The relation of temperature to oxygen consumption in the goldfish. Biol. Bull. 1948, 94, 66–77. [Google Scholar] [CrossRef] [PubMed]
- Fry, F. Responses of vertebrate poikilotherms to temperature. In Thermobiology; Academic Press: New York, NY, USA, 1967. [Google Scholar]
- Hochachka, P.; Somero, G. Strategies of Biochemical Adaptation; W.B. Saunders: Philadelphia, PA, USA, 1973. [Google Scholar]
- Angilletta, M.; Cooper, B.S.; Schuler, M.S.; Boyles, J.G. The evolution of thermal physiology in endotherms. Front. Biosci. 2010, 2, 861–881. [Google Scholar]
- Krogh, A. The Respiratory Exchange of Animals and Man; Longmans: London, UK, 1916. [Google Scholar]
- Wohlschlag, D.E. Metabolism of an Antarctic Fish and the Phenomenon of Cold Adaptation. Ecology 1960, 41, 287–292. [Google Scholar] [CrossRef]
- Steffensen, J.F. Metabolic cold adaptation of polar fish based on measurements of aerobic oxygen consumption: Fact or artefact? Artefact! Comp. Biochem. Physiol. Part A Mol. Integr. Physiol. 2002, 132, 789–795. [Google Scholar] [CrossRef]
- Holeton, G.F. Metabolic Cold Adaptation of Polar Fish: Fact or Artefact? Physiol. Zool. 2016, 47, 137–152. [Google Scholar] [CrossRef]
- White, C.R.; Alton, L.A.; Frappell, P.B. Metabolic cold adaptation in fishes occurs at the level of whole animal, mitochondria and enzyme. Proc. R. Soc. B 2012, 279, 1740–1747. [Google Scholar] [CrossRef] [PubMed]
- Schaefer, J.; Walters, A. Metabolic cold adaptation and developmental plasticity in metabolic rates among species in the {Fundulus} notatus species complex. Funct. Ecol. 2010, 24, 1087–1094. [Google Scholar] [CrossRef]
- Scavia, D.; Field, J.C.; Boesch, D.F.; Buddemeier, R.W.; Burkett, V.; Cayan, D.R.; Fogarty, M.; Harwell, M.A.; Howarth, R.W.; Mason, C.; et al. Climate change impacts on U.S. Coastal and Marine Ecosystems. Estuaries 2002, 25, 149–164. [Google Scholar] [CrossRef]
- IPCC. IPCC, 2014: Climate Change 2014: Synthesis Report. Contribution of Working Groups I, II and III to the Fifth Assessment Report of the Intergovernmental Panel on Climate Change; Pachauri, R.K., Meyer, L.A., Eds.; IPCC: Geneva, Switzer, 2014. [Google Scholar]
- Lefevre, S.; McKenzie, D.J.; Nilsson, G.E. Models projecting the fate of fish populations under climate change need to be based on valid physiological mechanisms. Glob. Chang. Biol. 2017, 23, 3449–3459. [Google Scholar] [CrossRef]
- Rangel, R.E.; Johnson, D.W. Metabolic responses to temperature in a sedentary reef fish, the bluebanded goby (Lythrypnus dalli, Gilbert). J. Exp. Mar. Biol. Ecol. 2018, 501, 83–89. [Google Scholar] [CrossRef]
- Costa, I.A.S.F.; Driedzic, W.R.; Gamperl, A.K. Metabolic and Cardiac Responses of Cunner Tautogolabrus adspersus to Seasonal and Acute Changes in Temperature. Physiol. Biochem. Zool. 2013, 86, 233–244. [Google Scholar] [CrossRef] [PubMed]
- Conover, D.O. Local Adaptation in Marine Fishes: Evidence and Implications for Stock Enhancement. Bull. Mar. Sci. 1998, 62, 477–493. [Google Scholar]
- Roessig, J.M.; Woodley, C.M.; Cech, J.J.; Hansen, L.J. Effects of global climate change on marine and estuarine fishes and fisheries. Rev. Fish Biol. Fish. 2004, 14, 251–275. [Google Scholar] [CrossRef]
- Somero, G.N. The physiology of climate change: How potentials for acclimatization and genetic adaptation will determine “winners” and “losers”. J. Exp. Biol. 2010, 213, 912–920. [Google Scholar] [CrossRef] [PubMed]
- Robins, C.R. Common and Scientific Names of Fishes from the United States and Canada; Special Publication; American Fisheries Society: Bethesda, MD, USA, 1991; ISBN 978-0-913235-70-6. [Google Scholar]
- Hurst, T.P. Causes and consequences of winter mortality in fishes. J. Fish Biol. 2007, 71, 315–345. [Google Scholar] [CrossRef]
- Moffett, A. Movements and Growth of Spotted Seatrout, Cynoscion nebulosus (Cuvier), in West Florida; Technical Series No. 36; State of Florida Board Conservation: Tallahassee, FL, USA, 1961; pp. 1–35. [Google Scholar]
- Iversen, E.; Tabb, D.C. Subpopulations based on growth and tagging studies of spotted seatrout, Cynoscion nebulosus, in Florida. Copeia 1962, 3, 544–548. [Google Scholar] [CrossRef]
- Overstreet, R.M. Aspects of the biology of the spotted seatrout, Cynoscion nebulosus, in Mississippi. Gulf Caribb. Res. 1983, 7, 1–43. [Google Scholar] [CrossRef]
- Baker, W.; Matlock, G.; McEachron, L.; Green, A.; Hegen, H. Movement, growth and survival of spotted seatrout tagged in Bastrop Bayou, Texas. Contrib. Mar. Sci. 1986, 29, 91–101. [Google Scholar]
- Music, J.L., Jr.; Pafford, J.M. Population Dynamics and Life History Aspects of Major Marine Sportfishes in Geogia’s Coastal Waters; Georgia Department of Natural Resources: Brunswick, GA, USA, 1984.
- Ellis, T. Mortality and Movement of Spotted Seatrout at Its Northern Latitudinal Limits. Ph.D. Dissertation, North Carolina State University, Raleigh, NC, USA, 2014. [Google Scholar]
- Brown-Peterson, N. The Reproductive Biology of Spotted Seatrout. In Biology of the Spotted Seatrout; Bortone, S.A., Ed.; CRC Press: Boca Raton, FL, USA, 2003; pp. 99–133. [Google Scholar]
- Wenner, C.A.; Roumillat, W.A.; Moran, J.E.; Maddox, M.B.; Daniel, L.B.; Smith, J.W. Investigations on the Life History and Population Dynamics of Marine Recreational Fishes in South Carolina: Part 1; Marine Resources Research Institute, South Carolina Wildlife and Marine Resources Dept.: Charleston, SC, USA, 1990. [Google Scholar]
- Smith, N.G.; Jones, C.M.; Van Montfrans, J. Spatial and temporal variability of juvenile spotted seatrout Cynoscion nebulosus growth in Chesapeake Bay. J. Fish Biol. 2008, 73, 597–607. [Google Scholar] [CrossRef]
- Wiley, B.; Chapman, R. Population Structure of Spotted Seatrout, Cynoscion nebulosus, along the Atlantic Coast of the U.S. In Biology of the Spotted Seatrout; Borton, S., Ed.; CRC Press: Boca Raton, FL, USA, 2003; pp. 31–40. [Google Scholar]
- O’Donnell, T.P.; Denson, M.R.; Darden, T.L. Genetic population structure of spotted seatrout Cynoscion nebulosus along the south-eastern USA. J. Fish Biol. 2014, 85, 374–393. [Google Scholar] [CrossRef]
- McDowell, J.R.; Musick, S.; Graves, J. Speckled Trout, Cynoscion nebulosus, in Virginia: Are these Fish Genetically Distinct? In Virginia Recreational Fishing Development Fund Final Report; Virginia Marine Resources Commission: Fort Monroe, VA, USA, 2014. [Google Scholar]
- Jobling, M. The influences of feeding on the metabolic rate of fishes: A short review. J. Fish Biol. 1981, 18, 385–400. [Google Scholar] [CrossRef]
- Horodysky, A.Z.; Brill, R.W.; Bushnell, P.G.; Musick, J.A.; Latour, R.J. Comparative metabolic rates of common western North Atlantic Ocean sciaenid fishes. J. Fish Biol. 2011, 79, 235–255. [Google Scholar] [CrossRef] [PubMed]
- Lapointe, D.; Vogelbein, W.K.; Fabrizio, M.C.; Gauthier, D.T.; Brill, R.W. Temperature, hypoxia, and mycobacteriosis: Effects on adult striped bass Morone saxatilis metabolic performance. Dis. Aquat. Organ. 2014, 108, 113–127. [Google Scholar] [CrossRef] [PubMed]
- Steffensen, J.; Johansen, K.; Bushnell, P. An automated swimming respirometer. Comp. Biochem. Physiol. Part A Physiol. 1984, 79, 437–440. [Google Scholar] [CrossRef]
- Svendsen, M.B.S.; Bushnell, P.G.; Steffensen, J.F. Design and setup of intermittent-flow respirometry system for aquatic organisms. J. Fish Biol. 2016, 88, 26–50. [Google Scholar] [CrossRef] [PubMed]
- Garcia, H.; Gordon, L. Oxygen solubility in seawater: Better fitting equations. Limnol. Oceanogr. 1992, 37, 1307–1312. [Google Scholar] [CrossRef]
- White, C.R.; Seymour, R.S. Physiological Functions that Scale to Body Mass in Fish. In Encyclopedia of Fish Physiology; Elsevier Inc.: London, UK, 2011; Volume 3, pp. 1573–1582. [Google Scholar]
- Killen, S.S.; Glazier, D.S.; Rezende, E.L.; Clark, T.D.; Atkinson, D.; Willener, A.S.T.; Halsey, L.G. Ecological Influences and Morphological Correlates of Resting and Maximal Metabolic Rates across Teleost Fish Species. Am. Nat. 2016, 187, 592–606. [Google Scholar] [CrossRef]
- Fraley, C.; Raftery, A.E. Model-Based Clustering, Discriminant Analysis, and Density Estimation. J. Am. Stat. Assoc. 2002, 97, 611–631. [Google Scholar] [CrossRef]
- R Core Team. R: A Language and Environment for Statistical Computing; R Foundation for Statistical Computing: Vienna, Austria, 2018. [Google Scholar]
- Svendsen, M.B.S.; Bushnell, P.G.; Christensen, E.A.F.; Steffensen, J.F. Sources of variation in oxygen consumption of aquatic animals demonstrated by simulated constant oxygen consumption and respirometers of different sizes. J. Fish Biol. 2016, 88, 51–64. [Google Scholar] [CrossRef]
- Halsey, L.G.; Killen, S.S.; Clark, T.D.; Norin, T. Exploring key issues of aerobic scope interpretation in ectotherms: Absolute versus factorial. Rev. Fish Biol. Fish. 2018, 28, 405–415. [Google Scholar] [CrossRef]
- Schurmann, H.; Steffensen, J.F. Effects of temperature, hypoxia and activity on the metabolism of juvenile Atlantic cod. J. Fish Biol. 1997, 50, 1166–1180. [Google Scholar]
- Pinheiro, J.; Bates, D.; DebRoy, S.; Sarkar, D.; Team, R.C. nlme: Linear and Nonlinear Mixed Effects Models. R Package Version 3.1-140. Available online: https://CRAN.R-project.org/package=nlme (accessed on 11 June 2019).
- Baumann, H.; Smith, E.M. Quantifying Metabolically Driven pH and Oxygen Fluctuations in US Nearshore Habitats at Diel to Interannual Time Scales. Estuaries Coasts 2018, 41, 1102–1117. [Google Scholar] [CrossRef]
- Dhillon, R.S.; Schulte, P.M. Intraspecific variation in the thermal plasticity of mitochondria in killifish. J. Exp. Biol. 2011, 214, 3639–3648. [Google Scholar] [CrossRef] [PubMed]
- Larsen, P.F.; Schulte, P.M.; Nielsen, E.E. Gene expression analysis for the identification of selection and local adaptation in fishes. J. Fish Biol. 2011, 78, 1–22. [Google Scholar] [CrossRef] [PubMed]
- Schulte, P.M. The effects of temperature on aerobic metabolism: Towards a mechanistic understanding of the responses of ectotherms to a changing environment. J. Exp. Biol. 2015, 218, 1856–1866. [Google Scholar] [CrossRef]
- Fangue, N.A.; Richards, J.G.; Schulte, P.M. Do mitochondrial properties explain intraspecific variation in thermal tolerance? J. Exp. Biol. 2009, 212, 514–522. [Google Scholar] [CrossRef]
- Ellis, T.A.; Hightower, J.E.; Buckel, J.A. Relative importance of fishing and natural mortality for spotted seatrout (Cynoscion nebulosus) estimated from a tag-return model and corroborated with survey data. Fish. Res. 2018, 199, 81–93. [Google Scholar] [CrossRef]
- Anweiler, K.V.; Arnott, S.A.; Denson, M.R. Low-Temperature Tolerance of Juvenile Spotted Seatrout in South Carolina. Trans. Am. Fish. Soc. 2014, 143, 999–1010. [Google Scholar] [CrossRef]
- Ellis, T.A.; Buckel, J.A.; Hightower, J.E.; Poland, S.J. Relating cold tolerance to winterkill for spotted seatrout at its northern latitudinal limits. J. Exp. Mar. Biol. Ecol. 2017, 490, 42–51. [Google Scholar] [CrossRef]
- Clark, T.D.; Sandblom, E.; Jutfelt, F. Aerobic scope measurements of fishes in an era of climate change: Respirometry, relevance and recommendations. J. Exp. Biol. 2013, 216, 2771–2782. [Google Scholar] [CrossRef]
- Farrell, A.P. Pragmatic perspective on aerobic scope: Peaking, plummeting, pejus and apportioning. J. Fish Biol. 2016, 88, 322–343. [Google Scholar] [CrossRef] [PubMed]
- McDonald, D.L.; Cason, P.D.; Bumguardner, B.W.; Bonnot, S. Critical Thermal Maximum of Juvenile Spotted Seatrout (Cynoscion nebulosus) Reared for Summer Stocking in Texas. J. Appl. Aquac. 2013, 25, 308–319. [Google Scholar] [CrossRef]
- Roumillat, W.A.; Brouwer, M.C. Reproductive dynamics of female spotted seatrout (Cynoscion nebulosus) in South Carolina. Fish. Bull. 2004, 102, 473–487. [Google Scholar]
- Brill, R. Selective Advantages Conferred by the High Performance Physiology of Tunas, Billfishes, and Dolphin Fish. Comp. Biochem. Physiol. Part A Physiol. 1996, 113, 3–15. [Google Scholar] [CrossRef]
- Korsmeyer, K.E.; Dewar, H. Tuna metabolism and energetics. In Fish Physiology, Tuna: Physiology, Ecology, and Evolution; Academic Press: San Diego, CA, USA, 2001; Volume 19, pp. 35–78. [Google Scholar]
- Brill, R.W.; Bushnell, P.G. Metabolic and cardiac scope of high energy demand teleosts, the tunas. Can. J. Zool. 1991, 69, 2002–2009. [Google Scholar] [CrossRef]
- Somero, G.N. Thermal Physiology and Vertical Zonation of Intertidal Animals: Optima, Limits, and Costs of Living. Integr. Comp. Biol. 2002, 42, 780–789. [Google Scholar] [CrossRef]
- Tirsgaard, B.; Behrens, J.W.; Steffensen, J.F. The effect of temperature and body size on metabolic scope of activity in juvenile Atlantic cod Gadus morhua L. Comp. Biochem. Physiol. Part A Mol. Integr. Physiol. 2015, 179, 89–94. [Google Scholar] [CrossRef]
- Shlossman, P.A.; Chittenden, J.M.E. Reproduction, movements, and population dynamics of the sand seatrout, Cynoscion arenarius. Fish. Bull. 1981, 79, 649–669. [Google Scholar]
- Vetter, R.D. Seasonal metabolic compensation in sympatric seatrout: Adaptation to the estuary. Trans. Am. Fish. Soc. 1982, 111, 193–198. [Google Scholar] [CrossRef]
- Rooke, A.C.; Burness, G.; Fox, M.G. Thermal physiology of native cool-climate, and non-native warm-climate Pumpkinseed sunfish raised in a common environment. J. Therm. Biol. 2017, 64, 48–57. [Google Scholar] [CrossRef]
- Kawecki, T.J.; Ebert, D. Conceptual issues in local adaptation. Ecol. Lett. 2004, 7, 1225–1241. [Google Scholar] [CrossRef]
- Hemmer-Hansen, J.; Therkildsen, N.O.; Pujolar, J.M. Population genomics of marine fishes: Next-generation prospects and challenges. Biol. Bull. 2014, 227, 117–132. [Google Scholar] [CrossRef] [PubMed]
- Helyar, S.J.; Hemmer-Hansen, J.; Bekkevold, D.; Taylor, M.I.; Ogden, R.; Limborg, M.T.; Cariani, A.; Maes, G.E.; Diopere, E.; Carvalho, G.R.; et al. Application of SNPs for population genetics of nonmodel organisms: New opportunities and challenges. Mol. Ecol. Resour. 2011, 11, 123–136. [Google Scholar] [CrossRef] [PubMed]
- Chen, Z.; Farrell, A.P.; Matala, A.; Narum, S.R. Mechanisms of thermal adaptation and evolutionary potential of conspecific populations to changing environments. Mol. Ecol. 2018, 27, 659–674. [Google Scholar] [CrossRef] [PubMed]
- Auer, S.K.; Salin, K.; Rudolf, A.M.; Anderson, G.J.; Metcalfe, N.B. Flexibility in metabolic rate confers a growth advantage under changing food availability. J. Anim. Ecol. 2015, 84, 1405–1411. [Google Scholar] [CrossRef] [PubMed]
- Norin, T.; Metcalfe, N.B. Ecological and evolutionary consequences of metabolic rate plasticity in response to environmental change. Philos. Trans. R. Soc. B 2019, 374, 20180180. [Google Scholar] [CrossRef]
- Sokolova, I.M. Energy-Limited Tolerance to Stress as a Conceptual Framework to Integrate the Effects of Multiple Stressors. Integr. Comp. Biol. 2013, 53, 597–608. [Google Scholar] [CrossRef]
- Cooke, S.J.; Sack, L.; Franklin, C.E.; Farrell, A.P.; Beardall, J.; Wikelski, M.; Chown, S.L. What is conservation physiology? Perspectives on an increasingly integrated and essential science. Conserv. Physiol. 2013, 1, cot001. [Google Scholar] [CrossRef]


| Sampling Location | Cold Stress | Heat Stress |
|---|---|---|
| Corrotoman River, Virginia | n = 10 M = 192 g (140–252 g) | n = 10 M = 238 g (122–439 g) |
| Charleston, South Carolina | n = 11 M = 467 g (235–838) | n = 5 M = 454 g (368–508) |
| Origin | Temp. (°C) | N | fit | sd | se | ci |
|---|---|---|---|---|---|---|
| SC | 5 | 11 | 28.6 | 5.7 | 1.7 | 3.8 |
| SC | 10 | 11 | 33.1 | 4.5 | 1.4 | 3.1 |
| SC | 15 | 11 | 53.8 | 7.1 | 2.1 | 4.8 |
| VA | 5 | 10 | 34.0 | 5.7 | 1.8 | 4.1 |
| VA | 10 | 10 | 45.2 | 7.8 | 2.5 | 5.6 |
| VA | 15 | 10 | 72.5 | 10.0 | 3.2 | 7.2 |
| SC | 20 | 5 | 86.6 | 13.4 | 6.0 | 16.6 |
| SC | 25 | 5 | 135.1 | 24.3 | 10.9 | 30.1 |
| SC | 30 | 5 | 231.7 | 29.4 | 13.1 | 36.5 |
| VA | 20 | 10 | 100.2 | 10.7 | 3.4 | 7.7 |
| VA | 25 | 10 | 185.6 | 38.3 | 12.1 | 27.4 |
| VA | 30 | 10 | 291.7 | 59.4 | 18.8 | 42.5 |
© 2019 by the authors. Licensee MDPI, Basel, Switzerland. This article is an open access article distributed under the terms and conditions of the Creative Commons Attribution (CC BY) license (http://creativecommons.org/licenses/by/4.0/).
Share and Cite
Song, J.; Brill, R.W.; McDowell, J.R. Plasticity in Standard and Maximum Aerobic Metabolic Rates in Two Populations of an Estuarine Dependent Teleost, Spotted Seatrout (Cynoscion nebulosus). Biology 2019, 8, 46. https://doi.org/10.3390/biology8020046
Song J, Brill RW, McDowell JR. Plasticity in Standard and Maximum Aerobic Metabolic Rates in Two Populations of an Estuarine Dependent Teleost, Spotted Seatrout (Cynoscion nebulosus). Biology. 2019; 8(2):46. https://doi.org/10.3390/biology8020046
Chicago/Turabian StyleSong, Jingwei, Richard W. Brill, and Jan R. McDowell. 2019. "Plasticity in Standard and Maximum Aerobic Metabolic Rates in Two Populations of an Estuarine Dependent Teleost, Spotted Seatrout (Cynoscion nebulosus)" Biology 8, no. 2: 46. https://doi.org/10.3390/biology8020046
APA StyleSong, J., Brill, R. W., & McDowell, J. R. (2019). Plasticity in Standard and Maximum Aerobic Metabolic Rates in Two Populations of an Estuarine Dependent Teleost, Spotted Seatrout (Cynoscion nebulosus). Biology, 8(2), 46. https://doi.org/10.3390/biology8020046