Combined Effects of Acute Temperature Change and Elevated pCO2 on the Metabolic Rates and Hypoxia Tolerances of Clearnose Skate (Rostaraja eglanteria), Summer Flounder (Paralichthys dentatus), and Thorny Skate (Amblyraja radiata)

 , ,
, ,
Abstract
:1. Introduction
2. Materials and Methods
3. Results
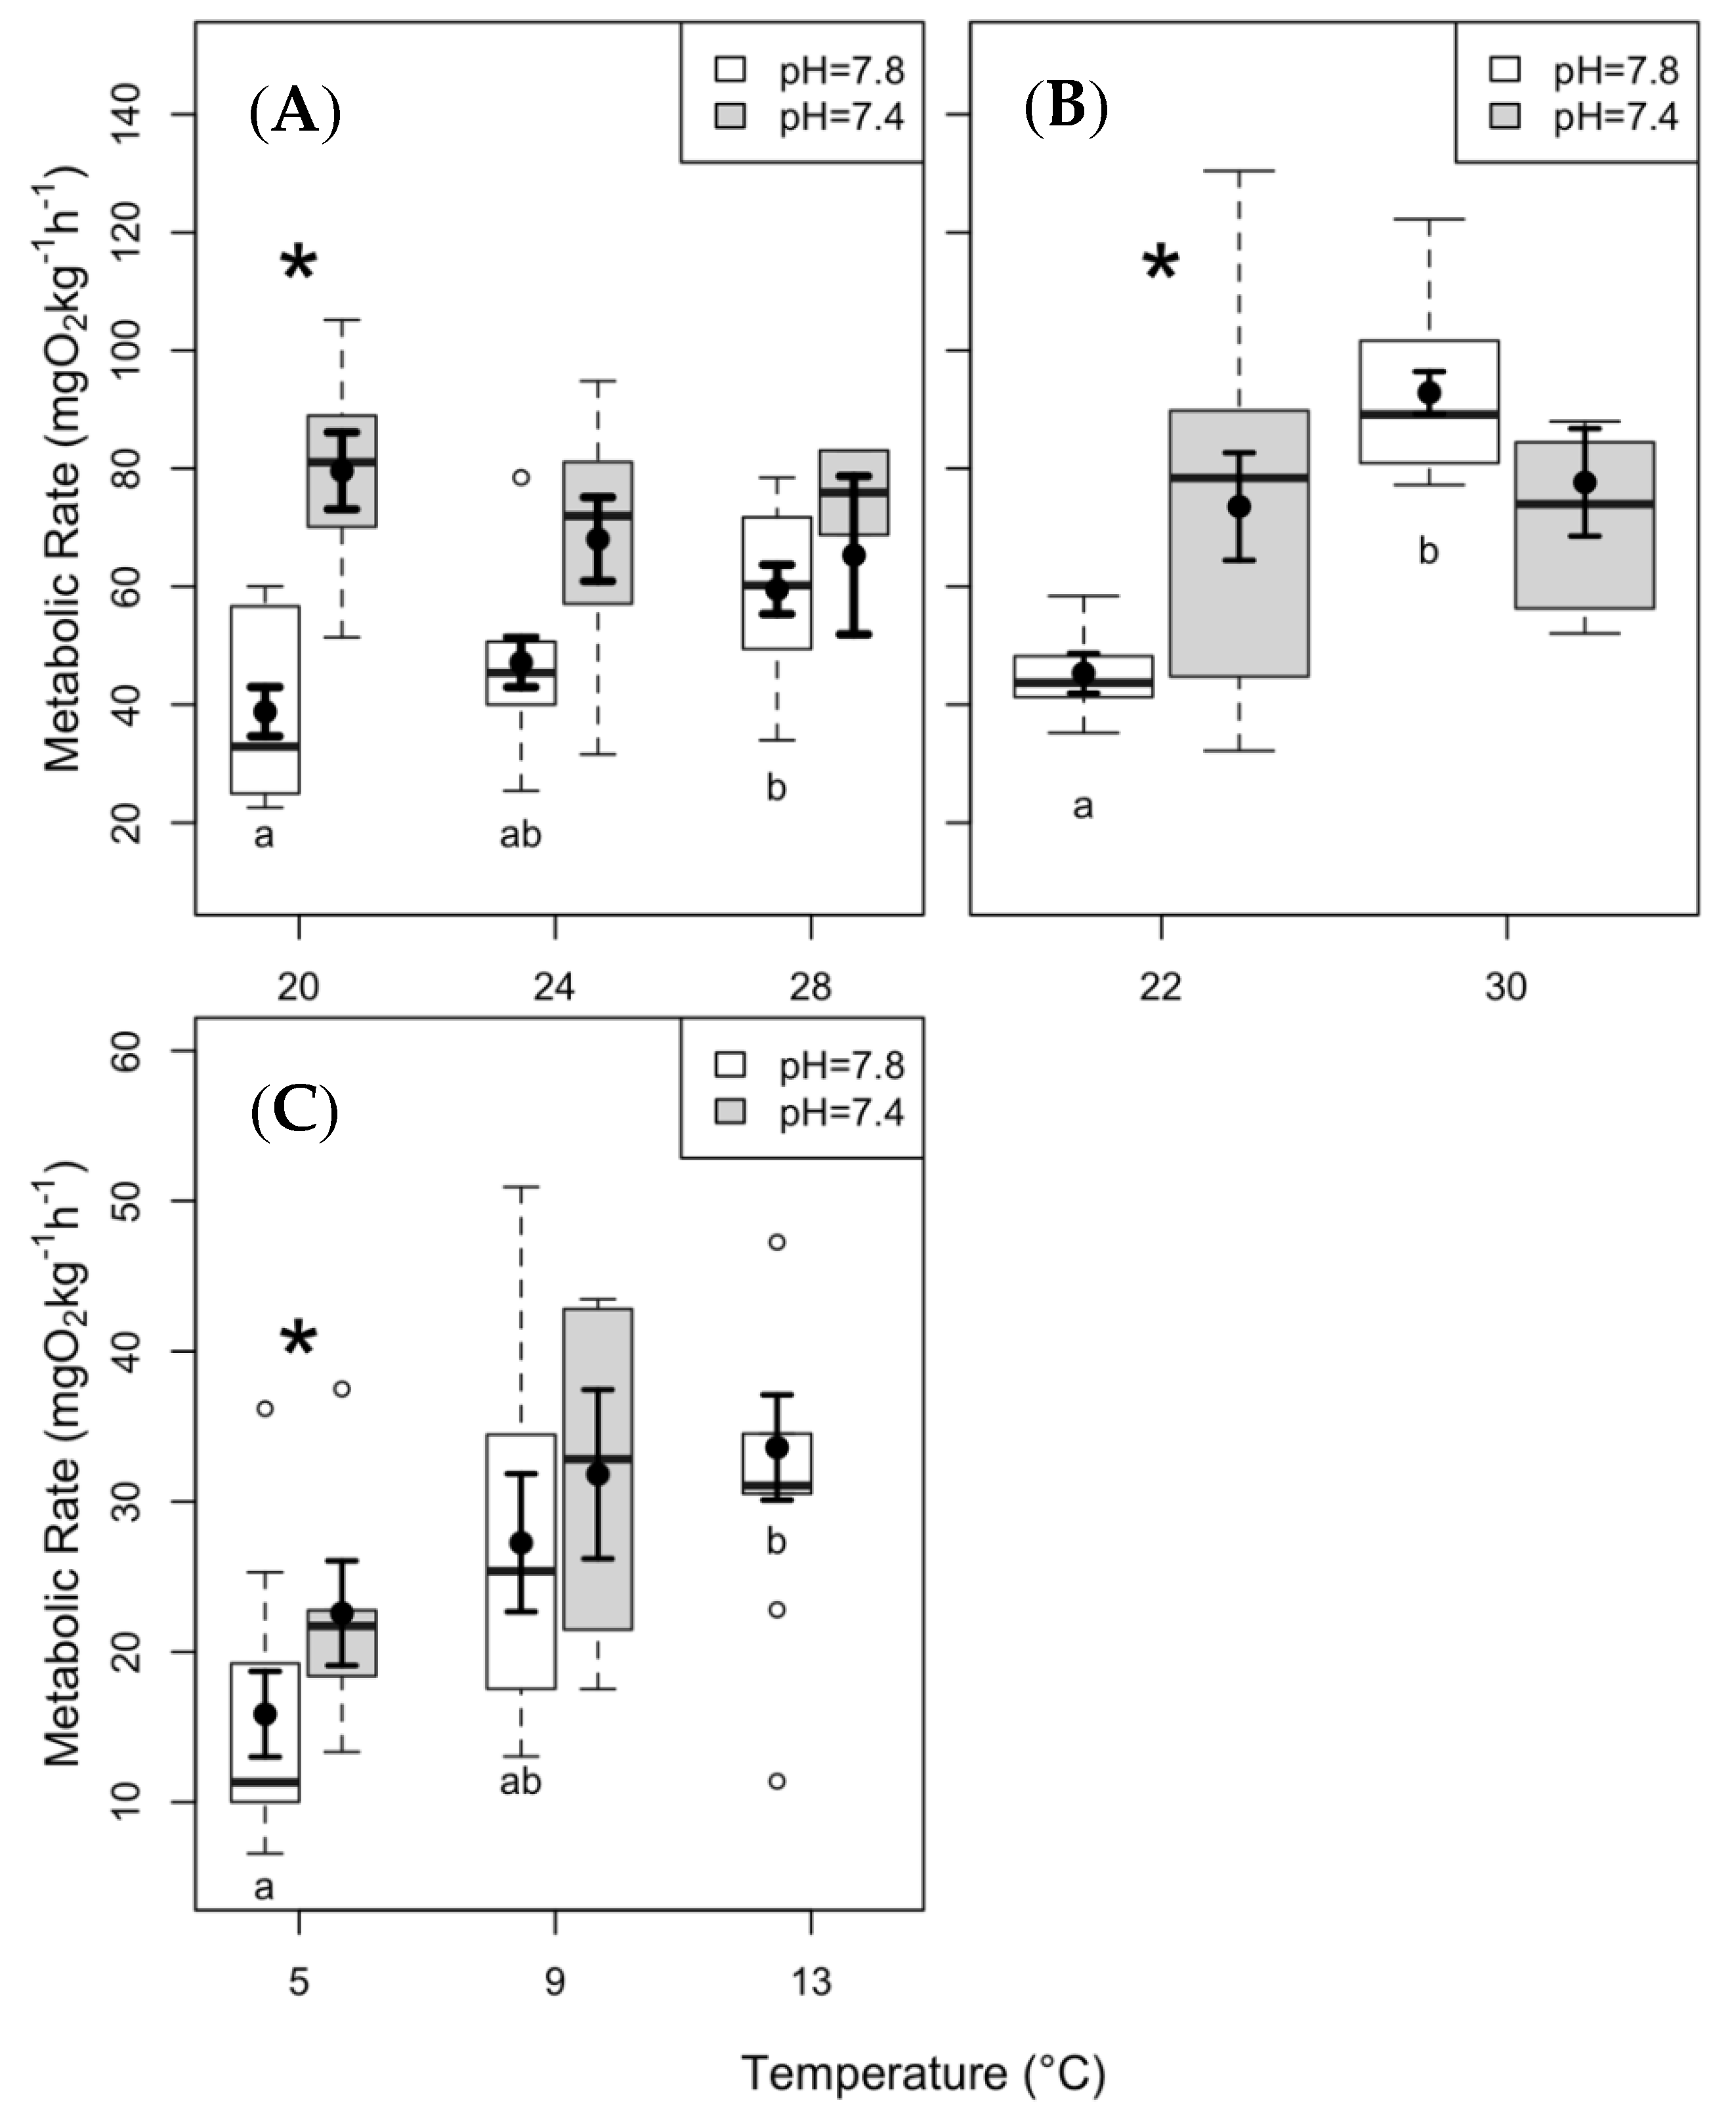
3.1. SMR and Q10
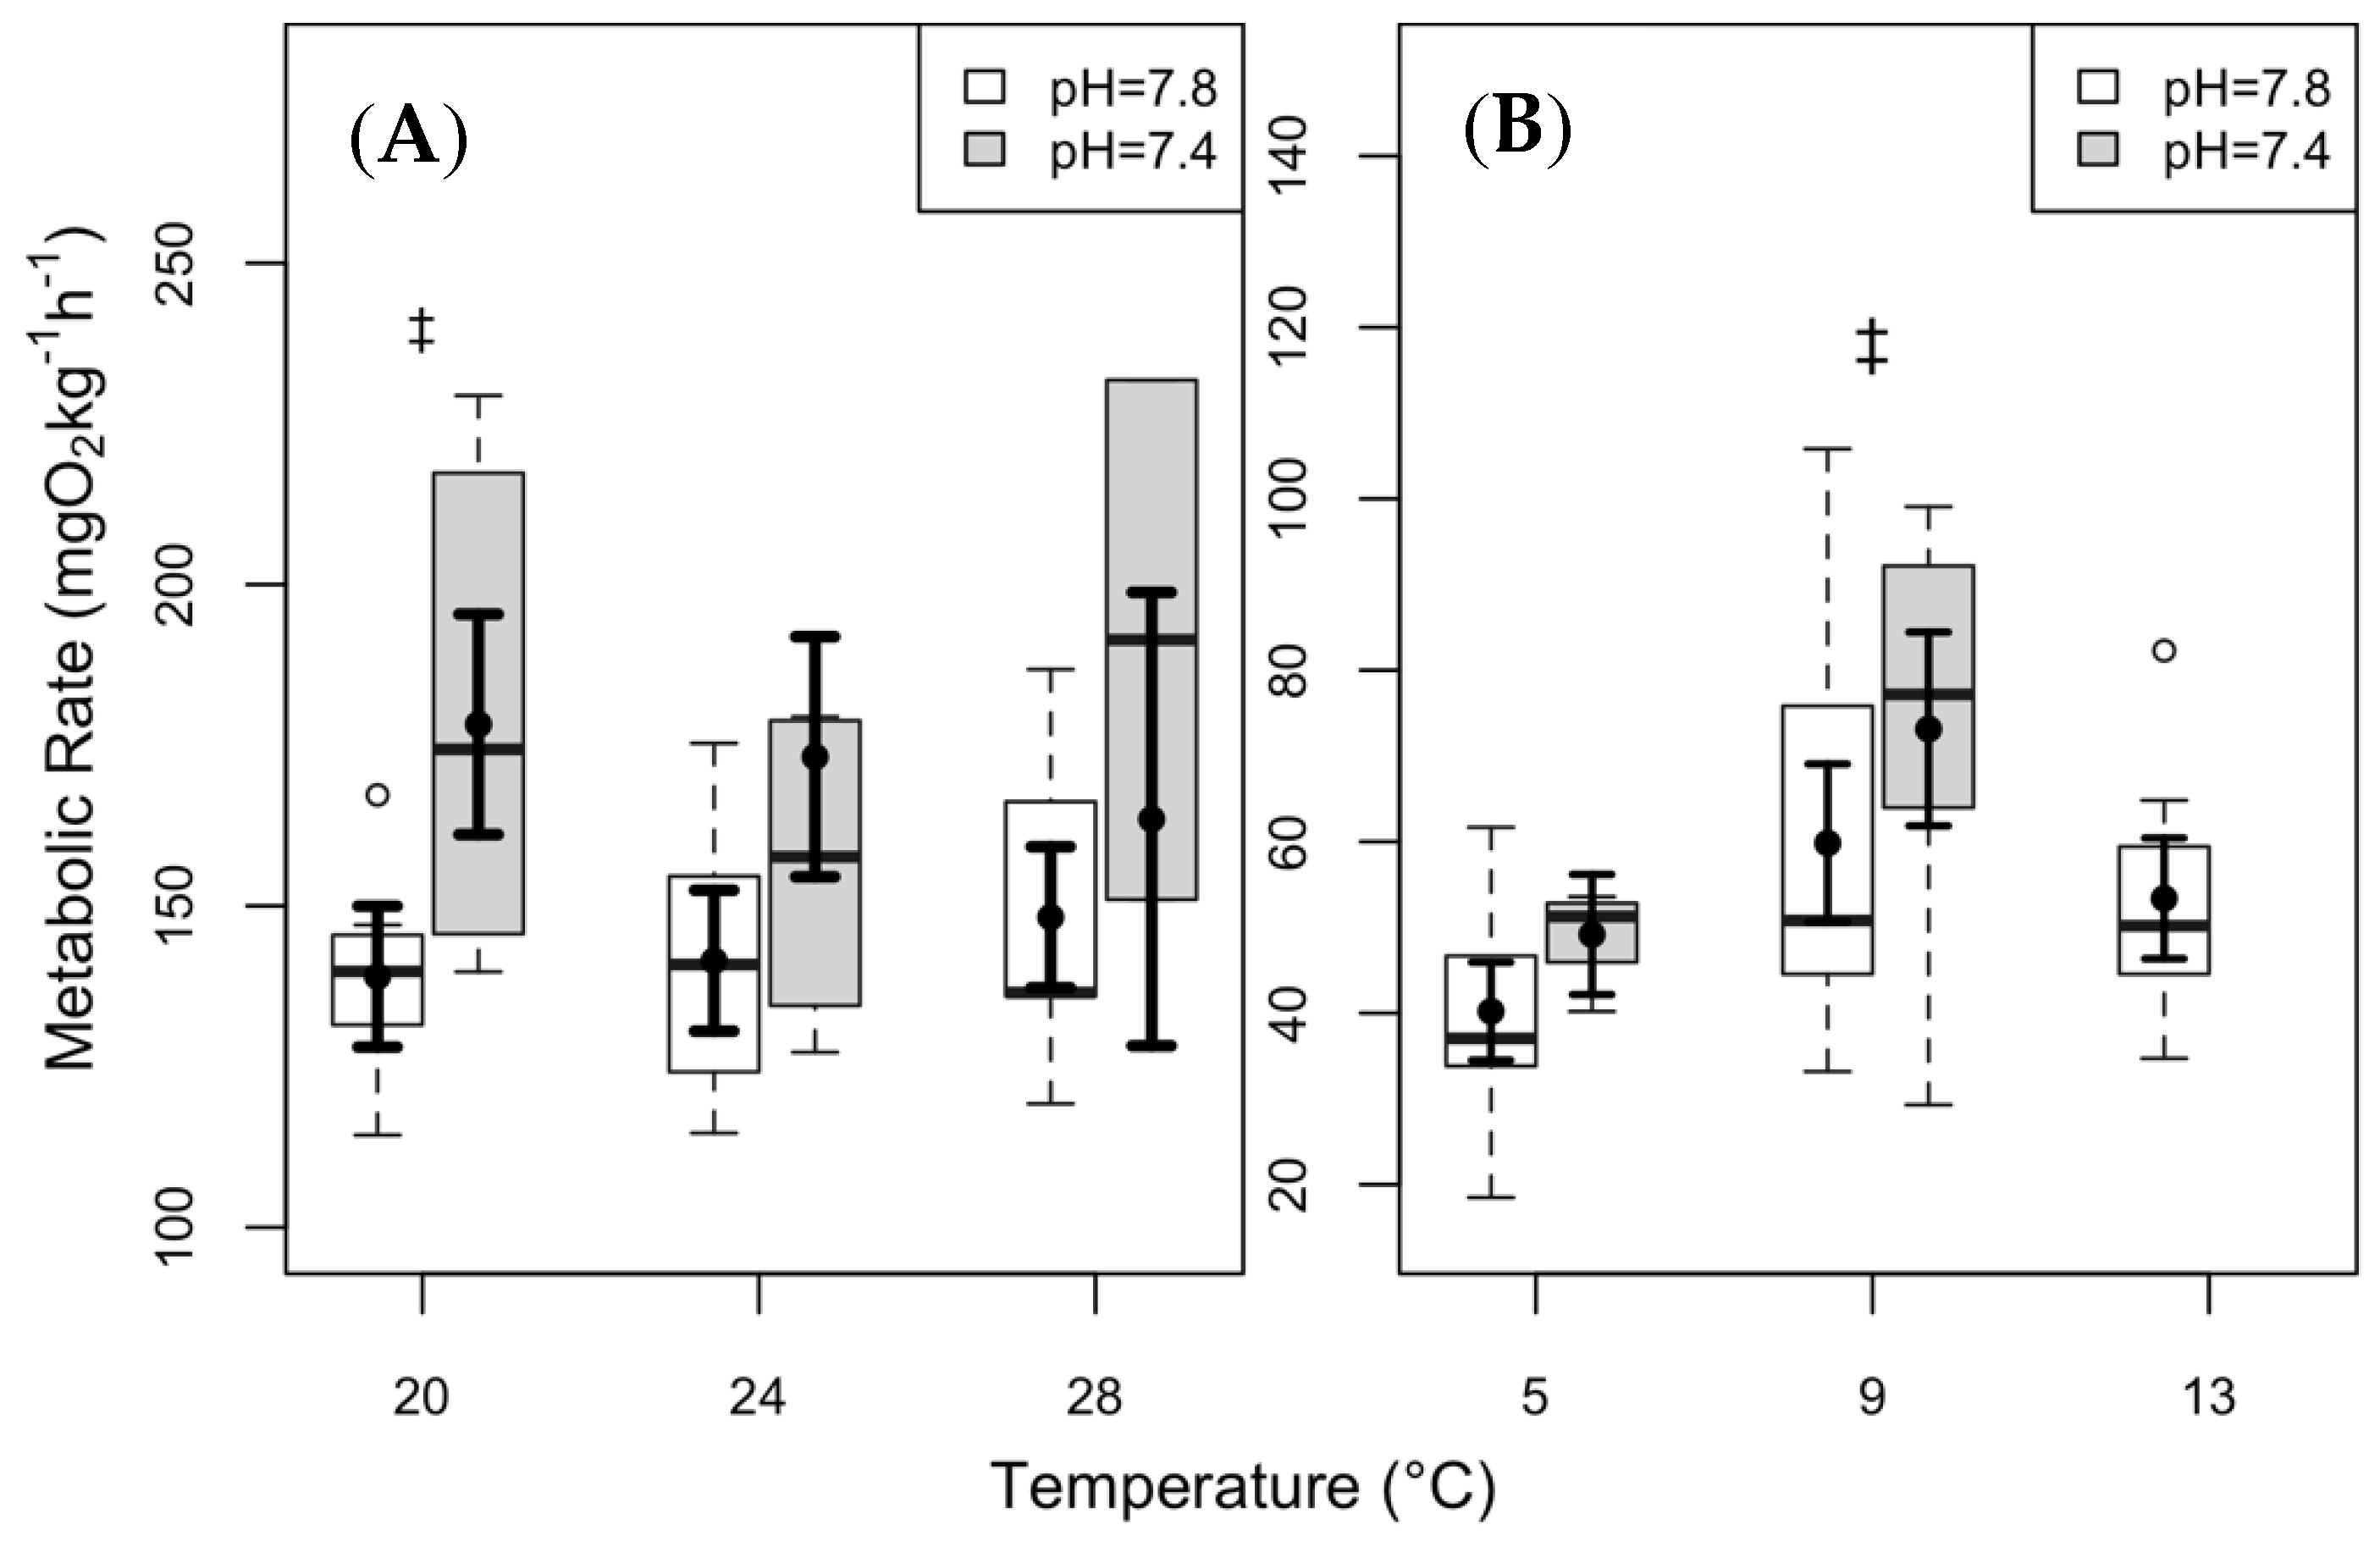
3.2. Maximum Metabolic Rate and Aerobic Scope
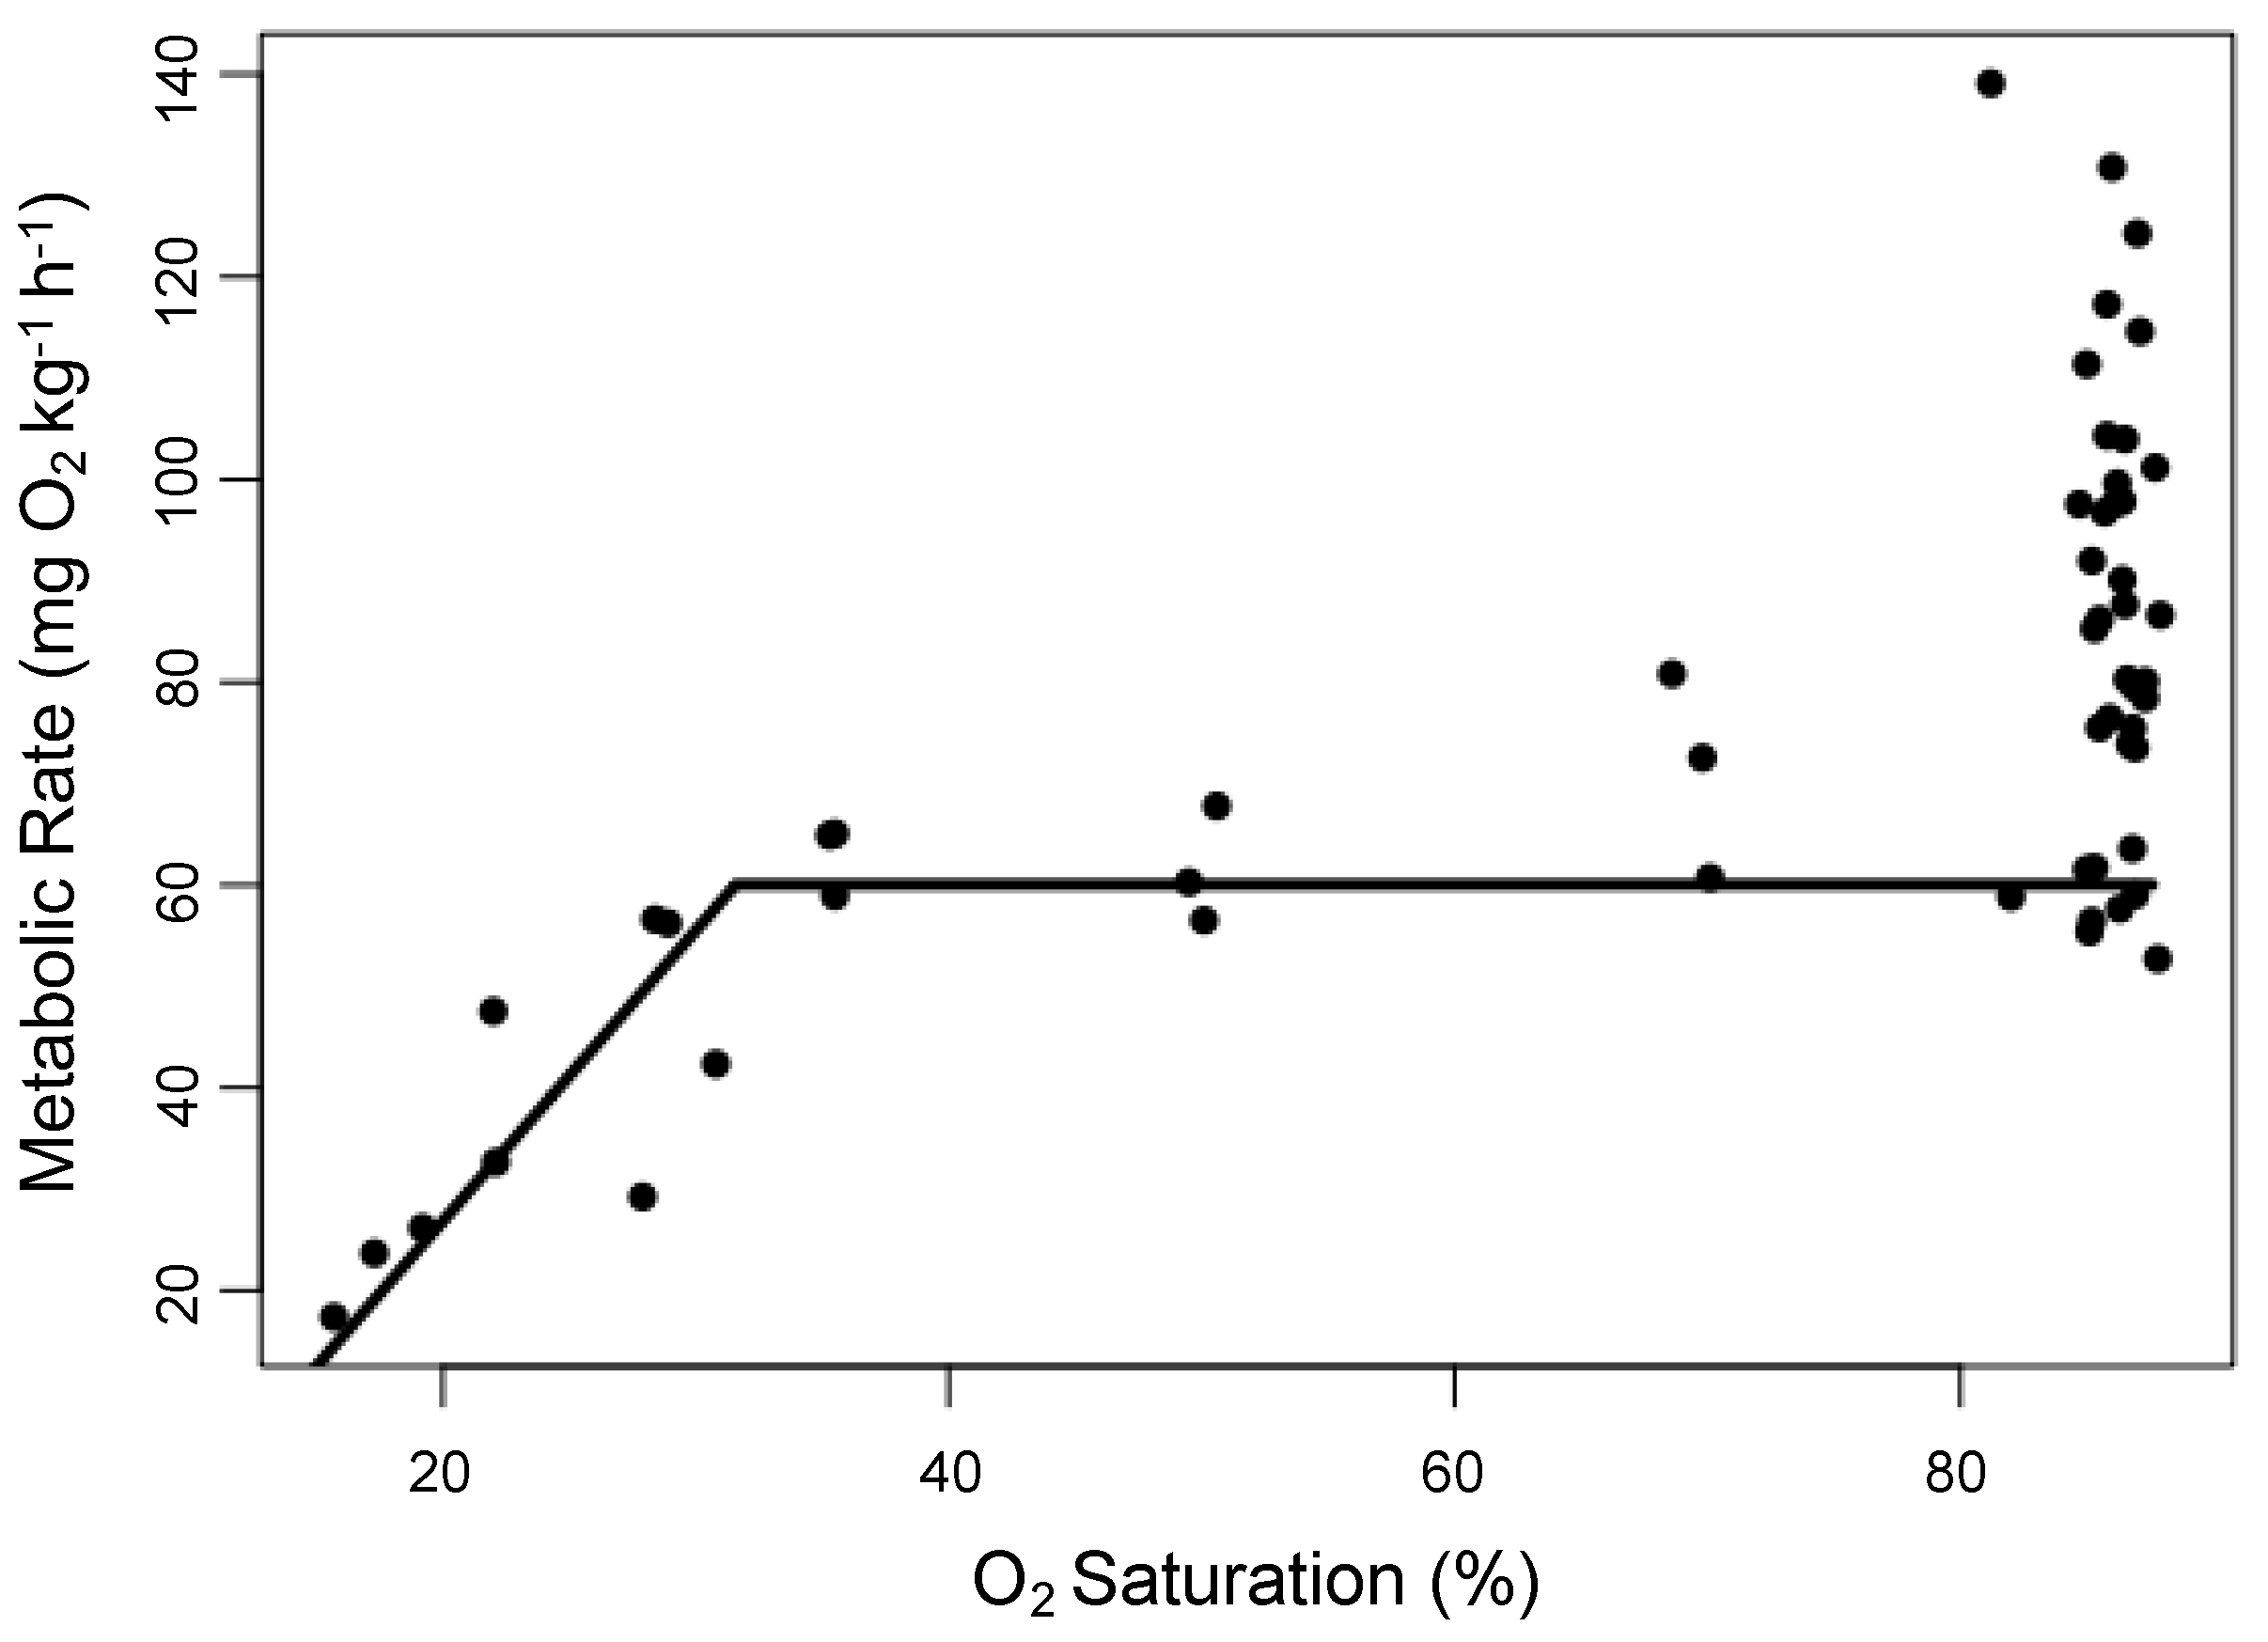
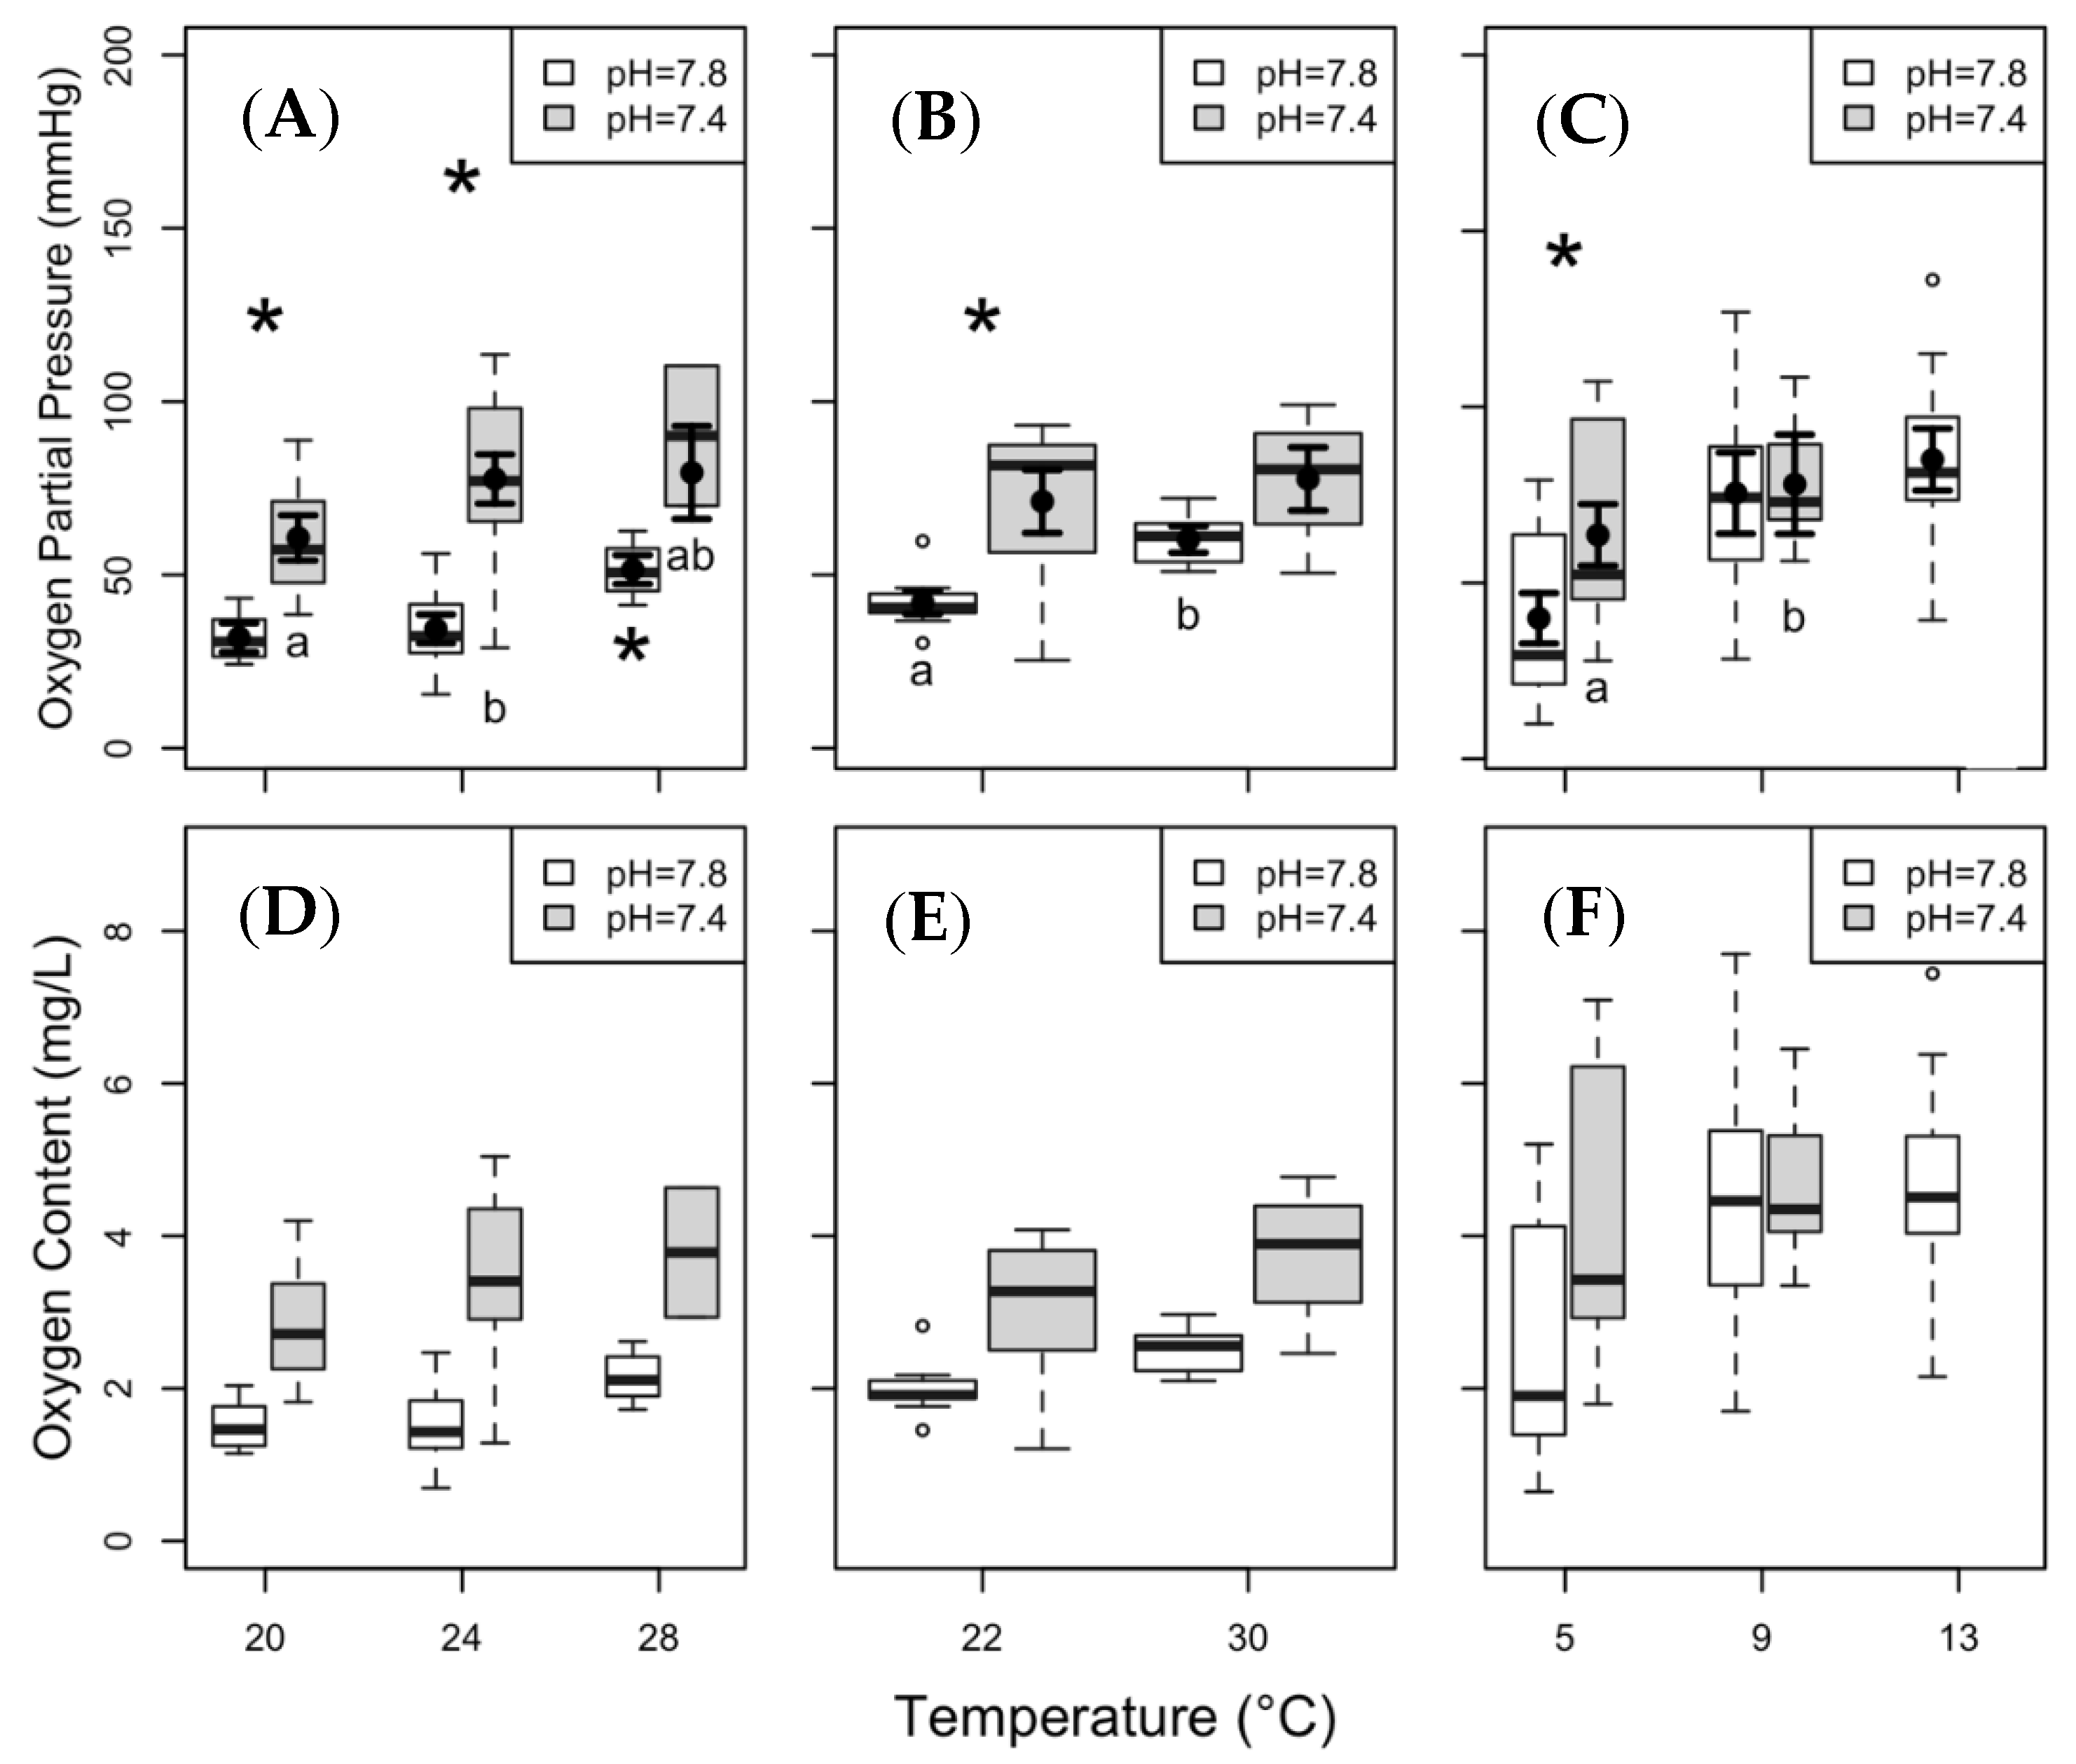
3.3. Hypoxia Tolerance
4. Discussion
5. Conclusions
Supplementary Materials
Author Contributions
Funding
Acknowledgments
Conflicts of Interest
References
- Melzner, F.; Thomsen, J.; Koeve, W.; Oschlies, A.; Gutowska, M.A.; Bange, H.W.; Hansen, H.P.; Körtzinger, A. Future ocean acidification will be amplified by hypoxia in coastal habitats. Mar. Biol. 2013, 160, 1875–1888. [Google Scholar] [CrossRef]
- McKenzie, D.J.; Axelsson, M.; Chabot, D.; Claireaux, G.; Cooke, S.J.; Corner, R.A.; De Boeck, G.; Domenici, P.; Guerreiro, P.M.; Hamer, B.; et al. Conservation physiology of marine fishes: State of the art and prospects for policy. Conserv. Physiol. 2016, 4, cow046. [Google Scholar] [CrossRef] [PubMed]
- Hoegh-Guldberg, O.; Bruno, J.F. The impact of climate change on the world’s marine ecosystems. Science 2010, 328, 1523–1528. [Google Scholar] [CrossRef] [PubMed]
- Poloczanska, E.S.; Burrows, M.T.; Brown, C.J.; García Molinos, J.; Halpern, B.S.; Hoegh-Guldberg, O.; Kappel, C.V.; Moore, P.J.; Richardson, A.J.; Schoeman, W.J. Responses of marine organisms to climate change across oceans. Front. Mar. Sci. 2016, 3, 62. [Google Scholar] [CrossRef]
- Di Santo, V. Intraspecific variation in physiological performance of a benthic elasmobranch challenged by ocean acidification and warming. J. Exp. Biol. 2016, 219, 1725–1733. [Google Scholar] [CrossRef] [PubMed]
- Bennett, S.; Duarte, C.M.; Marba, N.; Wernberg, T. Integrating within-species variation in thermal physiology into climate change ecology. Philos. Trans. R. Soc. B 2019, 374, 20180550. [Google Scholar] [CrossRef] [Green Version]
- Clark, T.D.; Sandblom, E.; Jutfelt, F. Aerobic scope measurements of fishes in an era of climate change: Respirometry, relevance and recommendations. J. Exp. Biol. 2013, 216, 2771–2782. [Google Scholar] [CrossRef]
- Nilsson, G.E.; Lefevre, S. Physiological Challenges to Fishes in a Warmer and Acidified Future. Physiology 2016, 31, 409–417. [Google Scholar] [CrossRef]
- Claireaux, G.; Chabot, D. Responses by fishes to environmental hypoxia: Integration through Fry’s concept of aerobic metabolic scope. J. Fish Biol. 2016, 88, 232–251. [Google Scholar] [CrossRef]
- Heuer, R.M.; Grosell, M. Physiological impacts of elevated carbon dioxide and ocean acidification on fish. Am. J. Physiol. Regul. Integr. Comp. Physiol. 2014, 307, R1061–R1084. [Google Scholar] [CrossRef] [Green Version]
- Horodysky, A.Z.; Cooke, S.J.; Brill, R.W. Physiology in the service of fisheries science: Why thinking mechanistically matters. Rev. Fish Biol. Fish. 2015, 25, 425–447. [Google Scholar] [CrossRef]
- Baumann, H. Experimental assessments of marine species sensitivities to ocean acidification and co-stressors: How far have we come? Can. J. Zool. 2019, 97, 399–408. [Google Scholar] [CrossRef]
- Lyons, K.; Bigman, J.S.; Kacev, D.; Mull, C.G.; Carlisle, A.B.; Imhoff, J.L.; Anderson, J.M.; Weng, K.C.; Galloway, A.S.; Cave, E.; et al. Bridging disciplines to advance elasmobranch conservation: Applications of physiological ecology. Conserv. Physiol. 2019, 7, coz011. [Google Scholar] [CrossRef] [PubMed]
- Lefevre, S. Are global warming and ocean acidification conspiring against marine ectotherms? A meta-analysis of the respiratory effects of elevated temperature, high CO2 and their interaction. Conserv. Physiol. 2016, 4, cow009. [Google Scholar] [CrossRef] [PubMed]
- Svendsen, M.B.; Bushnell, P.G.; Steffensen, J.F. Design and setup of intermittent-flow respirometry system for aquatic organisms. J. Fish Biol. 2016, 88, 26–50. [Google Scholar] [CrossRef] [PubMed]
- Speers-Roesch, B.; Richards, J.G.; Brauner, C.J.; Farrell, A.P.; Hickey, A.J.; Wang, Y.S.; Renshaw, G.M. Hypoxia tolerance in elasmobranchs. I. Critical oxygen tension as a measure of blood oxygen transport during hypoxia exposure. J. Exp. Biol. 2012, 215, 93–102. [Google Scholar] [CrossRef] [PubMed] [Green Version]
- Crear, D.P.; Brill, R.W.; Bushnell, P.G.; Latour, R.J.; Schwieterman, G.D.; Steffen, R.M.; Weng, K.C.; Clark, T. The impacts of warming and hypoxia on the performance of an obligate ram ventilator. Conserv. Physiol. 2019, 7, coz026. [Google Scholar] [CrossRef] [Green Version]
- Brill, R.W. Selective advantages conferred by the high performance physiology of tunas, billfishes, and dolphin fish. Comp. Biochem. Physiol. 1996, 113, 3–15. [Google Scholar] [CrossRef]
- Teal, L.R.; Marras, S.; Peck, M.A.; Domenici, P. Physiology-based modeling approaches to characterize fish habitat suitability: Their usefulness and limitations. Estuar. Coast. Shelf Sci. 2015, 201, 56–63. [Google Scholar] [CrossRef]
- Claireaux, G.; Lagardère, J.-P. Influence of temperature, oxygen and salinity on the metabolism of the European sea bass. J. Sea Res. 1999, 42, 157–168. [Google Scholar] [CrossRef]
- Portner, H.O. Oxygen- and capacity-limitation of thermal tolerance: A matrix for integrating climate-related stressor effects in marine ecosystems. J. Exp. Biol. 2010, 213, 881–893. [Google Scholar] [CrossRef] [PubMed]
- Jutfelt, F.; Norin, T.; Ern, R.; Overgaard, J.; Wang, T.; McKenzie, D.J.; Lefevre, S.; Nilsson, G.E.; Metcalfe, N.B.; Hickey, A.J.R.; et al. Oxygen- and capacity-limited thermal tolerance: Blurring ecology and physiology. J. Exp. Biol. 2018, 221, jeb169615. [Google Scholar] [CrossRef] [PubMed]
- Allen, M.R.; Barros, V.R.; Broome, J.; Cramer, W.; Christ, R.; Church, J.A.; Clarke, L.; Dahe, Q.; Dasgupta, P.; Dubash, N.K. IPCC Fifth Assessment Synthesis Report-Climate Change 2014 Synthesis Report; Intergovernmental Panel on Climate Change: Geneva, Switzerland, 2014. [Google Scholar]
- Esbaugh, A.J. Physiological implications of ocean acidification for marine fish: Emerging patterns and new insights. J. Comp. Physiol. B 2018, 188, 1–13. [Google Scholar] [CrossRef] [PubMed]
- Munday, P.L.; McCormick, M.I.; Nilsson, G.E. Impact of global warming and rising CO2 levels on coral reef fishes: What hope for the future? J. Exp. Biol. 2012, 215, 3865–3873. [Google Scholar] [CrossRef] [PubMed]
- Rummer, J.L.; Stecyk, J.A.; Couturier, C.S.; Watson, S.A.; Nilsson, G.E.; Munday, P.L. Elevated CO2 enhances aerobic scope of a coral reef fish. Conserv. Physiol. 2013, 1, cot023. [Google Scholar] [CrossRef] [PubMed]
- Morley, J.W.; Selden, R.L.; Latour, R.J.; Frölicher, T.L.; Seagraves, R.J.; Pinsky, M.L. Projecting shifts in thermal habitat for 686 species on the North American continental shelf. PLoS ONE 2018, 13, e0196127. [Google Scholar] [CrossRef] [PubMed]
- Morash, A.J.; Neufeld, C.; MacCormack, T.J.; Currie, S. The importance of incorporating natural thermal variation when evaluating physiological performance in wild species. J. Exp. Biol. 2018, 221, jeb164673. [Google Scholar] [CrossRef] [PubMed] [Green Version]
- Baumann, H.; Smith, E.M. Quantifying Metabolically Driven pH and Oxygen Fluctuations in US Nearshore Habitats at Diel to Interannual Time Scales. Estuar. Coasts 2017, 41, 1102–1117. [Google Scholar] [CrossRef]
- Baumann, H.; Wallace, R.B.; Tagliaferri, T.; Gobler, C.J. Large Natural pH, CO2 and O2 Fluctuations in a Temperate Tidal Salt Marsh on Diel, Seasonal, and Interannual Time Scales. Estuar. Coasts 2014, 38, 220–231. [Google Scholar] [CrossRef]
- Breitberg, D. Near-shore Hypoxia in the Chesapeake Bay: Patterns and Relationships among Physical Factors. Estuar. Coast. Shelf Sci. 1990, 30, 593–609. [Google Scholar] [CrossRef]
- Norin, T.; Metcalfe, N.B. Ecological and evolutionary consequences of metabolic rate plasticity in response to environmental change. Philos. Trans. R. Soc. B 2019, 374, 20180180. [Google Scholar] [CrossRef] [PubMed] [Green Version]
- Fangue, N.A.; Flaherty, K.E.; Rummer, J.L.; Cole, G.; Hansen, K.S.; Hinote, R.; Noel, B.L.; Wallman, H.; Bennett, W.A. Temperature and hypoxia tolerance of selected fishes from a hyperthermal rockpool in the Dry Torgugas, with notes on diversity and behavior. Carribean J. Sci. 2001, 37, 81–87. [Google Scholar]
- Hickling, R.; Roy, D.B.; Hill, J.K.; Fox, R.; Thomas, C.D. The distributions of a wide range of taxonomic groups are expanding polewards. Glob. Chang. Biol. 2006, 12, 450–455. [Google Scholar] [CrossRef]
- Nye, J.A.; Link, J.S.; Hare, J.A.; Overholtz, W.J. Changing spatial distribution of fish stocks in relation to climate and population size on the Northeast United States continental shelf. Mar. Ecol. Prog. Ser. 2009, 393, 111–129. [Google Scholar] [CrossRef] [Green Version]
- Schulte, P.M. The effects of temperature on aerobic metabolism: Towards a mechanistic understanding of the responses of ectotherms to a changing environment. J. Exp. Biol. 2015, 218, 1856–1866. [Google Scholar] [CrossRef] [PubMed]
- Clarke, A.; Johnston, N.M. Scaling of metabolic rate with body mass and temperature in teleost fish. J. Anim. Ecol. 1999, 68, 893–905. [Google Scholar] [CrossRef]
- Fry, F.E.J. Effect of the environment on animal activity. Publ. Out. Fish. Res. Lab. 1947, 68, 1–62. [Google Scholar]
- Bernal, D.; Lowe, C.G. Field Studies of Elasmobranch Physiology. In Physiology of Elasmobranch Fishes: Structure and Interaction with Environment; Shadwich, R.E., Farrell, A.P., Brauner, C.J., Eds.; Elsevier Inc.: San Diego, CA, USA, 2016; Volume 34, pp. 311–377. [Google Scholar]
- Saba, V.S.; Griffies, S.M.; Anderson, W.G.; Winton, M.; Alexander, M.A.; Delworth, T.L.; Hare, J.A.; Harrison, M.J.; Rosati, A.; Vecchi, G.A.; et al. Enhanced warming of the Northwest Atlantic Ocean under climate change. J. Geophys. Res. Ocean. 2016, 121, 118–132. [Google Scholar] [CrossRef]
- Atkinson, L.P.; Lee, T.N.; Blanton, J.O.; Chandler, W.S. Climatology of the southeastern United States continental shelf waters. J. Geophys. Res. Ocean. 1983, 88, 4705–4718. [Google Scholar] [CrossRef] [Green Version]
- Breitberg, D.; Salisbury, J.; Bernhard, J.; Cai, W.-J.; Dupont, S.; Doney, S.; Kroeker, K.; Levin, L.; Long, C.; Milke, L.; et al. And on Top of All That: Coping with Ocean Acidification in the Midst of Many Stressors. Oceanography 2015, 28, 48–61. [Google Scholar] [CrossRef]
- Cochran, R.E.; Burnett, L.E. Respiratory responses of the salt marsh animals, Fundulus heteroclitus, Leiostomus xanthurus, and Palaemonetes pugio to environmental hypoxia and hypercapnia and to the organophosphate pesticide, azinphosmethyl. J. Exp. Mar. Biol. Ecol. 1996, 195, 125–144. [Google Scholar] [CrossRef]
- Diaz, R.J.; Breitburg, D.L. The hypoxic environment. Fish Physiol. 2009, 27, 1–23. [Google Scholar]
- Breitberg, D.L.; Craig, J.K.; Fulford, R.S.; ROse, K.A.; Boynton, W.R.; Brady, D.C.; Ciotti, B.J.; Diaz, R.J.; Friedland, K.D.; Hagy III, J.D.; et al. Nutrient enrichment and fisheries exploitation: Interactive effects on estuarine living resources and their managment. Hydrobiologia 2009, 629, 31–47. [Google Scholar] [CrossRef]
- Packer, D.B.; Zetlin, C.A.; Vitaliano, J.J. Clearnose Skate, Raja Eglanteria, Life History and Habitat Characteristics; NOAA, N., Northeast Fisheries Science Center, Eds.; Northeast Fisheries Science Center, NOAA: Woods Hole, MA, USA, 2003.
- McEachran, J.D.; Musick, J.A. Distribution and relative abundance of seven species of skates (Pisces: Rajidae) which occur between Nova Scotia and Cape Hatteras. Fish. Bull. 1975, 73, 110–1336. [Google Scholar]
- Schwartz, F.J. Biology of the clearnose skate, raja eglanteria, from North Carolina. Fla. Sci. 1996, 59, 82–95. [Google Scholar]
- Buchheister, A.; Latour, R.J. Turnover and fractionation of carbon and nitrogen stable isotopes in tissues of a migratory coastal predator, summer flounder (Paralichthys dentatus). Can. J. Fish. Aquat. Sci. 2010, 67, 445–461. [Google Scholar] [CrossRef]
- Scott, W.; Scott, M. Atlantic Fishes of Canada Canadian Bulletin of Fisheries and Aquatic Science, 219; University of Toronto Press: Toronto, ON, Canada, 1988. [Google Scholar]
- Petrie, B.; Drinkwater, K. Temperature and salinity variability on the Scotian Shelf and in the Gulf of Maine 1945–1990. J. Geophys. Res. 1993, 98, 20079–20089. [Google Scholar] [CrossRef]
- Swain, D.P.; Benoit, H.P. Change in habitat associations and geographic distribution of thorny skate (Amblyraja radiata) in the southern Gulf of St Lawrence: Density-dependent habitat selection or response to environmental change? Fish. Oceanogr. 2006, 15, 166–182. [Google Scholar] [CrossRef]
- Cicia, A.M.; Schlenker, L.S.; Sulikowski, J.A.; Mandelman, J.W. Seasonal variations in the physiological stress response to discrete bouts of aerial exposure in the little skate, Leucoraja erinacea. Comp. Biochem. Physiol. A Mol. Integr. Physiol. 2012, 162, 130–138. [Google Scholar] [CrossRef]
- Capossela, K.M.; Brill, R.W.; Fabrizio, M.C.; Bushnell, P.G. Metabolic and cardiorespiratory responses of summer flounder Paralichthys dentatus to hypoxia at two temperatures. J. Fish Biol. 2012, 81, 1043–1058. [Google Scholar] [CrossRef]
- Najjar, R.; Patterson, L.; Graham, S. Climate simulations of major estuarine watersheds in the Mid-Atlantic region of the US. Clim. Chang. 2008, 95, 139–168. [Google Scholar] [CrossRef]
- Najjar, R.G.; Pyke, C.R.; Adams, M.B.; Breitburg, D.; Hershner, C.; Kemp, M.; Howarth, R.; Mulholland, M.R.; Paolisso, M.; Secor, D.; et al. Potential climate-change impacts on the Chesapeake Bay. Estuar. Coast. Shelf Sci. 2010, 86, 1–20. [Google Scholar] [CrossRef]
- Rogers, N.J.; Urbina, M.A.; Reardon, E.E.; McKenzie, D.J.; Wilson, R.W. A new analysis of hypoxia tolerance in fishes using a database of critical oxygen level (P crit). Conserv. Physiol. 2016, 4, cow012. [Google Scholar] [CrossRef]
- Schurmann, H.; Steffensen, J. Effects of temperature, hypoxia and activity on the metabolism of juvenile Atlantic cod. J. Fish Biol. 1997, 50, 1166–1180. [Google Scholar]
- Michaelidis, B.; Spring, A.; Pörtner, H.O. Effects of long-term acclimation to environmental hypercapnia on extracellular acid–base status and metabolic capacity in Mediterranean fish Sparus aurata. Mar. Biol. 2007, 150, 1417–1429. [Google Scholar] [CrossRef]
- Dickson, A.G.; Sabine, C.L.; Christian, J.R. Guide to Best Practices for Ocean CO2 Measurements; North Pacific Marine Science Organization: Sidney, BC, Canada, 2007. [Google Scholar]
- Pierrot, D.; Lewis, E.; Wallace, D. MS Excel program developed for CO2 system calculations. In ORNL/CDIAC-105a; Carbon Dioxide Information Analysis Center, Oak Ridge National Laboratory, US Department of Energy: Oak Ridge, TN, USA, 2006; Volume 3. [Google Scholar]
- Mehrbach, C.; Culberson, C.; Hawley, J.; Pytkowicx, R. Measurement of the apparent dissociation constants of carbonic acid in seawater at atmospheric pressure 1. Limnol. Oceanogr. 1973, 18, 897–907. [Google Scholar] [CrossRef]
- Dickson, A.; Millero, F.J. A comparison of the equilibrium constants for the dissociation of carbonic acid in seawater media. Deep Sea Res. Part A Oceanogr. Res. Pap. 1987, 34, 1733–1743. [Google Scholar] [CrossRef]
- Lapointe, D.; Vogelbein, W.K.; Fabrizio, M.C.; Gauthier, D.T.; Brill, R.W. Temperature, hypoxia, and mycobacteriosis: Effects on adult striped bass Morone saxatilis metabolic performance. Dis. Aquat. Org. 2014, 108, 113–127. [Google Scholar] [CrossRef]
- Kenward, M.G.; Roger, J.H. Small sample inference for fixed effects from restricted maximum likelihood. Biometrics 1997, 983–997. [Google Scholar] [CrossRef]
- Cai, W.-J.; Hu, X.; Huang, W.-J.; Murrell, M.C.; Lehrter, J.C.; Lohrenz, S.E.; Chou, W.-C.; Zhai, W.; Hollibaugh, J.T.; Wang, Y.; et al. Acidification of subsurface coastal waters enhanced by eutrophication. Nat. Geosci. 2011, 4, 766–770. [Google Scholar] [CrossRef]
- Tzortziou, M.; Neale, P.J.; Megonigal, J.P.; Pow, C.L.; Butterworth, M. Spatial gradients in dissolved carbon due to tidal marsh outwelling into a Chesapeake Bay estuary. Mar. Ecol. Prog. Ser. 2011, 426, 41–56. [Google Scholar] [CrossRef]
- Signorini, S.R.; Mannino, A.; Najjar, R.G.; Friedrichs, M.A.; Cai, W.J.; Salisbury, J.; Wang, Z.A.; Thomas, H.; Shadwick, E. Surface ocean pCO2 seasonality and sea-air CO2 flux estimates for the North American east coast. J. Geophys. Res. Ocean. 2013, 118, 5439–5460. [Google Scholar] [CrossRef]
- Cai, W.J.; Hu, X.; Huang, W.J.; Jiang, L.Q.; Wang, Y.; Peng, T.H.; Zhang, X. Alkalinity distribution in the western North Atlantic Ocean margins. J. Geophys. Res. Ocean. 2010, 115. [Google Scholar] [CrossRef] [Green Version]
- Marcek, B. Individual- and Population-Level Effects of Temperature and Hypoxia on Two Demersal Fishes in Chesapeake Bay; College of William and Mary, Virginia Institute of Marine Science: Gloucester Point, VA, USA, 2018. [Google Scholar]
- Steinhausen, M.F.; Steffensen, J.F.; Andersen, N.G. Tail beat frequency as a predictor of swimming speed and oxygen consumption of saithe (Pollachius virens) and whiting (Marlangius merlangus) during forced swimming. Mar. Biol. 2005, 148, 197–204. [Google Scholar] [CrossRef]
- Esbaugh, A.J.; Heuer, R.; Grosell, M. Impacts of ocean acidification on respiratory gas exchange and acid–base balance in a marine teleost, Opsanus beta. J. Comp. Physiol. B 2012, 182, 921–934. [Google Scholar] [CrossRef]
- Heinrich, D.D.U.; Rummer, J.L.; Morash, A.J.; Watson, S.A.; Simpfendorfer, C.A.; Heupel, M.R.; Munday, P.L. A product of its environment: The epaulette shark (Hemiscyllium ocellatum) exhibits physiological tolerance to elevated environmnetal CO2. Conserv. Physiol. 2014, 2, cou047. [Google Scholar] [CrossRef]
- Green, L.; Jutfelt, F. Elevated carbon dioxide alters the plasma composition and behaviour of a shark. Biol. Lett. 2014, 10, 20140538. [Google Scholar] [CrossRef]
- Bouyoucos, I.A.; Simpfendorfer, C.A.; Rummer, J.L. Estimating oxygen uptake rates to understand stress in sharks and rays. Rev. Fish Biol. Fish. 2019, 29, 297–311. [Google Scholar] [CrossRef]
- Perry, S.; McKendry, J. The relative roles of external and internal CO2 versus H+ in eliciting the cardiorespiratory responses of Salmo salar and Squalus acanthias to hypercarbia. J. Exp. Biol. 2001, 204, 3963–3971. [Google Scholar]
- Perry, S.F.; Gilmour, K.M. Sensing and transfer of respiratory gases at the fish gill. J. Exp. Zool. 2002, 293, 249–263. [Google Scholar] [CrossRef]
- Ishimatsu, A.; Kikkawa, T.; Hayashi, M.; Lee, K.-S.; Kita, J. Effects of CO2 on marine fish: Larvae and adults. J. Oceanogr. 2004, 60, 731–741. [Google Scholar] [CrossRef]
- Nagelkerken, I.; Munday, P.L. Animal behaviour shapes the ecological effects of ocean acidification and warming: Moving from individual to community-level responses. Glob. Chang. Biol. 2016, 22, 974–989. [Google Scholar] [CrossRef]
- Pörtner, H.O.; Knust, R. Climate Change Affects Marine Fishes through the Oxygen Limitation of Thermal Tolerance. Science 2006, 315, 95–97. [Google Scholar]
- Heuer, R.; Welch, M.; Rummer, J.; Munday, P.; Grosell, M. Altered brain ion gradients following compensation for elevated CO2 are linked to behavioural alterations in a coral reef fish. Sci. Rep. 2016, 6, 33216. [Google Scholar] [CrossRef]
- Stapp, L.S.; Kreiss, C.M.; Portner, H.O.; Lannig, G. Differential impacts of elevated CO2 and acidosis on the energy budget of gill and liver cells from Atlantic cod, Gadus morhua. Comp. Biochem. Physiol. A Mol. Integr. Physiol. 2015, 187, 160–167. [Google Scholar] [CrossRef]
- Portner, H.O.; Langenbuch, M.; Reipschlager, A. Biological Impact of Elevated Ocean CO2 Concentrations: Lessons from Animal Physiology and Earth History. J. Oceanogr. 2004, 60, 705–718. [Google Scholar] [CrossRef]
- Sackville, M.A.; Shartau, R.B.; Damsgaard, C.; Hvas, M.; Phuong, L.M.; Wang, T.; Bayley, M.; Huong, D.T.T.; Phuong, N.T.; Brauner, C.J. Water pH limits extracellular but not intracellular pH compensation in the CO2 tolerant freshwater fish, Pangasianodon hypophthalmus. J. Exp. Biol. 2018, 221, jeb190413. [Google Scholar] [CrossRef]
- Burnett, L.E. The challenges of living in hypoxic and hypercapnic aquatic environments. Am. Zool. 1997, 37, 633–640. [Google Scholar] [CrossRef]
- Hochachka, P.W.; Somero, G.N. Biochemical Adaptation: Mechanisms and Process in Physiological Evolution; Oxford University Press: Oxford, UK, 2002. [Google Scholar]
- Turingan, R.; Sloan, T. Thermal Resilience of Feeding Kinematics May Contribute to the Spread of Invasive Fishes in Light of Climate Change. Biology 2016, 5, 46. [Google Scholar] [CrossRef]
- Rummer, J.L.; Couturier, C.S.; Stecyk, J.A.; Gardiner, N.M.; Kinch, J.P.; Nilsson, G.E.; Munday, P.L. Life on the edge: Thermal optima for aerobic scope of equatorial reef fishes are close to current day temperatures. Glob. Chang. Biol. 2014, 20, 1055–1066. [Google Scholar] [CrossRef]
- Hofmann, G.E.; Todgham, A.E. Living in the now: Physiological mechanisms to tolerate a rapidly changing environment. Annu. Rev. Physiol. 2010, 72, 127–145. [Google Scholar] [CrossRef]
- Clarke, A.; Fraser, K.P.P. Why does metabolism scale with temperature? Funct. Ecol. 2004, 18, 243–251. [Google Scholar] [CrossRef] [Green Version]
- Clarke, A. Is there a universal temperature dependence of metabolism? Funct. Ecol. 2004, 18, 252–256. [Google Scholar] [CrossRef]
- Feder, M.E.; Hofmann, G.E. Heat-shock proteins, molecular chaperones, and the stress response: Evolutionary and ecological physiology. Annu. Rev. Physiol. 1999, 61, 243–282. [Google Scholar] [CrossRef]
- Kultz, D. Molecular and evolutionary basis of the cellular stress response. Annu. Rev. Physiol. 2005, 67, 225–257. [Google Scholar] [CrossRef]
- Claireaux, G.; Webber, D.M.; Lagardère, J.P.; Kerr, S.R. Influence of water temperature and oxygenation on the aerobic metabolic scope of Atlantic cod (Gadus morhua). J. Sea Res. 2000, 44, 257–265. [Google Scholar] [CrossRef]
- Peake, S.; Farrell, A. Fatigue is a behavioural response in respirometer-confined smallmouth bass. J. Fish Biol. 2006, 68, 1742–1755. [Google Scholar] [CrossRef]
- Melzner, F.; Gutowska, M.; Langenbuch, M.; Dupont, S.; Lucassen, M.; Thorndyke, M.C.; Bleich, M.; Pörtner, H.-O. Physiological basis for high CO2 tolerance in marine ectothermic animals: Pre-adaptation through lifestyle and ontogeny? Biogeosciences 2009, 6, 2313–2331. [Google Scholar] [CrossRef]
- Hamilton, S.L.; Logan, C.A.; Fennie, H.W.; Sogard, S.M.; Barry, J.P.; Makukhov, A.D.; Tobosa, L.R.; Boyer, K.; Lovera, C.F.; Bernardi, G. Species-specific responses of juvenile rockfish to elevated pCO2: From behavior to genomics. PLoS ONE 2017, 12, e0169670. [Google Scholar] [CrossRef]
- Couturier, C.S.; Stecyk, J.A.; Rummer, J.L.; Munday, P.L.; Nilsson, G.E. Species-specific effects of near-future CO2 on the respiratory performance of two tropical prey fish and their predator. Comp. Biochem. Physiol. Part A: Mol. Integr. Physiol. 2013, 166, 482–489. [Google Scholar] [CrossRef]
- Gervais, C.R.; Nay, T.J.; Renshaw, G.; Johansen, J.L.; Steffensen, J.F.; Rummer, J.L. Too hot to handle? Using movement to alleviate effects of elevated temperatures in a benthic elasmobranch, Hemiscyllium ocellatum. Mar. Biol. 2018, 165, 162. [Google Scholar] [CrossRef]
- Pistevos, J.C.; Nagelkerken, I.; Rossi, T.; Olmos, M.; Connell, S.D. Ocean acidification and global warming impair shark hunting behaviour and growth. Sci. Rep. 2015, 5, 16293. [Google Scholar] [CrossRef] [Green Version]
- Dulvy, N.K.; Reynolds, J.D. Predicting Extinction Vulnerability in Skates. Conserv. Biol. 2002, 16, 440–450. [Google Scholar] [CrossRef] [Green Version]
- Rosa, R.; Baptista, M.; Lopes, V.M.; Pegado, M.R.; Paula, J.R.; Trubenbach, K.; Leal, M.C.; Calado, R.; Repolho, T. Early-life exposure to climate change impairs tropical shark survival. Proc. R. Soc. B Biol. Sci. 2014, 281, 20141738. [Google Scholar] [CrossRef] [Green Version]
- Di Santo, V. Ocean acidification exacerbates the impacts of global warming on embryonic little skate, Leucoraja erinacea (Mitchill). J. Exp. Mar. Biol. Ecol. 2015, 463, 72–78. [Google Scholar] [CrossRef]
- Speers-Roesch, B.; Brauner, C.J.; Farrell, A.P.; Hickey, A.J.; Renshaw, G.M.; Wang, Y.S.; Richards, J.G. Hypoxia tolerance in elasmobranchs. II. Cardiovascular function and tissue metabolic responses during progressive and relative hypoxia exposures. J. Exp. Biol. 2012, 215, 103–114. [Google Scholar] [CrossRef] [Green Version]
- Nilsson, G.E.; Renshaw, G.M. Hypoxic survival strategies in two fishes: Extreme anoxia tolerance in the North European crucian carp and natural hypoxic preconditioning in a coral-reef shark. J. Exp. Biol. 2004, 207, 3131–3139. [Google Scholar] [CrossRef]
- Routley, M.H.; Nilsson, G.E.; Renshaw, G.M. Exposure to hypoxia primes the prespiratory and metabolic responses of the epaulette shark to progressive hypoxia. Comp. Biochem. Physiol. Part A: Mol. Integr. Physiol. 2002, 131, 313–321. [Google Scholar] [CrossRef]
- Brill, R.W.; Lai, N.C. Elasmobranch Cardiovascular System; Academic Press: New York, NY, USA, 2016. [Google Scholar]
- Chapman, C.A.; Renshaw, G.M. Hematological responses of the grey carpet shark (Chiloscyllium punctatum) and the epaulette shark (Hemiscyllium ocellatum) to anoxia and re-oxygenation. J. Exp. Zool. Part A Ecol. Genet. Physiol. 2009, 311, 422–438. [Google Scholar] [CrossRef]
- Heinrich, D.D.U.; Watson, S.-A.; Rummer, J.L.; Brandl, S.J.; Simpfendorfer, C.A.; Heupel, M.R.; Munday, P.L. Foraging behaviour of the epaulette shark Hemiscyllium ocellatumis not affected by elevated CO2. ICES J. Mar. Sci. 2016, 73, 633–640. [Google Scholar] [CrossRef]
- Johnson, M.S.; Kraver, D.W.; Renshaw, G.M.; Rummer, J.L. Will ocean acidification affect the early ontogeny of a tropical oviparous elasmobranch (Hemiscyllium ocellatum)? Conserv. Physiol. 2016, 4, cow003. [Google Scholar] [CrossRef]
- Shaw, E.C.; McNeil, B.I.; Tilbrook, B.; Matear, R.; Bates, M.L. Anthropogenic changes to seawater buffer capacity combined with natural reef metabolism induce extreme future coral reef CO2 conditions. Glob. Chang. Biol. 2013, 19, 1632–1641. [Google Scholar] [CrossRef]
- Brill, R.W.; Bushnell, P.G.; Elton, T.A.; Small, H.J. The ability of blue crab (Callinectes sapidus, Rathbun 1886) to sustain aerobic metabolism during hypoxia. J. Exp. Mar. Biol. Ecol. 2015, 471, 126–136. [Google Scholar] [CrossRef]
- Dennison, W.; Carruthers, T.; Thomas, J.; Glibert, P. A comparison of issues and management approaches in Moreton Bay, Australia and Chesapeake Bay, USA. In Wetlands Ecosystems in Asia; Elsevier: Amsterdam, The Netherlands, 2004. [Google Scholar]
- Strobel, A.; Bennecke, S.; Leo, E.; Mintenbeck, K.; Pörtner, H.O.; Mark, F.C. Metaboic shifts in the Antarctic fish Notothenia rossii in response to rising temperature and pCO2. Front. Zool. 2012, 9, 28. [Google Scholar] [CrossRef]
- Esbaugh, A.J.; Ern, R.; Nordi, W.M.; Johnson, A.S. Respiratory plasticity is insufficient to alleviate blood acid-base disturbances after acclimation to ocean acidification in the estuarine red drum, Sciaenops ocellatus. J. Comp. Physiol. B 2016, 186, 97–109. [Google Scholar] [CrossRef]
- Hopkins, T.E.; Cech, J.J., Jr. Effect of temperature on oxygen consumption of the bat ray, Myliobatis californica (Chondrichthyes, Myliobatididae). Copeia 1994, 1994, 529–532. [Google Scholar] [CrossRef]
- Weber, R.E.; de Wilde, J.A.M. Oxygenation properties of haemoglobins from the flatfish plaice (Pleuronectes platessa) and flounder (Platichthys flesus). J. Comp. Physiol. 1975, 101, 99–110. [Google Scholar] [CrossRef]
- Cruz-Neto, A.; Steffensen, J. The effects of acute hypoxia and hypercapnia on oxygen consumption of the freshwater European eel. J. Fish Biol. 1997, 50, 759–769. [Google Scholar] [CrossRef]
- Rogers, N. Chapter 4: Respiratory responses in gut carbonate production during hypoxia and hypercarbia in the European flounder (Platichthys flesus). In The Respiratory and Gut Physiology of Fish: Responses to Environmental Change; University of Exeter: Exeter, UK, 2015; pp. 95–139, University of Exeter: Exeter, UK, 2015. [Google Scholar]
- Ultsch, G.R.; Ott, M.E.; Heisler, N. Standard metabolic rate, critical oxygen tension, and aerobic scope for spontaneous activity of trout (Salmo gairdneri) and carp (Cyprinus carpio) in acidified water. Comp. Biochem. Physio. A 1980, 67, 329–335. [Google Scholar] [CrossRef]
- Breitburg, D.; Levin, L.A.; Oschlies, A.; Gregoire, M.; Chavez, F.P.; Conley, D.J.; Garcon, V.; Gilbert, D.; Gutierrez, D.; Isensee, K.; et al. Declining oxygen in the global ocean and coastal waters. Science 2018, 359, eaam7240. [Google Scholar] [CrossRef] [Green Version]
- Miller, S.H.; Breitburg, D.L.; Burrell, R.B.; Keppel, A.G. Acidification increases sensitivity to hypoxia in important forage fishes. Mar. Ecol. Prog. Ser. 2016, 549, 1–8. [Google Scholar] [CrossRef] [Green Version]
- Petrie, B.; Yeats, P. Annual and internannual variability of nutriends and their estimated fluxes in the Scotian Shelf- Gulf of Maine region. Can. J. Fish. Aquat. Sci. 2000, 57, 2536–2546. [Google Scholar] [CrossRef]
- Metcalfe, J.D.; Butler, P.J. Changes in activity and ventilation in response to hypoxia in unrestrained, unoperated dogfish (Scyliorhinus canicula L.). J. Exp. Biol. 1984, 108, 411–418. [Google Scholar]
- Parsons, G.R.; Carlson, J.K. Physiological and behavioral responses to hypoxia in the bonnethead shark, Sphyrna tiburo: Routine swimming and respiratory regulation. Fish Physiol. Biochem. 1998, 19, 189–196. [Google Scholar] [CrossRef]
- Wood, C.M. The fallacy of the Pcrit – are there more useful alternatives? J. Exp. Biol. 2018, 221, jeb163717. [Google Scholar] [CrossRef]
- Regan, M.D.; Mandic, M.; Dhillon, R.S.; Lau, G.Y.; Farrell, A.P.; Schulte, P.M.; Seibel, B.A.; Speers-Roesch, B.; Ultsch, G.R.; Richards, J.G. Don’t throw the fish out with the respirometry water. J. Exp. Biol. 2019, 222. [Google Scholar] [CrossRef]


| Species | pCO2 Treatment | Salinity (ppm) | pH | Alkalinity (μmol kg−1) | pCO2 (μatm) |
|---|---|---|---|---|---|
| Clearnose skate | Present day | 30 ± 0.3 | 7.84 ± 0.02 * | 2317 ± 17 | 703 ± 33 * |
| Elevated | 30 ± 0.6 | 7.44 ± 0.04 * | 2285 ± 14 | 2290 ± 262 * | |
| Summer flounder | Present day | 31 ± 0.5 | Unknown | Unknown | Unknown |
| Elevated | 29 ± 0.4 | 7.46 ± 0.06 * | 2258 ± 11 | 2204 ± 301 * | |
| Thorny skate | Present day | 33 ± 0.7 | 7.87 ± 0.04 | 2151 ± 17 | 569 ± 57 * |
| Elevated | 33 ± 0.3 | 7.45 ± 0.05 | 2155 ± 10 | 2111 ± 204 * |
| Q10 | |||
|---|---|---|---|
| Species | Temperature | Present Day pCO2 | Elevated pCO2 |
| Clearnose Skate | 20–28 °C | 1.71 | |
| 20–24 °C | 1.62 | 0.78 | |
| Summer Flounder | 22–30 °C | 2.45* | 1.07 |
| Thorny Skate | 5–13 °C | 2.56 | |
| 5–9 °C | 3.87 | 2.34 | |
© 2019 by the authors. Licensee MDPI, Basel, Switzerland. This article is an open access article distributed under the terms and conditions of the Creative Commons Attribution (CC BY) license (http://creativecommons.org/licenses/by/4.0/).
Share and Cite
Schwieterman, G.D.; Crear, D.P.; Anderson, B.N.; Lavoie, D.R.; Sulikowski, J.A.; Bushnell, P.G.; Brill, R.W. Combined Effects of Acute Temperature Change and Elevated pCO2 on the Metabolic Rates and Hypoxia Tolerances of Clearnose Skate (Rostaraja eglanteria), Summer Flounder (Paralichthys dentatus), and Thorny Skate (Amblyraja radiata). Biology 2019, 8, 56. https://doi.org/10.3390/biology8030056
Schwieterman GD, Crear DP, Anderson BN, Lavoie DR, Sulikowski JA, Bushnell PG, Brill RW. Combined Effects of Acute Temperature Change and Elevated pCO2 on the Metabolic Rates and Hypoxia Tolerances of Clearnose Skate (Rostaraja eglanteria), Summer Flounder (Paralichthys dentatus), and Thorny Skate (Amblyraja radiata). Biology. 2019; 8(3):56. https://doi.org/10.3390/biology8030056
Chicago/Turabian StyleSchwieterman, Gail D., Daniel P. Crear, Brooke N. Anderson, Danielle R. Lavoie, James A. Sulikowski, Peter G. Bushnell, and Richard W. Brill. 2019. "Combined Effects of Acute Temperature Change and Elevated pCO2 on the Metabolic Rates and Hypoxia Tolerances of Clearnose Skate (Rostaraja eglanteria), Summer Flounder (Paralichthys dentatus), and Thorny Skate (Amblyraja radiata)" Biology 8, no. 3: 56. https://doi.org/10.3390/biology8030056