
The Dynamics of Arrivals of Maine Migratory Breeding Birds: Results from a 24-Year Study


Abstract
1. Introduction
2. Materials and Methods
3. Results
4. Discussion
5. Conclusions
Acknowledgments
Conflicts of Interest
References
- Kingston, J. (Ed.) The Weather Journals of a Rutland Squire: Thomas Barker of Lyndon Hall; Rutland County Museum: Oakham, UK, 1988. [Google Scholar]
- Sparks, T.H.; Carey, P.D. The responses of species to climate over two centuries: An analysis of the Marsham phenological record, 1736–1947. J. Ecol. 1995, 83, 321–329. [Google Scholar] [CrossRef]
- Peñuelas, J.; Fillela, I.; Comas, P. Changed plant and animal life cycles from 1952 to 2000 in the Mediterranean region. Glob. Chang. Biol. 2002, 8, 531–544. [Google Scholar] [CrossRef]
- Cotton, P.A. Avian migration phenology and global climate change. Proc. Natl. Acad. Sci. USA 2003, 100, 12219–12222. [Google Scholar] [CrossRef] [PubMed]
- Both, C.; Artemyev, A.V.; Blaauw, B.; Cowie, R.J.; Dekhuijzen, A.J.; Eeva, T.; Enemar, A.; Gustafsson, L.; Ivankina, E.V.; Järviven, A.; et al. Large-scale geographical variation confirms that climate change causes birds to lay earlier. Proc. R. Soc. Lond. 2004, 271, 1657–1662. [Google Scholar] [CrossRef] [PubMed]
- Wilson, W.H., Jr.; Savage, A.; Zierzow, R.E. Arrival dates of migratory breeding birds in Maine: Results from a volunteer network. Northeast. Nat. 1997, 4, 83–92. [Google Scholar] [CrossRef]
- Bradley, N.L.; Leopold, A.C.; Ross, J.; Huffaker, W. Phenological changes reflect climate change in Wisconsin. Proc. Natl. Acad. Sci. USA 1999, 96, 9701–9704. [Google Scholar] [CrossRef] [PubMed]
- Sparks, T.H. Phenology and the changing pattern of bird migration in Britain. Int. J. Biometeorol. 1999, 42, 134–138. [Google Scholar] [CrossRef]
- Dunn, P.O.; Winkler, D.W. Climate change has affected the breeding date of tree swallows throughout North America. Proc. R. Soc. Lond. 1999, 266, 2487–2490. [Google Scholar] [CrossRef]
- Sparks, T.H.; Huber, K.; Bland, R.L.; Crick, H.P.Q.; Croxton, P.J.; Flood, R.G.; Loxton, C.F.; Mason, J.A.; Newnha, J.A.; Tryjanowski, P. How consistent are trends in arrival (and departure) dates of migrant birds in the UK? J. Field Ornithol. 2007, 148, 503–511. [Google Scholar] [CrossRef]
- Wilson, W.H., Jr. Variability of arrival dates of Maine migratory breeding birds: Implications for detecting climate change. Northeast. Nat. 2009, 16, 443–454. [Google Scholar] [CrossRef]
- McMahon, J.S. Benchmarks in a changing landscape. Ecological reserves: A missing link in Maine’s conservation agenda. Habitat 1991, 8, 16–21. [Google Scholar]
- Mingo, T.M.; Dimond, J.B. Balsam fir (Abies balsamea) (L.) phenology in Maine. LSA Exp. Stn. Bull. 1979, 78, 400–414. [Google Scholar]
- Knight, O.W. The Birds of Maine; C.H. Glass Company: Bangor, ME, USA, 1908. [Google Scholar]
- Palmer, R.S. Maine Birds; Museum of Comparative Zoology, Harvard University: Cambridge, MA, USA, 1949. [Google Scholar]
- Wilson, W.H., Jr. Spring arrival dates of migratory breeding birds in Maine: Sensitivity to climate change. Wilson J. Ornithol. 2007, 119, 667–679. [Google Scholar] [CrossRef]
- Cade, B.S.; Noon, B.A. A gentle introduction to quantile regression for ecologists. Front. Ecol. Environ. 2003, 1, 412–420. [Google Scholar] [CrossRef]
- Ehrlich, P.; Dobkin, D.S.; Wheye, D. The Birder’s Handbook: A Field Guide to the Natural History of North American Birds; Touchstone Press: Beaverton, OR, USA, 1988. [Google Scholar]
- Benjamini, Y.; Yuketieli, S. The control of the false discovery rate in multiple testing under dependency. Ann. Stat. 1991, 29, 1165–1188. [Google Scholar]
- Butler, C.J. The disproportionate effect of global warming on the arrival dates of migratory birds in North America. Ibis 2003, 145, 484–495. [Google Scholar] [CrossRef]
- Ledneva, A.; Miller-Rushing, A.J.; Primack, R.B.; Imbres, C. Climate change as reflected in a naturalist’s diary, Middleborough, Massachusetts. Wilson Bull. 2004, 116, 224–231. [Google Scholar] [CrossRef]
- Vitale, J.; Schlesinger, W.H. Historical analysis of the spring arrival of migratory birds to Dutchess County, New York: A 123-Year record. Northeast. Nat. 2011, 18, 335–346. [Google Scholar] [CrossRef]
- Wilson, W.H., Jr.; Kipervaser, D.; Lilley, S.A. Spring arrival dates of Maine migratory breeding birds: 1994–1997 vs. 1899–1911. Northeast. Nat. 2000, 7, 1–6. [Google Scholar]
- Irland, L.C. Maine’s forest vegetation regions: Selected maps 1858–1993. Northeast. Nat. 1997, 4, 241–260. [Google Scholar] [CrossRef]
- Mills, A.M. Changes in the timing of spring and autumn migration in North American migrant passerines during a period of global warming. Ibis 2005, 147, 259–269. [Google Scholar] [CrossRef]
- Wilson, W.H., Jr. A deeper statistical examination of arrival dates of migratory breeding birds in relation to global climate change. Biology 2013, 2, 742–754. [Google Scholar] [CrossRef] [PubMed]
- Zelt, J.; Deleon, R.L.; Arab, A.; Laurent, K.; Snodgrass, J.W. Long-term trends in avian migration timing for the state of New York. Wilson J. Ornithol. 2017, 129, 271–282. [Google Scholar] [CrossRef]
- Knudsen, E.; Lindén, A.; Both, C.; Jonzén, N.; Pulido, F.; Saino, N.; Sutherland, W.J.; Bach, L.A.; Coppack, T.; Ergon, T.; et al. Challenging claims in the study of migratory birds and climate change. Biol. Rev. 2011, 86, 928–946. [Google Scholar] [CrossRef] [PubMed]


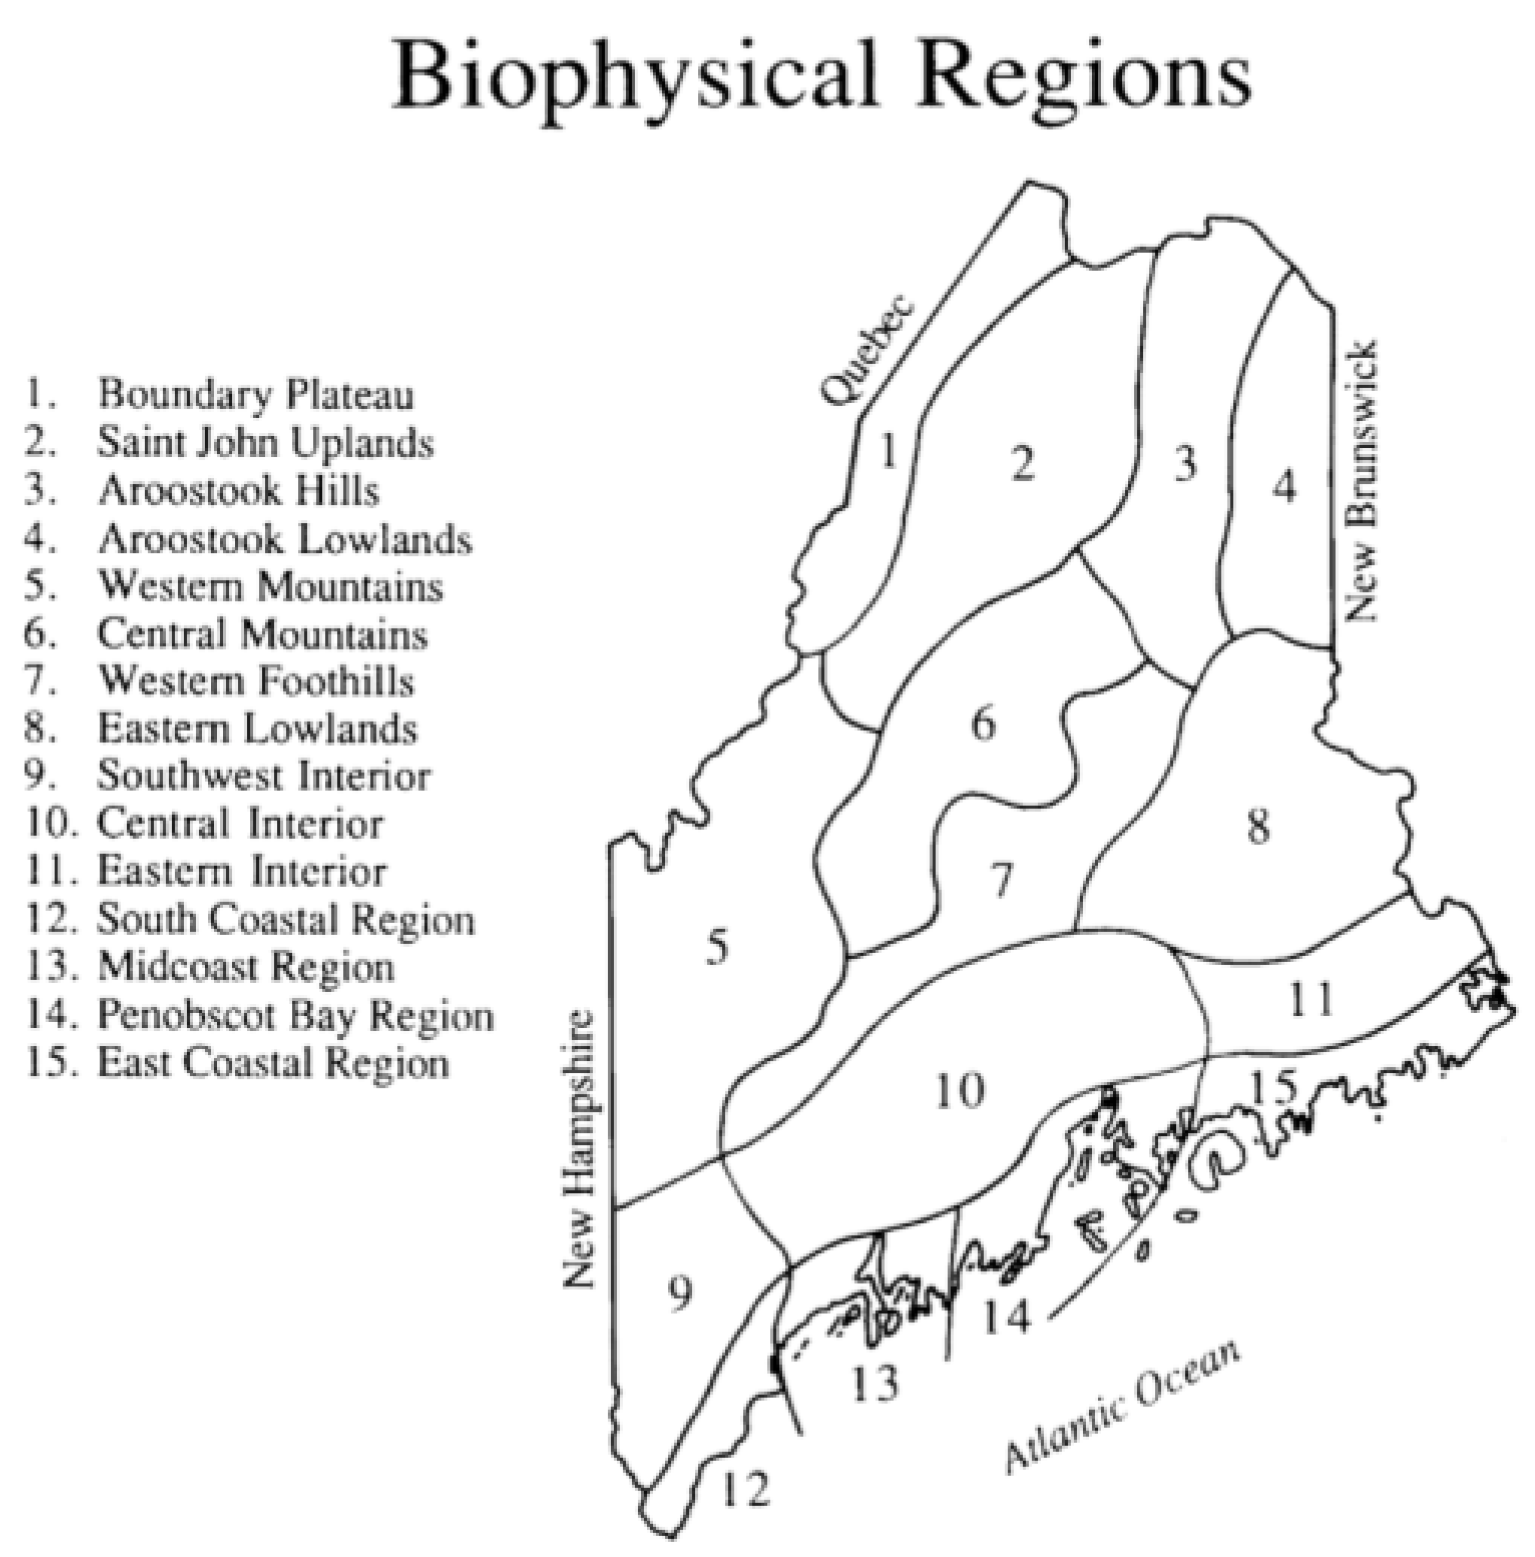
| Biophysical Region | Number of Observations |
|---|---|
| Ten | 19,895 |
| Twelve | 14,213 |
| Thirteen | 11.226 |
| Fourteen | 5182 |
| Fifteen | 4721 |
| Nine | 2434 |
| Seven | 2018 |
| Eleven | 1713 |
| Eight | 1451 |
| Five | 861 |
| One | 372 |
| Six | 128 |
| Two | 79 |
| Four | 42 |
| Three | 38 |
| Species | Ten | Twelve | Thirteen | Fourteen | Fifteen | Significance |
|---|---|---|---|---|---|---|
| Wood Duck (Aix sponsa) | 4/5 a | 4/8 a | 4/8 a | 4/11 b | 4/15 b | NS |
| Green-winged Teal (Anas crecca) | 4/6 a | 4/1 ab | 3/30 b | 4/8 bc | 4/16 c | * |
| Ring-necked Duck (Aythya collaris) | 4/3 a | 3/26 b | 3/29 ab | 4/2 ab | 4/13 c | * |
| Pied-billed Grebe (Podilymbus podiceps) | 4/18 ab | 4/8 b | 4/16 ab | 4/28 a | 4/15 ab | * |
| Black-billed Cuckoo (Coccyzus erythropthalmus) | 5/30 a | 5/25 a | 5/23 a | 5/25 a | NA | NS |
| Common Nighthawk (Chordeiles minor) | 5/24 a | 5/21 a | 5/23 a | 5/23 a | 5/28 a | NS |
| Eastern Whip-poor-will (Caprimulgus vociferus) | 5/24 a | 5/11 a | 5/15 a | 5/21 a | 5/25 a | NS |
| Chimney Swift (Chaetura pelagica) | 5/11 a | 5/11 a | 5/13 ab | 5/12 ab | 5/18 b | * |
| Ruby-throated Hummingbird (Archilochus colubris) | 5/12 a | 5/9 b | 5/10 b | 5/9 b | 5/11 ab | * |
| Virginia Rail (Rallus limicola) | 5/9 a | 5/8 a | 5/12 a | 5/4 a | 5/10 a | NS |
| Sora (Porzana carolina) | 5/12 a | 5/13 a | 5/12 a | 4/30 a | 5/17 a | NS |
| Wilson’s Snipe (Gallinago delicata) | 4/19 a | 4/18 a | 4/13 a | 4/24 a | 4/28 a | NS |
| American Woodcock (Scolopax minor) | 4/2 a | 3/28 a | 3/30 a | 3/27 a | 3/31 a | NS |
| Spotted Sandpiper (Actitis macularia) | 5/9 a | 5/11 a | 5/12 a | 5/18 b | 5/17 b | * |
| Least Tern (Sterna antillarum) | NA | 5/22 a | 5/27 a | 5/28 a | NA | NS |
| Common Tern (Sterna hirundo) | NA | 5/18 a | 5/21 a | 5/20 a | 5/27 a | NS |
| Arctic Tern (Sterna paradisaea) | NA | 5/31 a | 5/24 a | 5/30 a | 5/31 a | NS |
| Common Loon (Gavia immer) | 4/18 a | 4/18 a | 4/11 a | 4/14 a | 4/28 a | NS |
| American Bittern (Botaurus lentiginosus) | 4/29 a | 4/26 a | 4/25 a | 4/25 a | 5/4 a | NS |
| Great Blue Heron (Ardea herodias) | 4/14 a | 4/5 b | 4/5 b | 4/14 a | 4/16 a | * |
| Turkey Vulture (Catharus aura) | 3/29 a | 3/17 b | 3/21 ab | 3/24 a | 4/10 c | * |
| Osprey (Pandion haliaetus) | 4/14 a | 4/16 ac | 4/8 b | 4/14 a | 4/21 c | * |
| Broad-winged Hawk (Buteo platypterus) | 4/25 a | 4/26 a | 4/21 a | 4/25 a | 4/29 a | NS |
| Belted Kingfisher (Megaceryle torquatus) | 4/24 a | 4/12 b | 4/13 b | 4/20 a | 4/25 a | * |
| Yellow-bellied Sapsucker (Sphyrapicus varius) | 4/20 a | 4/17 a | 4/16 a | 4/24 a | 4/21 a | NS |
| Northern Flicker (Colaptes auratus) | 4/16 a | 4/5 b | 4/9 b | 4/11 b | 4/16 ab | * |
| American Kestrel (Falco sparverius) | 4/3 a | 4/6 ab | 4/7 b | 4/4 ab | 4/14 c | * |
| Olive-sided Flycatcher (Contopus cooperi) | 5/24 a | 5/24 a | 5/22 a | 5/25 a | 5/23 a | NS |
| Eastern Wood-Pewee (Contopus virens) | 5/24 ab | 5/22 a | 5/21 a | 5/27 b | 5/28 b | * |
| Yellow-bellied Flycatcher (Empidonax flaviventris) | 5/25 a | 5/24 a | 5/21 a | 5/24 a | 5/21 a | NS |
| Alder Flycatcher (Empidonax alnorum) | 5/24 a | 5/25 a | 5/23 a | 5/23 a | 5/25 a | NS |
| Willow Flycatcher (Empidonax trailii) | 5/24 a | 5/27 a | 5/27 a | 5/24 a | 5/24 a | NS |
| Least Flycatcher (Empidonax minimus) | 5/12 a | 5/14 a | 5/14 a | 5/16 a | 5/25 a | NS |
| Eastern Phoebe (Sayornis phoebe) | 4/9 a | 4/7 a | 4/8 a | 4/6 a | 4/16 b | * |
| Great Crested Flycatcher (Myiarchus crinitus) | 5/13 a | 5/11 a | 5/13 a | 5/14 a | 5/22 b | * |
| Eastern Kingbird (Tyrannus tyrannus) | 5/11 ab | 5/12 a | 5/14 ab | 5/12 b | 5/19 c | * |
| Philadelphia Vireo (Vireo pheladelphia) | 5/22 a | 5/19 a | 5/17 a | 5/24 a | 5/25 a | NS |
| Warbling Vireo (Vireo gilvus) | 5/12 a | 5/14 a | 5/13 a | 5/19 a | 5/16 a | NS |
| Red-eyed Vireo (Vireo olivaceus) | 5/18 a | 5/16 a | 5/18 a | 5/19 a | 5/26 b | * |
| Purple Martin (Progne subis) | 5/9 a | 5/6 a | 5/4 a | 4/29 a | 5/8 a | NS |
| Tree Swallow (Tachycineta bicolor) | 4/13 a | 4/13 a | 4/15 a | 4/16 a | 4/25 b | * |
| Bank Swallow (Riparia riparia) | 5/14 a | 5/16 a | 5/13 a | 5/13 a | 5/15 a | NS |
| Cliff Swallow (Hirundo pyrrhonota) | 5/11 a | 5/15 a | 5/10 a | 5/13 a | 5/19 a | NS |
| Barn Swallow (Hirundo rustica) | 5/3 a | 5/4 a | 5/2 a | 5/6 a | 5/7 a | NS |
| House Wren (Troglodytes aedon) | 5/8 a | 5/6 a | 5/9 a | 5/12 a | 5/18 a | NS |
| Winter Wren (Troglodytes troglodytes) | 4/24 a | 4/23 a | 4/20 a | 4/22 a | 4/22 a | NS |
| Blue-gray Gnatcatcher (Polioptila caerulea) | 5/6 a | 5/3 a | 5/4 a | 5/6 a | 5/7 a | NS |
| Ruby-crowned Kinglet (Regulus calendula) | 4/23 a | 4/22 a | 4/21 a | 4/20 a | 4/25 a | NS |
| Eastern Bluebird (Sialia sialis) | 4/10 a | 4/2 a | 4/8 a | 4/17 a | 5/11 a | NS |
| Veery (Catharus fuscescens) | 5/15 a | 5/13 a | 5/14 a | 5/17 a | 5/20 a | NS |
| Swainson’s Thrush (Catharus ustulatus) | 5/21 a | 5/15 b | 5/16 b | 5/16 b | 5/25 a | * |
| Hermit Thrush (Catharus guttatus) | 4/23 a | 4/22 a | 4/21 a | 4/23 a | 4/26 a | NS |
| American Robin (Turdus migratorius) | 3/18 a | 3/15 a | 3/15 a | 3/17 a | 3/26 b | * |
| Gray Catbird (Dumatella carolinensis) | 5/11 a | 5/6 b | 5/7 b | 5/12 a | 5/13 a | * |
| Brown Thrasher (Toxostoma rufum) | 5/7 a | 5/7 a | 5/8 a | 5/7 a | 5/13 a | NS |
| Ovenbird (Seiurus aurocapilla) | 5/8 a | 5/8 a | 5/8 a | 5/8 a | 5/12 b | * |
| Louisiana Waterthrush (Parkesia motacilla) | 5/7 a | 5/5 a | 5/1 a | 5/15 a | NA | NS |
| Northern Waterthrush (Parkesia novaeboracensis) | 5/8 a | 5/11 b | 5/7 a | 5/8 a | 5/19 c | * |
| Black-and-white Warbler (Mniotilta varia) | 5/5 a | 5/4 a | 5/4 a | 5/5 a | 5/10 b | * |
| Tennessee Warbler (Leiothlypis peregrina) | 5/18 ac | 5/18 ac | 5/19 a | 5/22 a | 5/13 a | NS |
| Nashville Warbler (Leiothlypis ruficapilla) | 5/8 a | 5/9 a | 5/8 a | 5/9 a | 5/12 a | NS |
| Mourning Warbler (Geothlypis philadelphia) | 5/24 a | 5/21 a | 5/24 a | 5/21 a | 5/28 a | NS |
| Common Yellowthroat (Geothlypis trichas) | 5/11 a | 5/10 a | 5/11 a | 5/12 a | 5/19 a | NS |
| American Redstart (Setophaga ruticilla) | 5/14 ab | 5/12 a | 5/14 ab | 5/17 b | 5/21 c | * |
| Cape May Warbler (Setophaga tigrina) | 5/13 a | 5/16 a | 5/15 AA | 5/19 a | 5/17 a | NS |
| Northern Parula (Setophaga parula) | 5/8 a | 5/8 a | 5/7 a | 5/8 a | 5/10 a | NS |
| Magnolia Warbler (Setophaga magnolia) | 5/14 a | 5/14 a | 5/13 a | 5/16 a | 5/19 b | * |
| Bay-breasted Warbler (Setophaga castanea) | 5/18 a | 5/16 a | 5/17 a | 5/17 a | 5/22 a | NS |
| Blackburnian Warbler (Setophaga fusca) | 5/15 a | 5/14 a | 5/15 a | 5/14 a | 5/20 b | * |
| Yellow Warbler (Setophaga petchia) | 5/10 a | 5/9 a | 5/11 a | 5/12 ab | 5/16 b | * |
| Chestnut-sided Warbler (Setophaga pensylvanica) | 5/12 a | 5/12 a | 5/11 a | 5/13 a | 5/20 b | * |
| Blackpoll Warbler (Setophaga striata) | 5/22 a | 5/18 b | 5/17 b | 5/20 ab | 5/21 ab | * |
| Black-throated Blue Warbler (Setophaga caerulescens) | 5/12 a | 5/10 a | 5/11 a | 5/10 a | 5/19 b | * |
| Palm Warbler (Setophaga palmarum) | 4/23 a | 4/22 a | 4/20 a | 4/21 a | 4/22 a | NS |
| Pine Warbler (Setophaga pinus) | 4/25 a | 4/22 a | 4/23 a | 4/28 a | 4/29 a | NS |
| Yellow-rumped Warbler (Setophaga coronata) | 4/27 a | 4/28 a | 4/25 a | 4/27 a | 5/1 a | NS |
| Prairie Warbler (Setophaga discolor) | 5/10 a | 5/13 a | 5/12 a | 5/15 a | NA | NS |
| Black-throated Green Warbler (Setophaga virens) | 5/7 a | 5/5 a | 5/5 a | 5/6 a | 5/10 b | * |
| Canada Warbler (Cardellina canadensis) | 5/21 a | 5/17 b | 5/16 b | 5/21 a | 5/20 a | * |
| Wilson’s Warbler (Cardellina pusilla) | 5/16 a | 5/15 a | 5/15 a | 5/16 a | 5/19 a | NS |
| Chipping Sparrow (Spizella passerina) | 4/22 a | 4/17 a | 4/20 a | 4/25 ac | 4/27 a | NS |
| Field Sparrow (Spizella pusilla) | 4/30 a | 5/4 a | 5/1 a | 5/5 a | NA | NS |
| Vesper Sparrow (Chondestes gramineus) | 4/30 a | 5/9 b | 4/23 a | 4/27 a | 5/3 ab | * |
| Savannah Sparrow (Passerculus sandwichensis) | 4/23 a | 4/22 a | 4/23 a | 4/24 a | 4/29 a | NS |
| Fox Sparrow (Passerella iliaca) | 4/5 a | 3/25 b | 3/26 b | 3/26 b | 3/28 b | * |
| Song Sparrow (Melospiza melodia) | 3/29 a | 3/21 b | 3/22 b | 3/23 b | 4/12 a | * |
| Lincoln’s Sparrow (Melospiza lincolni) | 5/12 a | 5/12 a | 5/9 a | 5/11 a | 5/13 a | NS |
| Swamp Sparrow (Melospiza georgiana) | 4/28 a | 4/27 a | 4/26 a | 5/1 a | 5/3 a | NS |
| White-throated Sparrow (Zonotrichia albicollis) | 4/19 a | 4/9 b | 4/14 b | 4/19 a | 4/16 a | * |
| Scarlet Tanager (Piranga olivacea) | 5/17 a | 5/14 a | 5/17 ab | 5/18 ab | 5/22 b | * |
| Rose-breasted Grosbeak (Pheucticus ludovicianus) | 5/9 a | 5/9 a | 5/10 a | 5/12 ab | 5/13 b | * |
| Indigo Bunting (Passerina cyanea) | 5/21 a | 5/18 ab | 5/16 b | 5/15 b | 5/13 b | * |
| Bobolink (Dolichonyx oryzivorus) | 5/12 a | 5/15 b | 5/15 b | 5/17 c | 5/21 c | * |
| Red-winged Blackbird (Aegelaius phoeniceus) | 3/31 a | 3/27 a | 3/28 a | 3/25 a | 3/29 a | NS |
| Rusty Blackbird (Euphagus carolina) | 4/14 a | 4/8 a | 4/3 a | 4/9 a | 4/10 a | NS |
| Brown-headed Cowbird (Molothrus ater) | 4/6 a | 3/31 a | 3/29 a | 3/26 a | 4/16 a | NS |
| Common Grackle (Quiscalus quiscala) | 3/23 a | 3/18 a | 3/20 a | 3/24 a | 4/2 b | * |
| Baltimore Oriole (Icterus galbula) | 5/5 a | 5/5 a | 5/3 a | 5/30 a | 5/8 a | NS |
| Species | 1899–1911 | 1994–2017 | p |
|---|---|---|---|
| Wood Duck | 4/15 | 4/8 | NS |
| Pied-billed Grebe | 4/9 | 4/18 | NS |
| Black-billed Cuckoo | 5/25 | 5/27 | NS |
| Common Nighthawk | 5/19 | 5/26 | * |
| Whip-poor-will | 5/10 | 5/19 | * |
| Chimney Swift | 5/9 | 5/15 | * |
| Ruby-throated Hummingbird | 5/18 | 5/11 | * |
| Wilson’s Snipe | 4/23 | 4/20 | NS |
| American Woodcock | 4/13 | 3/30 | * |
| Spotted Sandpiper | 5/9 | 5/11 | NS |
| Common Loon | 5/9 | 4/19 | * |
| American Bittern | 5/8 | 5/2 | NS |
| Great Blue Heron | 4/22 | 4/12 | * |
| Broad-winged Hawk | 4/26 | 4/26 | NS |
| Belted Kingfisher | 4/25 | 4/20 | * |
| Yellow-bellied Sapsucker | 4/23 | 4/20 | NS |
| Northern Flicker | 4/14 | 4/14 | NS |
| Olive-sided Flycatcher | 5/22 | 5/26 | NS |
| Eastern Wood-Pewee | 5/23 | 5/22 | NS |
| Yellow-bellied Flycatcher | 5/25 | 5/22 | NS |
| Alder Flycatcher | 5/23 | 5/26 | * |
| Least Flycatcher | 5/10 | 5/14 | * |
| Eastern Phoebe | 4/6 | 4/9 | * |
| Great Crested Flycatcher | 5/17 | 5/14 | * |
| Eastern Kingbird | 5/15 | 5/15 | NS |
| Yellow-throated Vireo | 5/20 | 5/19 | NS |
| Blue-headed Vireo | 5/9 | 5/3 | * |
| Philadelphia Vireo | 5/25 | 5/13 | NS |
| Warbling Vireo | 5/17 | 5/15 | NS |
| Red-eyed Vireo | 5/22 | 5/18 | * |
| Purple Martin | 5/6 | 5/10 | * |
| Tree Swallow | 4/20 | 4/16 | * |
| Bank Swallow | 5/12 | 5/17 | NS |
| Cliff Swallow | 5/10 | 5/15 | * |
| Barn Swallow | 5/3 | 5/6 | * |
| Winter Wren | 4/18 | 4/23 | NS |
| Ruby-crowned Kinglet | 4/25 | 4/22 | NS |
| Eastern Bluebird | 3/23 | 4/11 | * |
| Veery | 5/12 | 5/17 | NS |
| Hermit Thrush | 4/18 | 4/26 | * |
| American Robin | 3/30 | 3/29 | * |
| Gray Catbird | 5/15 | 5/9 | * |
| Brown Thrasher | 5/11 | 5/9 | * |
| Ovenbird | 5/12 | 5/10 | * |
| Northern Waterthrush | 5/11 | 5/9 | NS |
| Black-and-white Warbler | 5/9 | 5/7 | NS |
| Tennessee Warbler | 5/26 | 5/18 | * |
| Nashville Warbler | 5/9 | 5/9 | NS |
| Mourning Warbler | 5/25 | 5/26 | NS |
| Common Yellowthroat | 5/14 | 5/12 | * |
| American Redstart | 5/15 | 5/17 | * |
| Northern Parula | 5/11 | 5/10 | * |
| Magnolia Warbler | 5/15 | 5/14 | NS |
| Bay-breasted Warbler | 5/18 | 5/18 | NS |
| Blackburnian Warbler | 5/14 | 5/17 | NS |
| Yellow Warbler | 5/15 | 5/11 | * |
| Chestnut-sided Warbler | 5/17 | 5/15 | * |
| Blackpoll Warbler | 5/20 | 5/19 | NS |
| Black-throated Blue Warbler | 5/15 | 5/12 | NS |
| Pine Warbler | 4/26 | 4/26 | NS |
| Yellow-rumped Warbler | 4/28 | 4/28 | NS |
| Black-throated Green Warbler | 5/10 | 5/9 | NS |
| Canada Warbler | 5/18 | 5/19 | NS |
| Wilson’s Warbler | 5/18 | 5/16 | * |
| Chipping Sparrow | 4/23 | 4/21 | * |
| Field Sparrow | 4/28 | 5/3 | * |
| Vesper Sparrow | 4/16 | 5/2 | * |
| Savannah Sparrow | 4/19 | 4/26 | * |
| Fox Sparrow | 4/3 | 3/30 | * |
| Song Sparrow | 3/27 | 3/30 | * |
| Lincoln’s Sparrow | 5/3 | 5/12 | NS |
| Swamp Sparrow | 4/23 | 5/1 | NS |
| White-throated Sparrow | 4/27 | 4/16 | * |
| Scarlet Tanager | 5/19 | 5/17 | * |
| Rose-breasted Grosbeak | 5/16 | 5/10 | * |
| Indigo Bunting | 5/23 | 5/18 | * |
| Bobolink | 5/15 | 5/17 | * |
| Red-winged Blackbird | 4/3 | 3/20 | * |
| Rusty Blackbird | 4/3 | 4/11 | * |
| Baltimore Oriole | 5/17 | 5/7 | * |
| Species | MeanArr | n | Year | tau = 0.1 | NAO | Year | tau = 0.3 | NAO | Year | tau = 0.5 | NAO | Foraging | PopChng |
|---|---|---|---|---|---|---|---|---|---|---|---|---|---|
| TempDep | TempDep | TempDep | |||||||||||
| Wood Duck | 4/8 | 620 | −0.52 | −1.44 | −0.66 | −0.32 | −1.50 | −0.45 | −0.29 | −1.41 | −1.00 | WB | 0 |
| Blue-winged Teal | 4/20 | 269 | −0.02 | −0.54 | −0.12 | −0.26 | −0.81 | 0.52 | −0.18 | −1.11 | −0.01 | WB | 0 |
| Green-winged Teal | 4/5 | 469 | −0.34 | −1.77 | −0.86 | −0.04 | −1.83 | −0.46 | −0.37 * | −1.80 | −0.39 | WB | 0 |
| Ring-necked Duck | 4/3 | 564 | −0.74 * | −1.34 * | −0.91 | −0.43 * | −1.6 * | −1.18 | −0.45 | −1.79 | −1.64 | WB | 0 |
| Pied-billed Grebe | 4/18 | 259 | 0.04 | 0.50 | −0.07 | −0.09 | −0.90 | −0.23 | −0.13 | −0.83 | 0.05 | WB | 0 |
| Black-billed Cuckoo | 5/27 | 187 | −0.11 | −1.13 | 0.49 | −0.17 | −0.90 | 0.37 | 0.05 | −0.82 | 0.45 | FG | 0 |
| Common Nighthawk | 5/25 | 271 | −0.24 | 1.09 | −0.41 | −0.04 | 0.46 | −0.03 | −0.15 | −0.34 | −0.04 | AI | 0 |
| Whip-poor-will | 5/19 | 146 | −0.53 | 3.52 | −0.30 | 0.22 | −0.29 | −0.21 | −0.03 | 0.09 | −0.01 | AI | 0 |
| Chimney Swift | 5/13 | 580 | 0.07 | −0.67 | −0.10 | 0.10 | −0.21 | −0.11 | 0.08 | −0.06 | −0.50 | AI | −5.82 |
| Ruby-throated Hummingbird | 5/11 | 1108 | −0.24 * | 0.28 | 0.50 | −0.21 * | −0.22 | 0.12 | −0.23 * | −0.07 | −0.06 | NE | 0 |
| Virginia Rail | 5/10 | 209 | −0.07 | −0.83 | −0.74 | 0.24 | −1.96 | 0.03 | 0.53 | −1.33 | 0.28 | WB | 0 |
| Sora | 5/12 | 207 | 0.18 | 0.15 | 0.04 | −0.01 | 0.34 | 0.60 | 0.06 | 1.04 | 1.07 | WB | 0 |
| Piping Plover | 4/25 | 138 | 0.61 | −0.41 | −0.81 | 0.75 | 2.16 | −0.91 | 0.64 | 2.93 | 0.29 | WB | 0 |
| Killdeer | 4/3 | 877 | −0.13 | −1.00 | −1.04 | −0.03 | −1.22 * | −0.59 | 0.21 | −0.66 | −0.68 | WB | 0 |
| Upland Sandpiper | 5/12 | 143 | −0.13 | 0.78 | 0.19 | 0.13 | 2.47 | 0.25 | 0.49 | 0.85 | −0.56 | WB | 3.89 |
| Wilson’s Snipe | 4/21 | 389 | −0.06 | −0.67 | −0.29 | 0.01 | −0.99 | −0.43 | −0.03 | −0.56 | −0.58 | WB | 0 |
| American Woodcock | 3/31 | 777 | −0.28 * | −1.59 | −0.45 * | −0.23 * | −1.63 | −0.71 * | −0.15 * | −1.43 | −1.1 * | GF | 0 |
| Spotted Sandpiper | 5/12 | 454 | −0.14 | −0.50 | −0.21 | −0.07 | −0.27 | 0.00 | −0.04 | −0.23 | −0.19 | WB | 0 |
| Willet | 5/6 | 240 | −0.08 | −0.96 | 0.19 | 0.00 | 0.16 | 0.35 | −0.13 | −0.18 | −0.12 | WB | 0 |
| Least Tern | 5/24 | 97 | −0.1 | −0.65 | 0.14 | 0.02 | −0.15 | −0.04 | 0.14 | −1.02 | −0.27 | WB | 0 |
| Black Tern | 5/20 | 104 | −0.43 | 0.32 | −1.50 | −0.22 | −0.03 | −0.67 | −0.23 | −0.49 | −0.08 | WB | 0 |
| Common Tern | 5/21 | 246 | −0.01 | −0.23 | −0.21 | 0.00 | 0.00 | 0.00 | 0.02 | −0.37 | 0.00 | WB | 0 |
| Common Loon | 4/20 | 457 | −0.2 | −1.77 * | 0.02 | −0.13 | −1.33 | 0.28 | −0.03 | −0.31 | 0.38 | WB | 0 |
| American Bittern | 4/30 | 356 | 0.05 | 0.11 | 1.02 | 0.20 | −0.02 | −0.71 | 0.15 | 1.10 | −0.32 | WB | 0 |
| Great Blue Heron | 4/12 | 974 | −0.01 | −0.07 | −0.47 | −0.08 | 0.20 | −0.49 | −0.26 * | −0.14 | −1.08 | WB | 0 |
| Green Heron | 5/11 | 247 | 0.11 | 0.36 | 0.37 | −0.17 | 0.75 | 0.81 | −0.10 | 0.29 | −0.09 | WB | −6.87 |
| Black-crowned Night-Heron | 5/2 | 189 | −0.6 | −1.03 | −0.29 | −0.53 | 0.23 | 0.72 | −0.47 | 0.81 | 2.14 | WB | 0 |
| Glossy Ibis | 4/21 | 228 | −0.05 | 0.34 | 0.16 | 0.12 | 0.22 | 0.44 | 0.07 | −0.37 | −0.18 | WB | 0 |
| Turkey Vulture | 3/26 | 1136 | −0.67 * | −1.87 * | −0.78 | −0.57 * | −1.37 * | −0.65 | −0.62 * | −1.31 * | −0.80 | CA | 3.79 |
| Osprey | 4/15 | 955 | −0.03 | −0.23 | −0.24 | −0.27 * | −0.54 | −0.35 | −0.31 * | −0.50 | −0.37 | WB | 0 |
| Northern Harrier | 4/9 | 683 | −0.5 | −0.51 | −1.01 | −0.25 | −1.12 | −0.68 | −0.12 | −0.68 | −0.52 | RA | 0 |
| Broad-winged Hawk | 4/25 | 751 | 0.02 | 0.04 | 0.32 | −0.70 | 0.46 | 0.14 | −0.03 | −0.30 | 0.44 | RA | 0 |
| Belted Kingfisher | 4/20 | 835 | −0.01 | −2.50 * | −1.25 | −0.14 | −1.84 | −1.34 * | 0.09 | −1.10 | −0.68 | WB | 0 |
| Yellow-bellied Sapsucker | 4/20 | 596 | −0.28 | −1.39 | −0.33 | −0.3 * | −0.92 | 0.20 | −0.23 | −1.19 | 0.17 | NE | 1.89 |
| Northern Flicker | 4/14 | 1088 | −0.29 | −0.95 | −1.14 | −0.05 | −1.82 | −0.61 | −0.11 | −1.68 | −0.62 | BG | 0 |
| American Kestrel | 4/7 | 889 | 0.53 * | −0.87 * | −0.90 | 0.35 * | −0.61 * | −0.73 | 0.31 | −0.60 | 0.83 | RA | −3.41 |
| Olive-sided Flycatcher | 5/24 | 207 | 0.16 | −0.82 | −1.74 | 0.01 | −0.14 | −0.12 | 0.03 | 0.22 | −0.05 | AI | 0 |
| Eastern Wood-Pewee | 5/22 | 535 | 0 | −1.39 | 0.24 | −0.01 | −0.14 | −0.15 | 0.01 | 0.03 | 0.30 | AI | −3.83 |
| Yellow-bellied Flycatcher | 5/23 | 171 | 0.31 | 2.29 | 1.26 | 0.29 | 0.12 | 0.37 | 0.31 | −1.13 | 0.03 | AI | 0 |
| Alder Flycatcher | 5/24 | 376 | −0.09 | 0.08 | −0.75 | −0.03 | −0.14 | −0.90 | 0.13 | −0.60 | 0.14 | AI | 0 |
| Willow Flycatcher | 5/25 | 210 | 0 | −0.45 | 0.84 | −0.02 | −0.32 | 0.34 | 0.13 | −0.92 | 0.49 | AI | 0 |
| Least Flycatcher | 5/14 | 552 | −0.13 | 0.28 | 0.60 | −0.13 | −0.50 | −0.23 | −0.01 | −0.86 | −0.20 | AI | 0 |
| Eastern Phoebe | 4/10 | 1139 | 0.02 | −1.29 * | −0.99 | 0.12 | −1.06 * | −1.33 * | 0.04 | −0.85 * | −1.14 * | AI | 0 |
| Great Crested Flycatcher | 5/14 | 810 | 0.11 | −0.25 | 1.62 | 0.00 | −0.79 | 0.41 | −0.01 | −0.93 | 0.19 | AI | 0 |
| Eastern Kingbird | 5/14 | 780 | −0.07 | −0.36 | −0.15 | −0.10 | −0.29 | −0.31 | 0.04 | −0.17 | −0.32 | AI | 0 |
| Yellow-throated Vireo | 5/19 | 99 | −0.43 | −0.46 | −0.40 | −0.37 | −0.32 | −0.25 | −0.01 | −0.28 | 0.66 | LG | 0 |
| Blue-headed Vireo | 5/3 | 751 | −0.12 | −1.00 * | −0.30 | −0.20 | −0.62 | −0.19 | −0.11 | 0.34 | −0.02 | LG | 0 |
| Philadelphia Vireo | 5/21 | 109 | 0.23 | −1.87 | −0.19 | −0.07 | −0.46 | 0.88 | 0.06 | 0.03 | 0.16 | LG | 0 |
| Warbling Vireo | 5/14 | 402 | −0.21 | 0.12 | 0.46 | −0.34 * | −0.30 | 0.27 | −0.38 * | −0.71 | 0.22 | LG | 0 |
| Red-eyed Vireo | 5/18 | 734 | −0.01 | −0.79 | −0.26 | −0.09 | −0.51 | 0.02 | −0.13 | −0.17 | 0.17 | LG | 0 |
| Purple Martin | 5/10 | 143 | −0.5 | −0.99 | 0.75 | −0.32 | 0.12 | 1.45 | −0.36 | −0.72 | 0.58 | AI | 0 |
| Tree Swallow | 4/16 | 1125 | 0.02 | −0.89 | −0.70 | −0.06 | −0.97 | −0.42 | −0.02 | −0.85 | −0.64 | AI | −4.00 |
| N. Rough-winged Swallow | 5/5 | 316 | −0.46 | −0.74 | −0.25 | −0.05 | 0.29 | 0.37 | 0.14 | −0.51 | 0.64 | AI | 0 |
| Bank Swallow | 5/15 | 271 | 0.18 | −0.01 | −0.15 | −0.05 | −0.19 | −0.36 | 0.15 | −0.05 | −0.09 | AI | −10.83 |
| Cliff Swallow | 5/13 | 318 | 0.32 | 0.15 | 0.09 | 0.25 | −0.95 | −0.51 | 0.41 | −0.25 | 0.04 | AI | −2.63 |
| Barn Swallow | 5/4 | 793 | −0.15 | −0.98 | −0.41 | −0.13 | −0.21 | 0.11 | −0.07 | 0.01 | 0.45 | AI | −7.90 |
| House Wren | 5/8 | 475 | −0.15 | −0.67 | 0.86 | −0.14 | −0.34 | 0.27 | −0.14 | −0.66 | 0.11 | GF | 0 |
| Winter Wren | 4/24 | 435 | −0.04 | −1.49 | −0.58 | −0.20 | −1.3 * | −0.46 | −0.05 * | −1.09 | −0.41 | GF | −6.32 |
| Marsh Wren | 5/17 | 199 | −0.12 | 1.51 | 0.44 | −0.25 | 0.36 | 1.05 | 0.04 | −0.01 | 0.50 | GF | 0 |
| Blue-gray Gnatcatcher | 5/5 | 198 | −0.11 | −1.41 | −0.62 | −0.22 | −0.28 | −0.54 | −0.26 | 1.06 | 0.04 | LG | 0 |
| Ruby-crowned Kinglet | 4/23 | 692 | −0.08 | −1.02 | −0.23 | −0.09 | −0.76 | −0.46 | 0.07 | −0.79 | −0.17 | LG | 0 |
| Eastern Bluebird | 4/12 | 703 | −0.86 * | −2.15 | −1.07 | −0.18 | −1.55 | −0.99 | 0.12 | −1.31 | −0.95 | GF | 0 |
| Veery | 5/15 | 695 | 0.21 | 0.26 | 0.46 | 0.03 | −1.60 | −0.04 | 0.11 | 0.01 | 0.01 | GF | −3.83 |
| Swainson’s Thrush | 5/19 | 318 | 0.28 | −0.89 | 0.41 | 0.09 | −0.57 | 0.05 | −0.03 | −0.24 | 0.03 | GF | 0 |
| Hermit Thrush | 4/24 | 846 | −0.16 | −1.41 | −0.58 | −0.08 | −0.71 | −0.39 | −0.02 | −0.52 | −0.35 | GF | 0 |
| Wood Thrush | 5/11 | 667 | −0.31 | −0.90 | 15.00 | 0.00 | −0.65 | 0.42 | 0.00 | −1.07 | 0.05 | GF | −5.62 |
| American Robin | 3/21 | 820 | −1.24 | −0.13 | −1.23 | −0.72 | −0.86 | −0.78 | −0.39 | −0.78 | −0.75 | GF | 0 |
| Gray Catbird | 5/20 | 1012 | −0.19 | 0.03 | 0.13 | −0.06 | −0.25 | −0.30 | −0.06 | −0.28 | −0.13 | GF | 0 |
| Brown Thrasher | 5/8 | 500 | −0.21 | −1.17 | −0.47 | −0.16 | −0.02 | −0.19 | −0.12 | −0.24 | 0.12 | GF | 0 |
| Ovenbird | 5/9 | 978 | −0.06 | 0.15 | 0.54 * | −0.03 | −0.02 | 0.65 * | −0.08 | −23.00 | 0.21 | LG | 0 |
| Northern Waterthrush | 5/9 | 451 | −0.13 | 0.16 | −0.17 | −0.03 | −0.07 | 0.24 | −0.03 | −0.59 | −0.41 | LG | −2.15 |
| Black-and-white Warbler | 5/6 | 993 | −0.16 | −0.11 | −0.14 | −0.10 | 0.11 | 0.25 | −0.07 | 0.26 | 0.41 | LG | 0 |
| Tennessee Warbler | 5/18 | 226 | 0 | 0.34 * | 0.77 | 0.06 | −0.54 | 0.19 | 0.11 | −0.46 | −0.07 | LG | 0 |
| Nashville Warbler | 5/9 | 662 | −0.09 | 0.24 | 0.18 | −0.11 * | 0.36 | 0.37 | −0.13 | −0.04 | 0.15 | LG | 0 |
| Mourning Warbler | 5/25 | 139 | −0.58 | −0.22 | 0.71 | −0.10 | 0.26 | 0.11 | −0.06 | 0.63 | 0.39 | LG | 0 |
| Common Yellowthroat | 5/12 | 972 | −0.03 | −0.06 | 0.29 | −0.07 | −0.12 | 0.06 | −0.08 | −0.18 | −0.01 | LG | −1.77 |
| American Redstart | 5/15 | 823 | 0.05 * | −0.62 * | 0.14 | −0.06 * | −0.49 * | −0.06 | −0.01 * | −0.3 * | −0.01 | LG | 0 |
| Cape May Warbler | 5/16 | 175 | −0.06 | −1.29 | −0.55 | −0.02 | −0.33 | −29.00 | −0.01 | −0.31 | −0.13 | LG | 0 |
| Northern Parula | 5/9 | 896 | −0.13 | 0.45 | 0.53 | −0.12 | −0.11 | 0.54 * | −0.09 | −0.44 | 0.36 | LG | 0 |
| Magnolia Warbler | 5/15 | 709 | 0.11 | −0.29 | 0.34 | 0.00 | −0.26 | −0.24 | 0.02 | −0.30 | −0.22 | LG | 0 |
| Bay-breasted Warbler | 5/18 | 242 | −0.03 | −0.09 | 0.01 | 0.09 | −0.10 | 0.16 | 0.06 | −0.42 | −0.02 | LG | 0 |
| Blackburnian Warbler | 5/15 | 542 | −0.31 * | −0.08 | 0.29 | −0.17 * | 0.06 | 0.10 | −0.13 | −0.21 | −0.05 | LG | 0 |
| Yellow Warbler | 5/11 | 923 | −0.15 | 0.12 | 0.35 | −0.03 | −0.04 | 0.29 | −0.10 | −0.02 | −0.02 | LG | 0 |
| Chestnut-sided Warbler | 5/13 | 836 | −0.15 | −0.46 | −0.21 | −0.07 | −0.09 | −0.28 | −0.11 | −0.09 | −0.07 | LG | 0 |
| Blackpoll Warbler | 5/20 | 391 | 0.07 | −0.45 | 0.16 | 0.07 | −0.15 | −0.01 | 0.04 | −0.36 | −0.20 | LG | 0 |
| Black-throated Blue Warbler | 5/12 | 646 | −0.12 | 0.18 | −1.00 | −0.11 | −0.21 | 0.07 | −0.10 | −0.33 | −0.01 | LG | 0 |
| Palm Warbler | 4/22 | 651 | −0.14 | −0.50 | 0.34 | −0.11 | −0.71 | −0.08 | −0.03 | −0.33 | 0.03 | LG | 0 |
| Pine Warbler | 4/25 | 675 | −0.11 | −2.11 * | −0.85 | 0.00 | −1.32 * | −0.40 | 0.17 | −1.13 * | −0.18 | LG | 4.68 |
| Yellow-rumped Warbler | 4/28 | 1004 | 0.07 | −0.81 | −0.09 | 0.07 | −0.53 | −0.06 | 0.06 | 0.01 | 0.31 | LG | −7.44 |
| Prairie Warbler | 5/14 | 259 | 0.06 | −0.83 | 0.03 | 0.09 | −0.5 * | −0.26 | −0.22 * | −0.36 * | −0.15 | LG | 0 |
| Black-throated Green Warbler | 5/7 | 988 | −0.2 * | 0.04 | −0.01 | −0.13 * | 0.02 | 0.25 | −0.13 | 0.05 | 0.42 | LG | 0 |
| Canada Warbler | 5/19 | 464 | −0.07 | −0.17 | −0.02 | −0.07 | −0.32 | −0.05 | −0.12 | −0.05 | 0.09 | LG | 0 |
| Wilson’s Warbler | 5/16 | 409 | −0.05 | −0.11 | −0.20 | −0.05 | −0.49 | 0.29 | −0.05 | −0.42 | −0.25 | LG | 0 |
| Eastern Towhee | 5/4 | 445 | −0.03 | −0.39 | −0.27 | −0.17 | −0.29 | −22.00 | −0.15 | 0.18 | 0.54 | SE | 0 |
| Chipping Sparrow | 4/21 | 1097 | −0.01 | −0.42 | 0.63 | −0.31 * | −1.25 * | 0.01 | −0.36 | −0.85 | 0.20 | SE | 0 |
| Field Sparrow | 5/4 | 277 | −0.06 | −0.84 | 0.26 | 0.01 | −0.72 | 0.17 | 0.11 | −0.24 | 0.05 | SE | −6.04 |
| Vesper Sparrow | 5/3 | 180 | −0.05 | −0.44 | 0.00 | −0.14 | −0.10 | −0.83 | 0.32 | 1.48 | −0.19 | SE | −3.63 |
| Savannah Sparrow | 4/25 | 659 | −0.15 | −0.21 | −0.80 | −0.12 | −0.14 | −0.33 | −0.10 | 0.30 | −0.22 | SE | 0 |
| Fox Sparrow | 3/30 | 563 | −0.17 | −1.6 * | −1.2 * | −0.20 | −1.32 * | −0.26 * | 0.00 | −0.83 * | 0.15 | SE | 0 |
| Song Sparrow | 3/29 | 948 | −0.28 | −1.44 | −0.58 | −0.23 | −1.15 | −0.75 | −0.08 | −1.38 * | −0.72 | SE | −2.93 |
| Lincoln’s Sparrow | 5/12 | 253 | 1.61 | −1.60 | 0.57 | 0.17 | −1.17 | −0.19 | 0.28 * | −1.22 | 0.14 | SE | 0 |
| Swamp Sparrow | 4/29 | 500 | 0.04 | −1.61 | −0.31 | 0.05 | −0.66 | −0.16 | 0.05 | −0.77 | −0.22 | SE | 0 |
| White-throated Sparrow | 4/17 | 979 | −1.05 | −1.33 | −1.81 | −0.20 | −0.55 | −0.15 | −0.15 * | 0.00 | −0.04 | SE | −3.89 |
| Scarlet Tanager | 5/17 | 609 | −0.07 | −0.21 | 0.22 | −0.11 | −0.20 | 0.26 | −0.09 | −0.30 | 0.29 | LG | 0 |
| Rose-breasted Grosbeak | 5/10 | 999 | −0.28 * | 0.72 | 0.47 | −0.2 * | 0.02 | 0.22 | −0.2 * | −0.09 | −0.09 | SE | 0 |
| Indigo Bunting | 5/18 | 528 | −0.17 | 0.69 | 0.51 | −0.24 * | 0.44 | 0.46 | −0.27 * | 0.50 | 0.34 | SE | 0 |
| Bobolink | 5/15 | 766 | 0.09 | −0.29 | 0.38 | −0.01 | −0.27 | −0.16 | −0.01 | −0.40 | −0.17 | SE | −3.28 |
| Red-winged Blackbird | 3/22 | 1251 | −0.15 | −0.98 * | −0.39 | −0.2 * | −0.9 * | −0.48 | −0.22 * | −0.84 * | −0.32 | GF | 0 |
| Eastern Meadowlark | 4/24 | 446 | 0.07 | −0.62 | −1.17 | 0.23 | −1.77 | −0.82 | 0.48 | −0.22 | −0.73 | GF | 0 |
| Rusty Blackbird | 4/11 | 206 | 0.23 | −2.76 | 0.61 | 0.62 | −3.19 | 1.12 | 0.60 | −1.96 | 1.16 | GF | 0 |
| Common Grackle | 3/24 | 1207 | 0.68 | −0.75 | −0.66 | −0.11 | 0.79 * | −0.57 * | −0.12 | −0.81 * | −0.46 | SE | 0 |
| Baltimore Oriole | 5/5 | 1126 | 0.06 | −1.50 | 5.89 * | 0.05 | −2.71 * | 3.67 * | −0.07 | −1.34 * | 1.06 * | GF | 0 |
© 2017 by the author. Licensee MDPI, Basel, Switzerland. This article is an open access article distributed under the terms and conditions of the Creative Commons Attribution (CC BY) license (http://creativecommons.org/licenses/by/4.0/).
Share and Cite
Wilson, W.H., Jr. The Dynamics of Arrivals of Maine Migratory Breeding Birds: Results from a 24-Year Study. Biology 2017, 6, 38. https://doi.org/10.3390/biology6040038
Wilson WH Jr. The Dynamics of Arrivals of Maine Migratory Breeding Birds: Results from a 24-Year Study. Biology. 2017; 6(4):38. https://doi.org/10.3390/biology6040038
Chicago/Turabian StyleWilson, W. Herbert, Jr. 2017. "The Dynamics of Arrivals of Maine Migratory Breeding Birds: Results from a 24-Year Study" Biology 6, no. 4: 38. https://doi.org/10.3390/biology6040038
APA StyleWilson, W. H., Jr. (2017). The Dynamics of Arrivals of Maine Migratory Breeding Birds: Results from a 24-Year Study. Biology, 6(4), 38. https://doi.org/10.3390/biology6040038