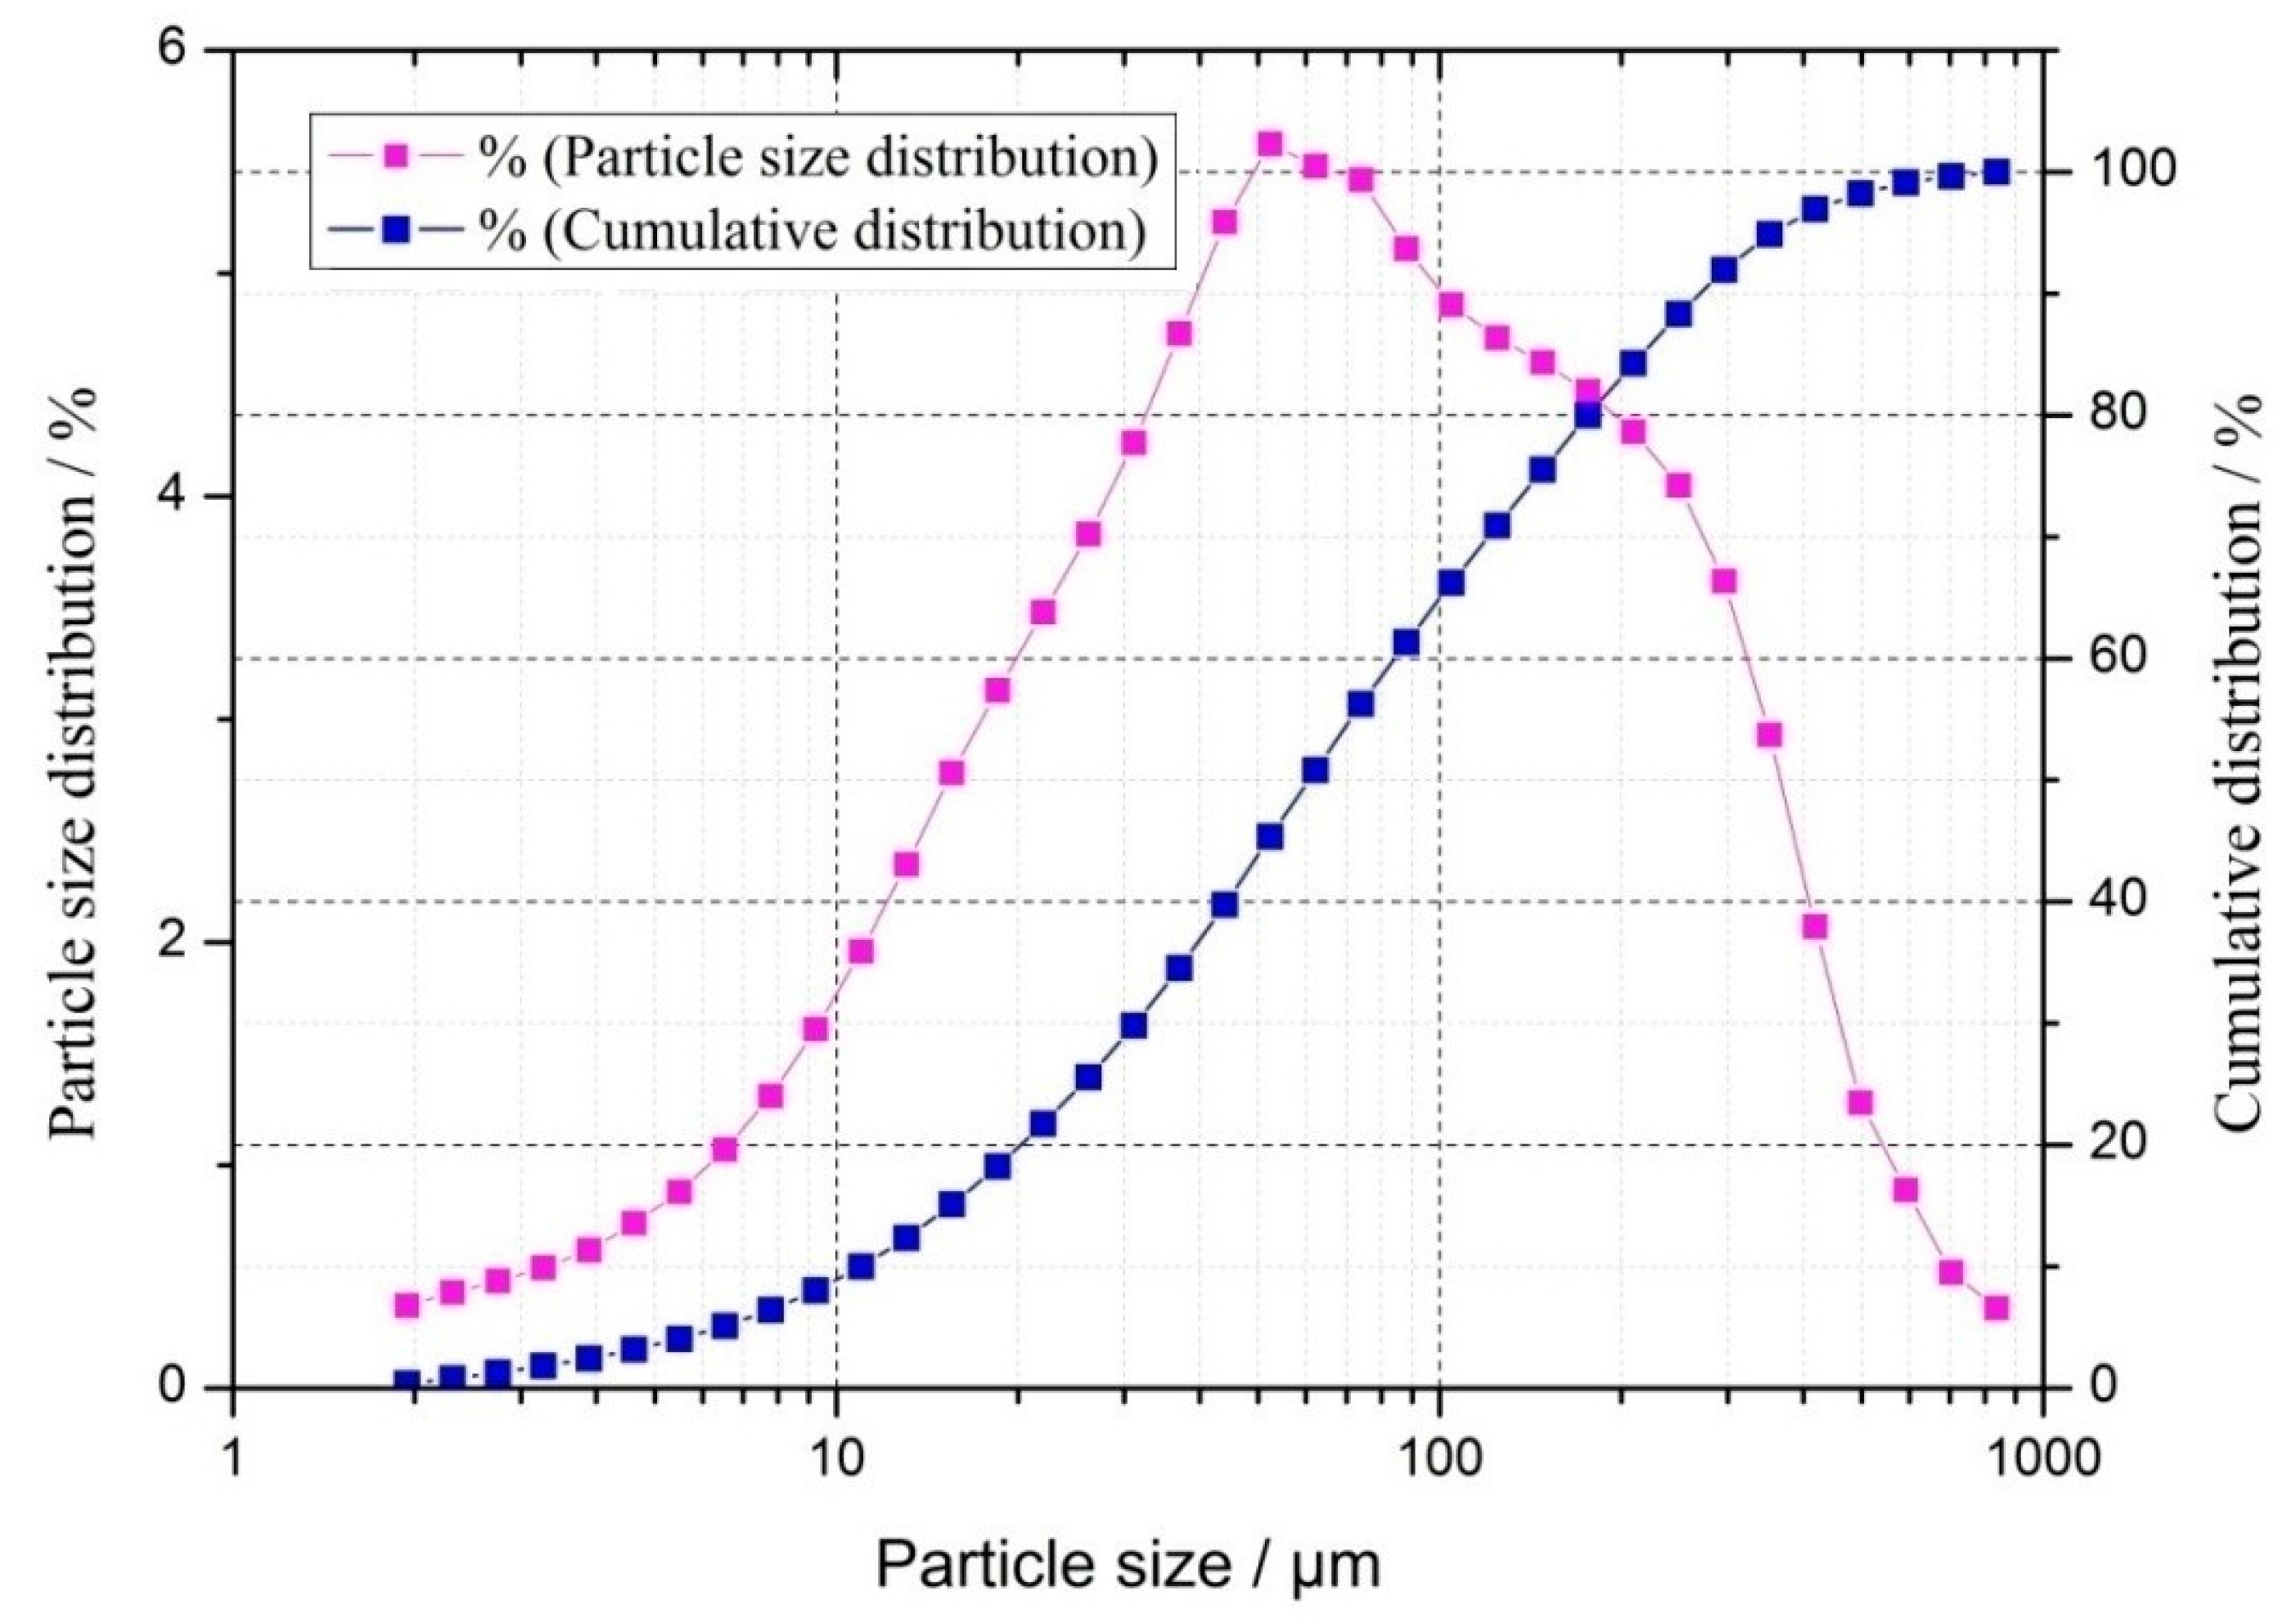
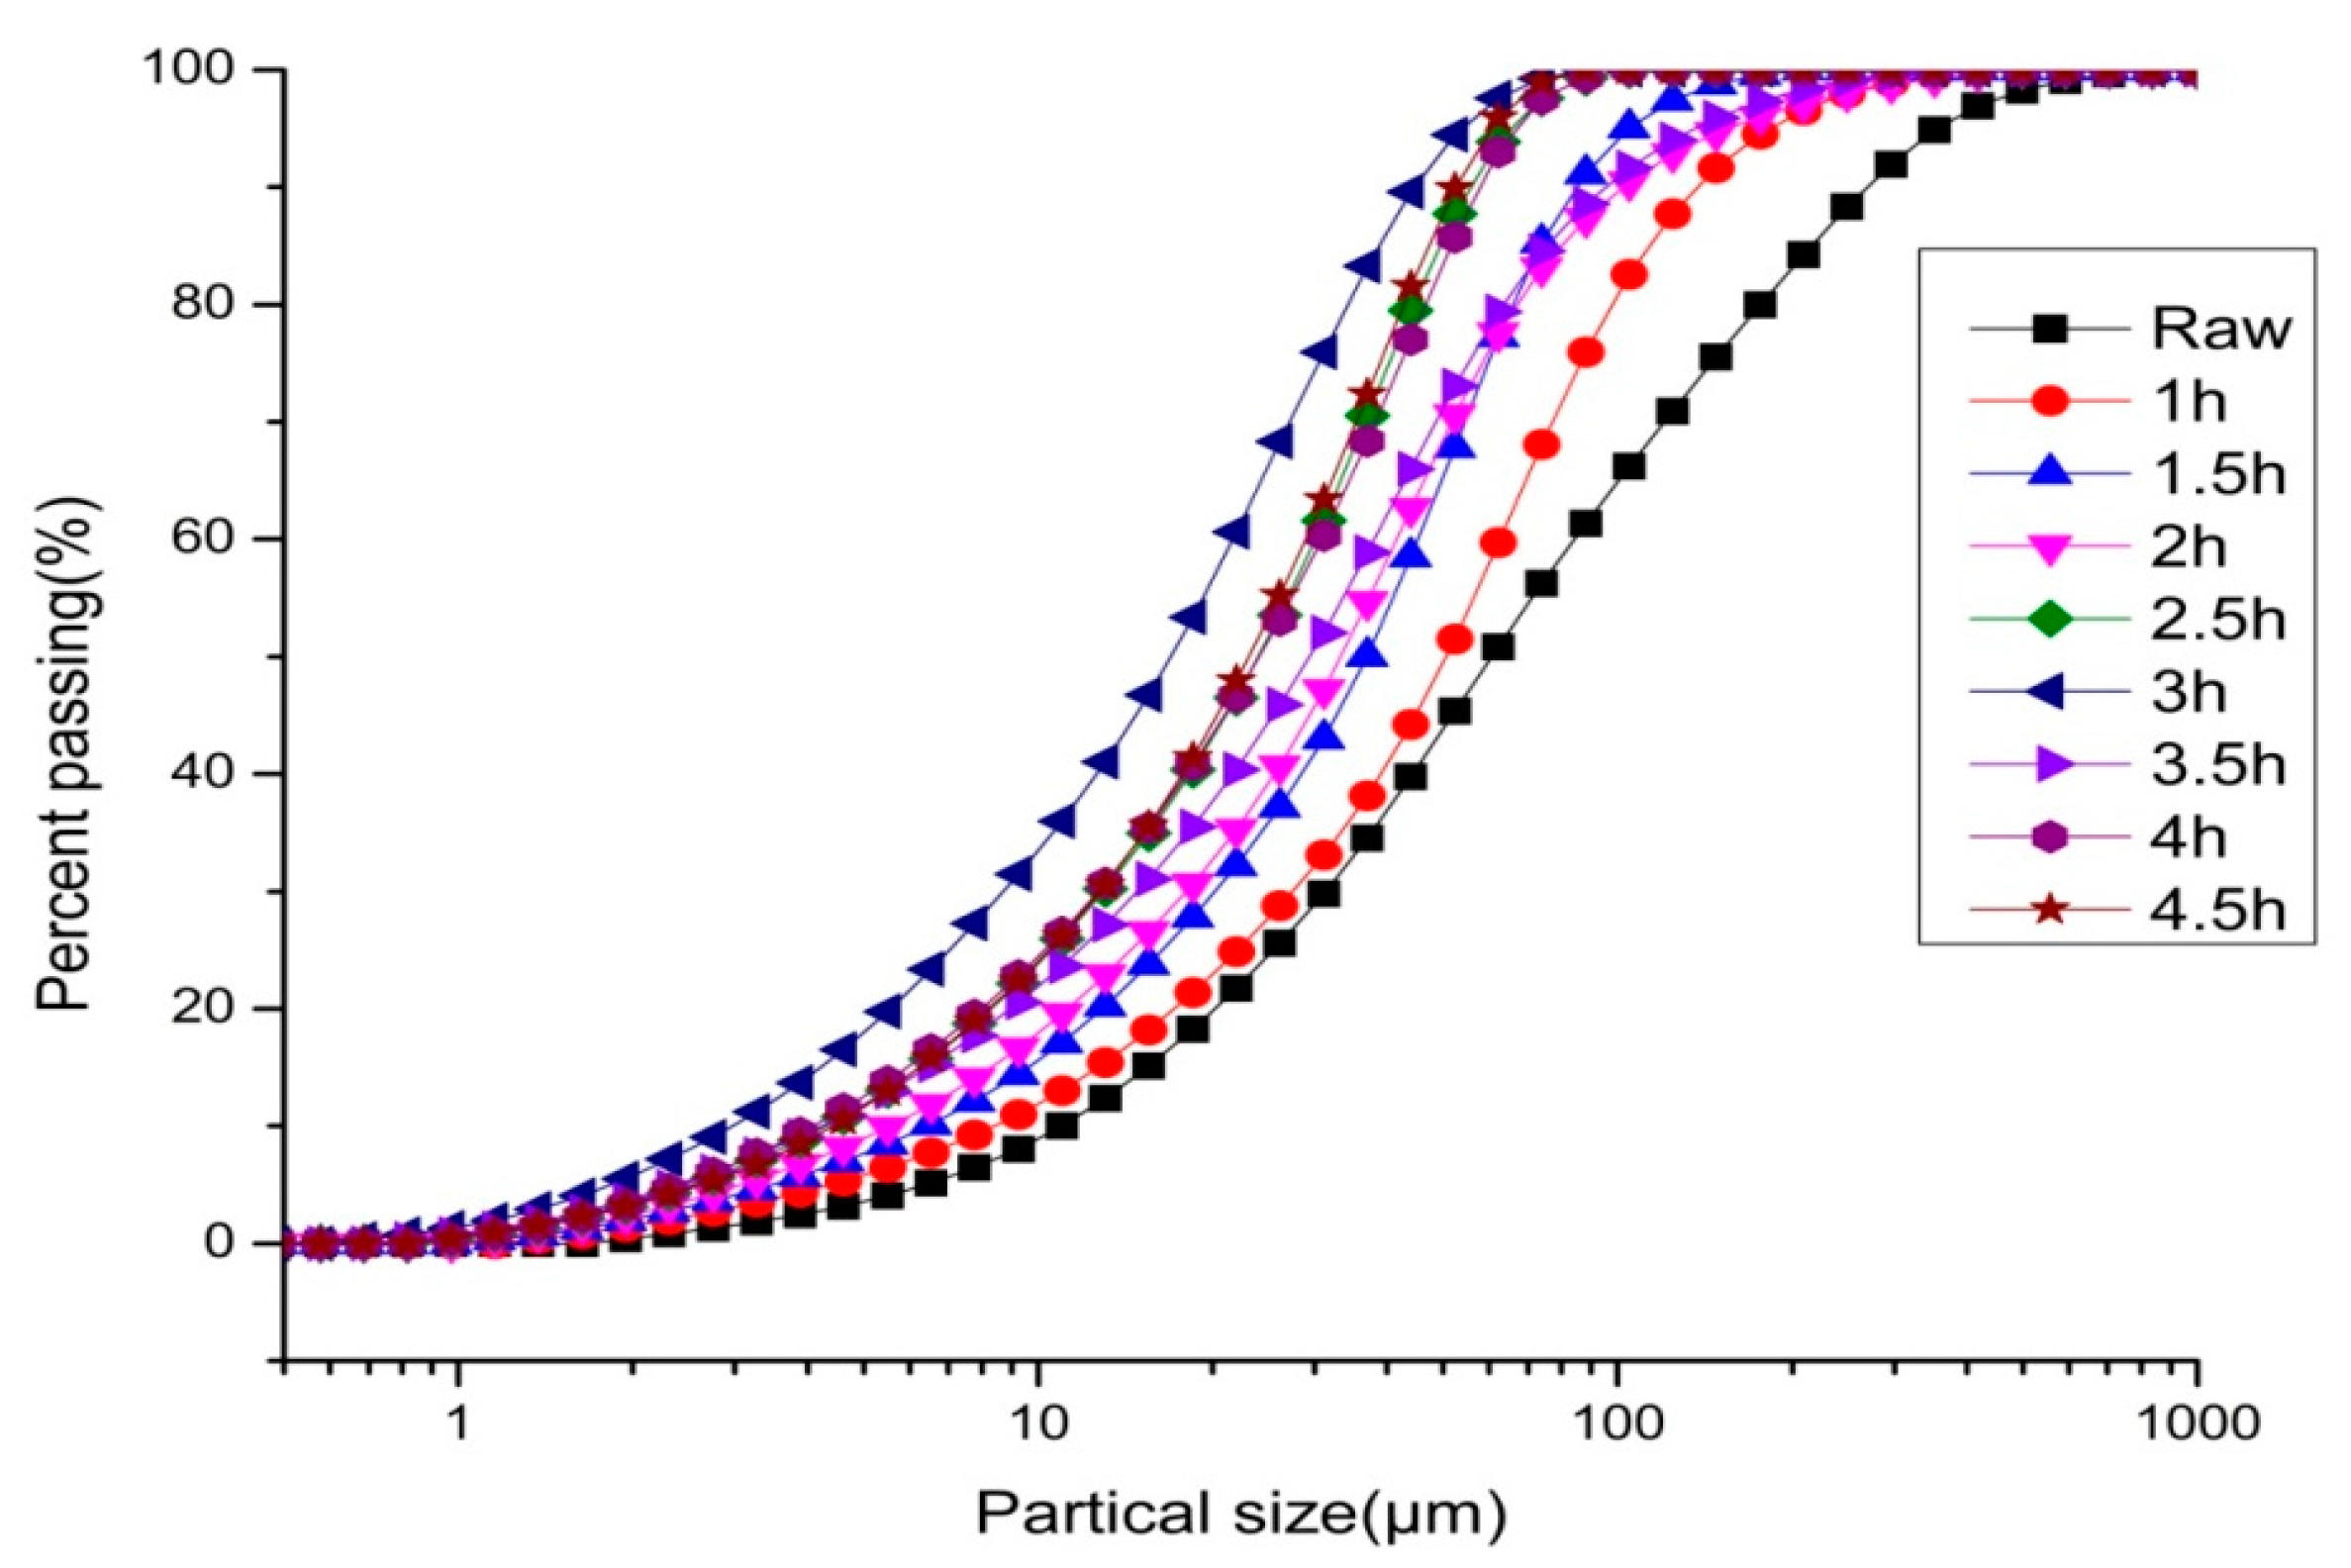
Figure 1.
Particle size and cumulative size distribution of raw copper-mine tailings.
Figure 1.
Particle size and cumulative size distribution of raw copper-mine tailings.
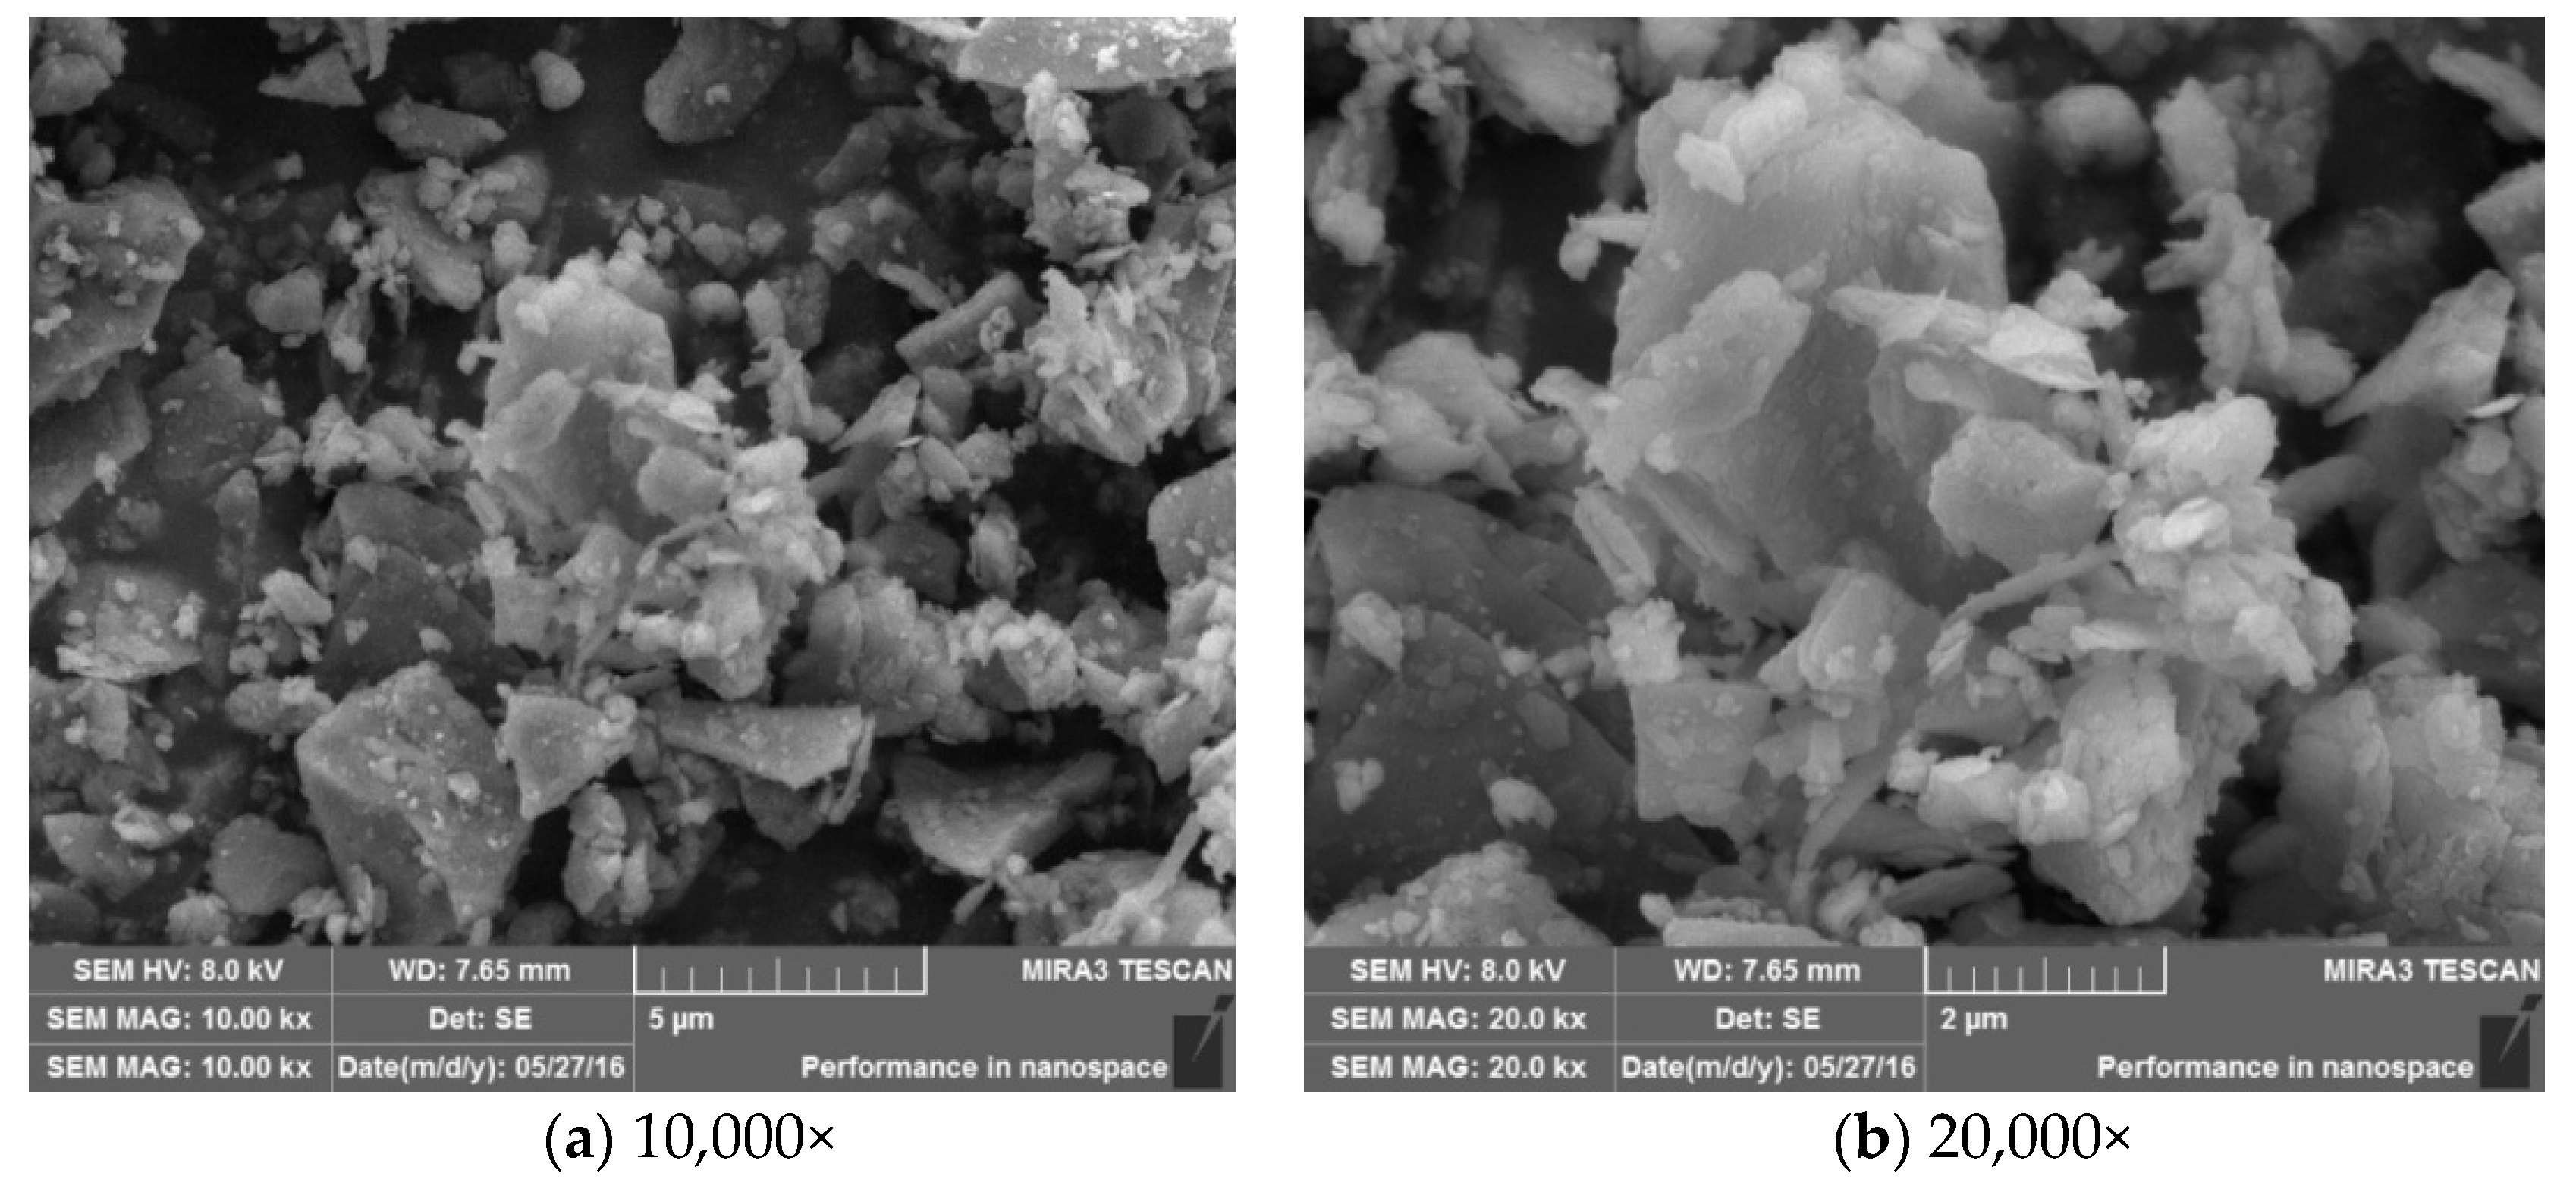
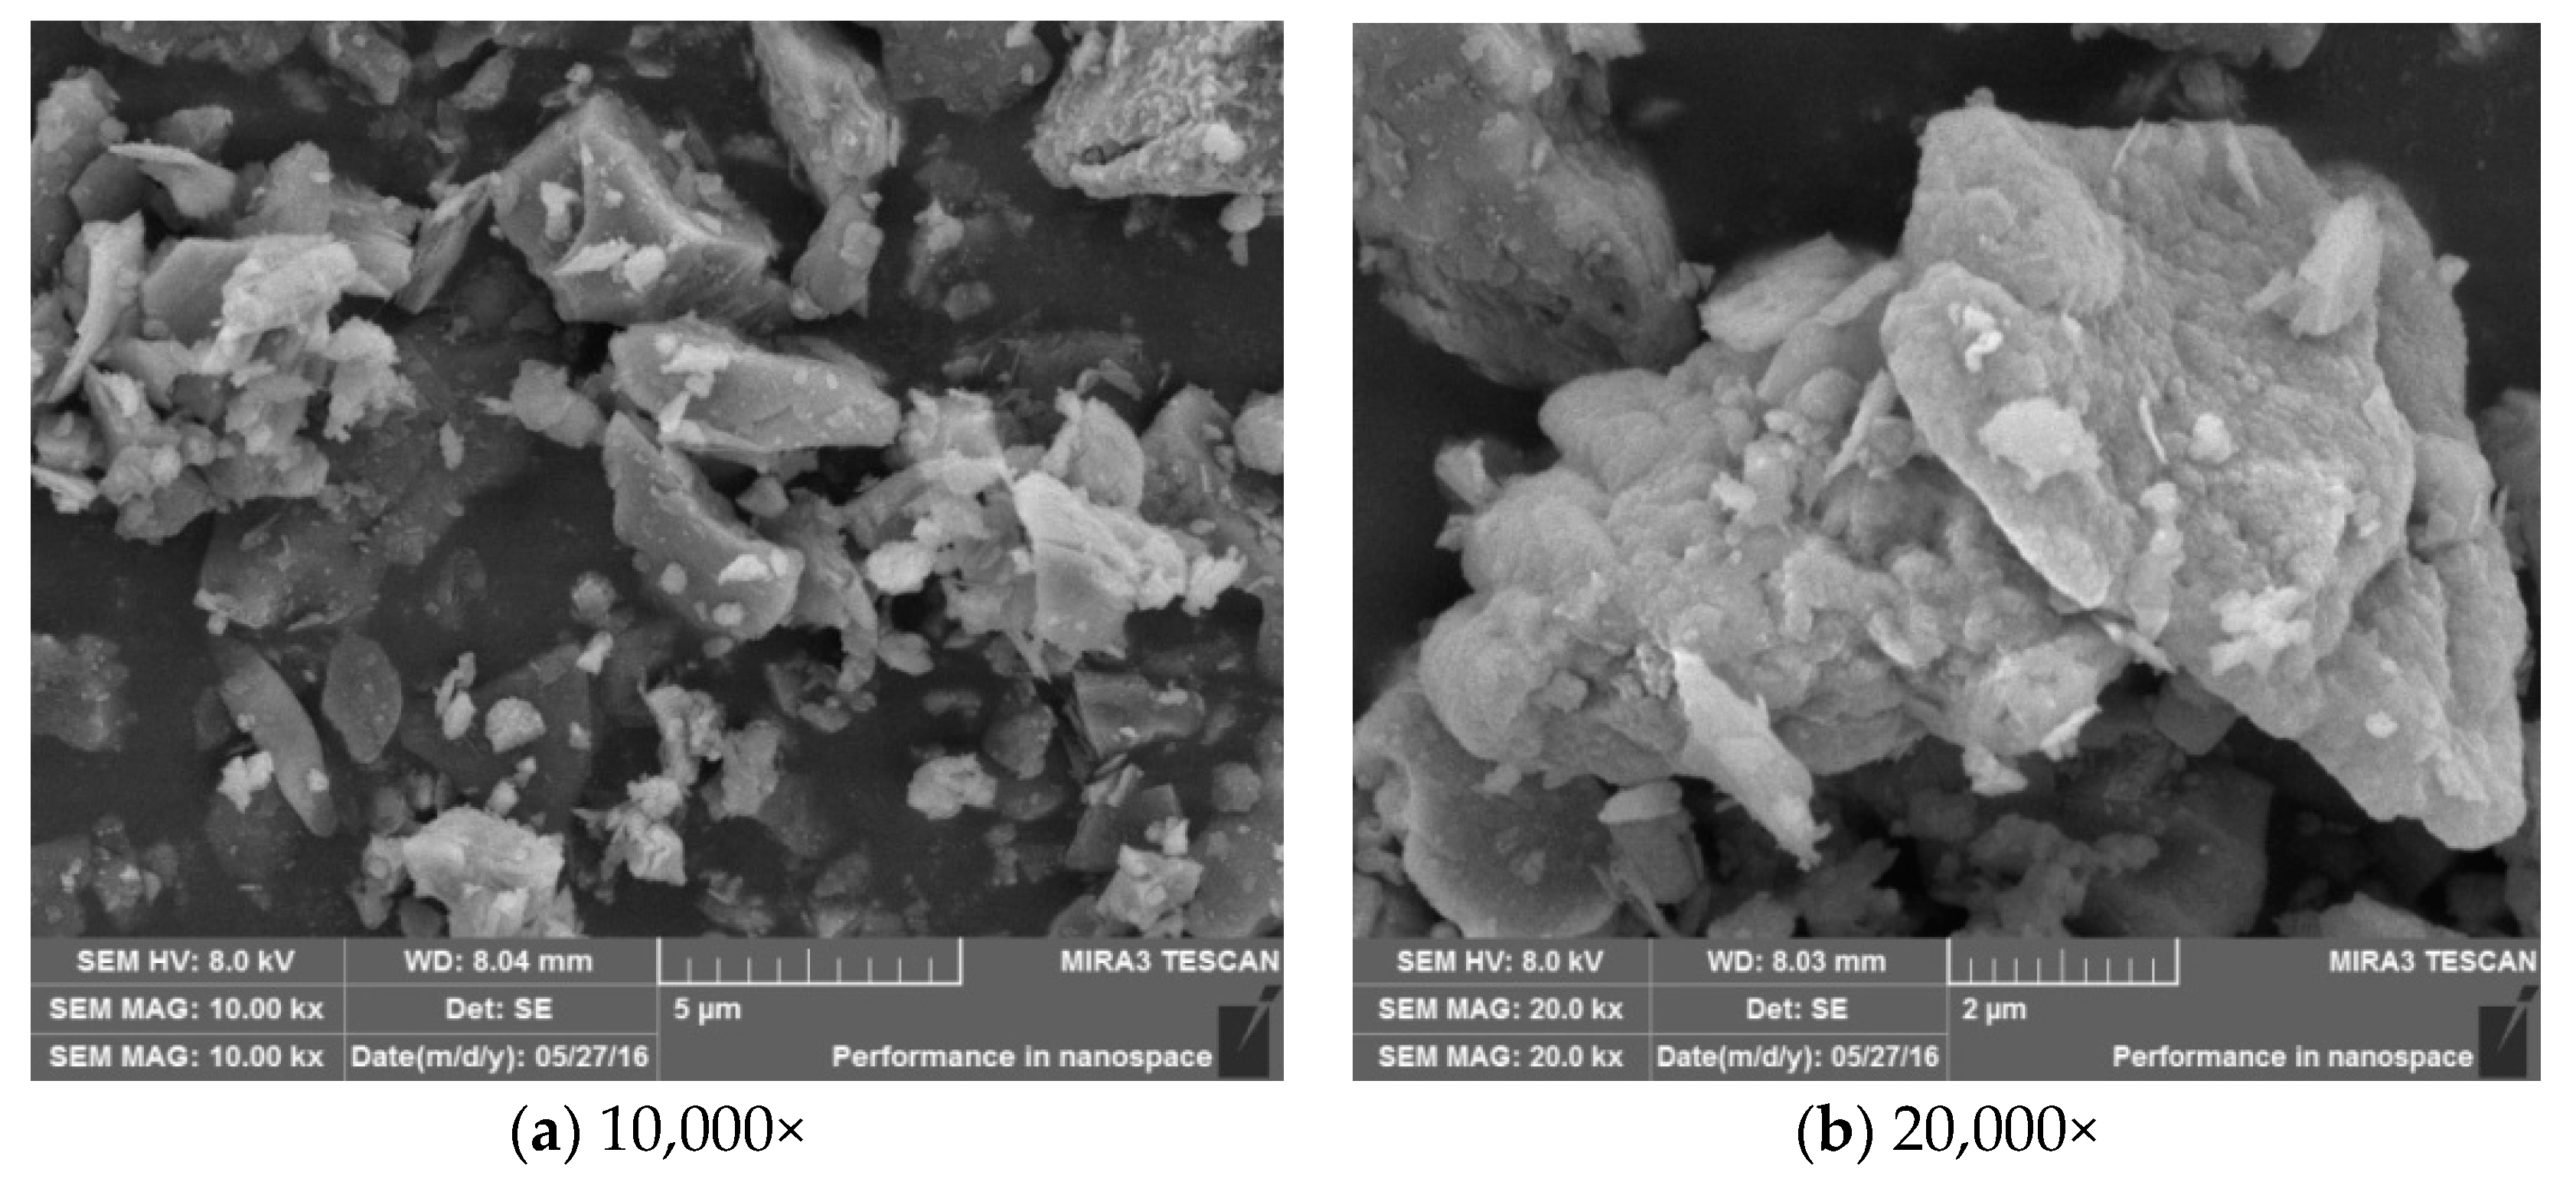
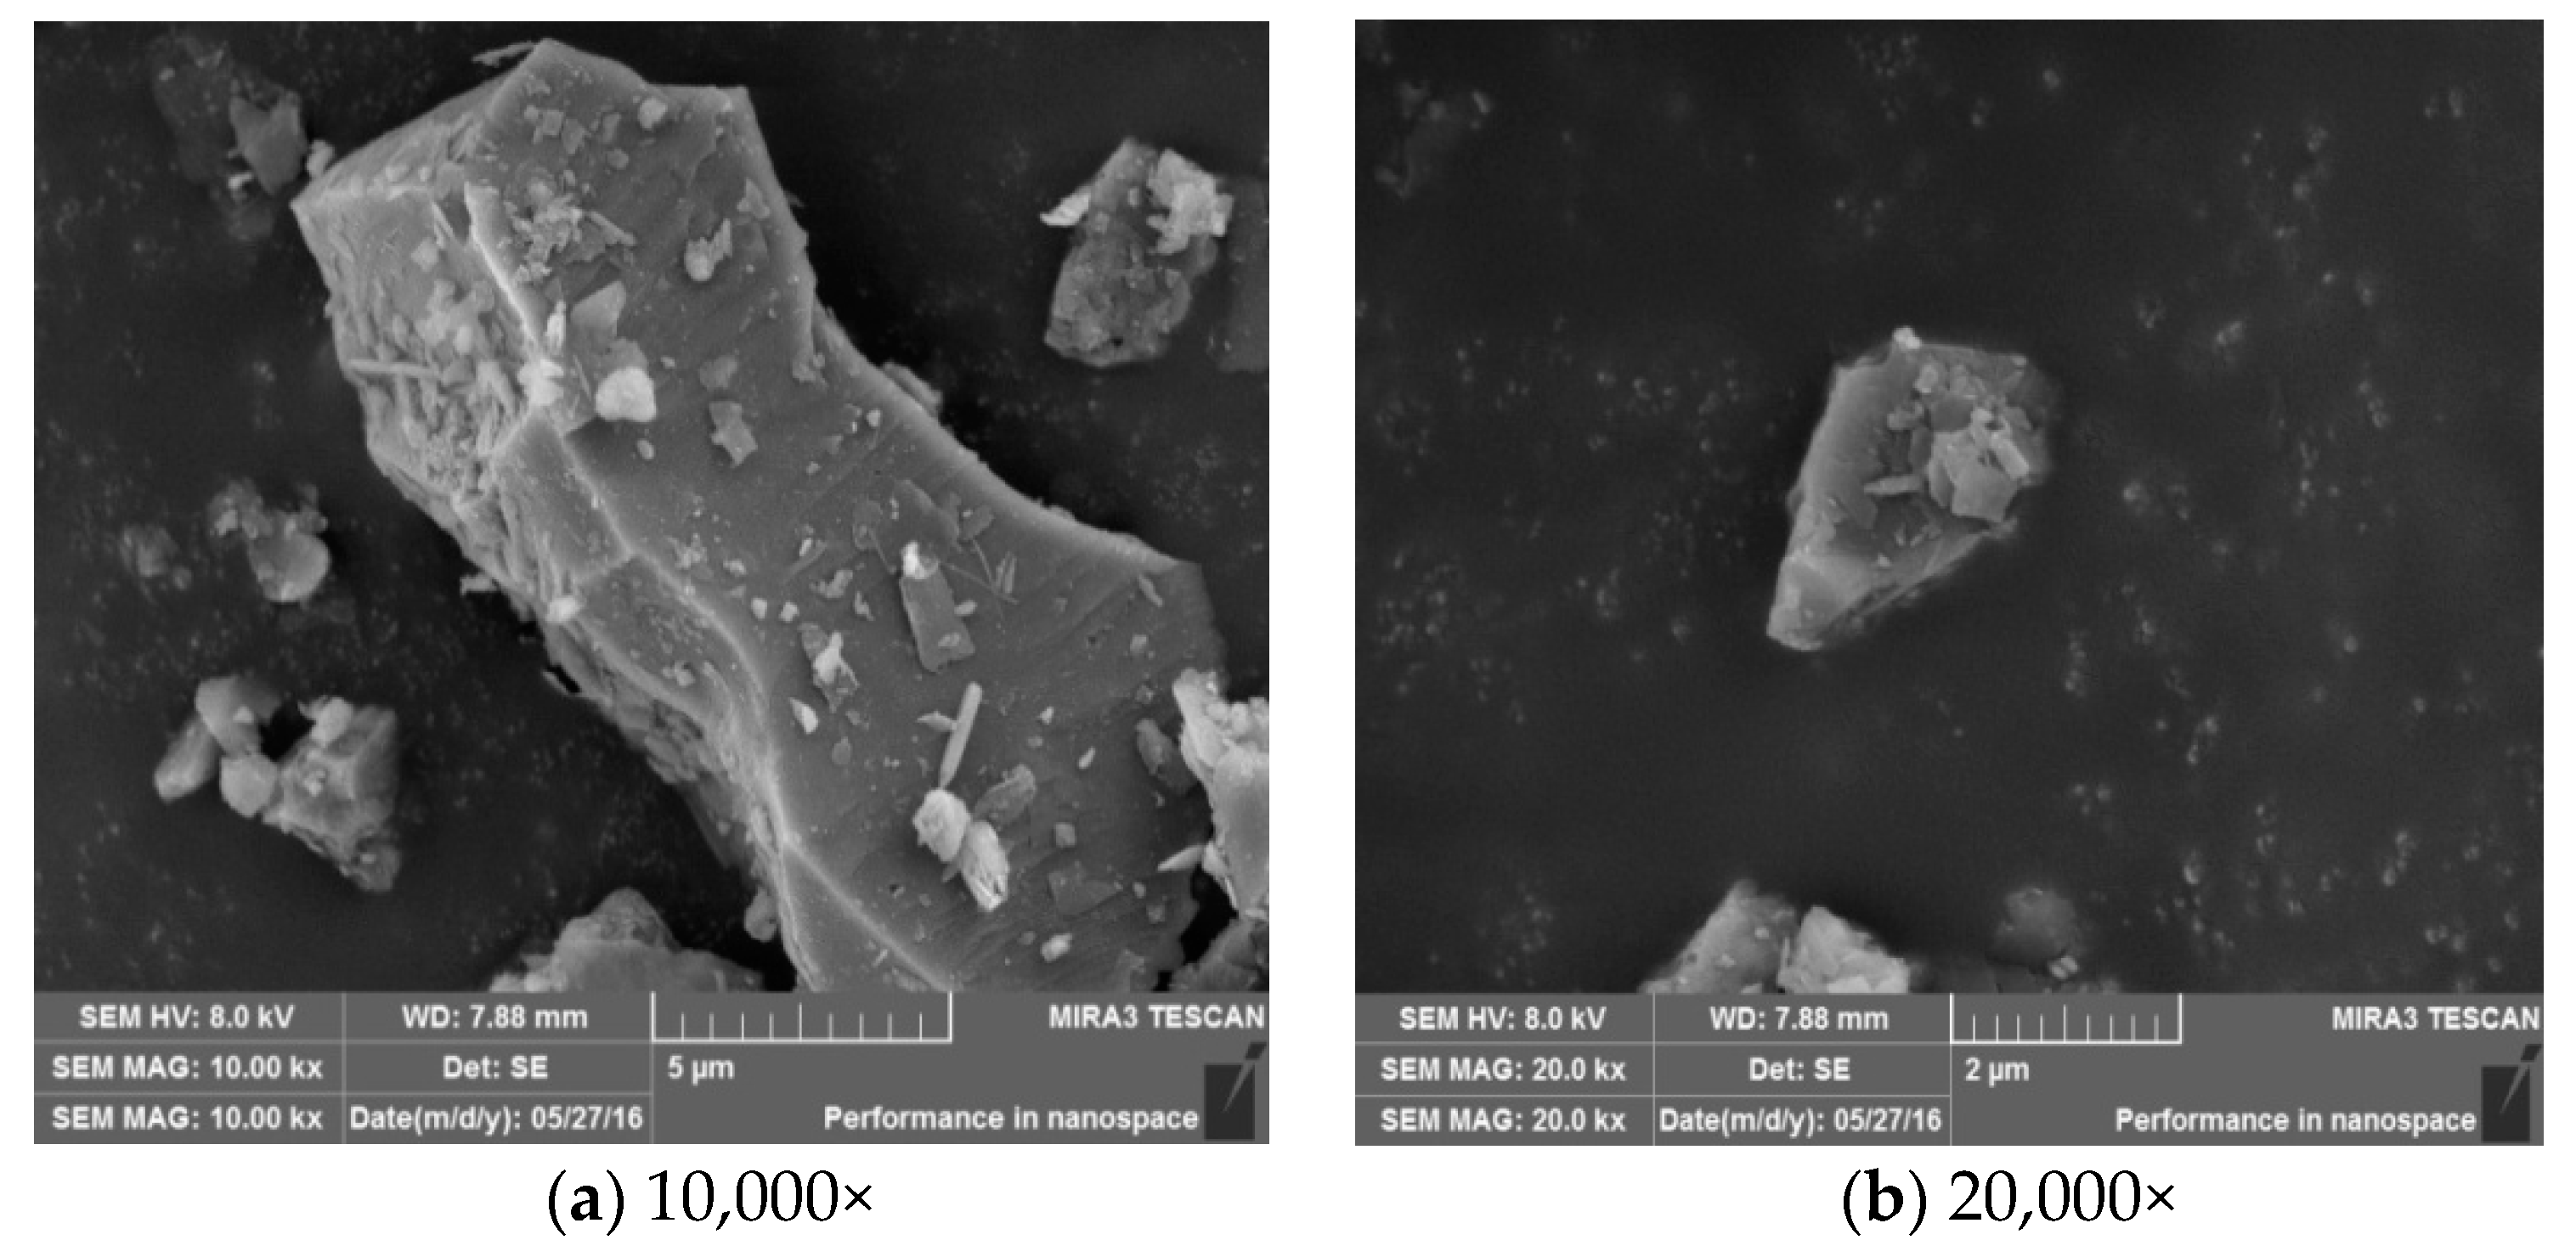
Figure 2.
Scanning electron microscope (SEM) images of raw copper-mine tailings’ powder (10,000 (a) and 20,000 (b) magnification).
Figure 2.
Scanning electron microscope (SEM) images of raw copper-mine tailings’ powder (10,000 (a) and 20,000 (b) magnification).
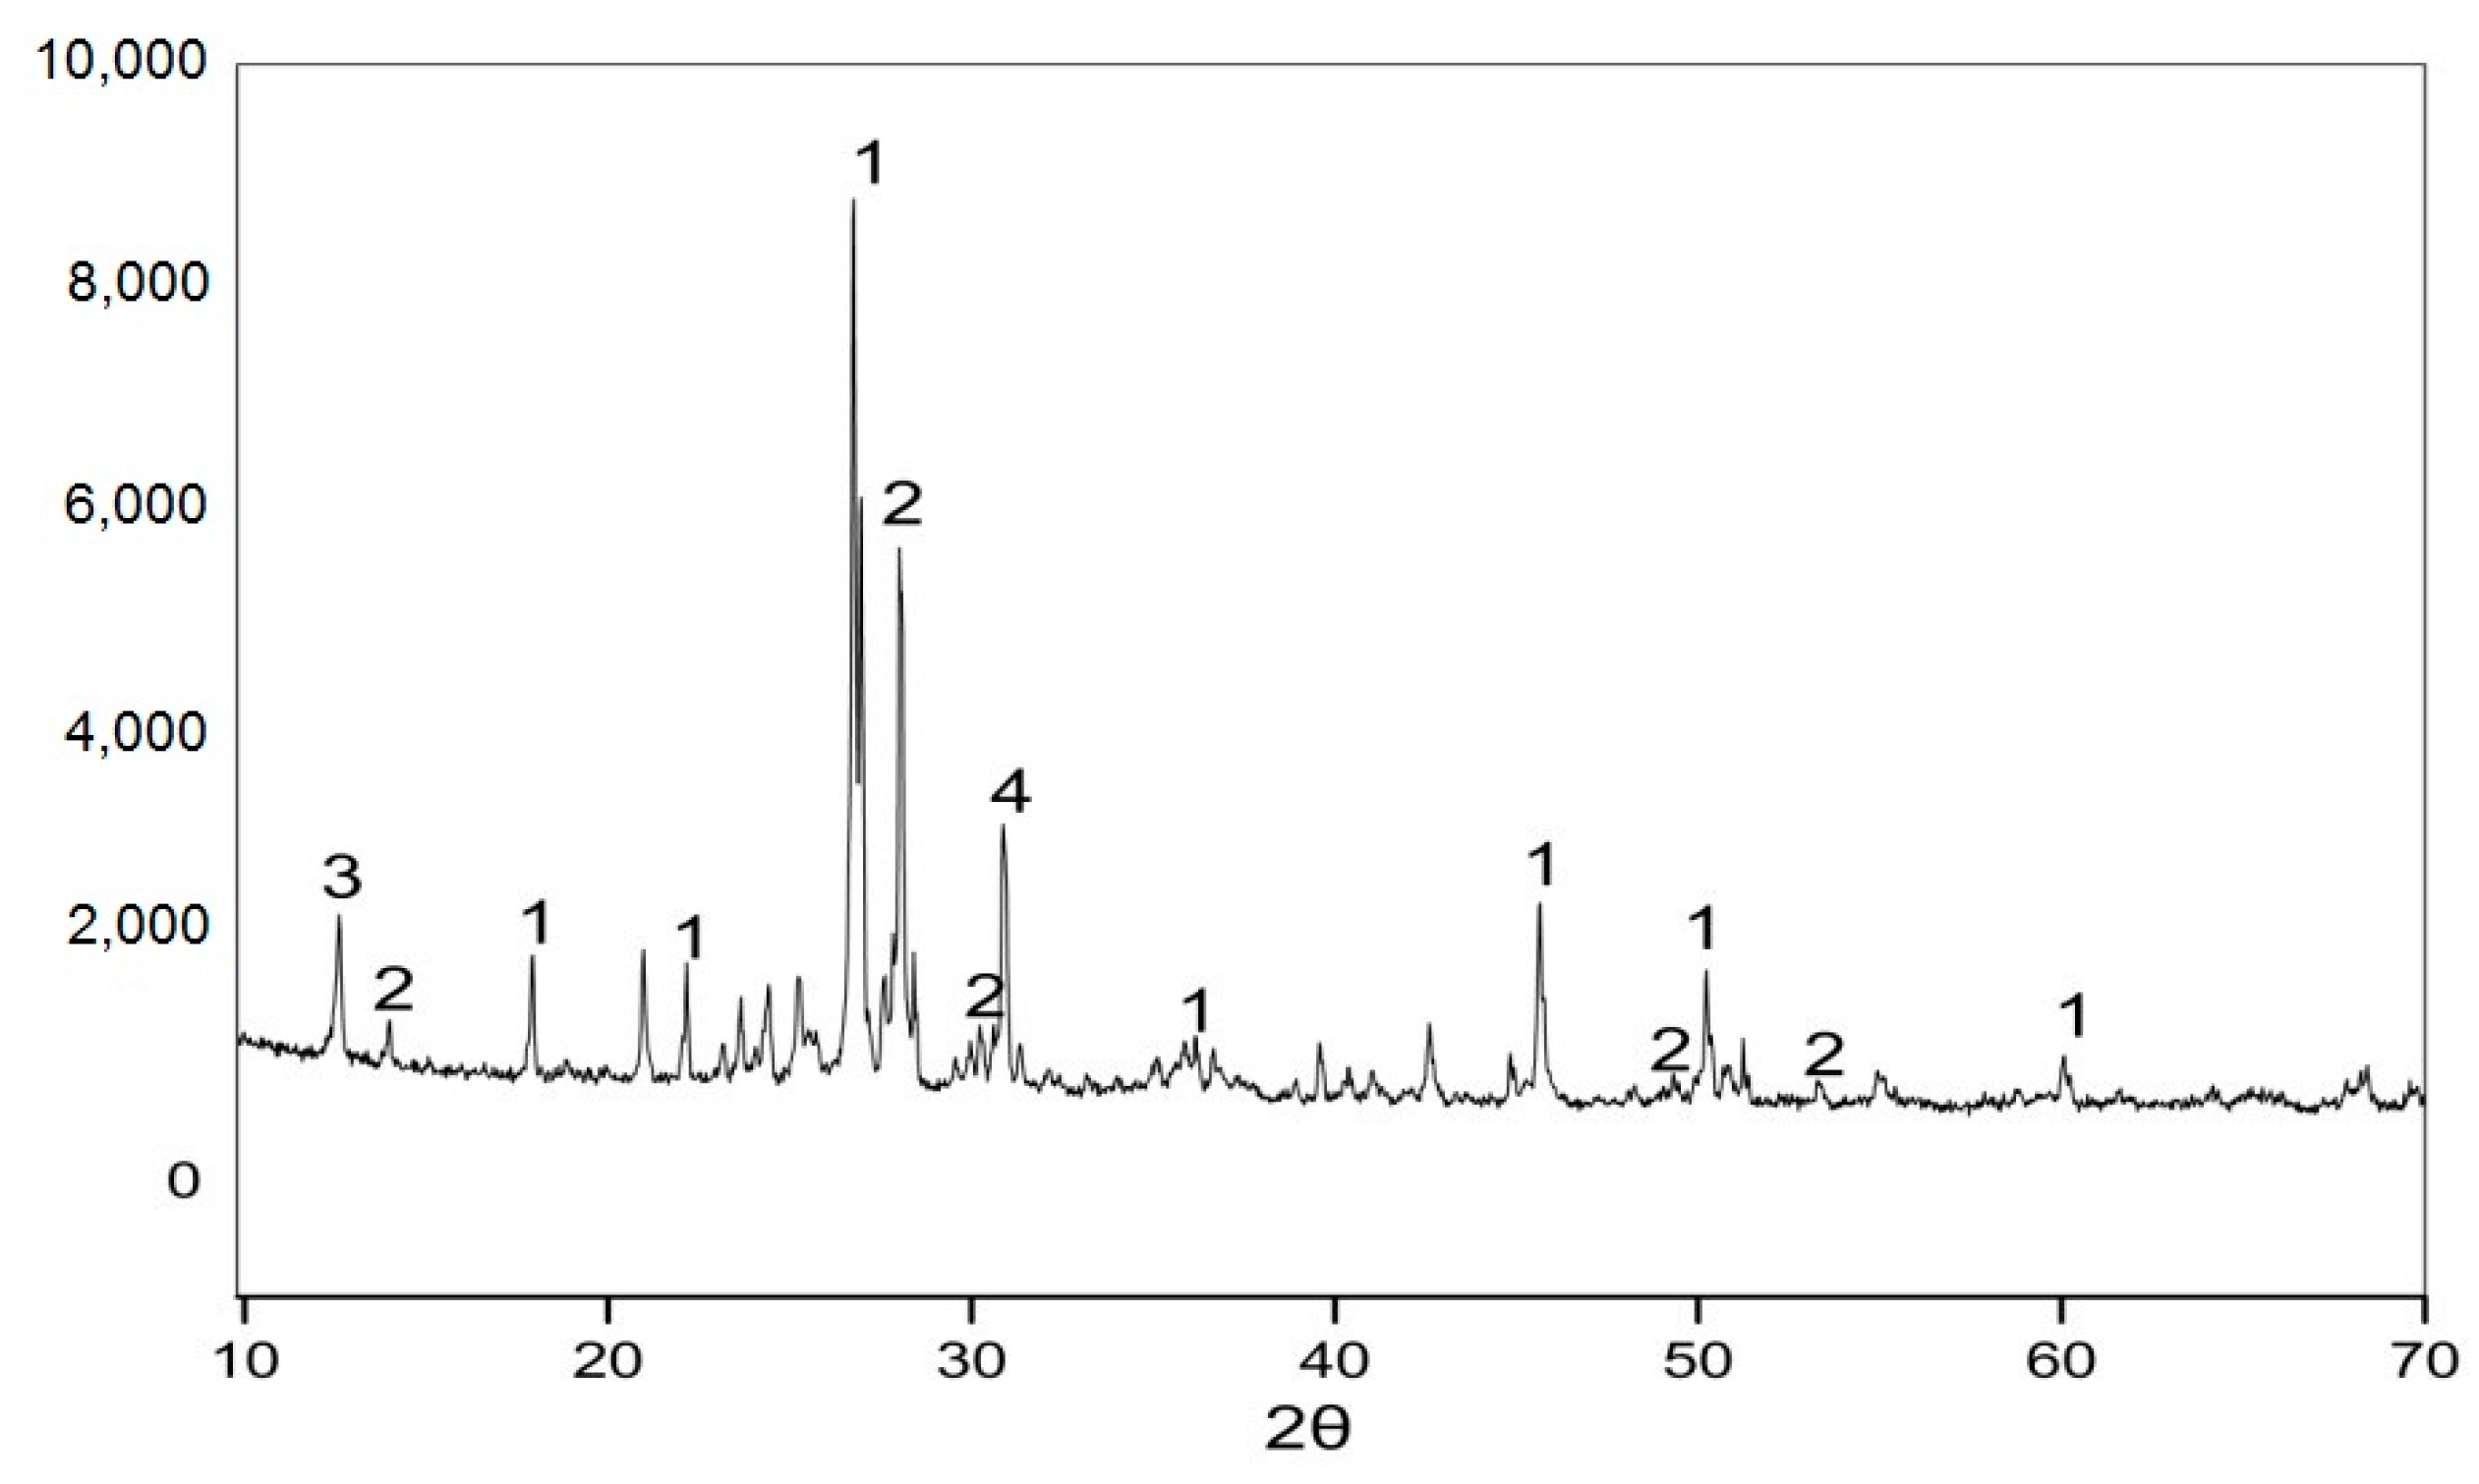
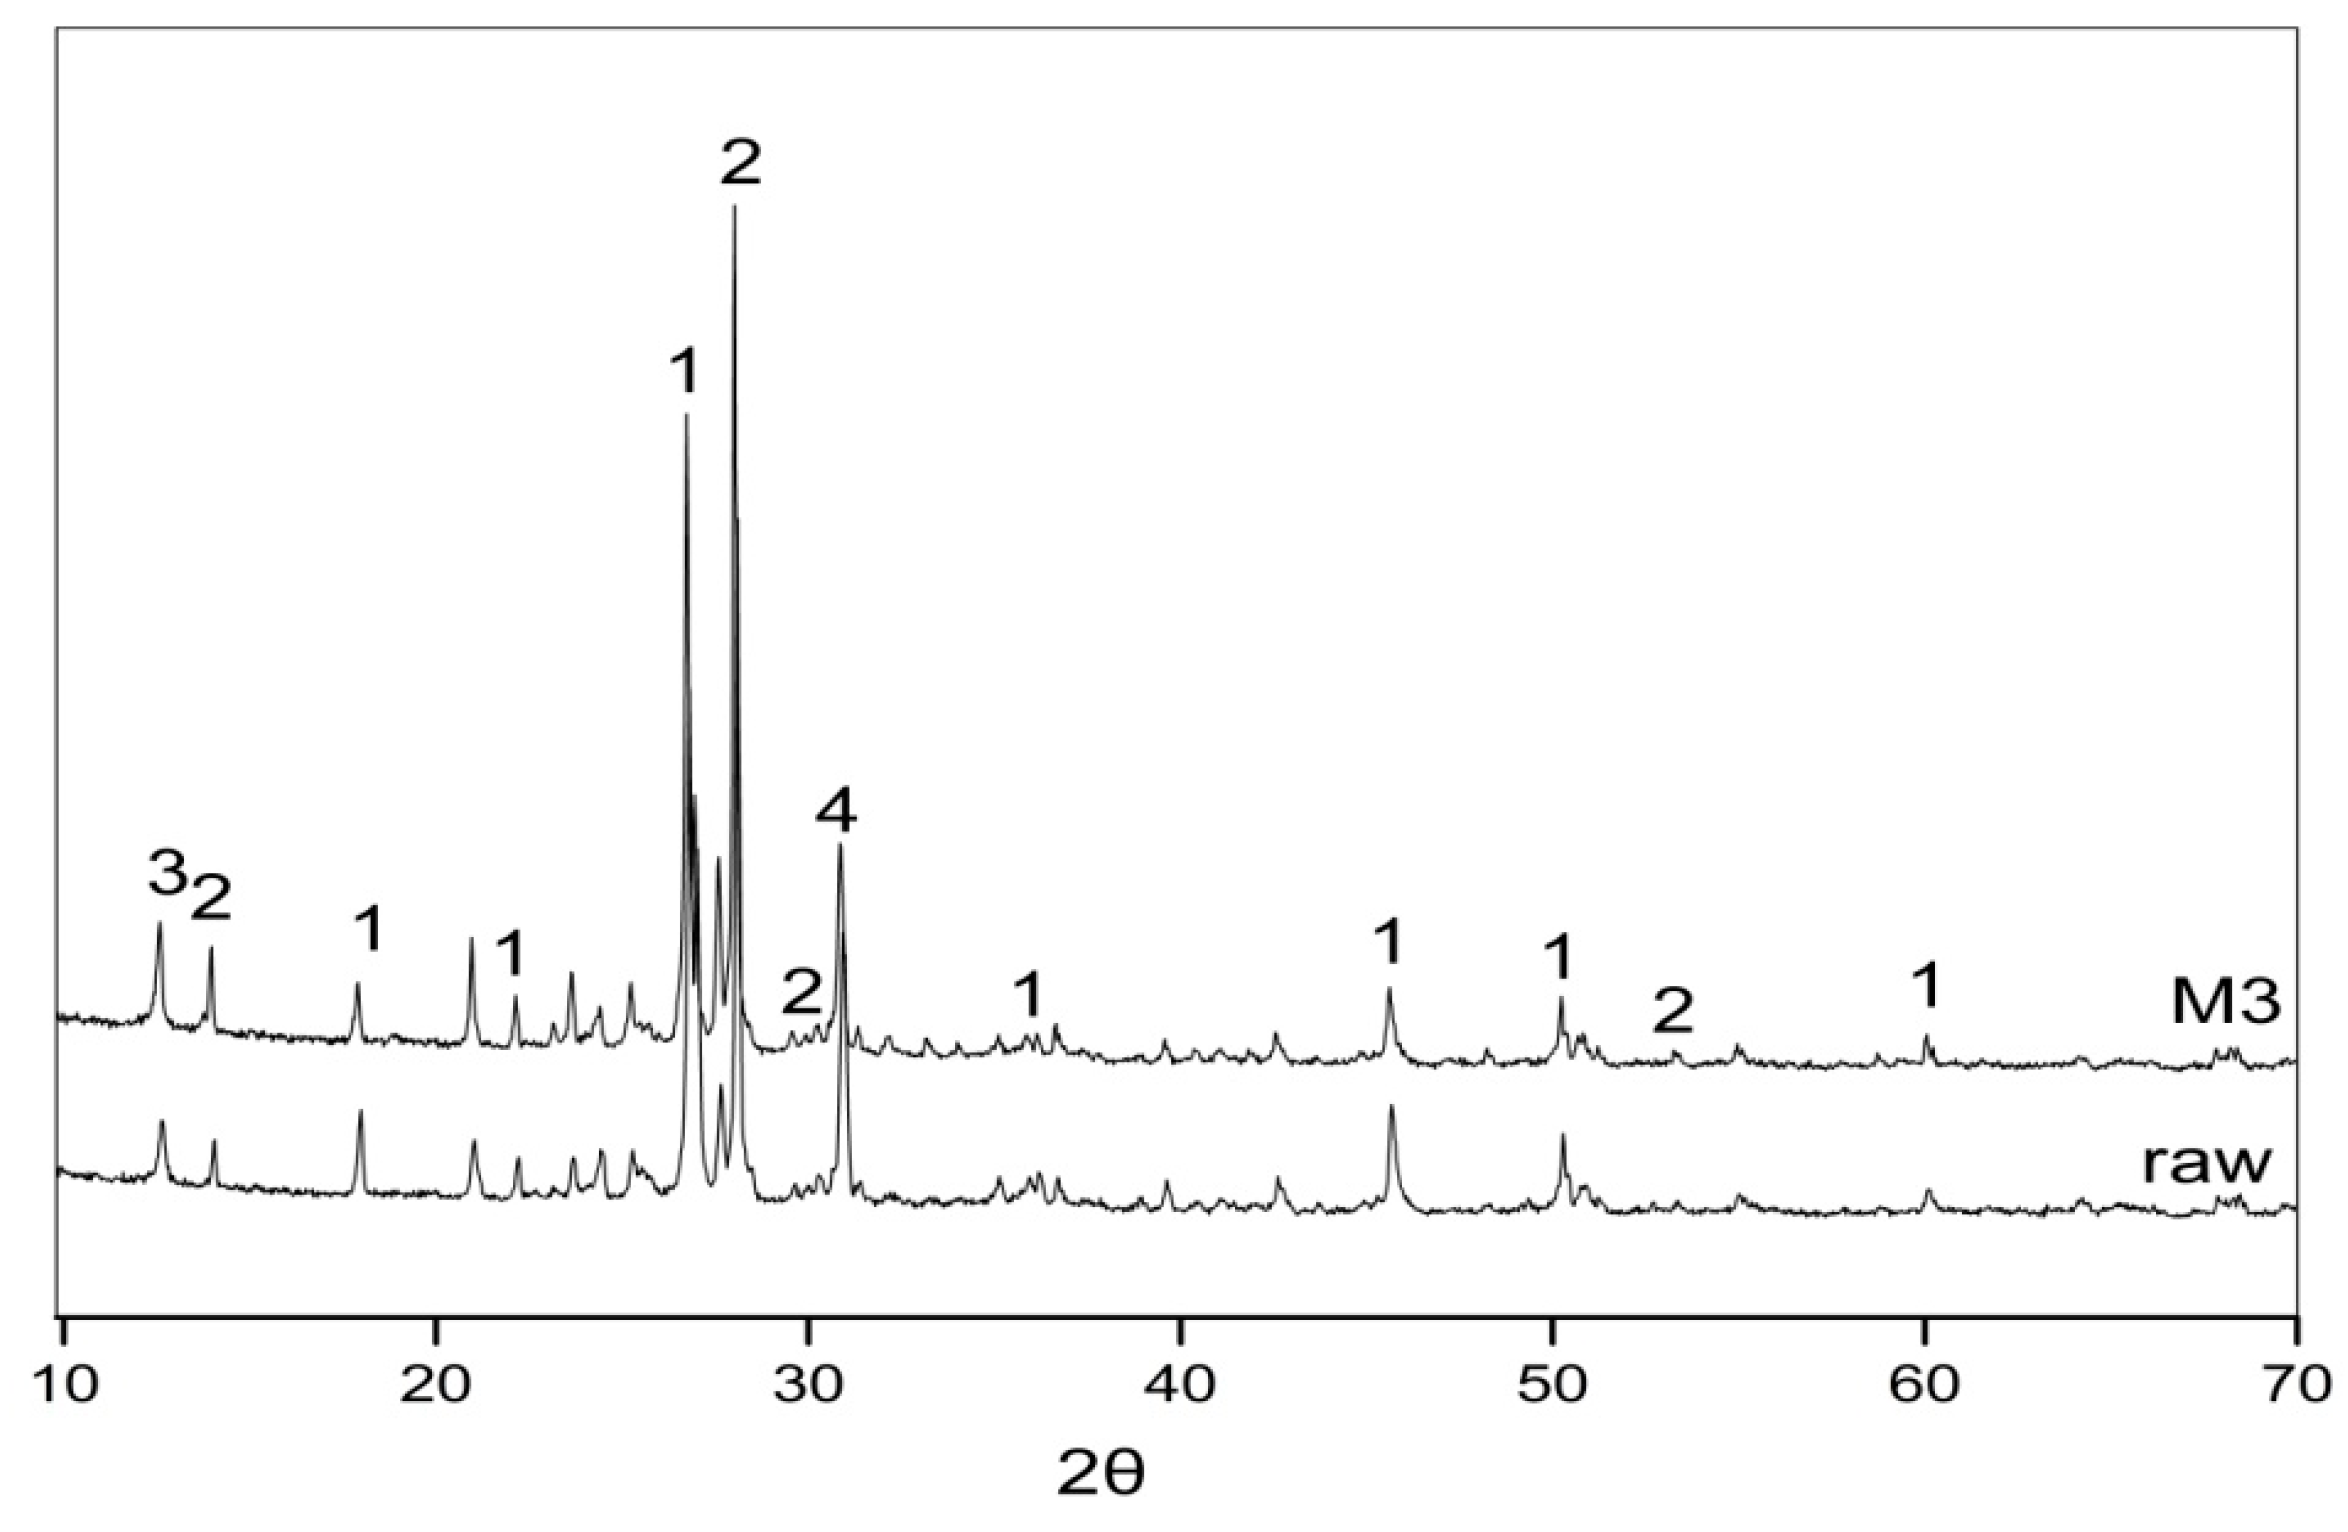
Figure 3.
X-ray diffraction (XRD) pattern of raw copper-mine tailings’ powder (1 quartz, 2 albite, 3 chlorite, 4 dolomite).
Figure 3.
X-ray diffraction (XRD) pattern of raw copper-mine tailings’ powder (1 quartz, 2 albite, 3 chlorite, 4 dolomite).
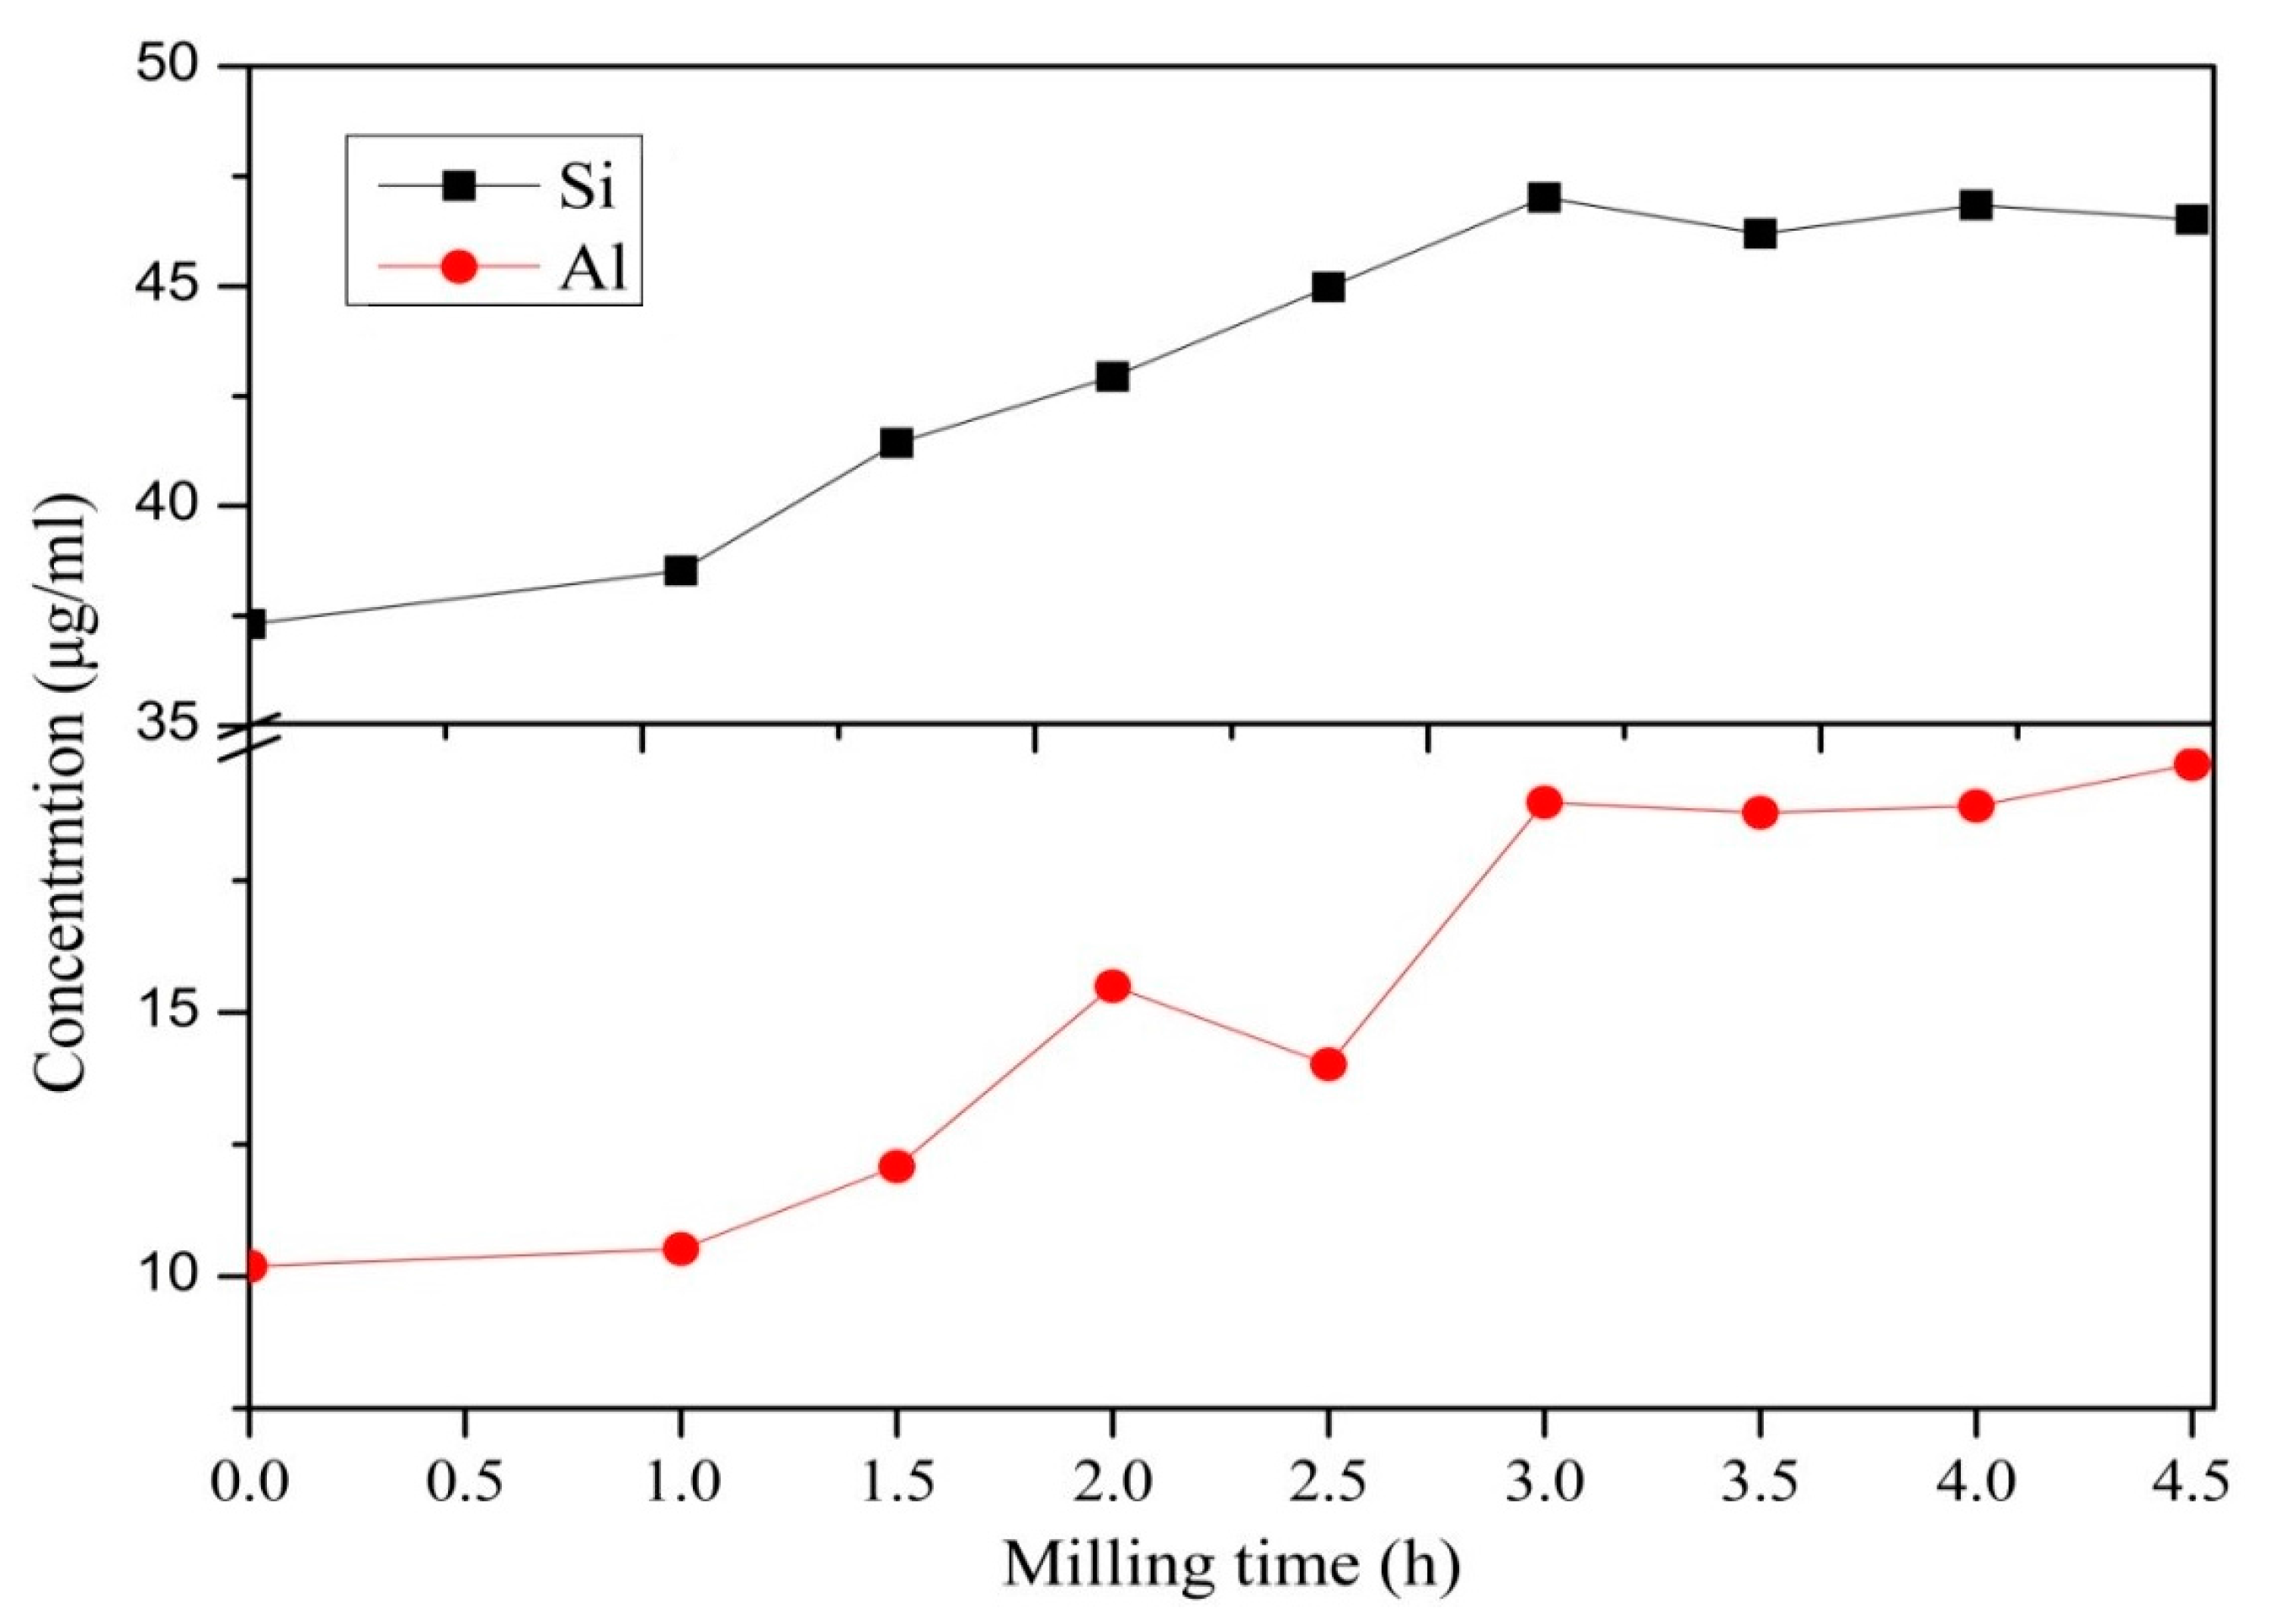
Figure 4.
Si and Al leaching concentrations after mechanical activation of copper-mine tailings.
Figure 4.
Si and Al leaching concentrations after mechanical activation of copper-mine tailings.
Figure 5.
The effect of grinding on the particle sizes of copper-mine tailings at different time intervals.
Figure 5.
The effect of grinding on the particle sizes of copper-mine tailings at different time intervals.
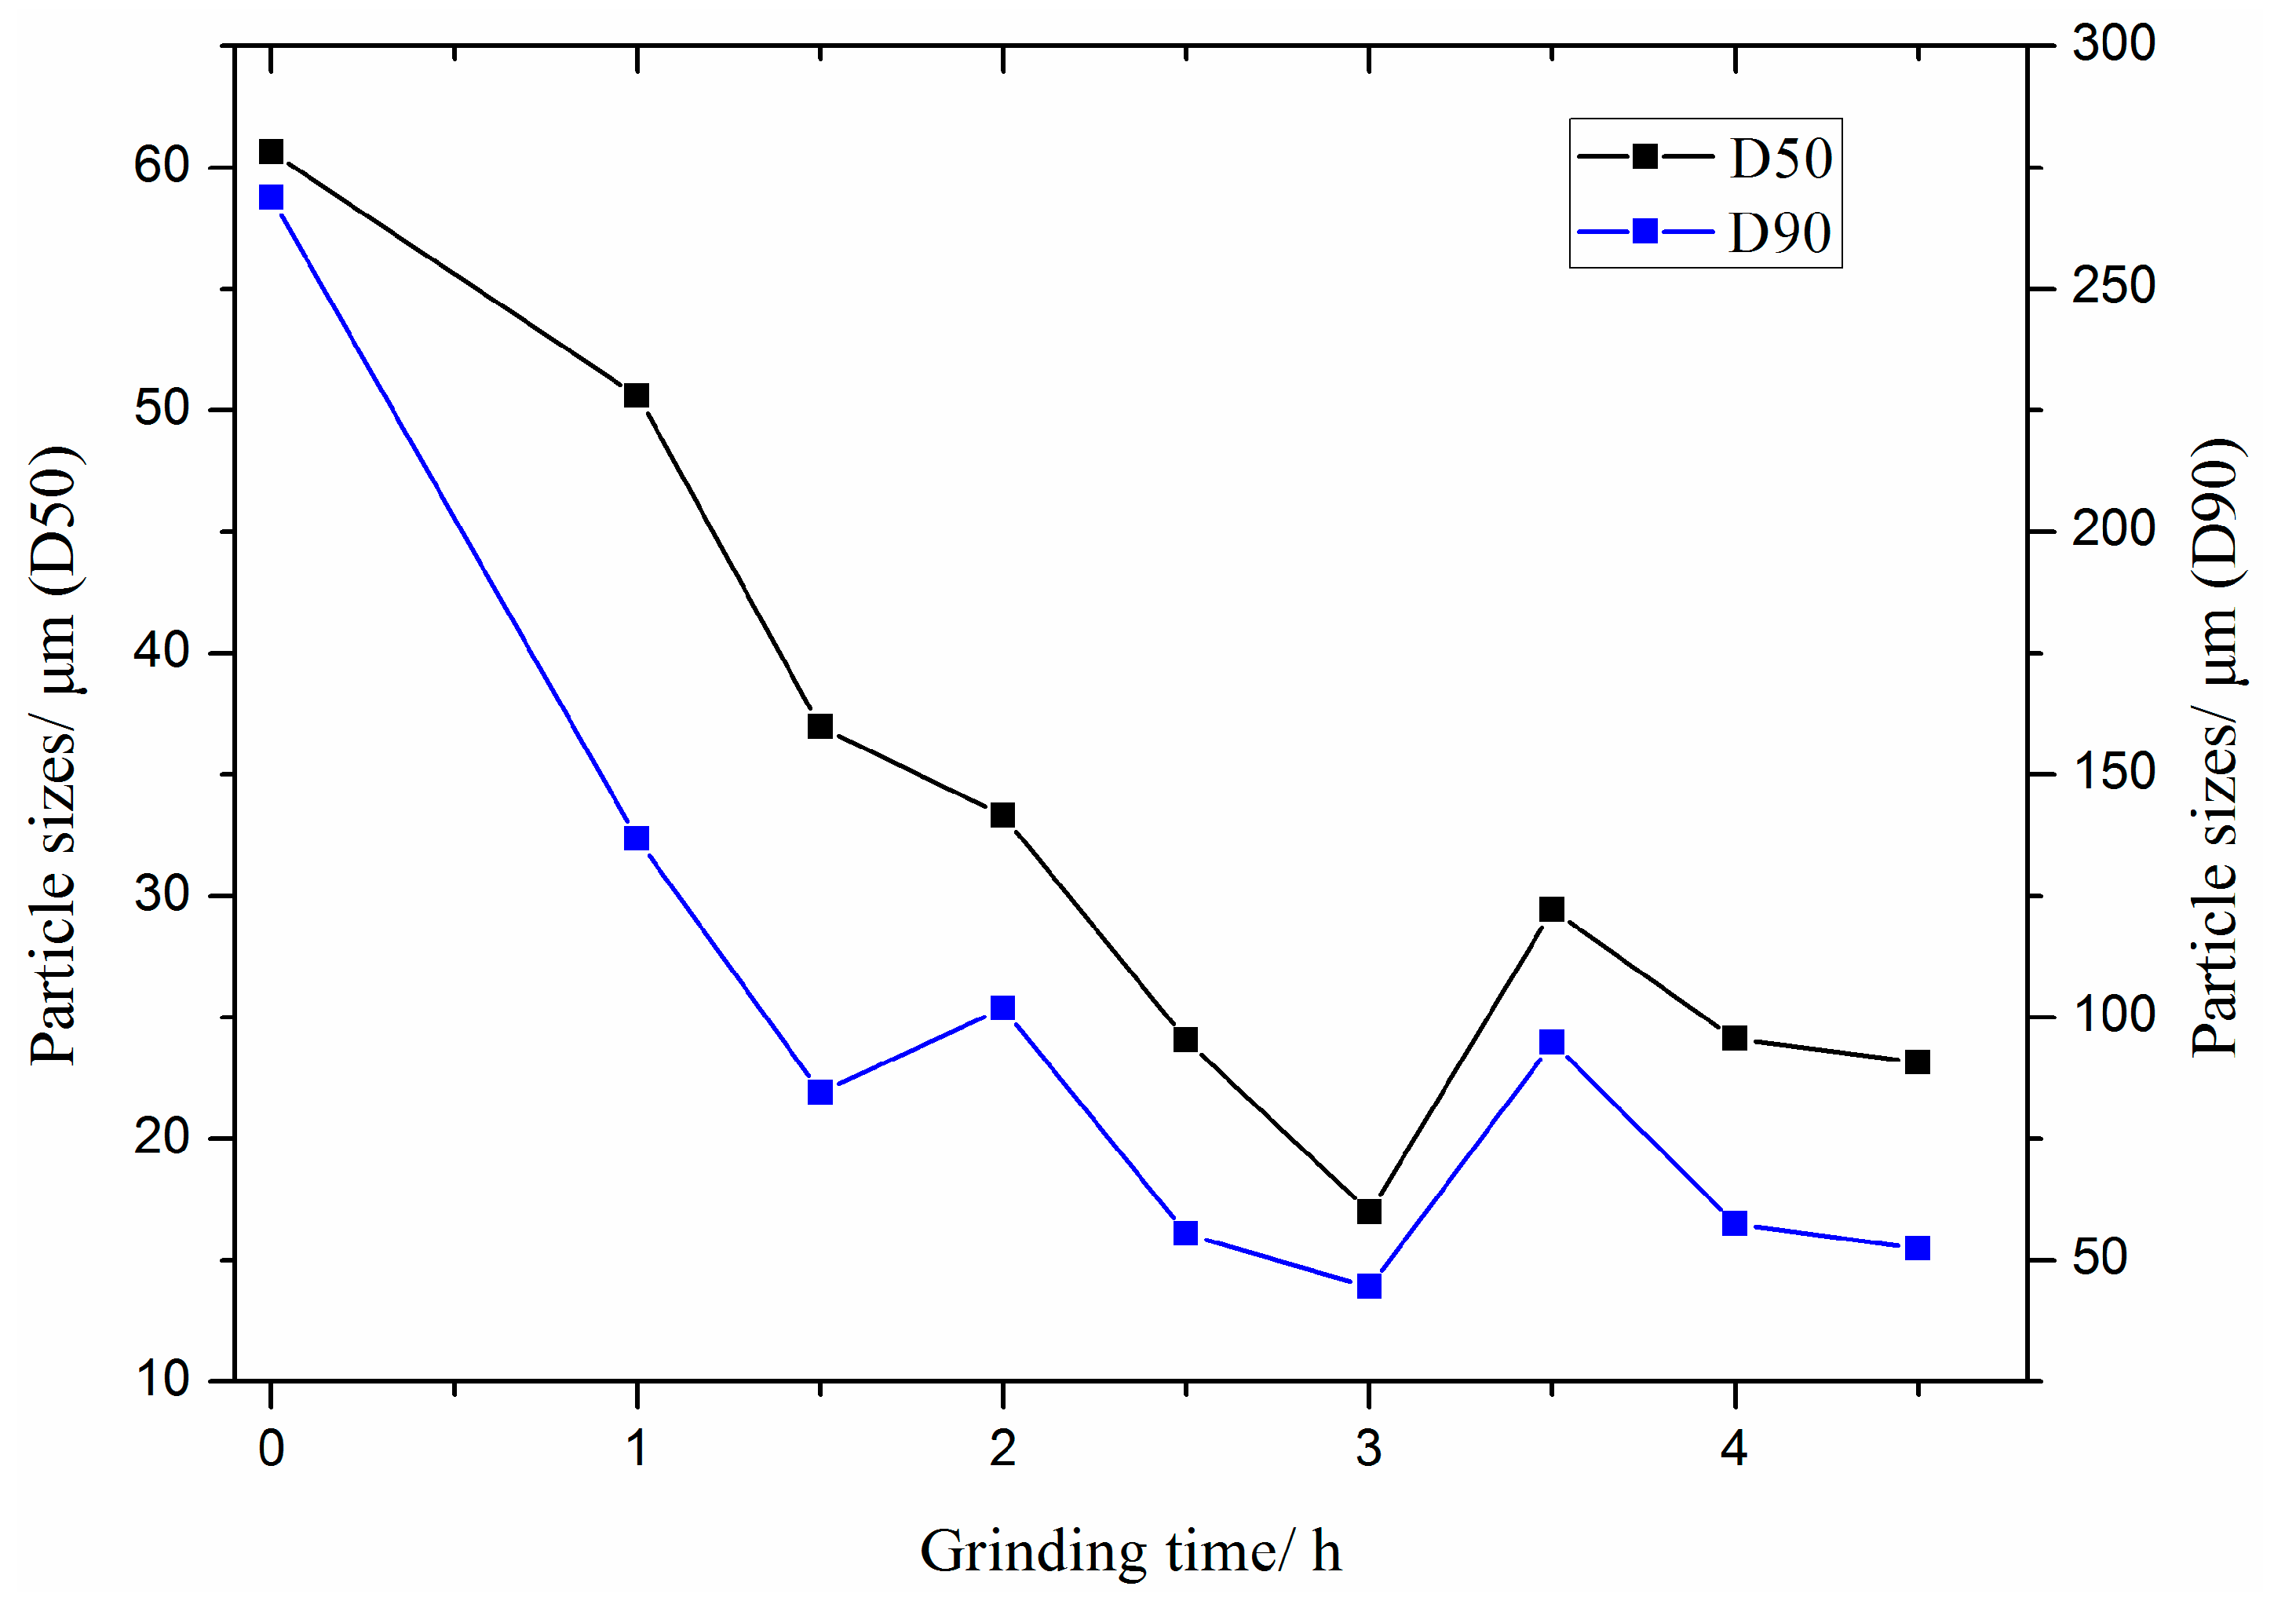
Figure 6.
Variations of particle sizes (D50 and D90) of copper-mine tailings after grinding.
Figure 6.
Variations of particle sizes (D50 and D90) of copper-mine tailings after grinding.
Figure 7.
SEM images of activated sample M3 (after 3 h of grinding) (10,000 (a) and 20,000 (b) magnification).
Figure 7.
SEM images of activated sample M3 (after 3 h of grinding) (10,000 (a) and 20,000 (b) magnification).
Figure 8.
XRD result of raw copper-mine tailings and sample M3 (after 3 h of grinding) (1 quartz, 2 albite, 3 chlorite, 4 dolomite).
Figure 8.
XRD result of raw copper-mine tailings and sample M3 (after 3 h of grinding) (1 quartz, 2 albite, 3 chlorite, 4 dolomite).
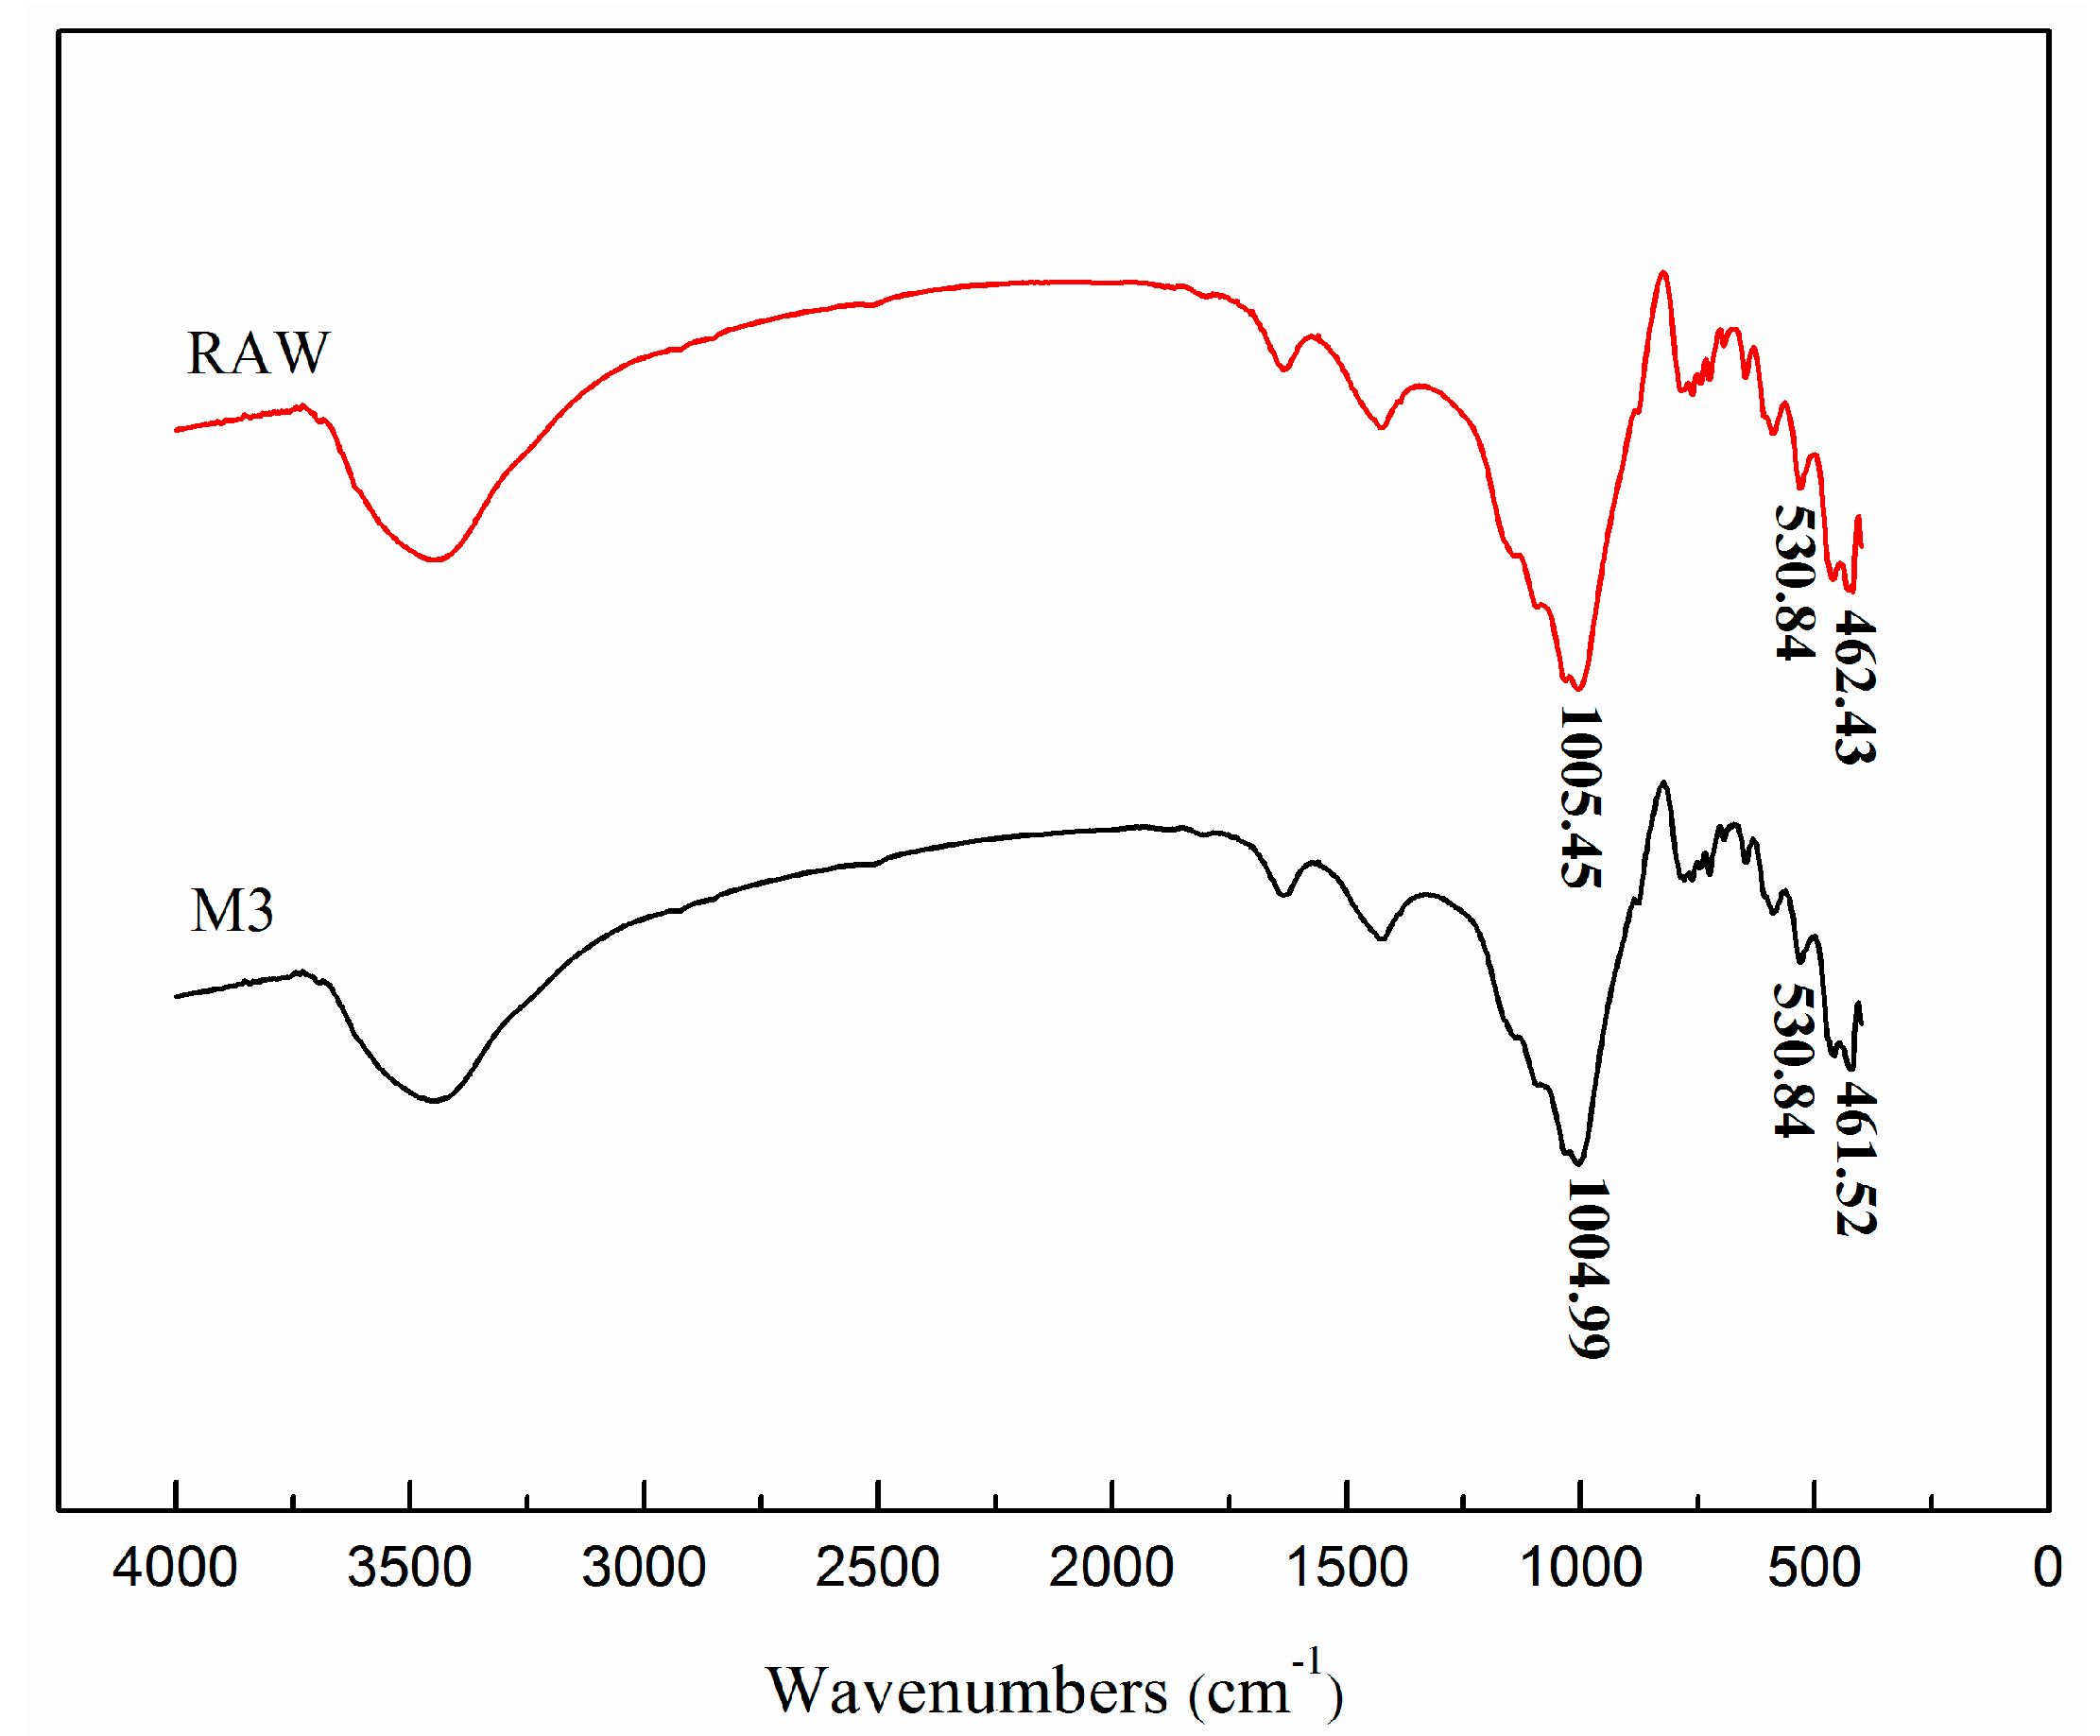
Figure 9.
Fourier transform infra-red (FTIR) spectra of raw copper-mine tailings and Sample M3 (after 3 h of grinding).
Figure 9.
Fourier transform infra-red (FTIR) spectra of raw copper-mine tailings and Sample M3 (after 3 h of grinding).
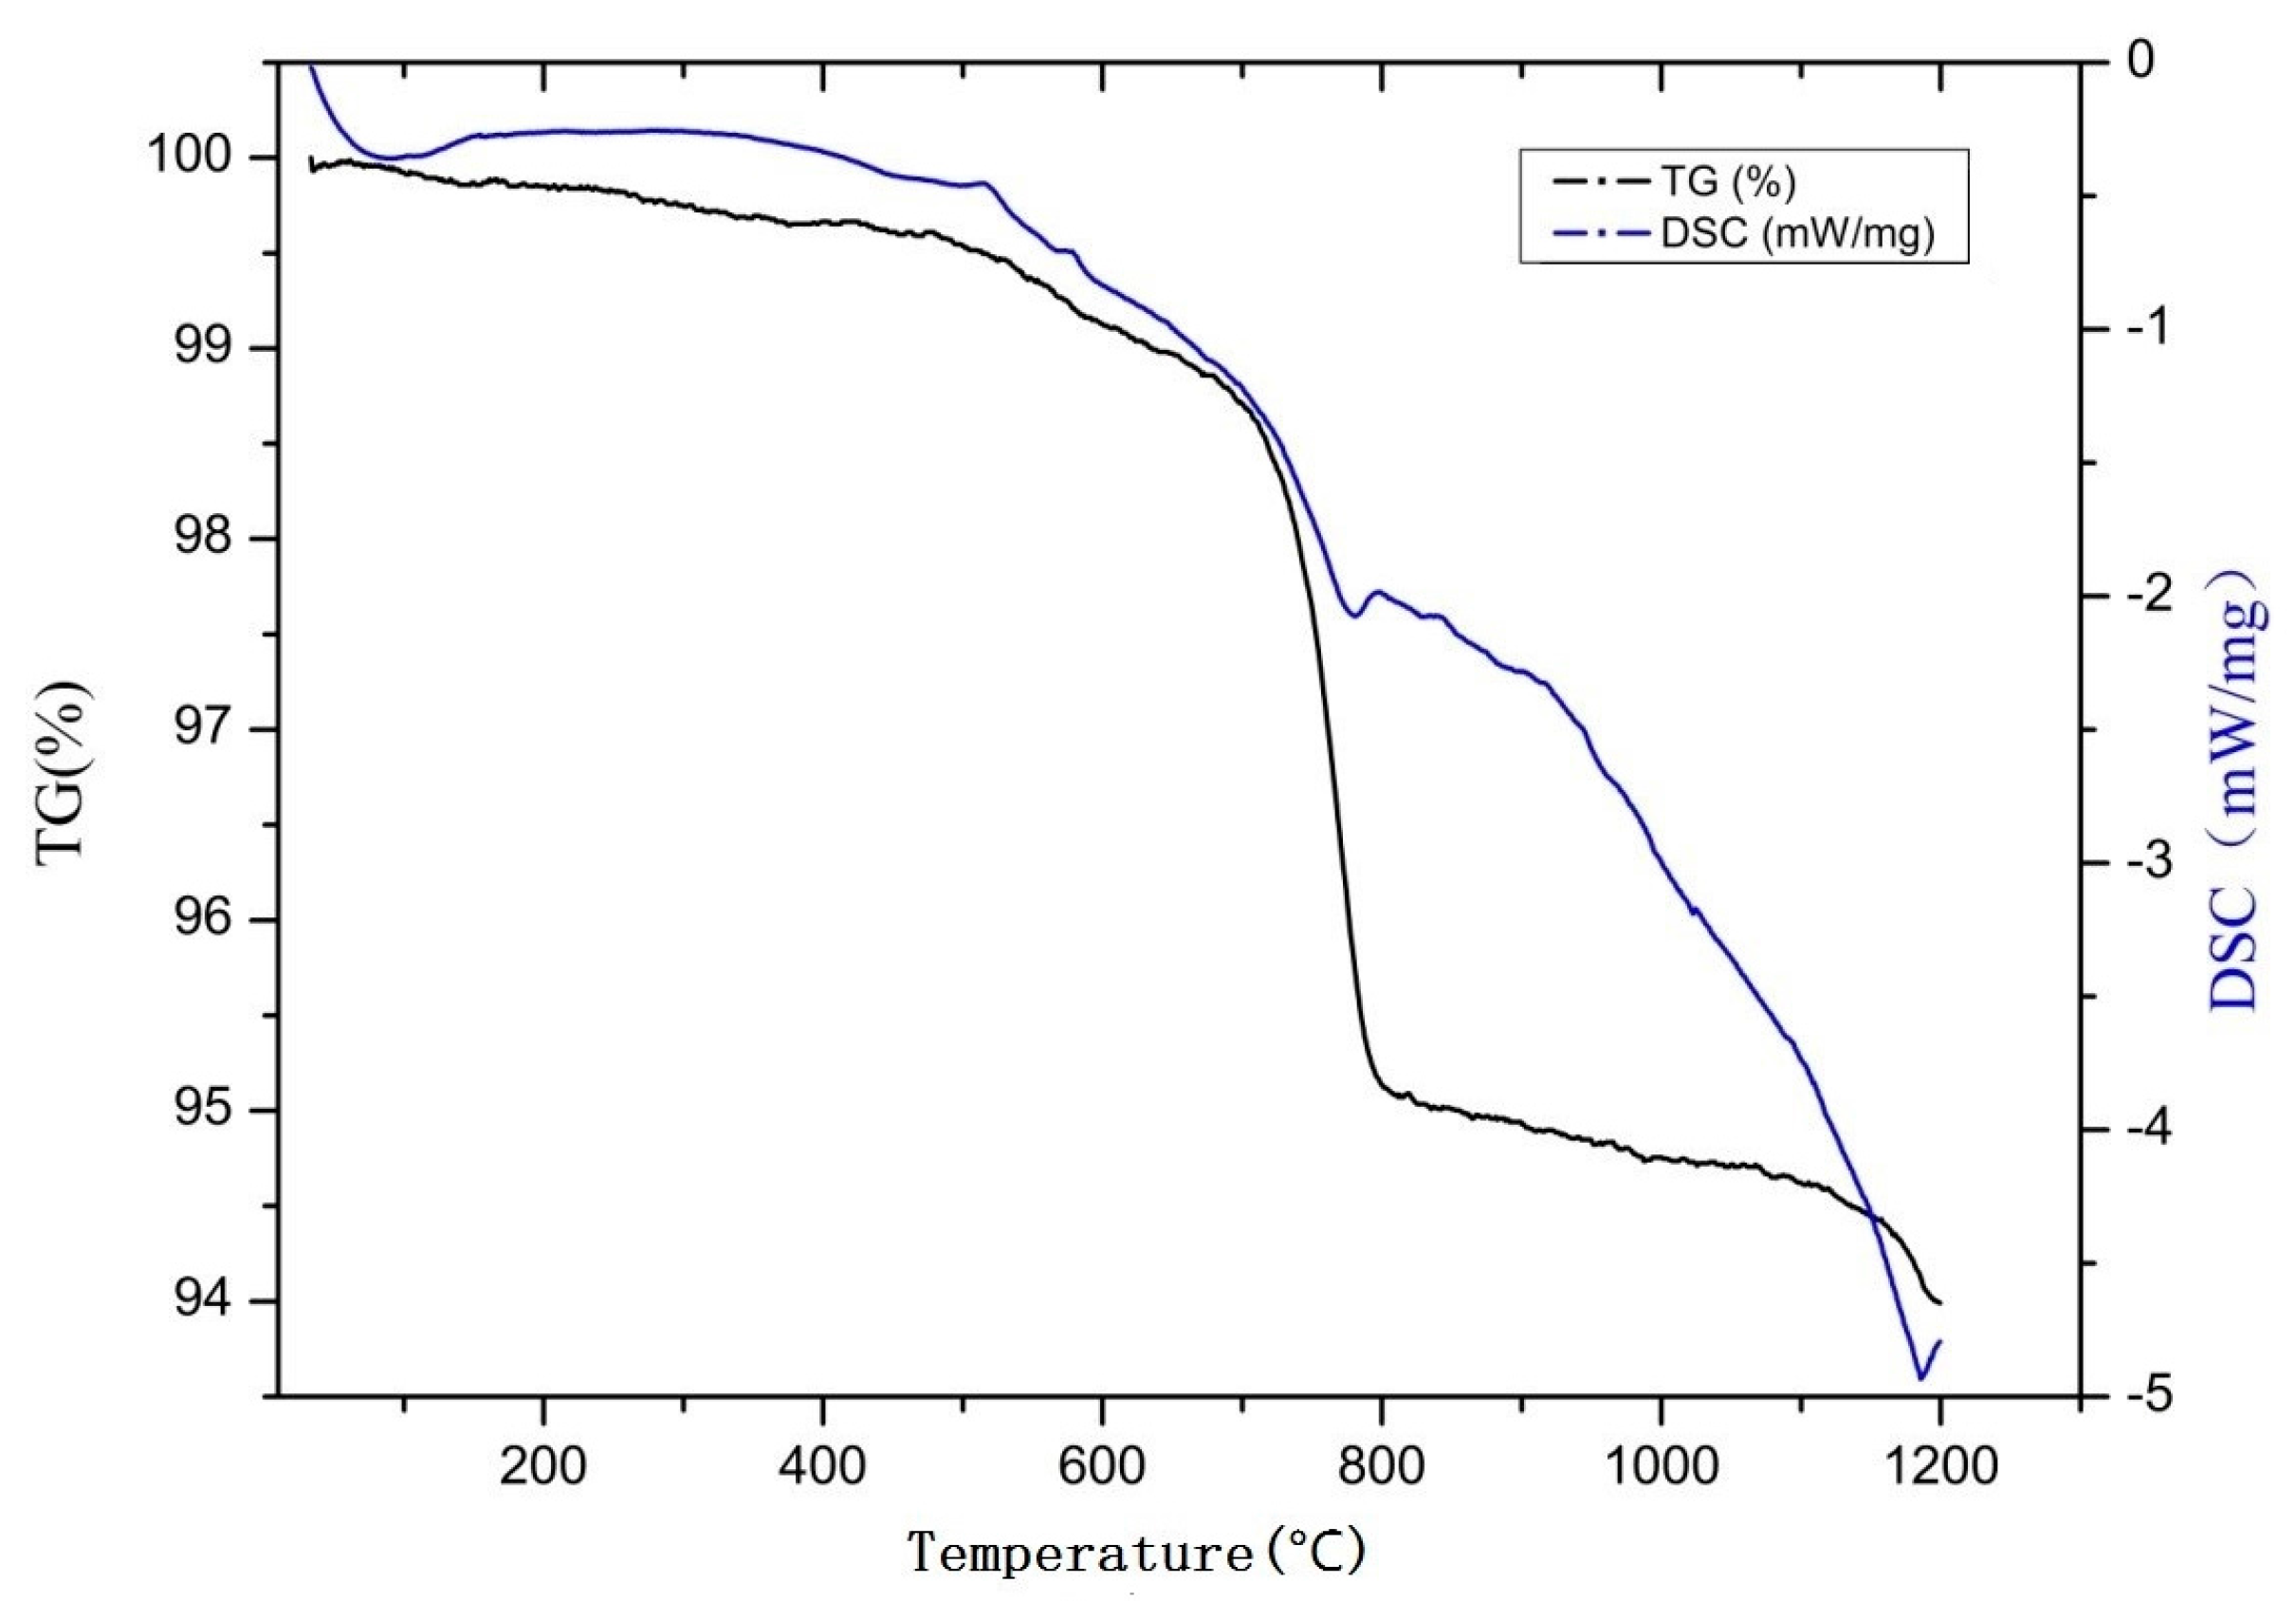
Figure 10.
Thermo-gravimetric–differential scanning calorimetry (TG–DSC) curve of raw copper mine tailings (10 °C~1200 °C; atmospheric conditions).
Figure 10.
Thermo-gravimetric–differential scanning calorimetry (TG–DSC) curve of raw copper mine tailings (10 °C~1200 °C; atmospheric conditions).
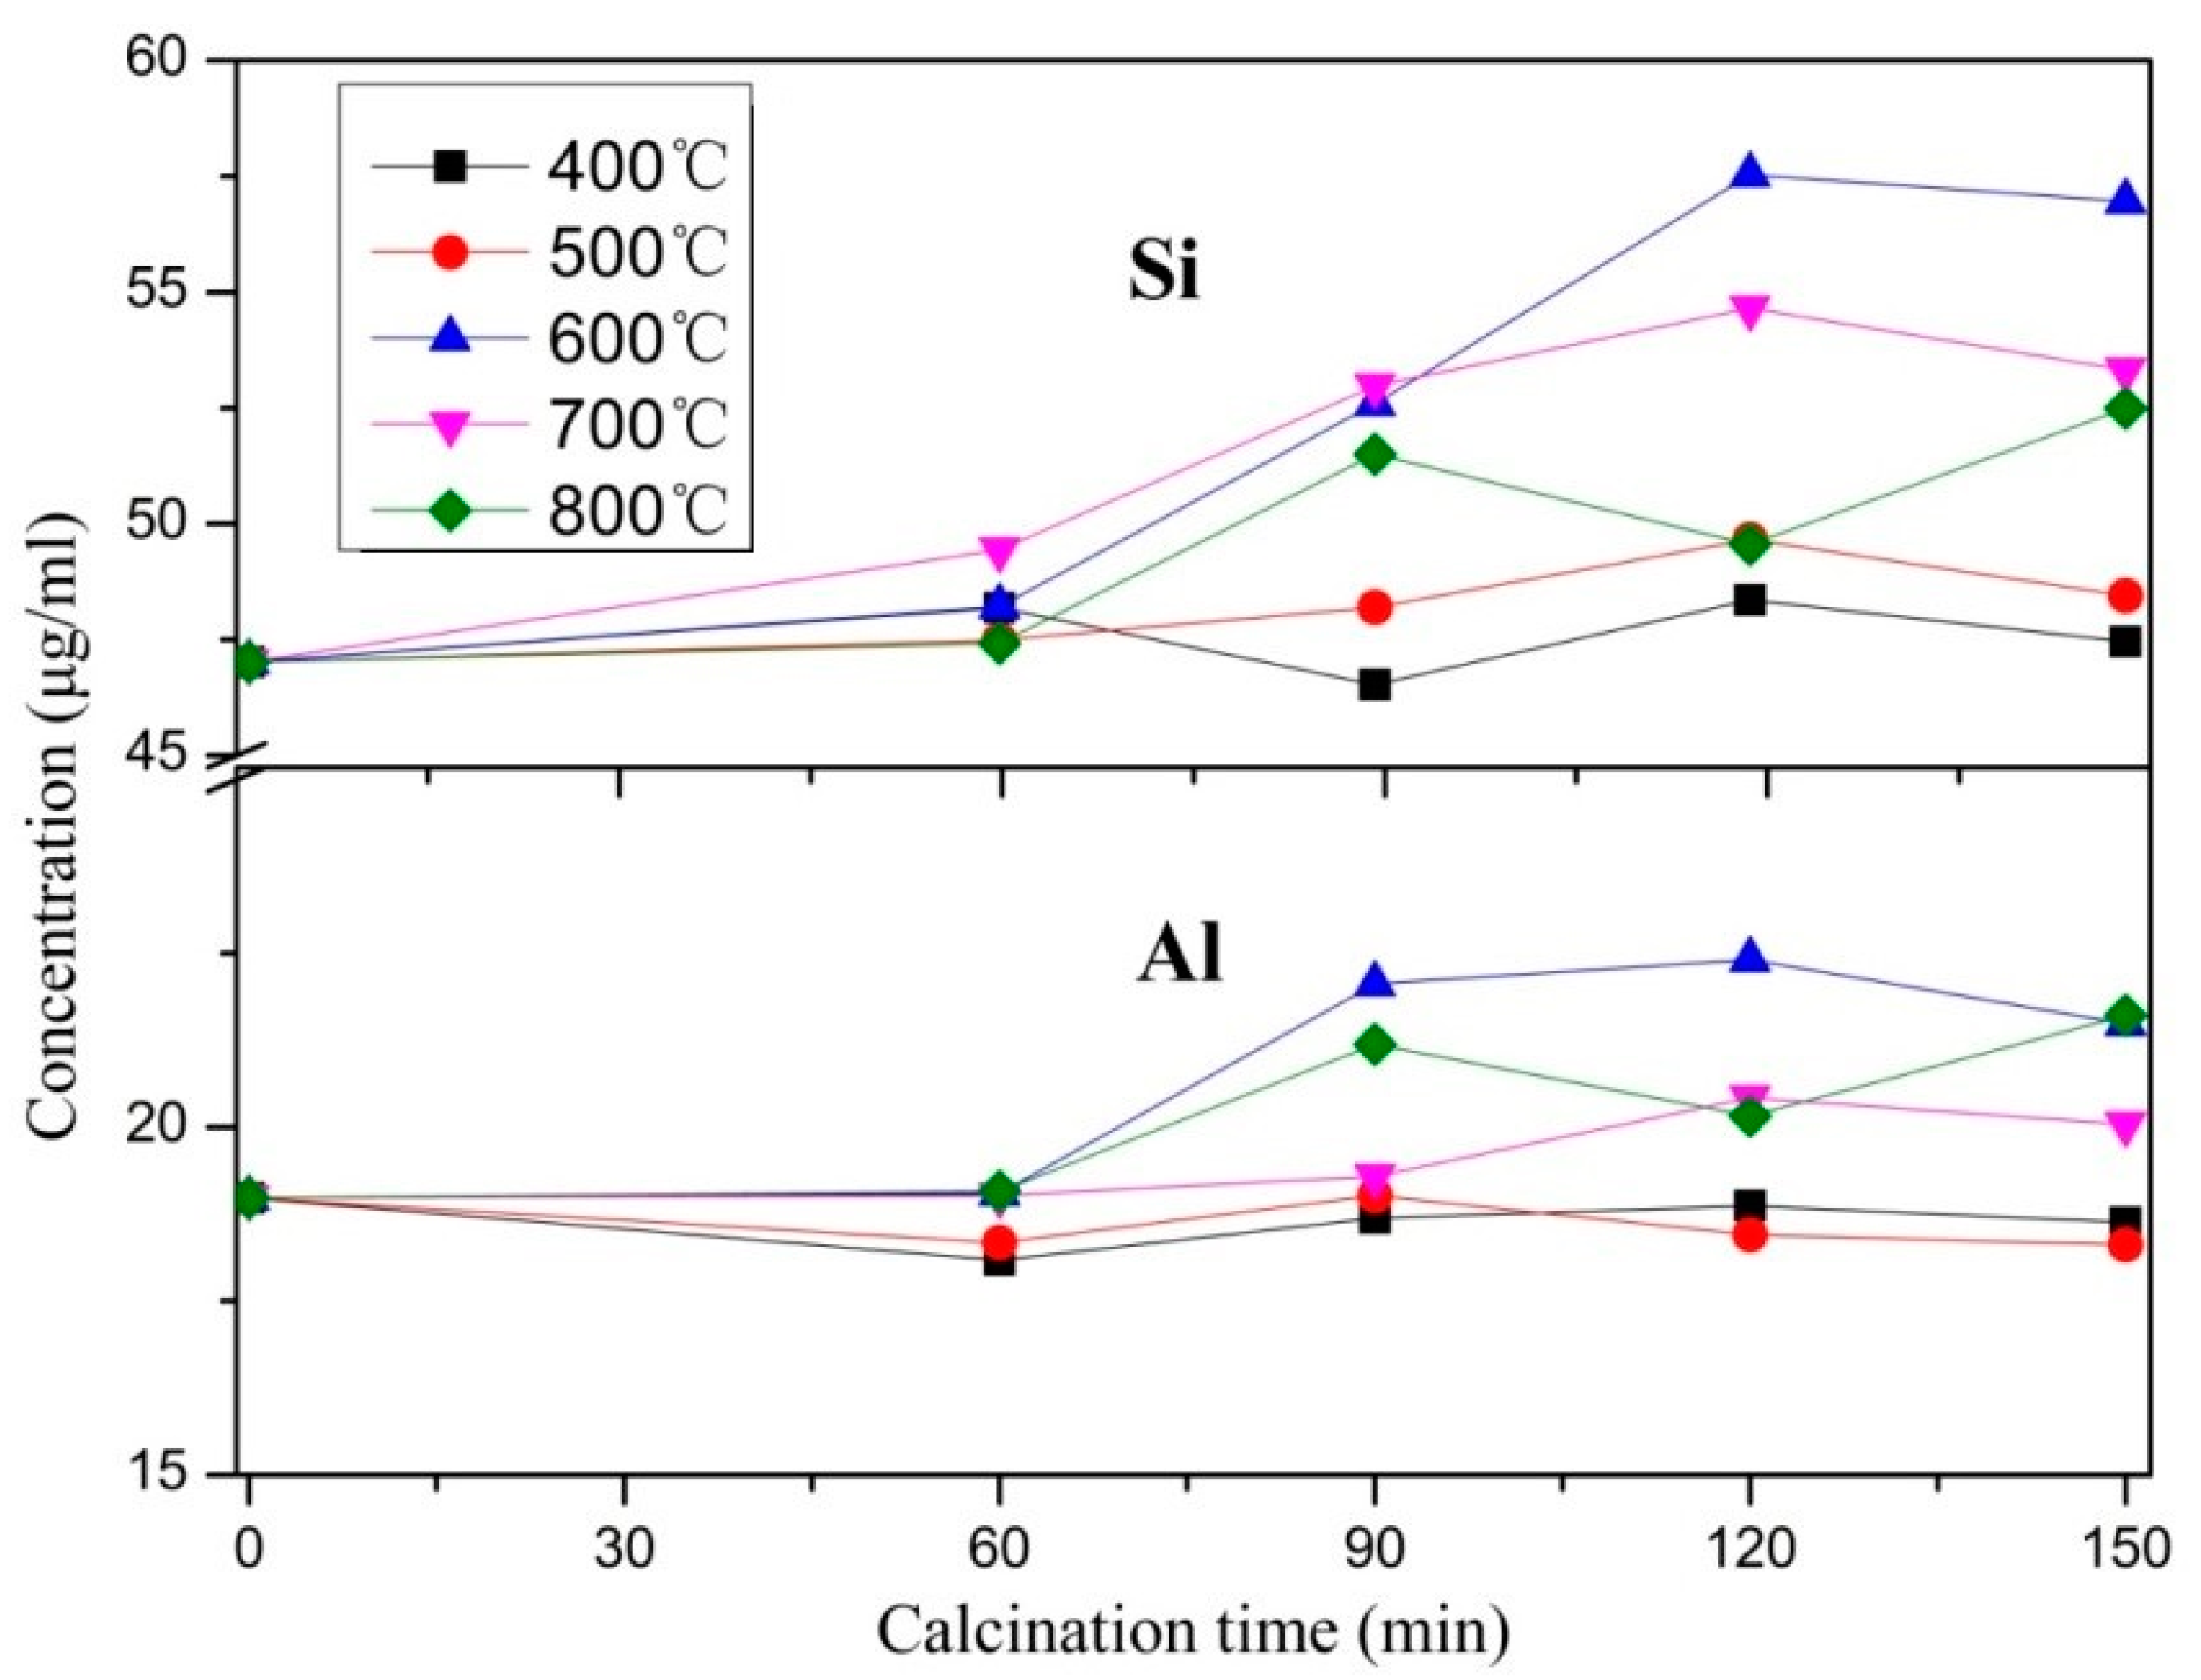
Figure 11.
Si and Al concentrations of thermally activated copper tailings after alkali leaching.
Figure 11.
Si and Al concentrations of thermally activated copper tailings after alkali leaching.
Figure 12.
SEM images of the sample TM11 (
Table 3) (10,000 (
a) and 20,000 (
b) magnification).
Figure 12.
SEM images of the sample TM11 (
Table 3) (10,000 (
a) and 20,000 (
b) magnification).
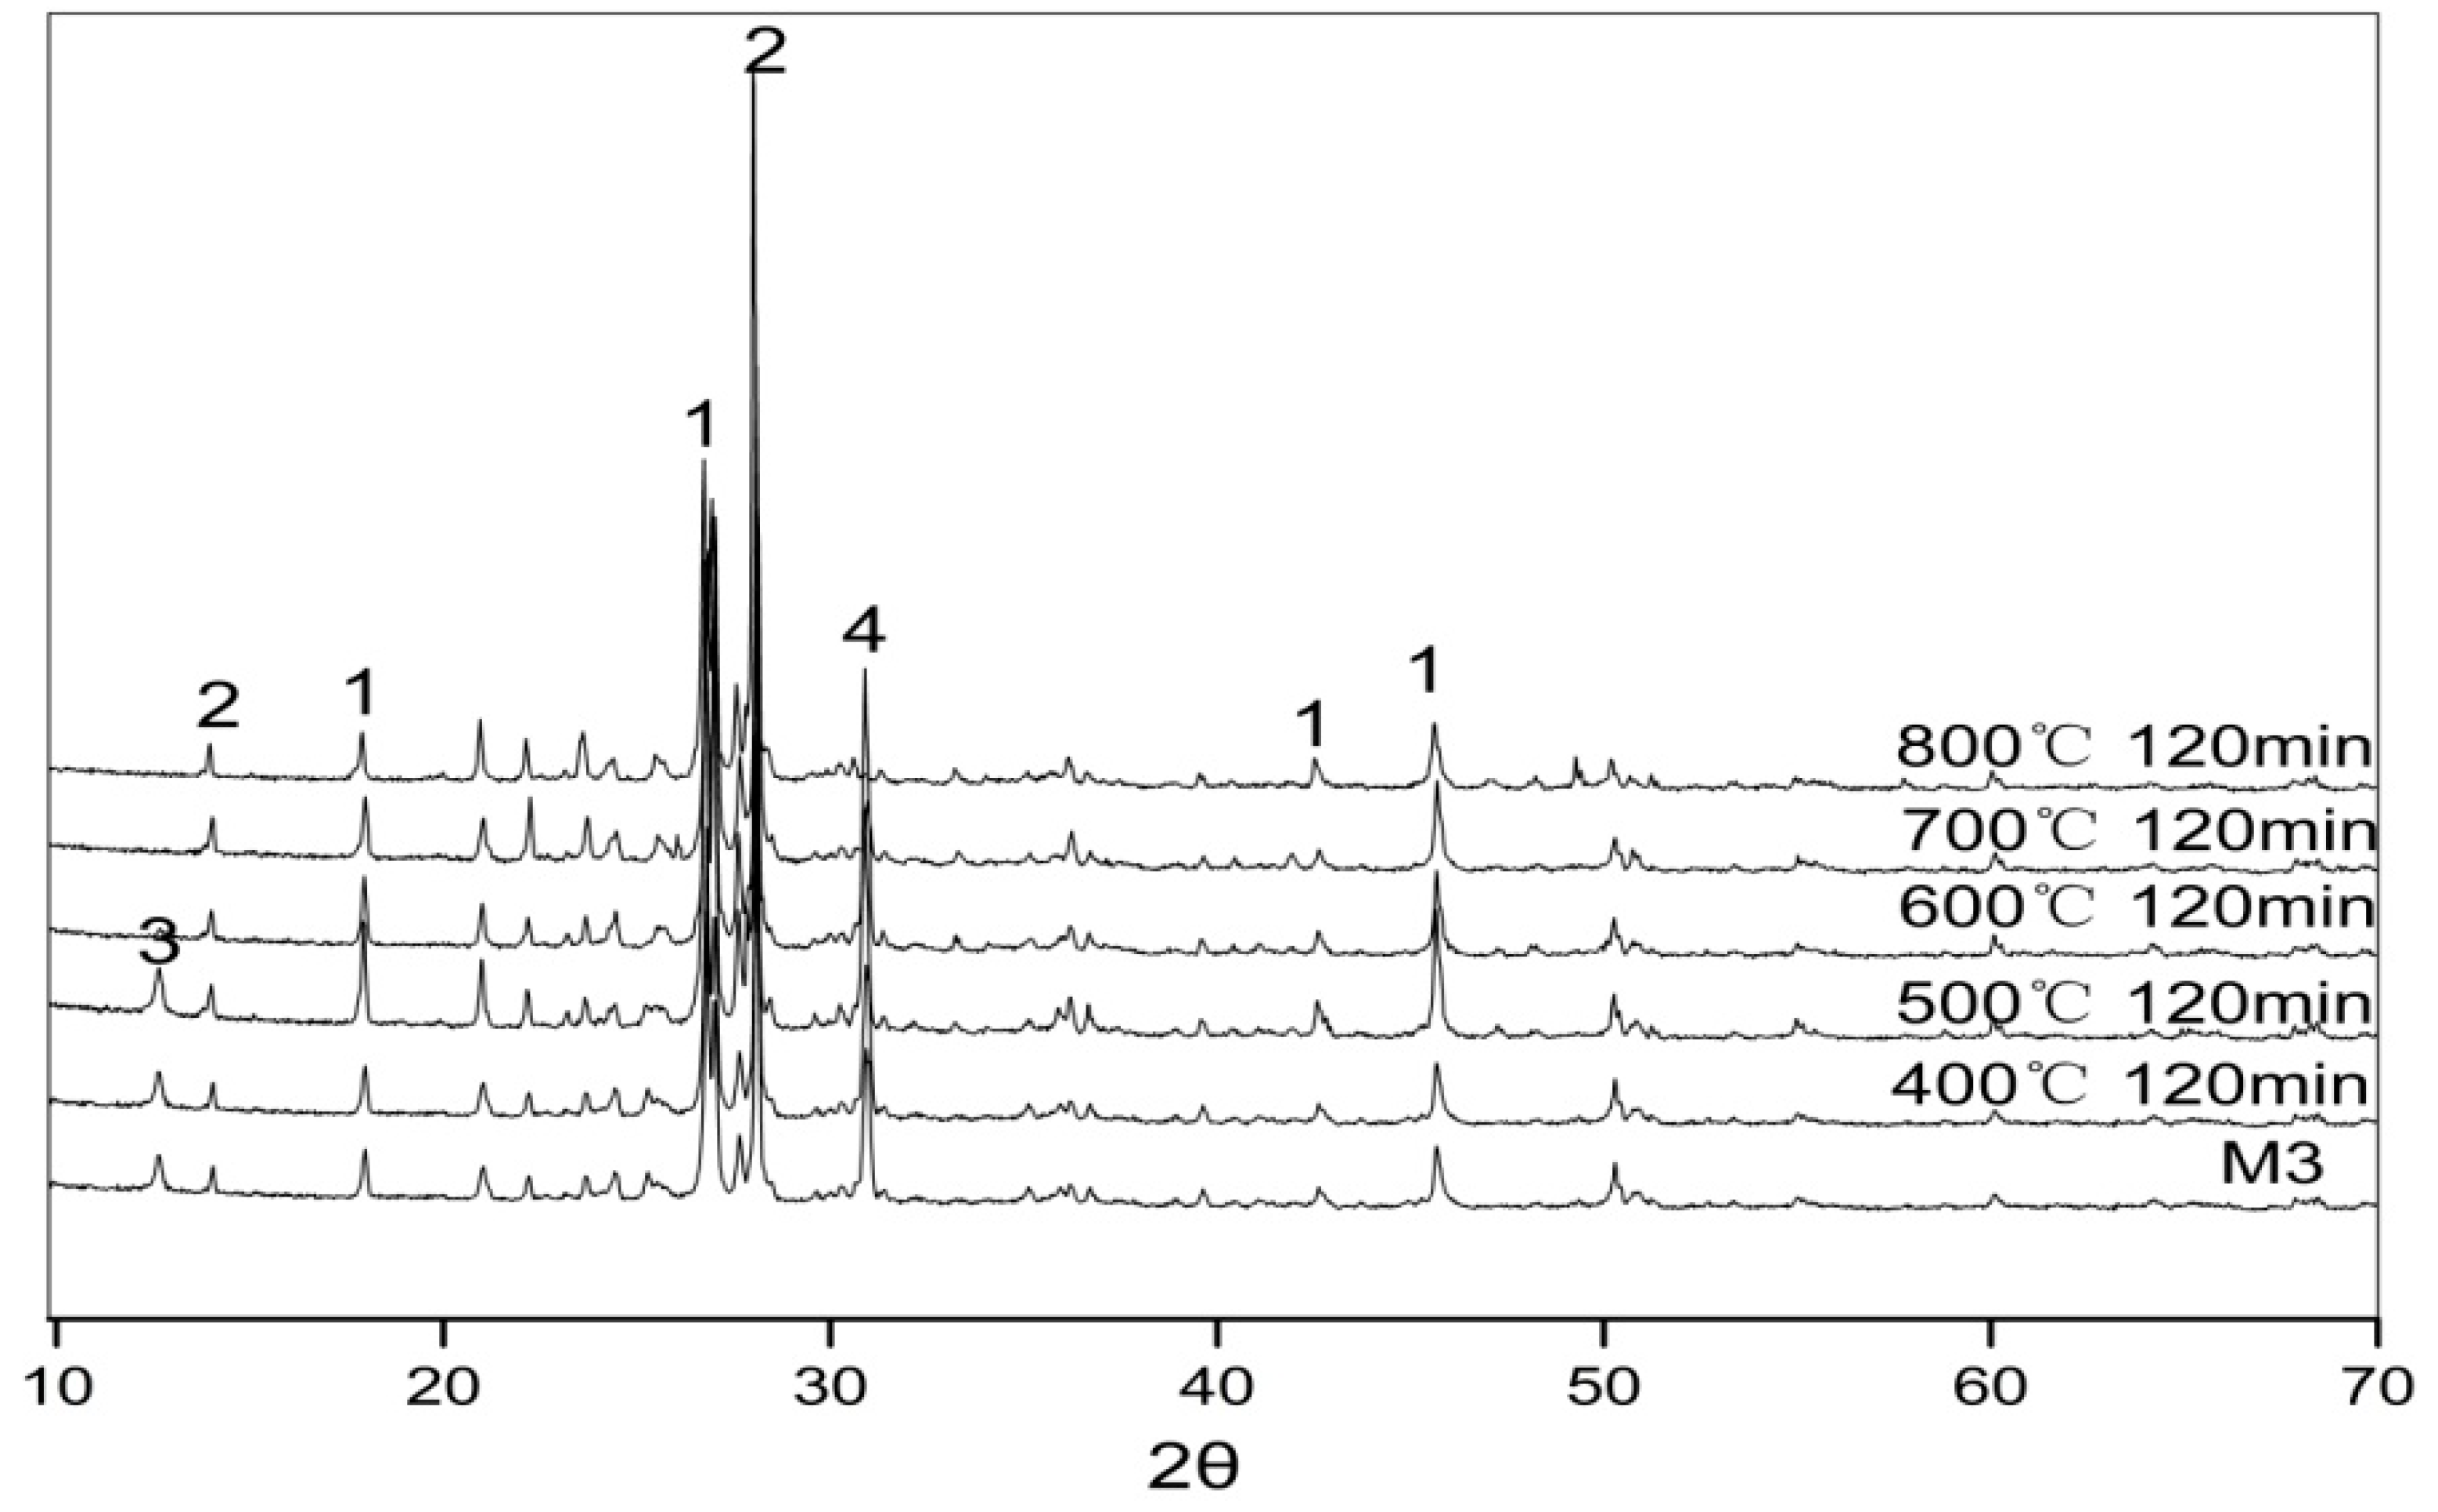
Figure 13.
XRD patterns of the thermally activated conditions of copper tailings (1 quartz, 2 albite, 3 chlorite, 4 dolomite).
Figure 13.
XRD patterns of the thermally activated conditions of copper tailings (1 quartz, 2 albite, 3 chlorite, 4 dolomite).
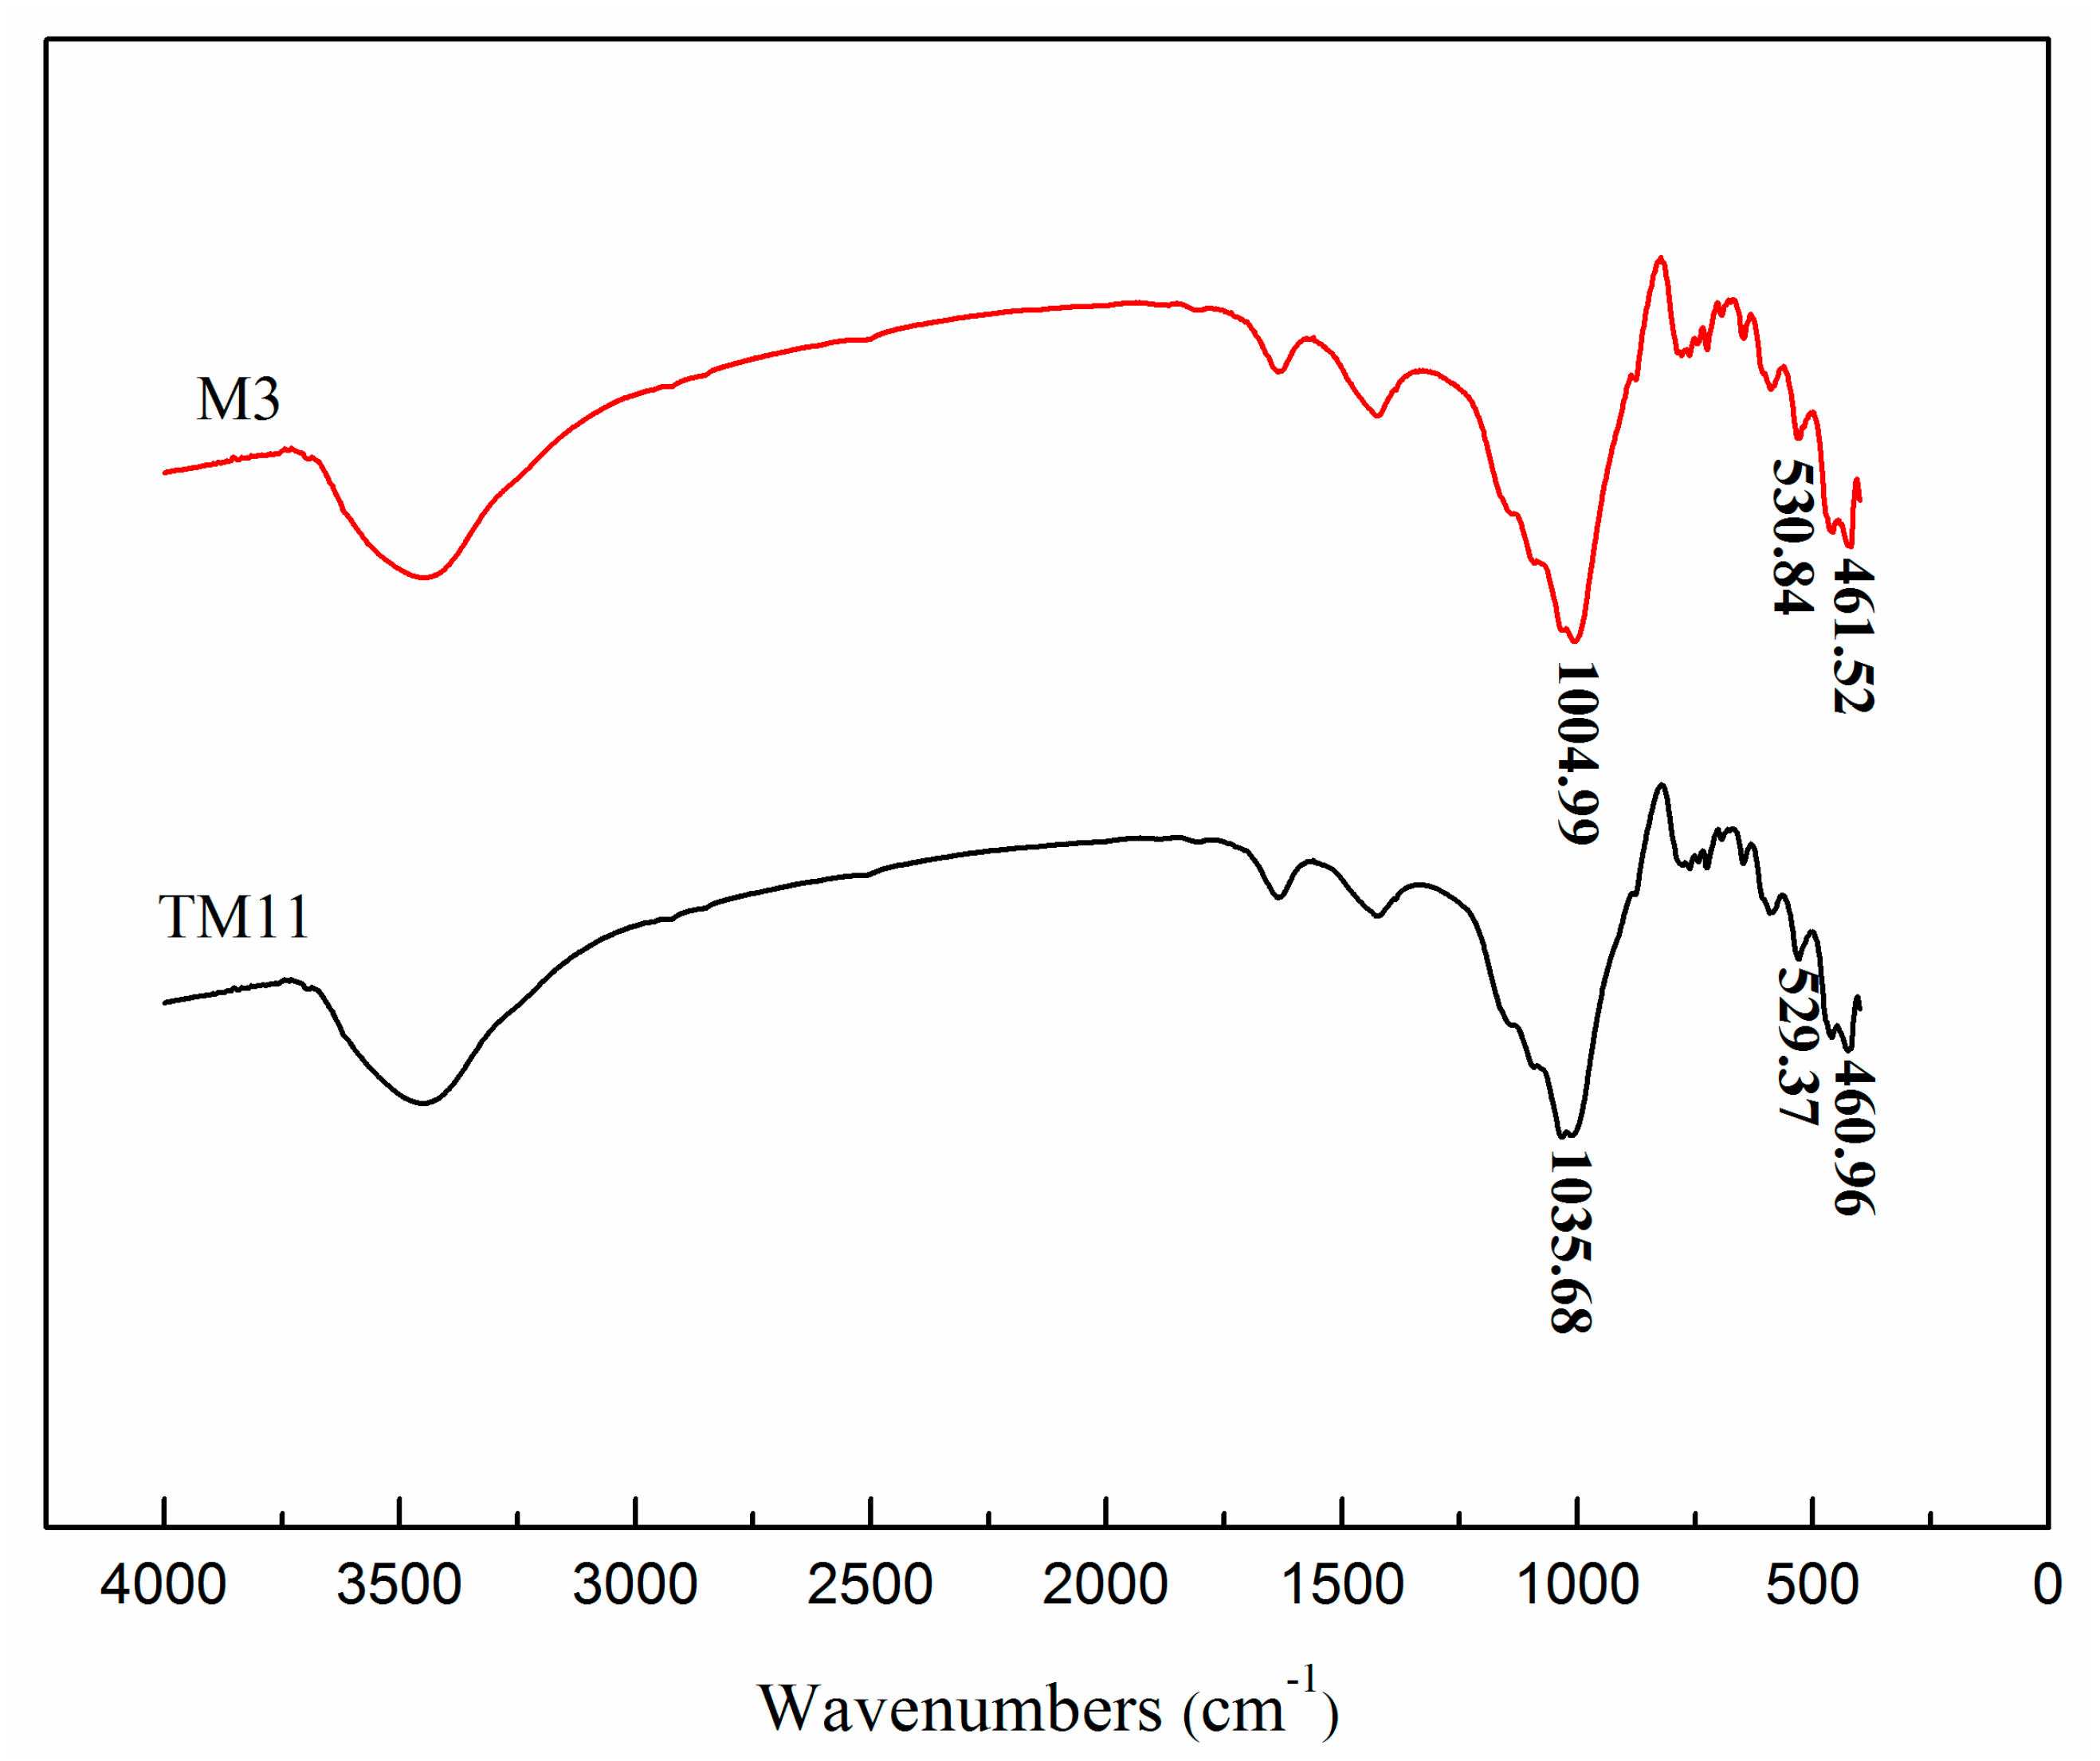
Figure 14.
FTIR spectra of the sample M3 (after 3 h of activation,
Table 2) and sample TM11 (thermal activation at 600 °C for 120 min,
Table 3).
Figure 14.
FTIR spectra of the sample M3 (after 3 h of activation,
Table 2) and sample TM11 (thermal activation at 600 °C for 120 min,
Table 3).
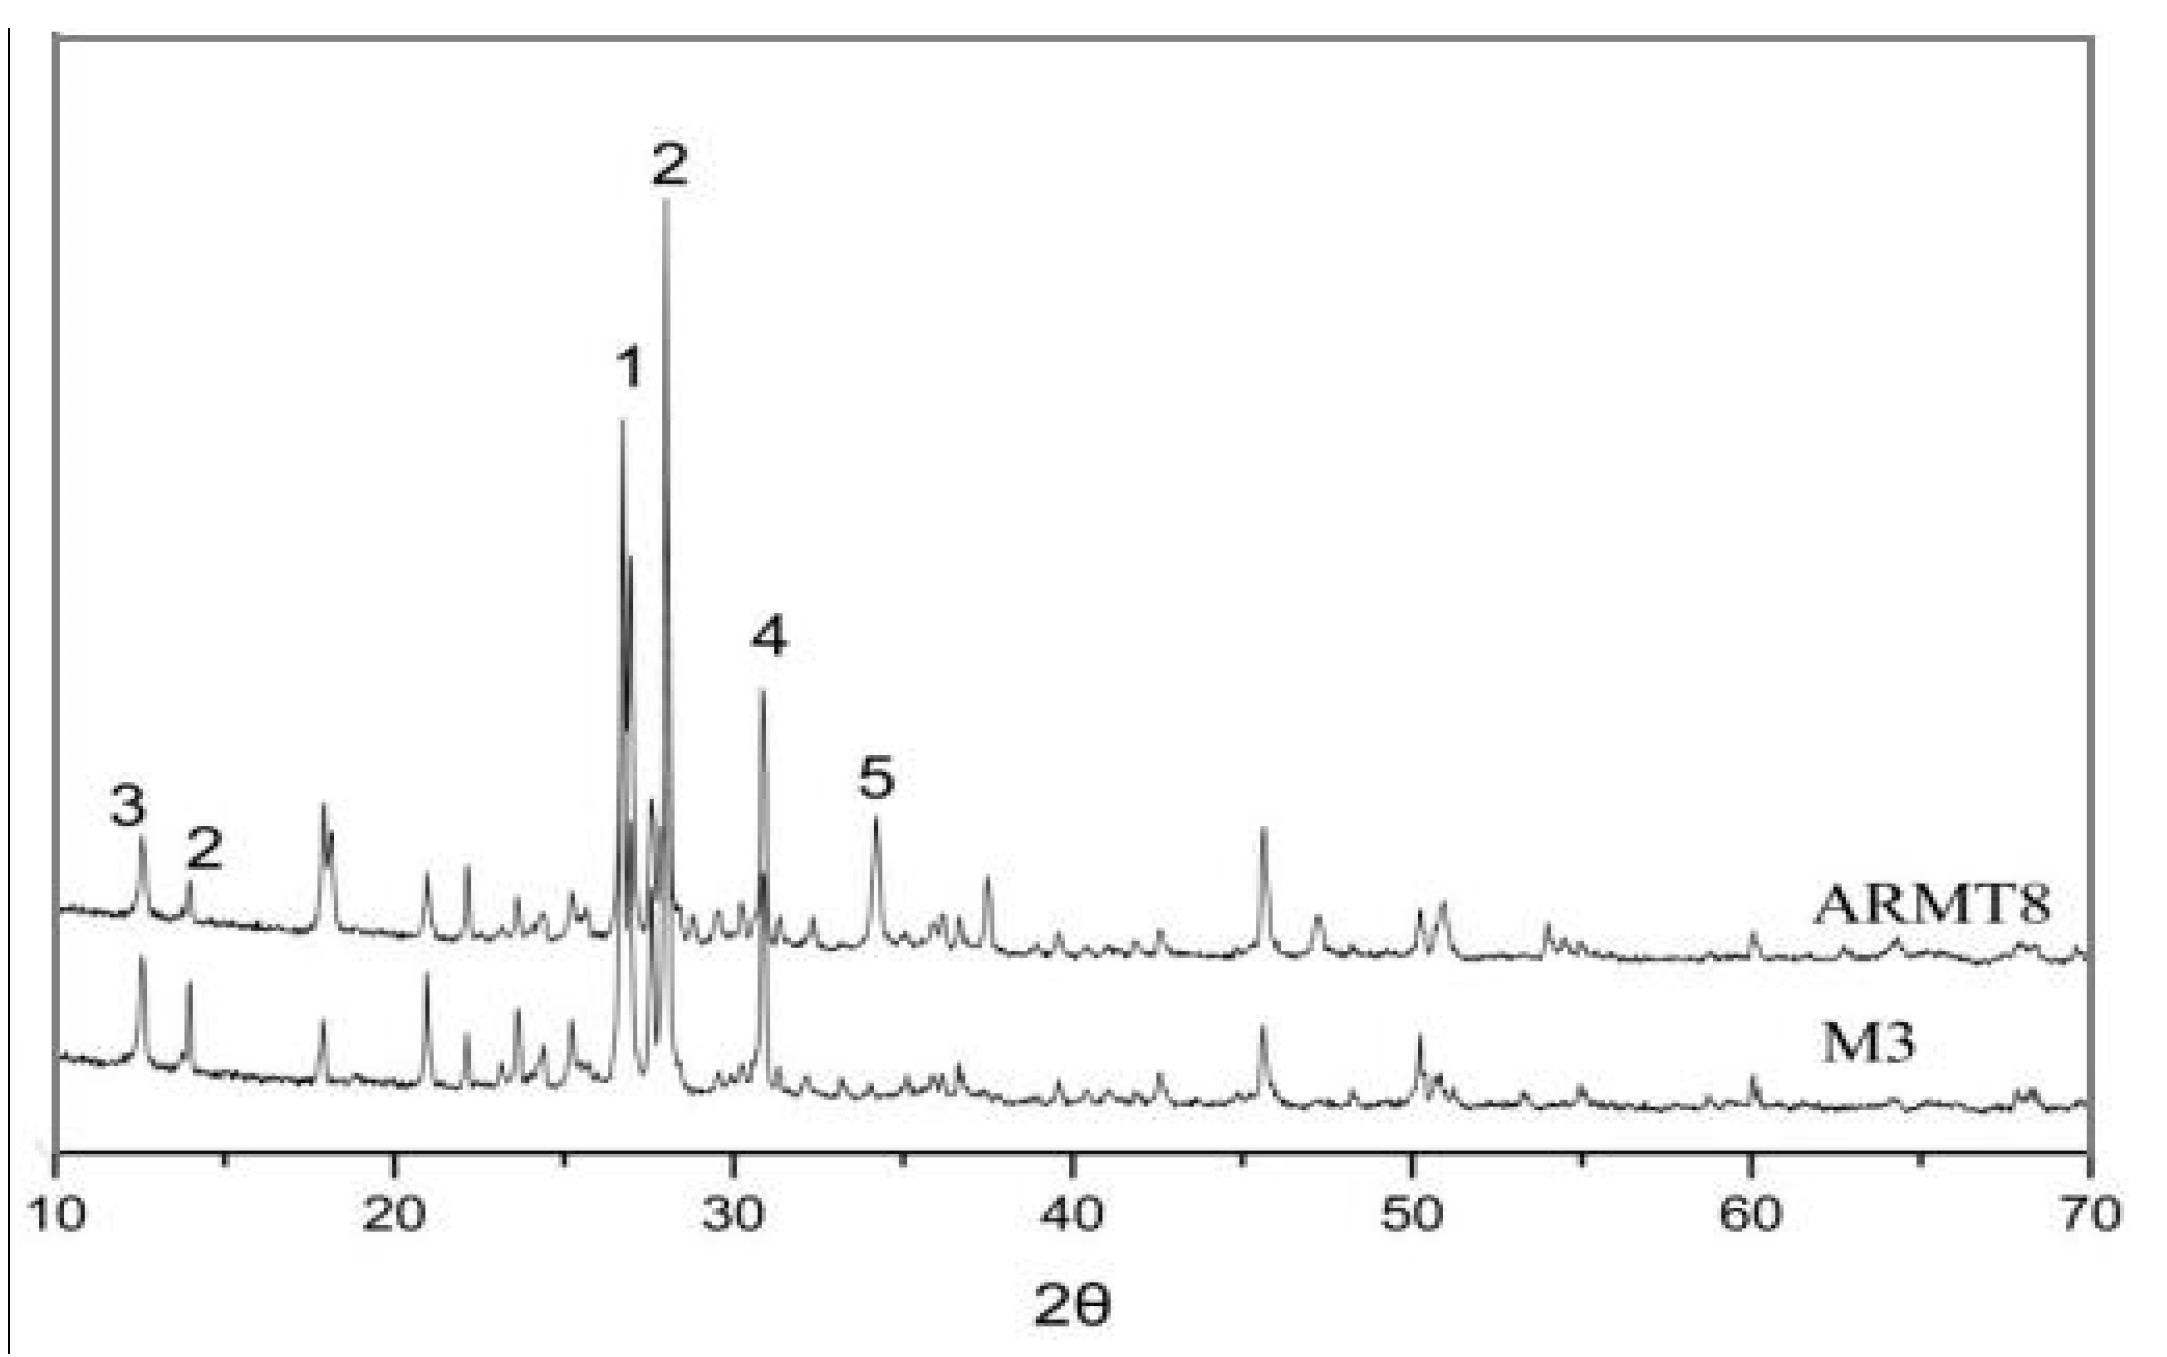
Figure 15.
XRD results of the sample M3 (
Table 2) and sample ARMT8 (
Table 3) (1 quartz, 2 albite, 3 chlorite, 4 dolomite, 5 biotite).
Figure 15.
XRD results of the sample M3 (
Table 2) and sample ARMT8 (
Table 3) (1 quartz, 2 albite, 3 chlorite, 4 dolomite, 5 biotite).
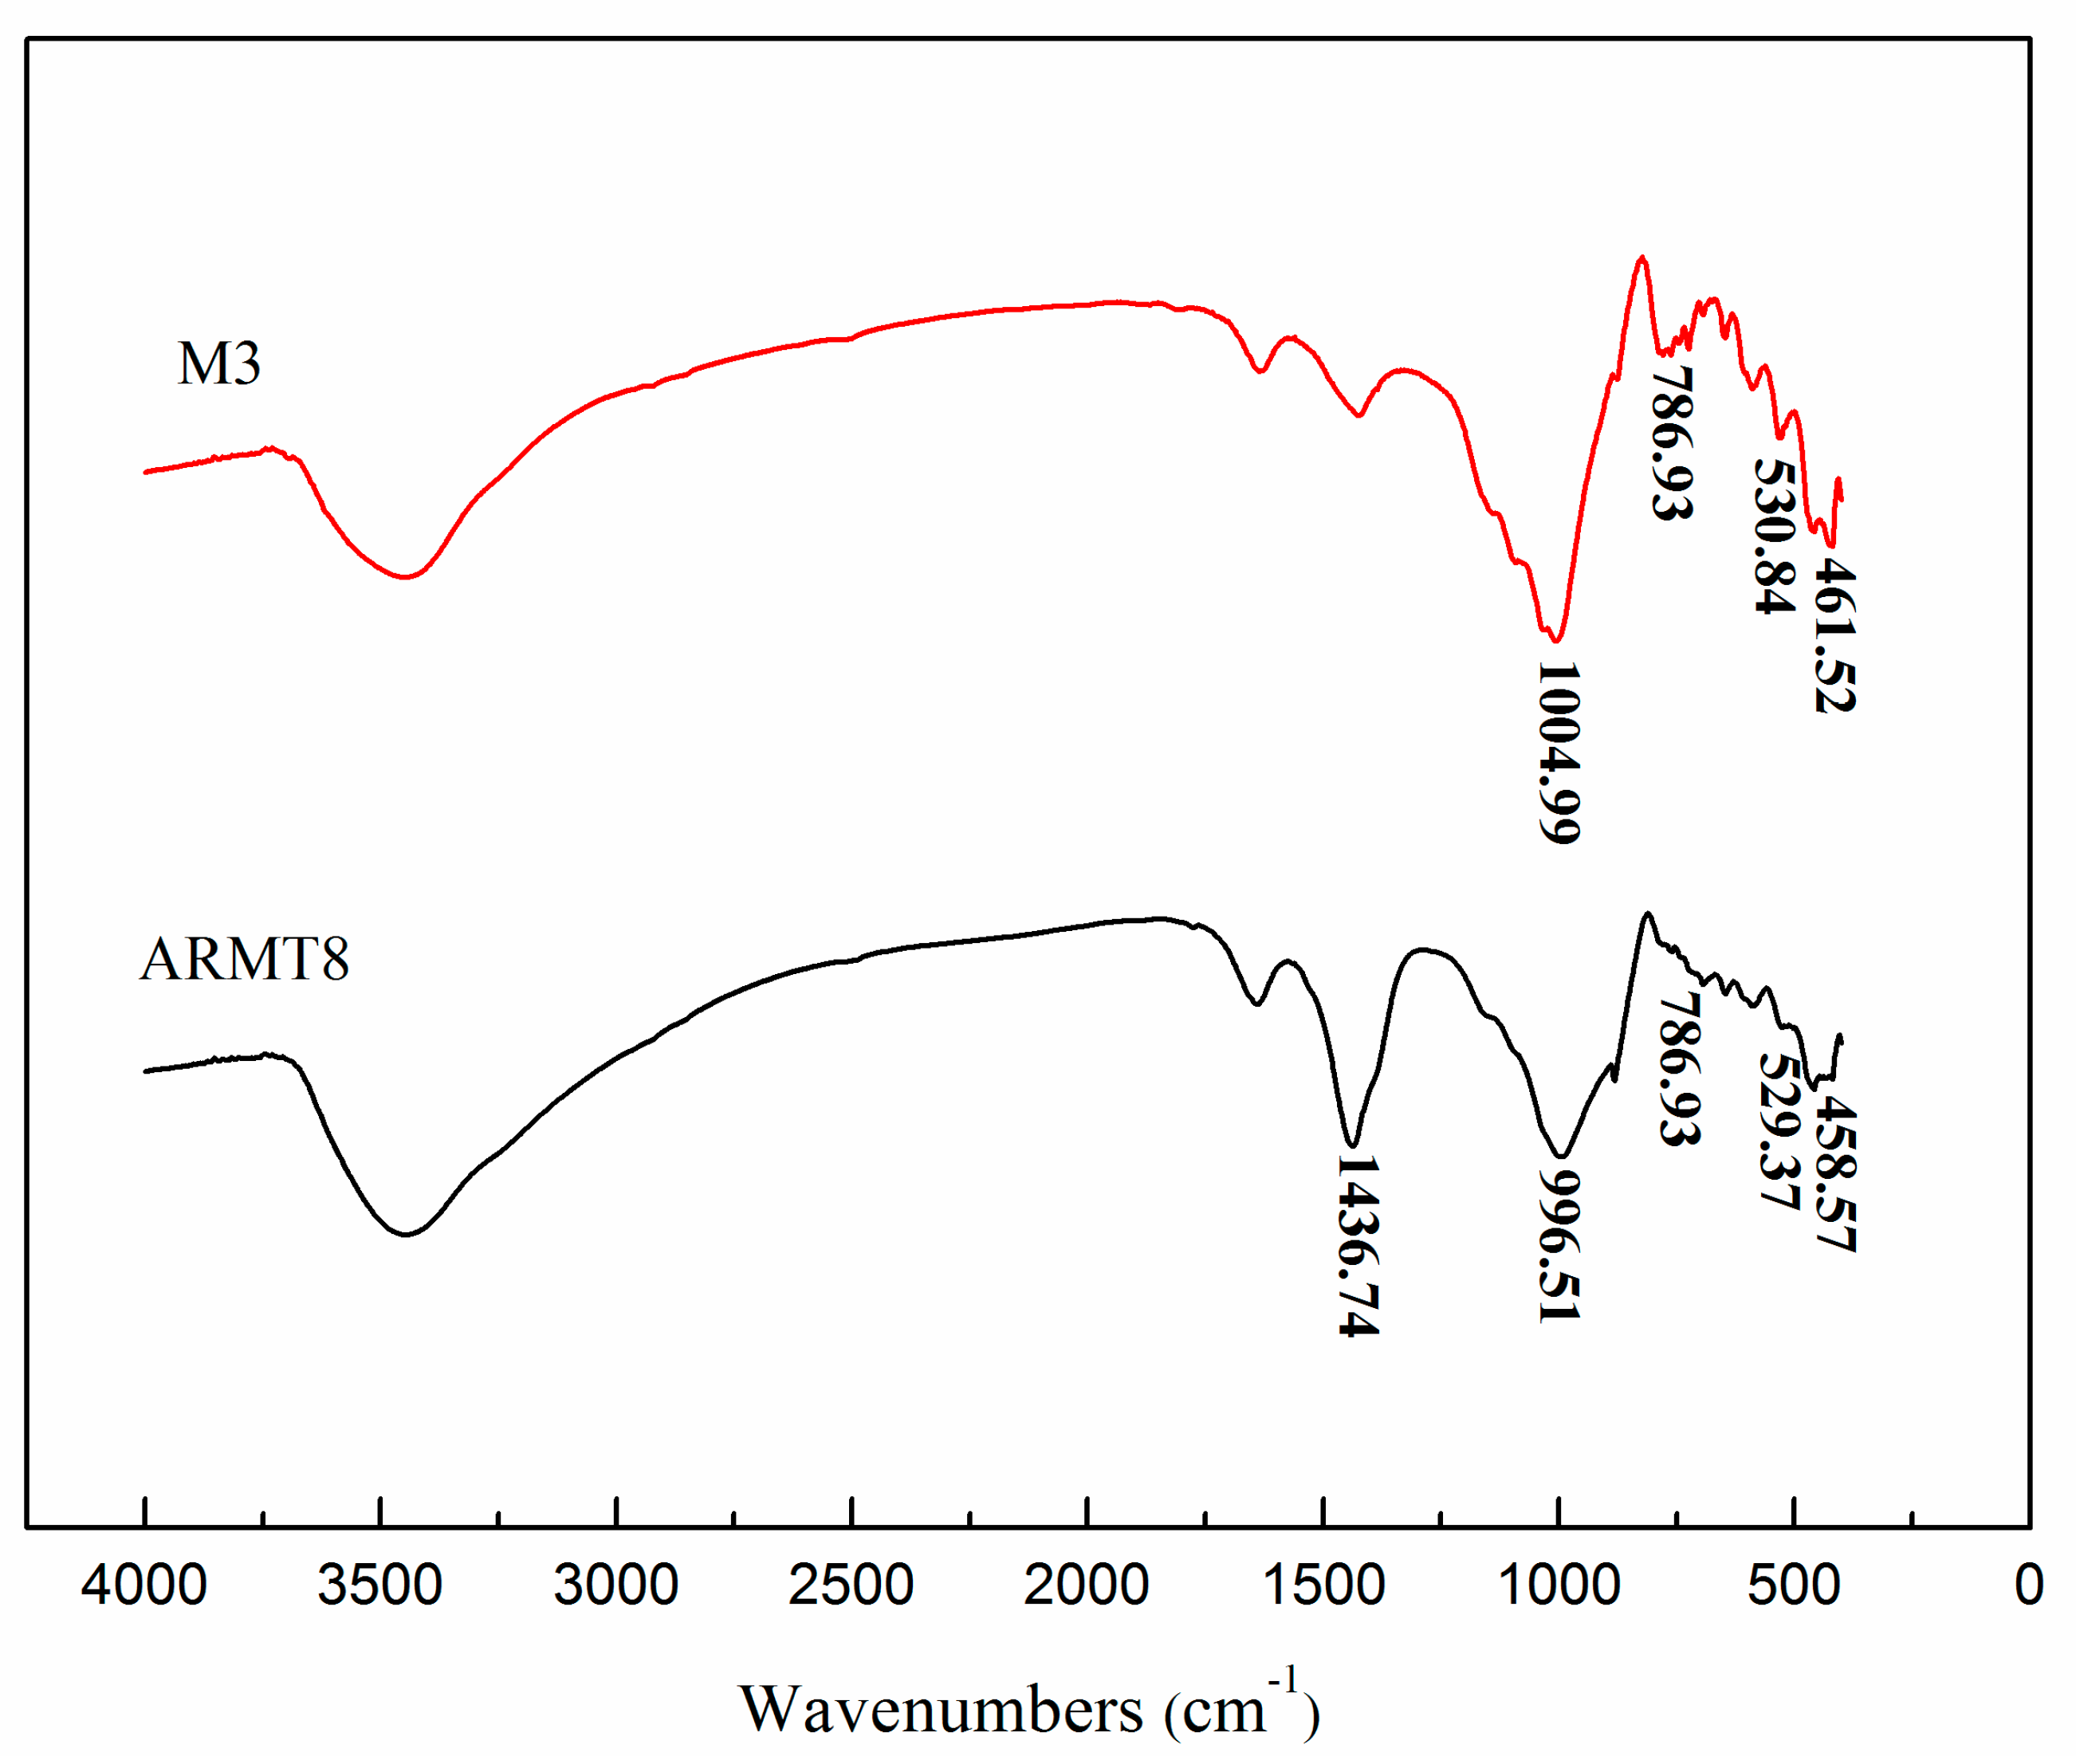
Figure 16.
FTIR spectra of the samples M3 (
Table 2) (after 3 h of activation) and ARMT8 (
Table 3).
Figure 16.
FTIR spectra of the samples M3 (
Table 2) (after 3 h of activation) and ARMT8 (
Table 3).
Table 1.
Chemical composition (wt %) of copper-mine tailings.
Table 1.
Chemical composition (wt %) of copper-mine tailings.
| SiO2 | Al2O3 | Fe2O3 | CaO | K2O | Na2O | MgO | SO3 |
|---|
| 58.5 | 13.3 | 10.7 | 5.4 | 4.0 | 2.8 | 1.9 | 0.6 |
Table 2.
The experimental layout of the mechanical grinding of copper-mine tailings.
Table 2.
The experimental layout of the mechanical grinding of copper-mine tailings.
| No. | Grinding Time (h) |
|---|
| M1 | 1.0 |
| M1.5 | 1.5 |
| M2 | 2.0 |
| M2.5 | 2.5 |
| M3 | 3.0 |
| M3.5 | 3.5 |
| M4 | 4.0 |
| M4.5 | 4.5 |
Table 3.
Thermal activation parameters of copper-mine tailings.
Table 3.
Thermal activation parameters of copper-mine tailings.
| Sample Name (TM) | Calcination Temperature (°C) | Calcination Time (min) |
|---|
| TM 1 | 400 | 60 |
| TM 2 | 400 | 90 |
| TM 3 | 400 | 120 |
| TM 4 | 400 | 150 |
| TM 5 | 500 | 60 |
| TM 6 | 500 | 90 |
| TM 7 | 500 | 120 |
| TM 8 | 500 | 150 |
| TM 9 | 600 | 60 |
| TM 10 | 600 | 90 |
| TM 11 | 600 | 120 |
| TM 12 | 600 | 150 |
| TM 13 | 700 | 60 |
| TM 14 | 700 | 90 |
| TM 15 | 700 | 120 |
| TM 16 | 700 | 150 |
| TM 17 | 800 | 60 |
| TM 18 | 800 | 90 |
| TM 19 | 800 | 120 |
| TM 20 | 800 | 150 |
Table 4.
Parameters with their levels used in alkaline-roasting activation of copper-mine tailings (ARMT) samples.
Table 4.
Parameters with their levels used in alkaline-roasting activation of copper-mine tailings (ARMT) samples.
| Levels | | Factors | |
|---|
| A | B | C |
|---|
| Roasting Time (min) | Roasting Temperature (°C) | C/N Ratio |
|---|
| 1 | 60 | 550 | 5:1 |
| 2 | 90 | 600 | 7.5:1 |
| 3 | 120 | 650 | 10:1 |
Table 5.
Orthogonal experimental layout of ARMT samples.
Table 5.
Orthogonal experimental layout of ARMT samples.
| No. | A | B | C | Result |
|---|
| ARMT1 | 1 (60 min) | 1 (550 °C) | 1 (5:1) | y1 |
| ARMT2 | 1 | 2 (600 °C) | 2 (7.5:1) | y2 |
| ARMT3 | 1 | 3 (650 °C) | 3 (10:1) | y3 |
| ARMT4 | 2 (90 min) | 1 | 2 | y4 |
| ARMT5 | 2 | 2 | 3 | y5 |
| ARMT6 | 2 | 3 | 1 | y6 |
| ARMT7 | 3 (120 min) | 1 | 3 | y7 |
| ARMT8 | 3 | 2 | 1 | y8 |
| ARMT9 | 3 | 3 | 2 | y9 |
Table 6.
Mixture ratios of ARMT samples and NaOH solution used in alkaline-leaching experiments.
Table 6.
Mixture ratios of ARMT samples and NaOH solution used in alkaline-leaching experiments.
| Sample | Sample Quantity (g) | Quantity of NaOH in the Solution (g) |
|---|
| ARMT1, ARMT6, ARMT8 | 1.200 | 3.800 |
| ARMT2, ARMT4, ARMT9 | 1.133 | 3.867 |
| ARMT3, ARMT5, ARMT7 | 1.100 | 3.900 |
Table 7.
The orthogonal experimental results and range analysis of Si and Al leaching concentrations.
Table 7.
The orthogonal experimental results and range analysis of Si and Al leaching concentrations.
| No. | A (Time) | B (Temp) | C (C/N Mass Ratio) | Si (μg/mL) | Al (μg/mL) |
|---|
| ARMT1 | 1(60 min) | 1(550 °C) | 1(5:1) | 183.25 | 62.91 |
| ARMT2 | 1 | 2(600 °C) | 2(7.5:1) | 147.83 | 48.46 |
| ARMT3 | 1 | 3(650 °C) | 3(10:1) | 159.45 | 49.55 |
| ARMT4 | 2(90 min) | 1 | 2 | 149.23 | 49.13 |
| ARMT5 | 2 | 2 | 3 | 150.09 | 68.19 |
| ARMT6 | 2 | 3 | 1 | 198.10 | 79.53 |
| ARMT7 | 3(120 min) | 1 | 3 | 151.95 | 66.35 |
| ARMT8 | 3 | 2 | 1 | 192.35 | 88.83 |
| ARMT9 | 3 | 3 | 2 | 175.92 | 57.35 |
| Si | Al | |
| A | B | C | A | B | C |
| kj1 | 163.51 | 161.48 | 191.23 | 53.64 | 59.46 | 70.84 |
| kj2 | 165.81 | 163.12 | 157.66 | 65.62 | 68.49 | 62.14 |
| kj3 | 173.40 | 177.82 | 153.83 | 70.84 | 51.65 | 61.36 |
| R | 9.89 | 16.34 | 37.40 | 17.2 | 16.84 | 9.48 |
| Order | C > B > A | B > A > C |
| Optimal level | A3, B3, C1 | A3, B2, C1 |


