Article

Self-Consolidated Concrete-to-Conductive Concrete Interface: Assessment of Bond Strength and Mechanical Properties

1
Department of Civil Engineering, American University of Sharjah, Sharjah 26666, United Arab Emirates
2
Department of Computer Engineering, American University of Sharjah, Sharjah 26666, United Arab Emirates
3
Department of Electrical Engineering, American University of Sharjah, Sharjah 26666, United Arab Emirates
4
School of Civil, Environmental and Mining Engineering, University of Western Australia, Crawley, WA 6009, Australia
*
Author to whom correspondence should be addressed.
Fibers 2023, 11(12), 106; https://doi.org/10.3390/fib11120106
Submission received: 14 October 2023 / Revised: 12 November 2023 / Accepted: 17 November 2023 / Published: 4 December 2023

Abstract

:
In this paper, the mechanical properties and bond strength of composite samples that consist of a conductive concrete (CC) layer and a self-consolidated concrete (SCC) layer are investigated. The bond strength study includes two parameters: (1) surface preparation and (2) casting and testing directions. The surface preparation study shows that, compared to the other methods in this study, the shear key method is the most suitable surface preparation method to fully utilize the CC in a composite. Moreover, the casting direction study reveals that the strength is heavily dependent on the type of test used along with CC’s layer positioning. The flexural strength study confirms that positioning the CC mix in the tensile region is beneficial since it can increase the flexural strength of a structure because of the hybrid steel fibers included in the mixture. Finally, different codes/specifications and published theoretical results are used to predict the CC’s mechanical properties, and the predictions are not as accurate as the SCC predictions, which can be attributed to the presence of conductive fillers in the CC mix.

1. Introduction and Background

Conductive concrete (CC) is an evolution of plain concrete due to its capability of conducting electricity effectively compared to normal concrete or self-consolidated concrete (SCC). The electrical properties of a typical CC mix come from its conductive fillers. Currently, the fillers used in the literature are either of a particle shape/size, such as powdered carbon and graphite, as well as steel slag aggregates, or a fibrous shape, such as steel fibers (SFs), carbon fibers, and nanocarbon tubes. The common conductive fillers in addition to steel fibers are carbon and graphite [1,2,3]. It is important to note that conduction in concrete can be classified as two processes: electrolytic conduction and electronic conduction [4,5,6]. At an early stage, the initial conduction process, electrolytic conduction, mainly occurs through the solutions present in the concrete mix, and, as the mix hydrates, the conductivity decreases until, ultimately, the concrete presents a high electrical resistance [2]. The addition of conductive fillers allows the mix to conduct electricity through electrical pathways composed of conductive fillers, and this process is known as electronic conduction [5]. In addition, these conductive fillers allow the CC to be used for different applications, such as electromagnetic shielding, deicing, and traffic detection [1,2,3,4,7,8,9,10,11,12]. To benefit from CC in different applications, the CC needs to be added to an existing or new structure. However, to apply the CC to an existing structure without affecting the mechanical properties of the matrix, the bond behavior between the newly added CC and the existing plain concrete (concrete-to-concrete bond) needs to be understood. This enables the integrity and continuity of the matrix to be ensured in each structure. The factors that affect the bond behavior between two different types of concrete are the interface surface preparation and cleanness; the differences in the material shrinkage, stiffness, and age; the fibers; and the other materials present in the mix [13,14,15,16]. Finally, common bond strength tests, such as the slant shear, direct shear, split-tension, pull-off, and flexural strength tests, can be used to evaluate the concrete-to-concrete bond strength [15,16].

1.1. Surface Preparation and Cleanness

Interface surface preparation is the process of roughening the surface using different methods. The different common methods currently used in the literature are roughening using a steel wire brush [13,15,17,18,19], sandblasting [14,15,19,20,21,22,23], water jetting [22,24,25,26], and hand chiseling [15,17,18,19,27]. Other methods for surface preparation are grooving/grinding [17,19,28,29,30,31], drilling [31,32,33,34], grit blasting [30], and aggregate exposure using retarders [19,35]. Each method produces different results based on the average roughness. Moreover, all treated surfaces need to be properly cleaned before the application of the existing concrete.

1.2. Differential Shrinkage, Stiffness, and Age

Additionally, increasing the differential shrinkage and stiffness can affect the bond strength negatively by introducing undesired stresses at the bond interface [15,36]. A similar effect occurs with an increase in the differential age. The authors in [31] investigated the aging effects of ultra-high-performance concrete and normal concrete at 28, 90, and 180 days. The reported decrease in the bond strength was 1.5% and 2.7% at 90 and 180 days, respectively.

1.3. Fibers and Other Materials Present in the Mix

The presence of fibers in the mix can enhance its mechanical properties, including the bond strength of a composite sample. The authors in [14,21,23] concluded that the presence of polyvinyl alcohol (PVA) fibers can increase the bond strength. Additionally, the authors in [20] used normal- and high-strength mortars with 0% and 0.5% steel fibers, respectively, as an added layer to a normal concrete substrate layer. The normal-strength mortar that was bonded to the normal concrete did not show any signs of improvement when increasing the steel fiber percentage. However, the strength of the high-strength mortar’s bond to the normal concrete increased with the increase in the fibrous content. A similar effect was observed in [37], where an increase in steel fibers from 1% to 1.5% and up to 2% in the mix led to an increase in the bond strength between powder reactive concrete and normal concrete. Similarly, the authors in [38] investigated the effects of the hybrid fibers SF and PVA on the bond strength. An increase in either SF or PVA resulted in an increase in the bond strength.
Adding other materials, such as silica fumes, can increase the bond strength. In [13], silica fume was added to cement and sand mortar up to 10% per weight of cement, which caused an increase in both the compressive and bond strengths. Moreover, the authors in [39] investigated the addition of expansive admixtures to decrease the shrinkage of a material, which resulted in a decrease in crack formation at the interface and an increase in the bond strength of around 30%.

1.4. Common Bond Strength Tests

To evaluate the concrete-to-concrete bond strength, different tests can be performed. The common tests used in the literature are slant shear, direct shear, split-tension, pull-off, and flexural strength tests [16,40]. The slant shear test subjects the bond interface to principal shear and principal compressive stresses [13,21], while the direct shear test subjects the bond interface to shear stresses [17]. The split-tension and pull-off tests both subject the bond interface to tensile stresses, while the flexural strength test applies either tensile or compressive stresses at the bond interface depending on the layer stiffnesses and the bond interface location with respect to the neutral axis. A detailed discussion of the factors affecting the concrete-to-concrete bond strength is provided by the authors in [3,10,14,15,16]. In this paper, the main objectives are to investigate the bond strength between CC and SCC and to investigate the mechanical properties of each mix. The main parameters considered in the investigation are the applications of different surface preparations and casting directions. The surface preparation study includes wet-to-wet and wet-to-dry bonds. The wet-to-dry bond includes rough, shear key, and smooth surface preparations. This study also investigates the effects of the casting and testing directions for specimens prepared using both scenarios, wet-to-wet and wet-to-dry conditions. Finally, the results of the mechanical properties of the SCC and the CC from the current study were compared with those predicted using published equations and available design code equations.

2. Research Significance

The bond strength between two concrete layers has been extensively evaluated by many researchers. However, to the best of the authors’ knowledge, limited research has been conducted on the factors that affect the bond strength between conductive concrete and a self-consolidated concrete composite. The current investigation contributes to the literature by evaluating the mechanical properties and bond strength between CC and SCC. This knowledge will contribute to the effective utilization of CC in several structural applications.

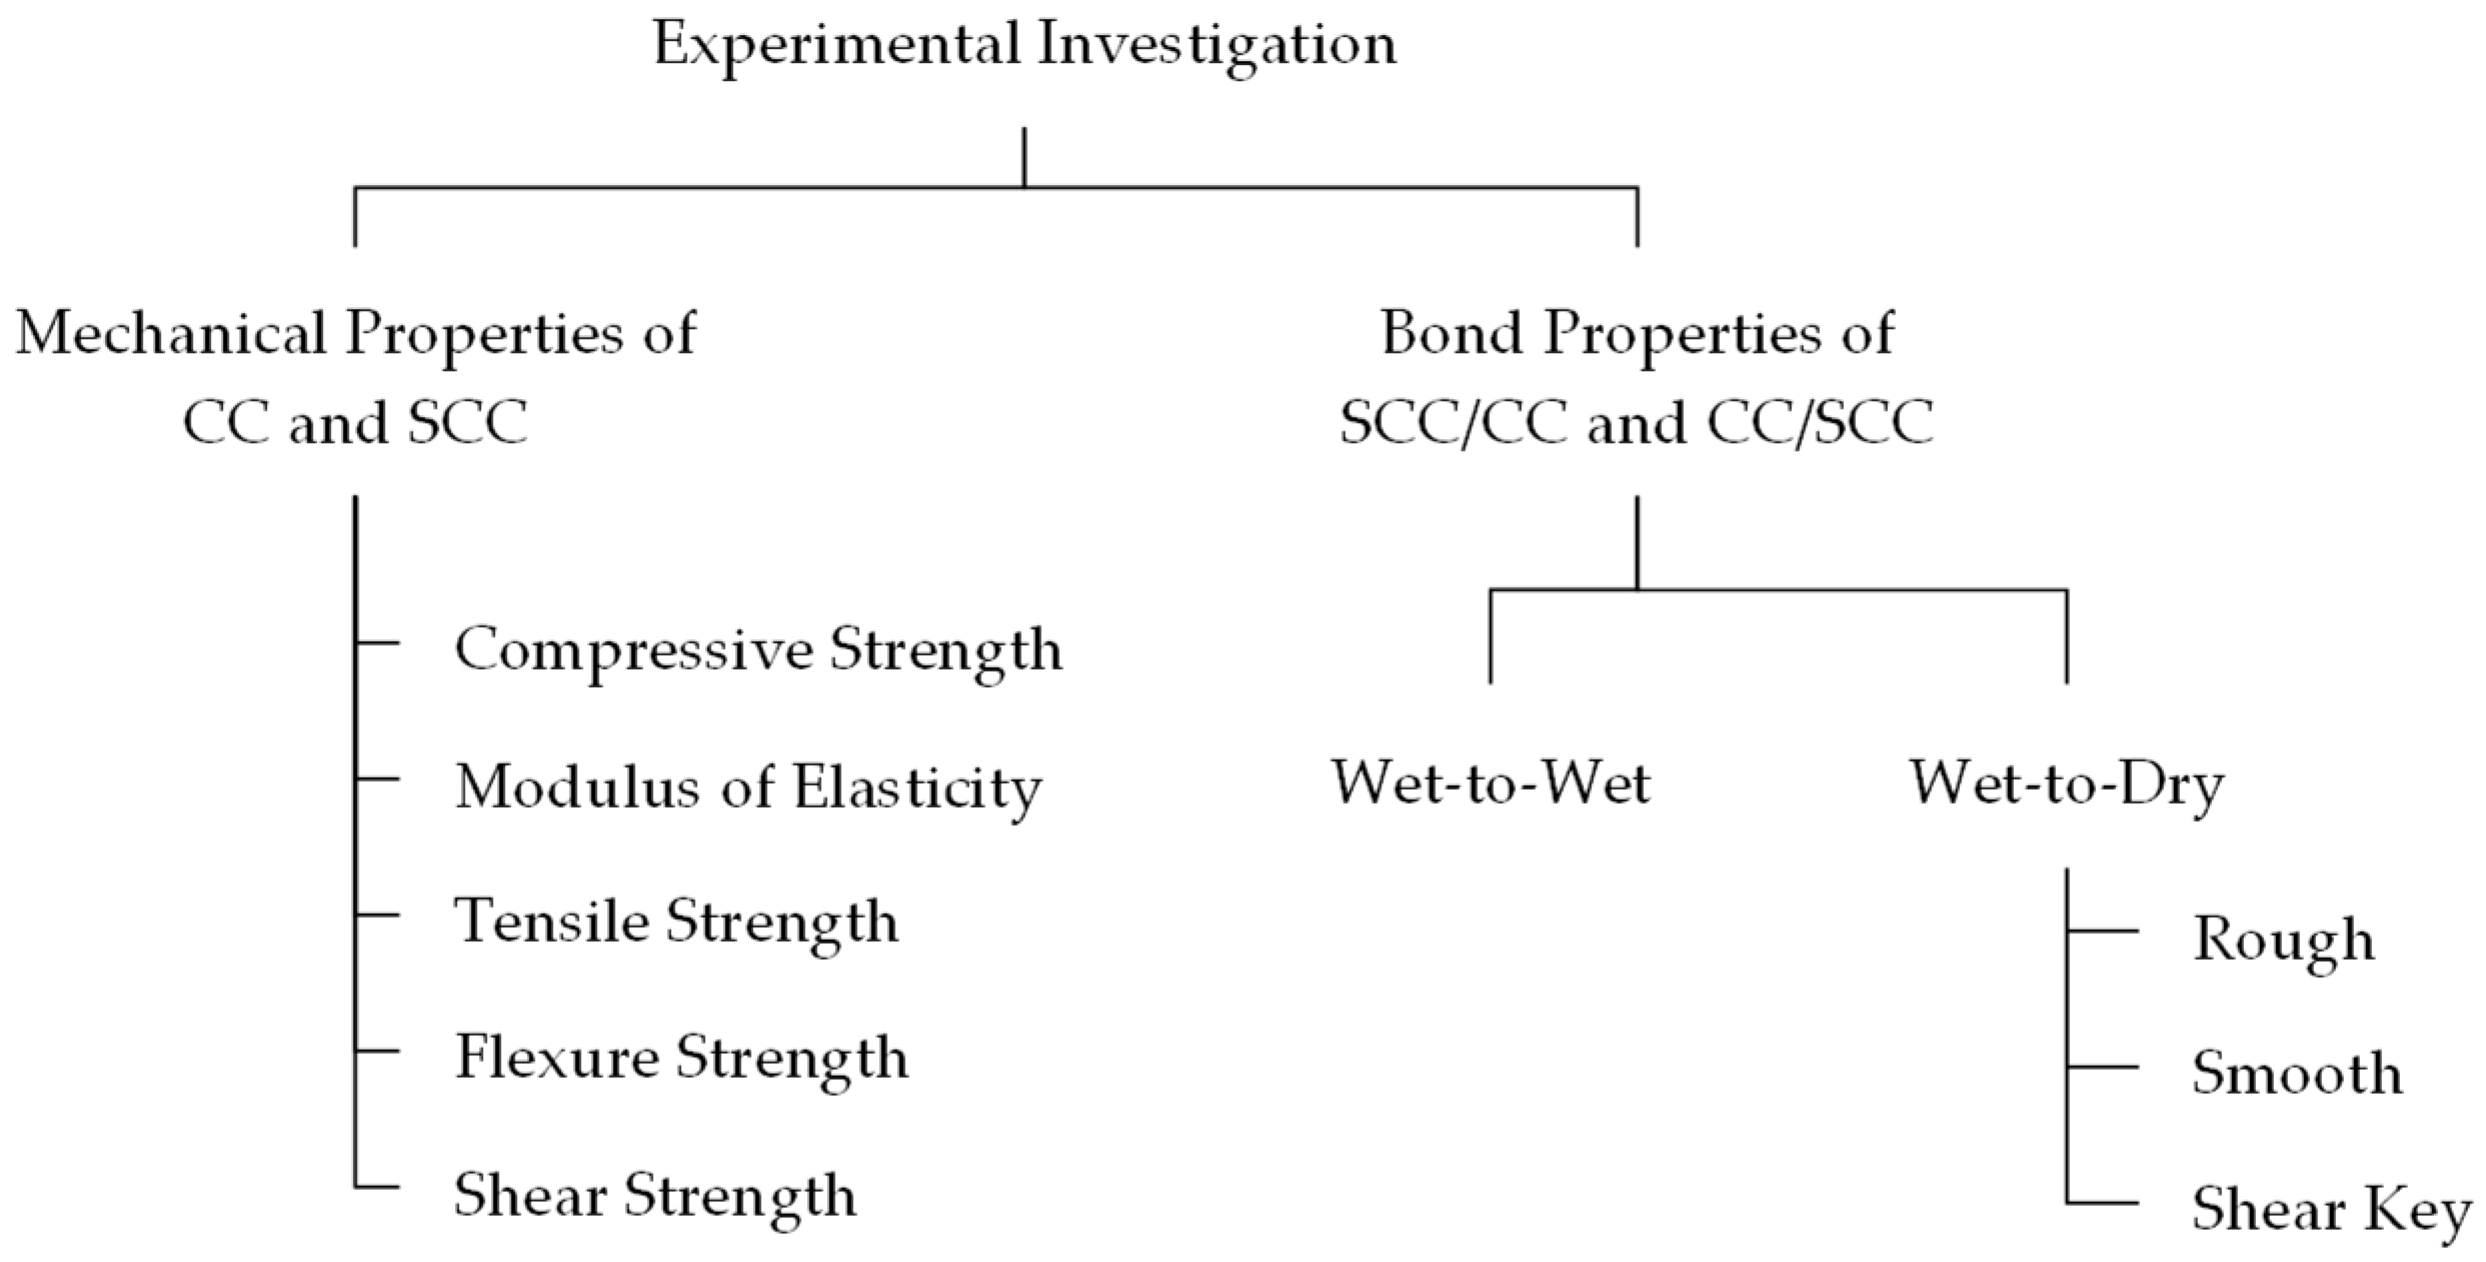
3. Experimental Investigation

This study investigates the bond strength between CC and SCC, as well as their mechanical properties. The parameters examined in terms of bond strength are the surface preparation and the casting and testing directions. The tests adopted for the bond strength evaluation are the slant shear test, flexural strength test, and the compressive and modulus of elasticity tests. Additionally, the investigated mechanical properties are the compressive strength, tensile strength, shear strength, flexural strength, and modulus of elasticity (MOE).
Figure 1 provides a summary of the experimental investigation preformed on the SCC and CC mixes. It is important to note that the main difference between the SCC and CC is the addition of carbon, graphite, and hybrid steel fibers (HSFs), which improves the electrical conductivity of the mix. Finally, a detailed explanation regarding the sample preparation and test setups is presented in the following subsections.

3.1. Concrete Mixes and Mixing Sequence

Two mixes were used in the investigation: SCC and CC. The mix proportions of the SCC were similar to those in [41], and the CC proportions cannot be shared at this time. Several composite samples were planned for the experimental investigation, as shown in Figure 2. Different surface preparation methods were included in the evaluation; therefore, four batches from the CC and the SCC mixes were prepared. During sample preparation, two batches of the CC and the SCC mixes were prepared simultaneously to cast control samples and part of the composite samples. For example, batches M1, M3, M5, and M7 were from the CC mix that were used to prepare smooth surfaces, the second cast of smooth surfaces, rough and shear key surfaces, and the second cast of rough and shear key surface samples, respectively. Similarly, batches M2, M4, M6, and M8 were from the SCC mixes that were used to prepare the samples, following the same sequence for the conductive concrete mixes. It is important to note that control compressive strength and flexural strength samples were prepared from all batches to verify consistency.

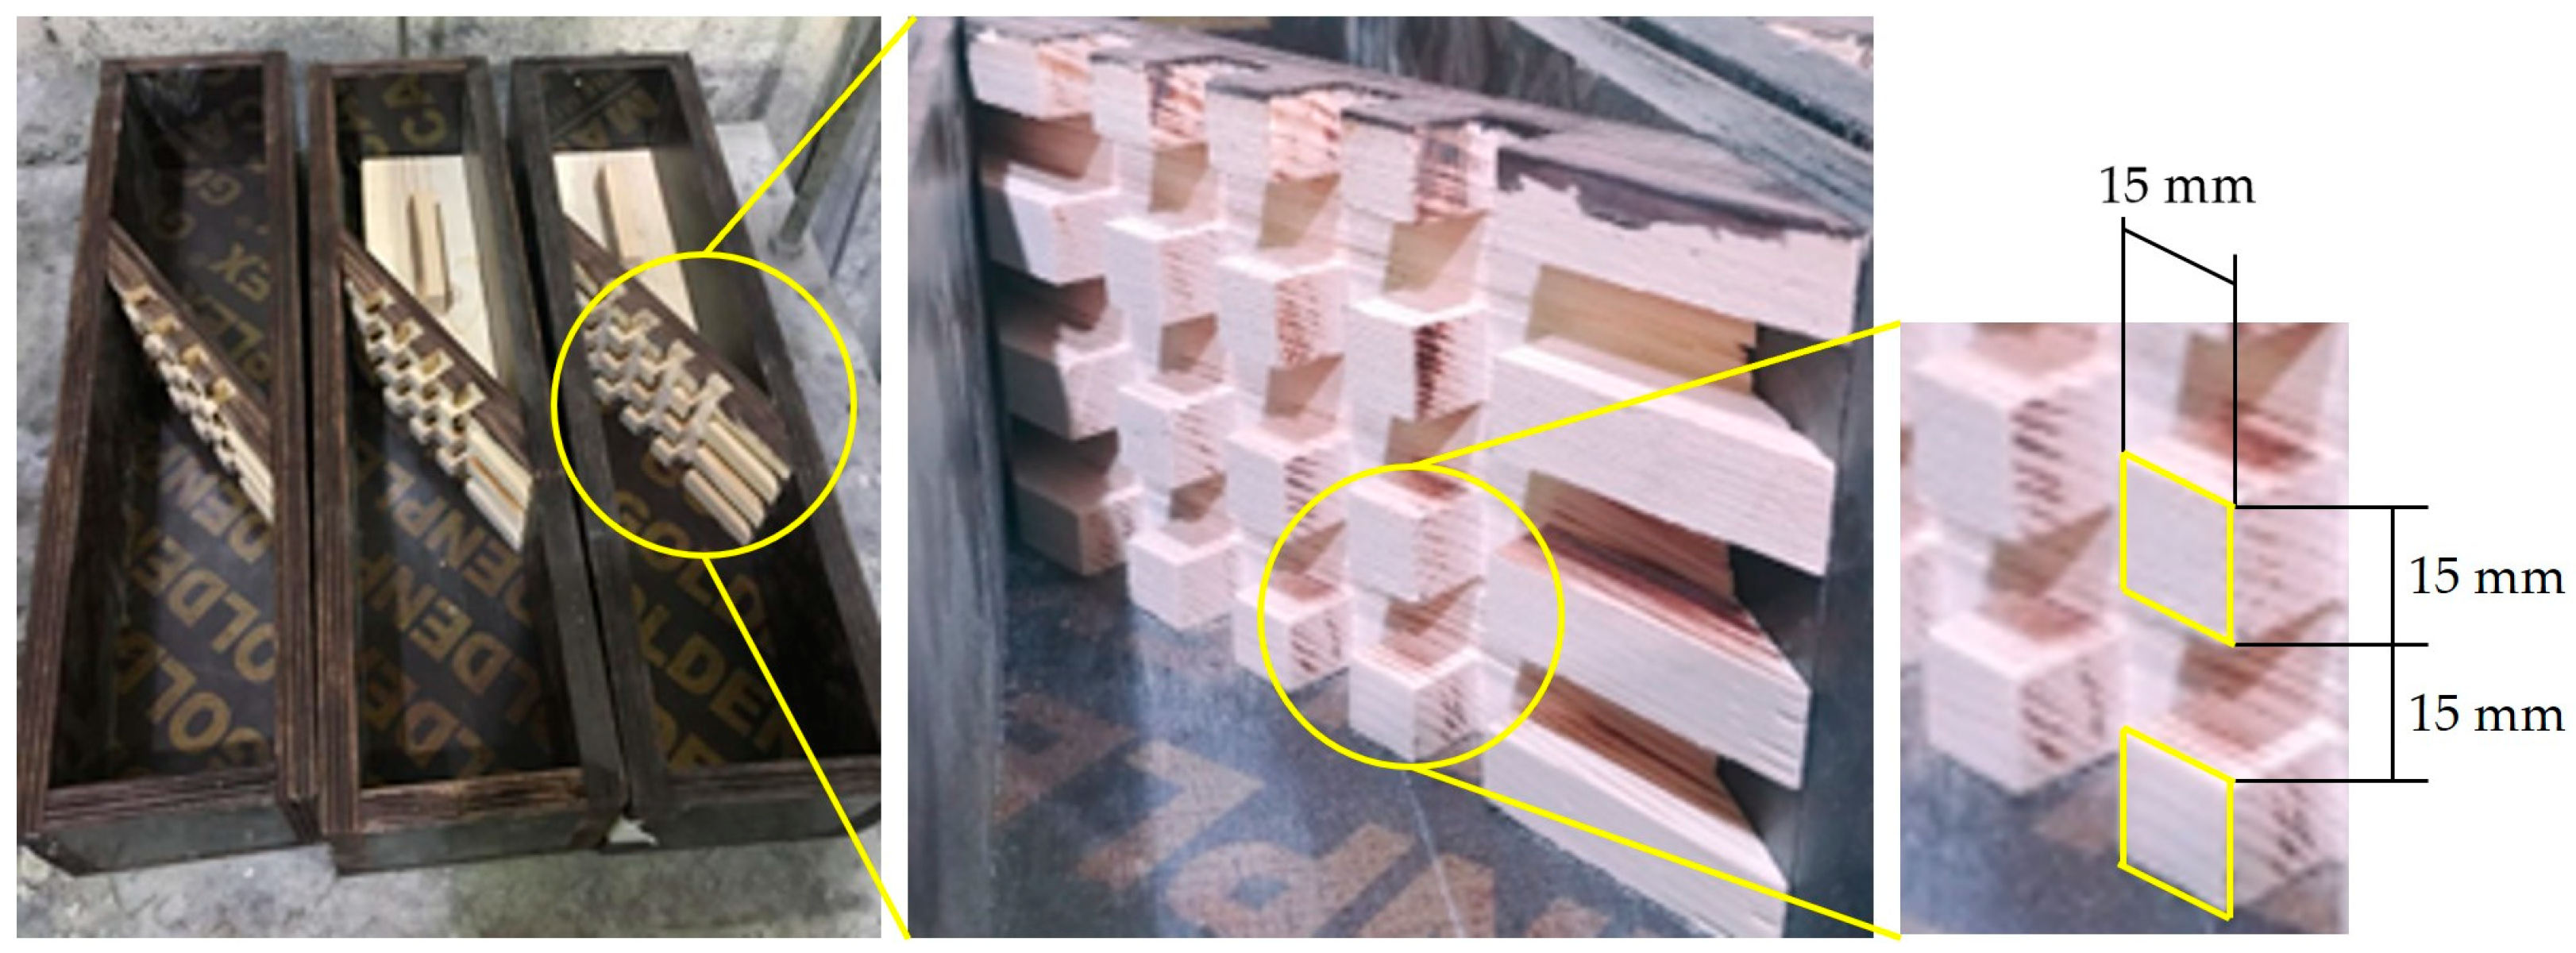
3.2. Sample Preparation

The type of test performed governed the type of sample used in this study. The samples utilized in the experimental program were cylinders and prisms with different casting configurations to evaluate the mechanical properties and bond strength of the CC and SCC. Moreover, the direct shear test used to determine the shear strength of each mix used a unique sample design (Figure 2a), and the dimensions were influenced by [27]. Additionally, the sample configurations used in the study of the mechanical properties were different from those used in the bond strength study. The samples in the study of the mechanical properties were considered fully cast samples. In other words, each sample contained only one type of concrete mix, which was ensured to properly investigate the mix’s mechanical properties. However, the bond strength samples consisted of different configurations, as shown in Figure 2. Additionally, a specific surface preparation was applied to the bond strength samples.
The surface preparations comprise two distinct configurations known as wet A-to-wet B (WAWB) and wet A-to-dry B (WADB). The first configuration, WAWB, involves pouring fresh mix A (either CC or SCC) onto fresh mix B (also either CC or SCC). This method is regarded as the most effective approach to the bonding of materials. The second configuration, WADB, entails pouring fresh mix A (CC or SCC) onto dry mix B (CC or SCC) while applying surface preparation techniques, such as rough, smooth, and shear key, on B’s surface.
The smooth surface preparation applied was a left-as-cast surface. Rough surface preparation was achieved by using chiseling and steel wire brushing for each variation of the wet-to-dry samples, as shown in Figure 3a–e. Shear key, as shown in Figure 3f, was applied by grooving the wooden mold to allow for the constant formation of roughness in each configuration. The shear key’s dimensions were 15 mm in width, depth, and clear spacing, as shown in Figure 4. To properly track the samples, each sample group was provided with a label. The samples were labeled W and D to indicate the wet and dry concrete conditions, respectively. The labels C and N were used to indicate whether a conductive concrete type or a normal SCC concrete type was used. The labels S, R, and SK were used to indicate whether the surface preparation was smooth, rough, or shear key, respectively. For instance, WCDN-S refers to a wet conductive layer above a dry normal SCC layer with a smooth surface preparation. In addition, the labels also represent the directions of casting and testing, except for in the slant shear test, since the casting direction was along the length of the sample. All variations were cast in halves, and the control samples were prepared as full cast.
Table 1 summarizes the test type, the sample size, the specifications followed during testing, the sample preparation, and the number of samples used in the tests. The compression strength test was performed using cylinders of 150 mm × 300 mm and 100 mm × 200 mm, with the configuration implementation presented in Figure 2c.
The MOE test was performed using 150 mm × 300 mm cylinders. Two strain gauges (SGs) were positioned in the vertical and horizontal centers of the samples to compute the MOE and Poisson’s ratio.
The flexural strength test was performed on prisms of 100 mm × 100 mm × 500 mm, with respect to the configuration in Figure 2b. The control samples for the compression, MOE, and flexural tests were prepared as fully cast materials A and B for each respective day of mixing. However, slant shear specimens, 100 mm × 100 mm × 500 mm, were prepared with respect to the configuration in Figure 2d, with a bond interface at an angle, α , of 35° or 30° with respect to the vertical axis. The 35° angle was used in the rough and smooth surface preparations, while the 30° angle was used in the shear key surface preparation. It is important to note that the SK surface preparation was expected to achieve a higher bond strength; therefore, a 30° angle was chosen to encourage bond failure in the SK samples. The slant shear control samples followed the same configuration but without varying the material, which was used to purely test the bond strength based on the surface treatment. Furthermore, all slant shear samples had perpendicular strain gauges placed on the bonded area to capture any disturbances in the strains at the bond interface. All samples were initially covered with wet burlaps and plastic sheets until the concrete hardened. After the hardening process, all samples were demolded and placed in curing tanks for 28 and 90 days.

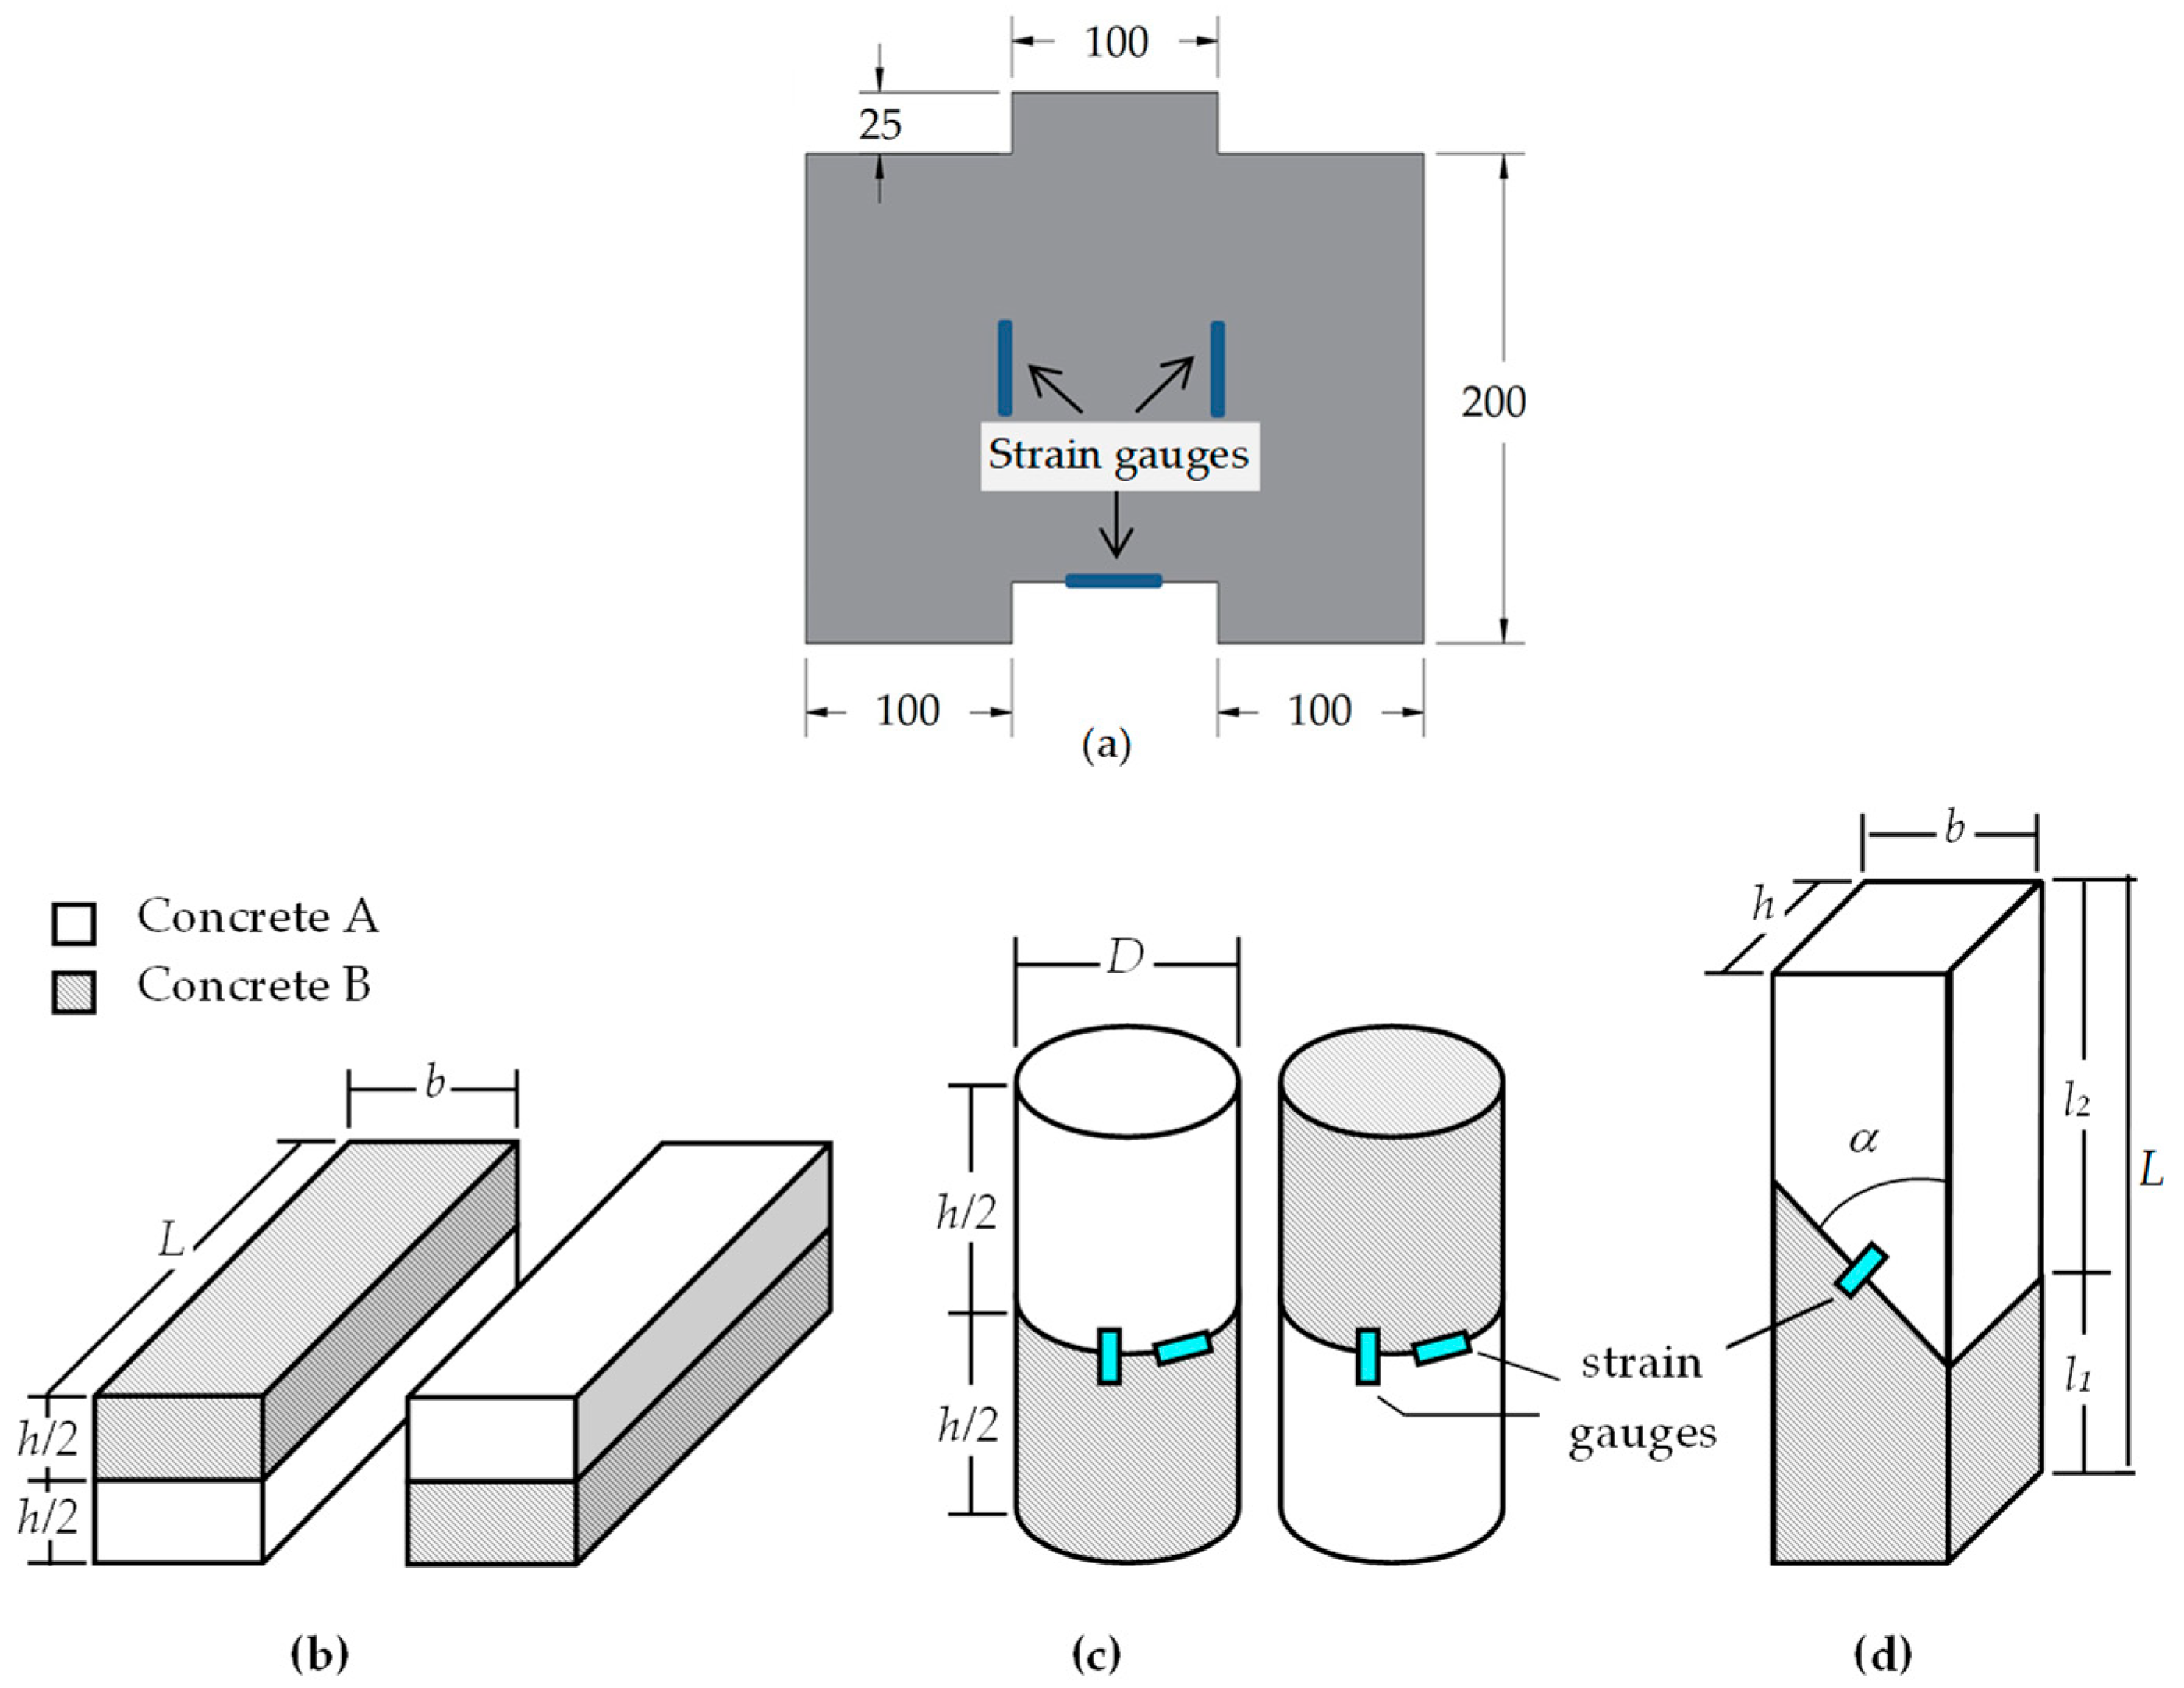
3.3. Test Setups and Instrumentation

The experimental investigation included two main groups; the first group was used for the evaluation of the mechanical properties of the SCC and CC mixes. The compressive strength, the flexural strength, the MOE, the direct shear strength, and the split tensile strength were the criteria used to evaluate the mechanical properties of both mixes. Material testing was conducted in accordance with the ASTM specifications. In the second group, bond strength specimens were evaluated using slant shear tests, compressive strength tests, flexural tests, and MOE tests. Additional information on each test and the samples used is presented in the following subsections.

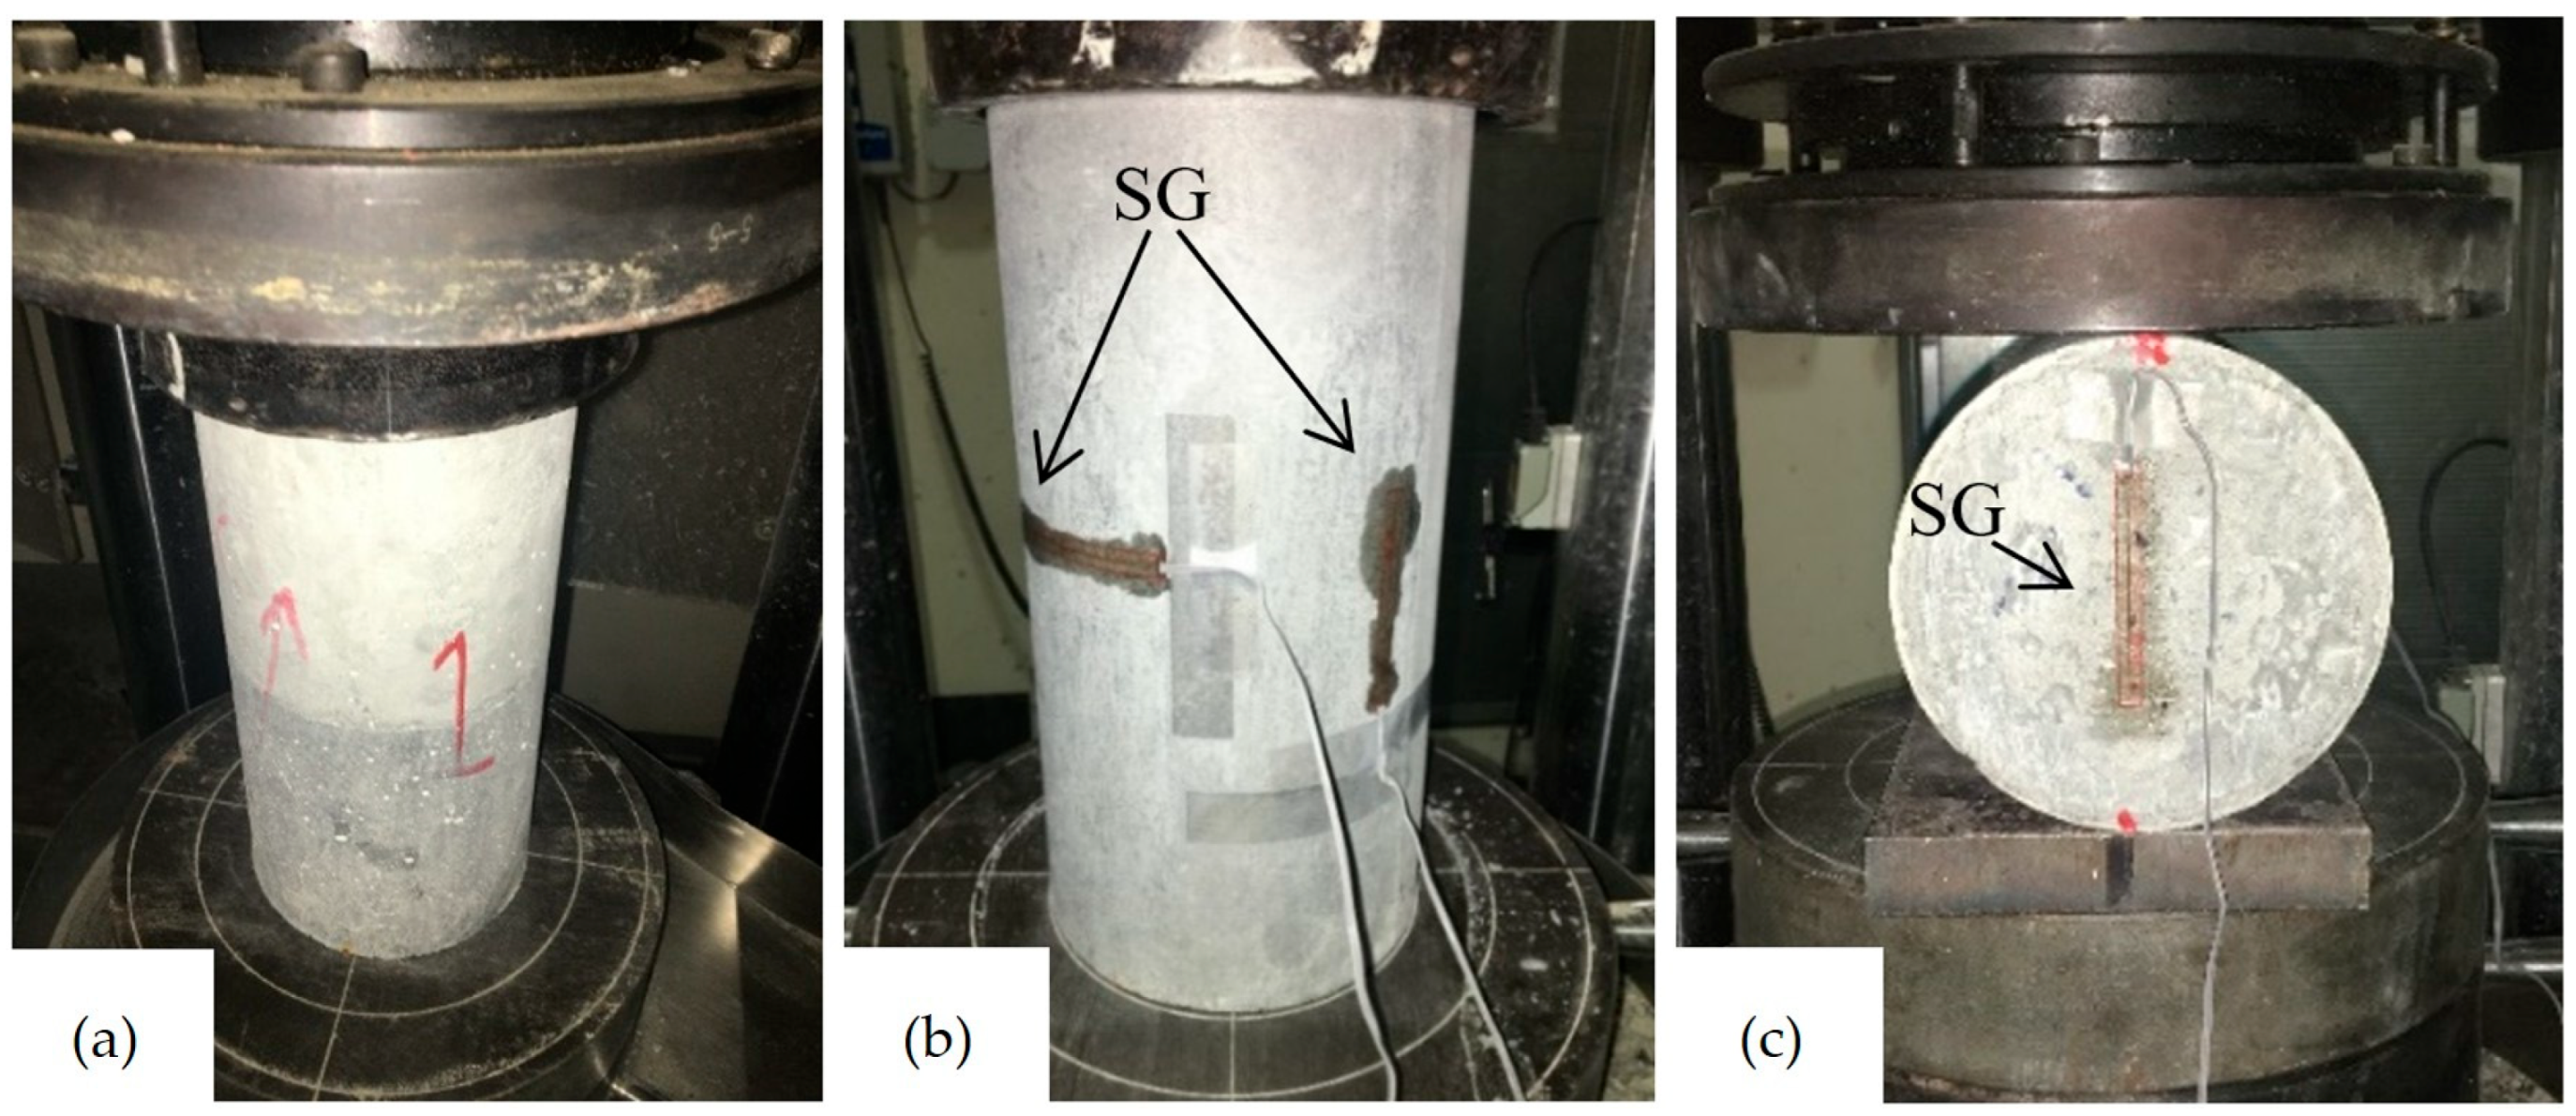
3.3.1. Compressive, MOE, and Split Tension Tests

The tests were performed at 28 and 90 days; in addition, at each testing date, cylinders were tested to correlate the results from different tests with the concrete compressive strength. The compression test, as shown in Figure 5a, was performed on cylinders of 100 mm × 200 mm and 150 mm × 300 mm. The test was performed according to ASTM C39 [42], with a loading rate of 0.25 MPa/s. The MOE test was conducted on a 150 mm × 300 mm cylinder using a loading rate of 0.25 MPa/sec according to both ASTM C39 [42] and ASTM C469-22 [43] specifications. The modulus of elasticity, E , is given by
E = σ 2 σ 1 / ε 2 ε 1 ,
and Poisson’s ratio, v , is given by
v = ε t 2 ε t 1 / ε 2 ε 1 ,
where parameter σ 1 is the stress evaluated at strain ε 1   = 0.00005, and σ 2 and ε 2 are the stress and strain at 40% of the ultimate stress, respectively. Parameter ε t 1 is the transverse strain at ε 1 = 0.00005, and ε t 2 and ε 2 are the transverse strain and longitudinal strain at 40% of the ultimate stress, respectively.
After crushing the samples, strain data from the vertical and horizontal strain gauges, as shown in Figure 5b, were recorded. The MOE and Poisson’s ratio were calculated using the vertical and horizontal strain gauges, respectively [43]. Unlike the compressive and MOE tests, the split tension test was only performed to measure the tensile strength of the material. The split tension test was performed based on ASTM C496/C496M–17 [47], with a loading rate of 1.3 MPa/min on 150 × 300 mm cylinders. The tensile strength, T , was calculated using
T = 2 P / π L D ,
where P is the maximum load applied to the sample, and L   a n d   D are the length and diameter of the cylinder, respectively. An attempt was made to measure the vertical and horizontal strains by placing strain gauges in the center of the flat surface, as shown in Figure 5c.

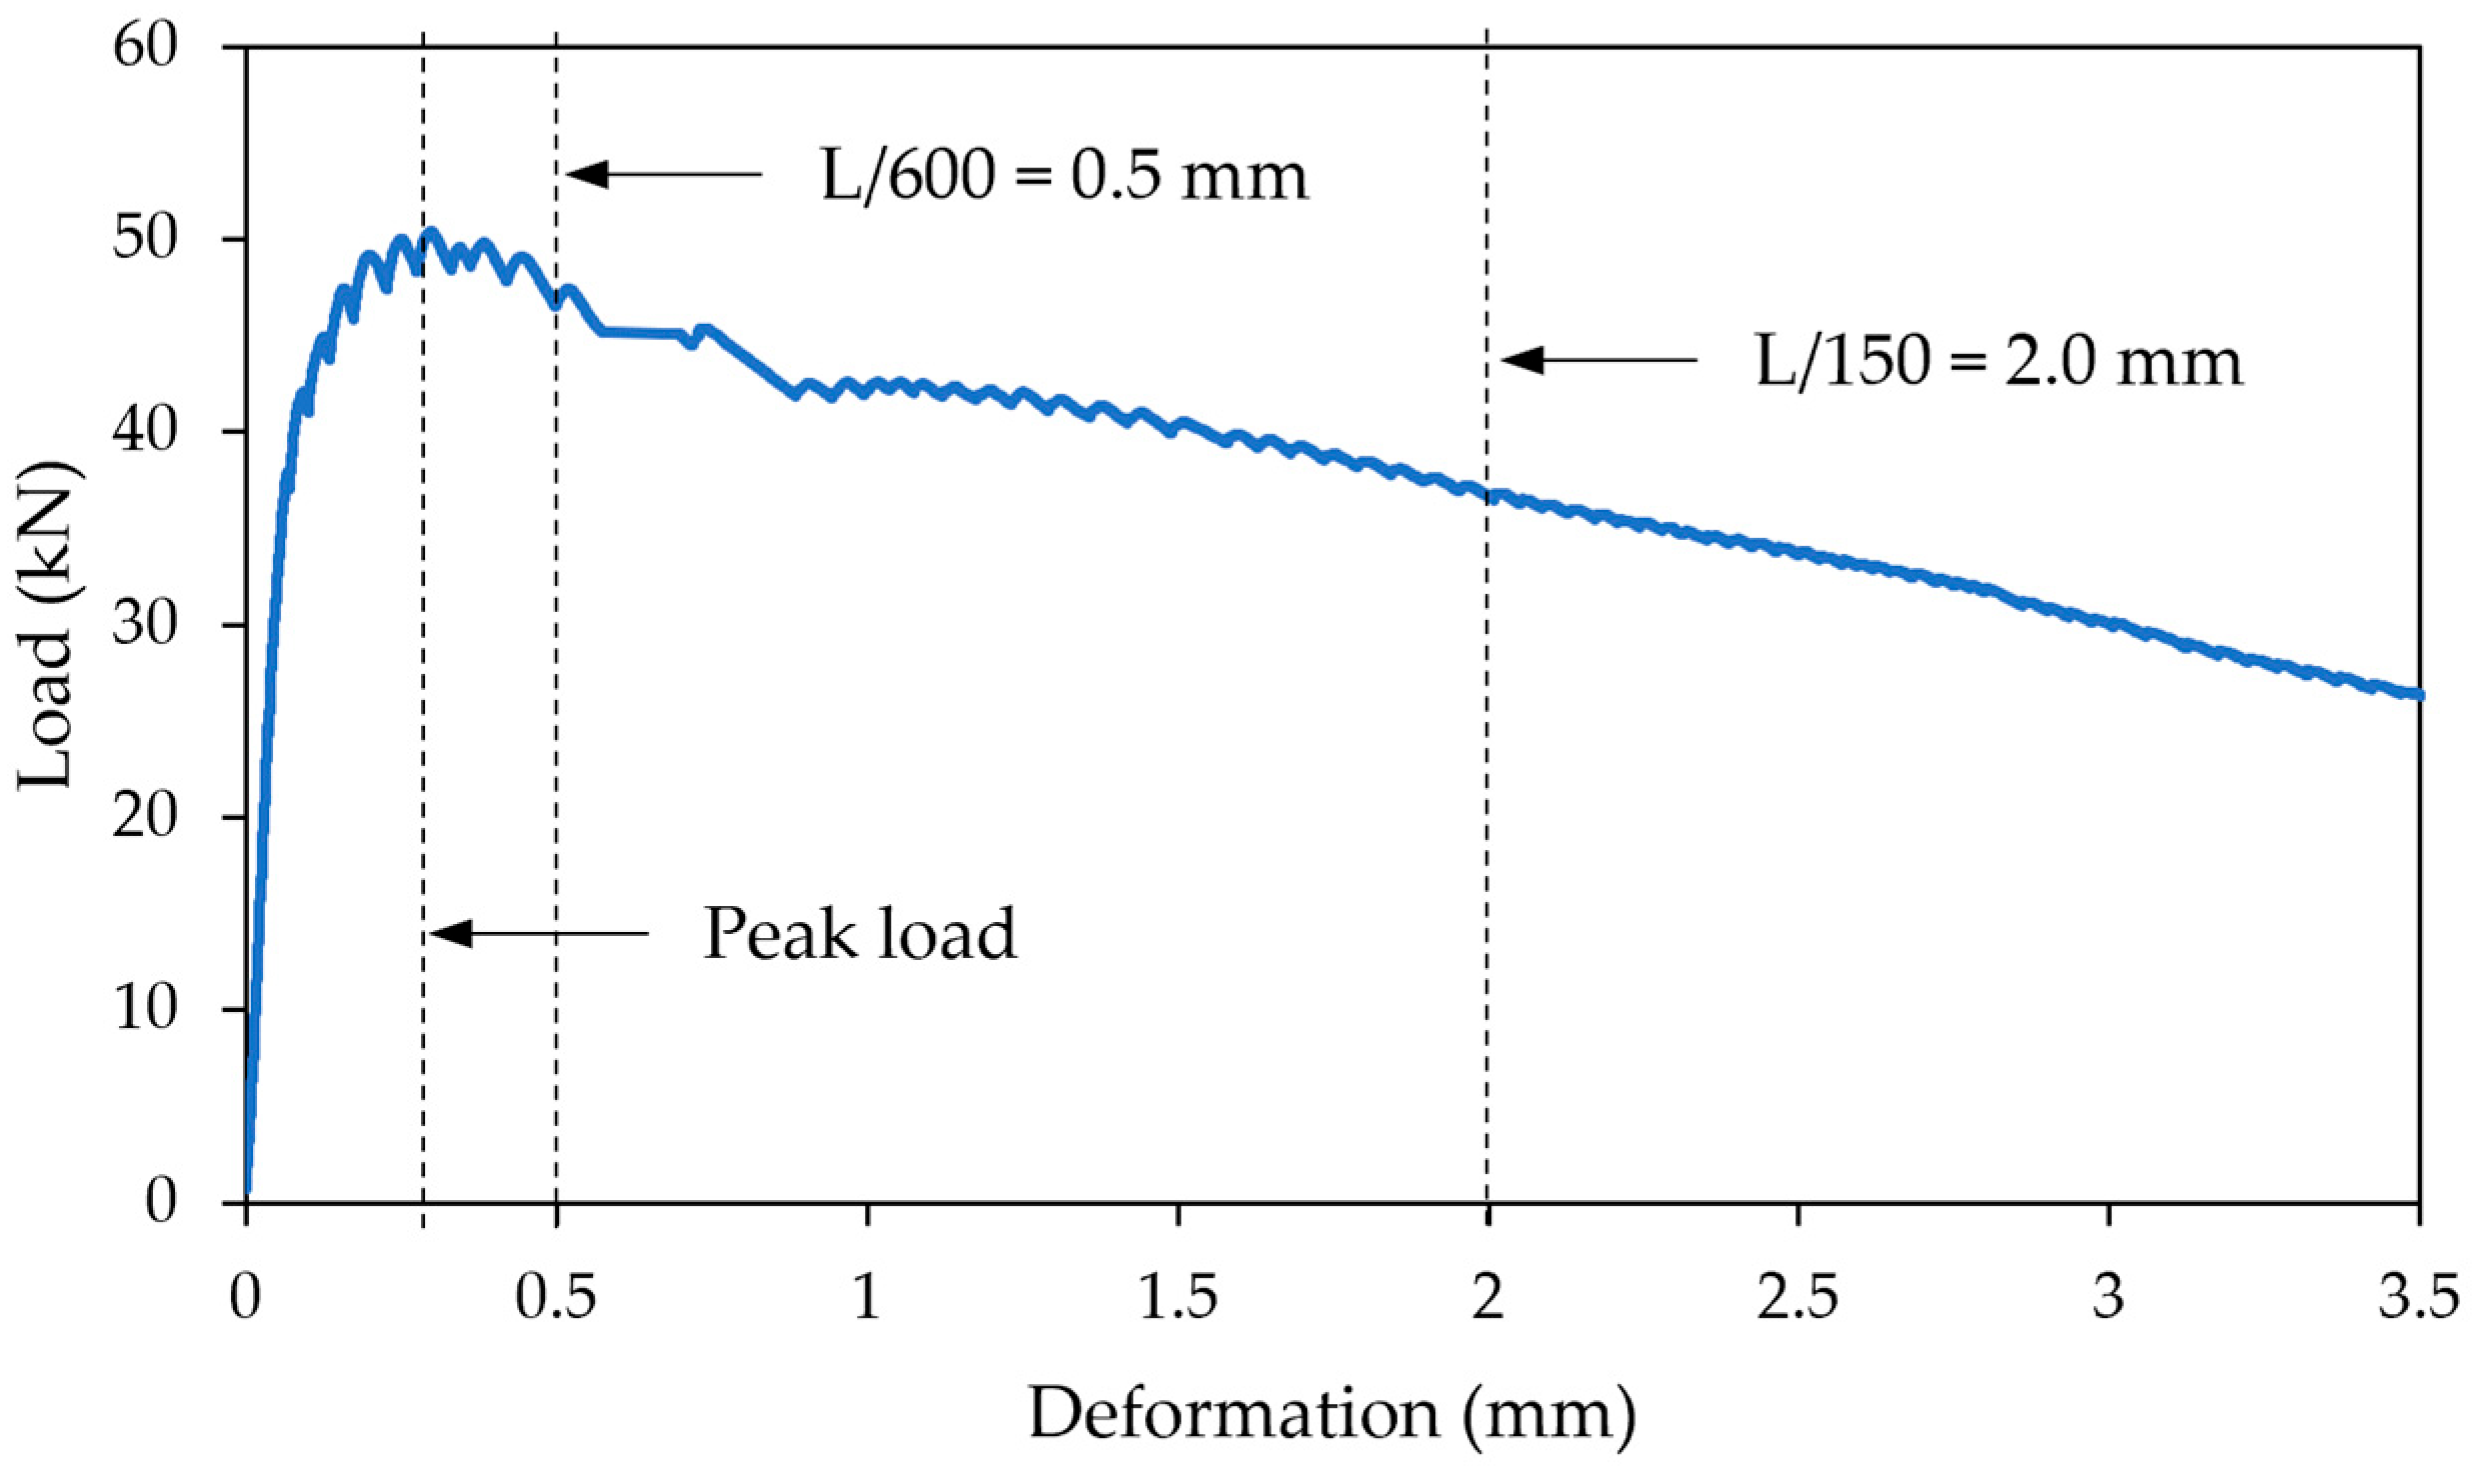
3.3.2. Flexural Tests

All flexural tests were performed on 100 mm × 100 mm × 500 mm prisms based on ASTM C1609 [44] at a deflection rate of 0.1 mm/min, except for the fully cast plain concrete samples. For the CC specimens with fibers, deflection was measured using a linear variable displacement transducer (LVDT). In addition, the residual strength was calculated as an indication of ductility. Residual strength is not a true stress, and it was computed using simple engineering bending theory for linear elastic materials and uncracked section properties. The fully cast plain concrete samples were tested in flexure based on ASTM C78 [45], with a loading rate of 1.02 MPa/min. The flexural strength is given by
f r = P L / b h 2
where L is the span length, b is the average width of the specimen, and h is the average depth of the specimen at fracture. All flexural strength measurements were computed using the ASTM specifications shown in Table 1 and were valid if failure occurred between the two loading spans. Note that if failure occurred outside the maximum moment region, the only results taken into consideration were those for samples without steel fibers.

3.3.3. Slant Shear Tests

The slant shear tests, shown in Figure 6a, were performed using a hydraulic universal testing machine (UTM) on 100 mm × 100 mm × 500 mm prisms, with a slanted interface at a 35° angle for the smooth and rough surface preparations and at a 30° angle for the SK surface preparation with respect to the vertical axis. The inclination was based on the possibility of bond failure occurring, which was between 40° and 20° degrees [35]. The test was based on the European standard BS EN 12615:1999 [40], with a loading rate of 0.2 MPa/s. The shear strength is given by
f s = P / 2 A s ,
where A s is the expected shearing area (slanted interface x specimen width (b)). In addition, strain data perpendicular to the bonded plan were gathered using strain gauges, as shown in Figure 2d. Equations (6) and (7) were used to calculate all principal stresses, which are based on Mohr’s circle [14]:
σ n = P / A sin 2 α ,      
τ n = P / 2 A sin 2 α ,
where P is the maximum load achieved, A is the area of the interface, and α is the angle with respect to the y-axis, as shown in Figure 2d.

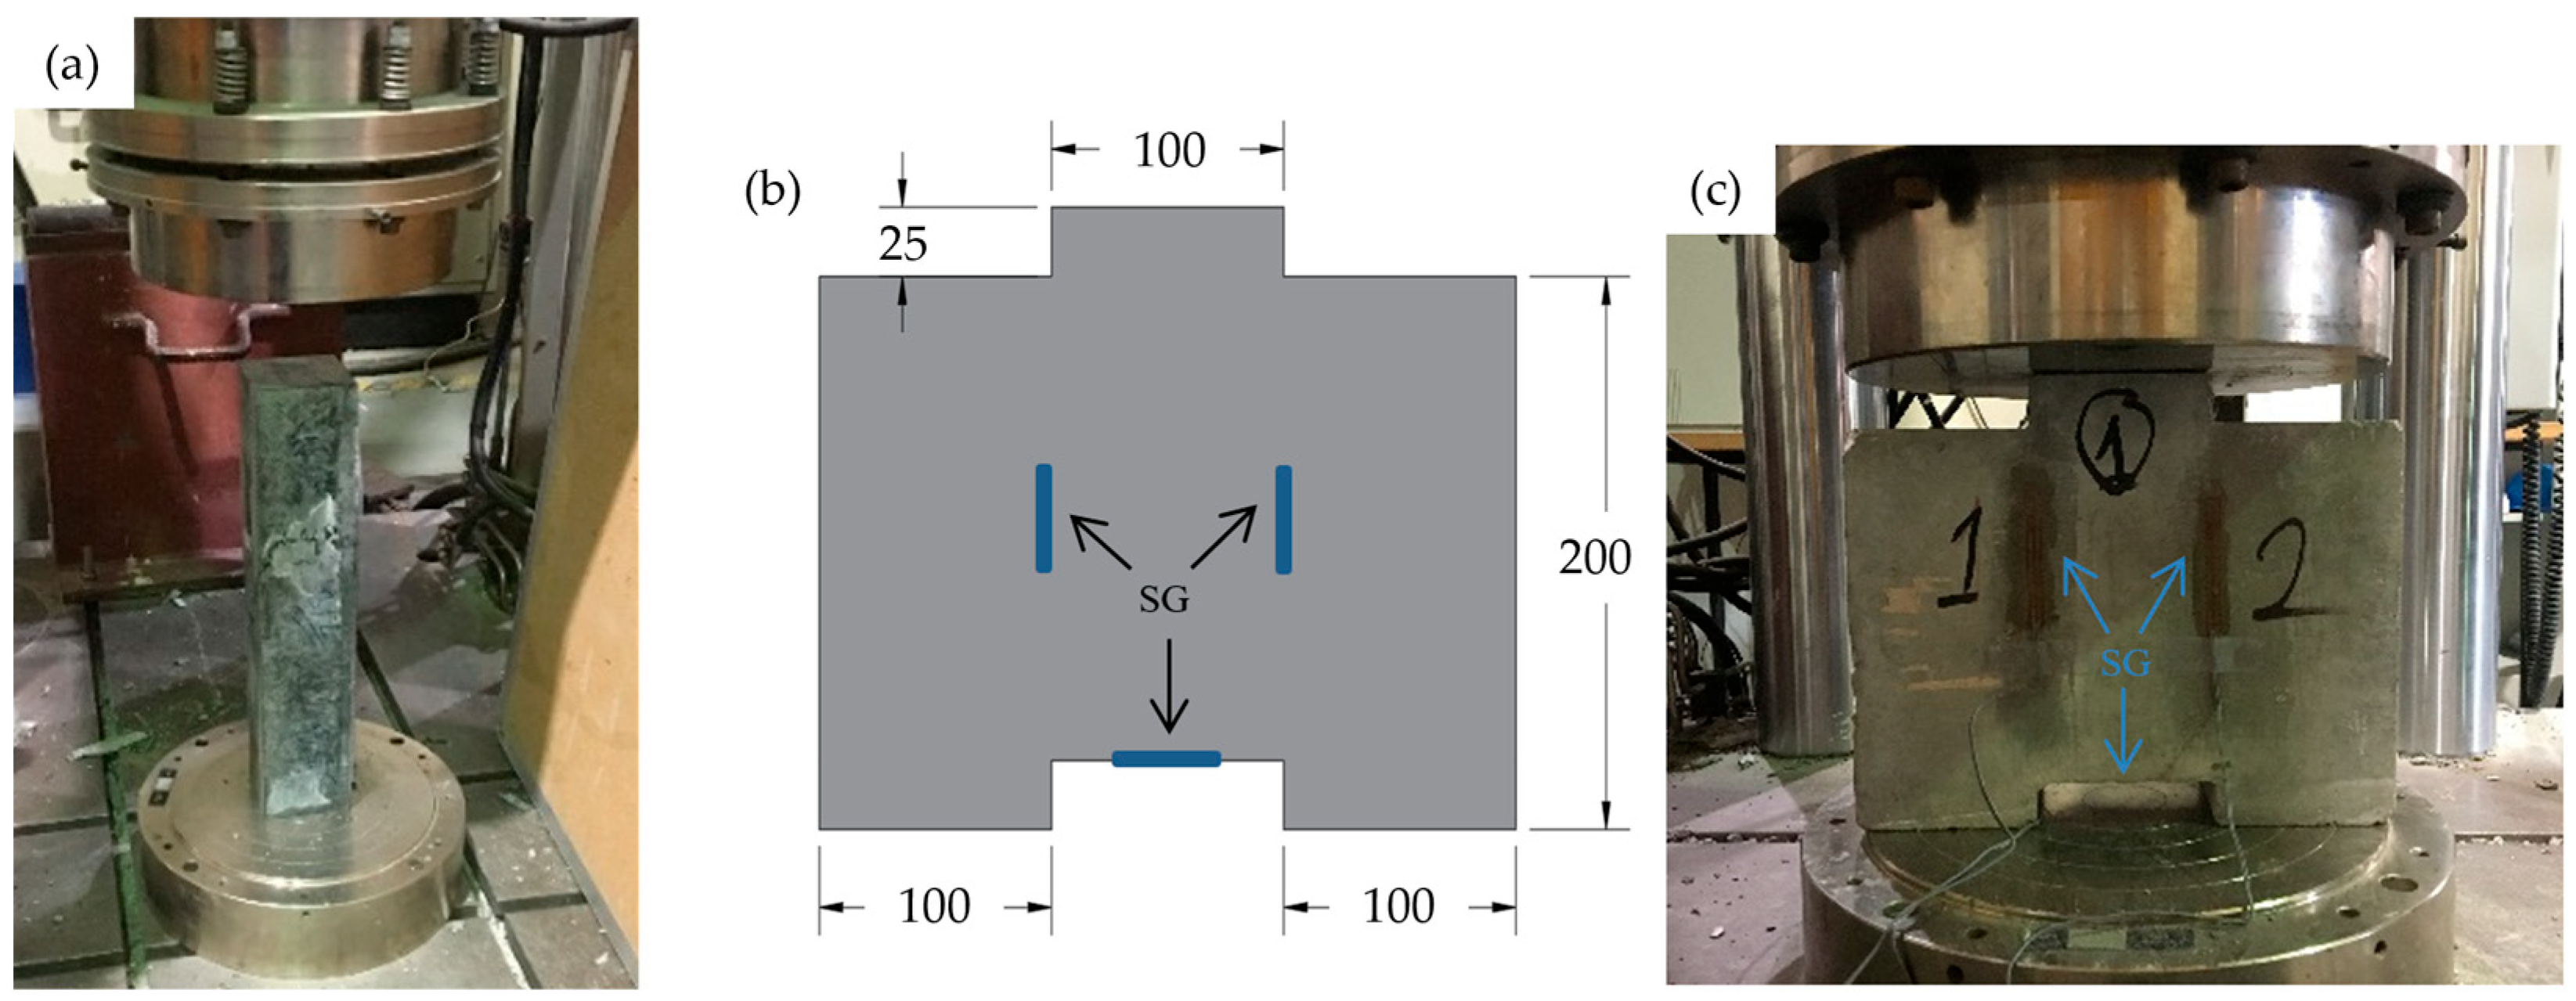
3.3.4. Direct Shear Tests

The direct shear test was performed only to determine the shear strength of the mix. Thus, fully cast samples were used with the dimensions shown in Figure 6b,c and a thickness of 100 mm, which were adopted from [27]. The test loading rate was 0.2 MPa/s, which is like the compressive strength of a cube in the British standard BS 1881 [48] since the loaded surface was a square of 100 mm × 100 mm. Additionally, three strain gauges were attached to capture the different stresses generated during testing. The first two were positioned at the possible failure interface. The third strain gauge was positioned in the tensile region of the direct shear sample. Figure 6b presents a visual summary of the strain gauges’ positions and the sample dimensions. It is important to note that the expected area of failure was vertically along the sample’s length, which was 200 mm × 100 mm.

4. Results

The results of all batches were observed to be consistent. Table 1 summarizes the average results of both the mechanical properties and the bond strengths. The mechanical property samples consisted of fully cast mixes, while the bond strength samples consisted of a composite of both mixes. The tests applied to examine both the mechanical properties and the bond strength were the compressive, MOE, and flexural tests. Moreover, the slant shear test was applied only to examine the bond strength, while the direct shear and split tension tests were applied to examine the mechanical properties only. Finally, the bond strength was based on two parameters, which were the surface preparation and the casting and testing directions.

4.1. Mechanical Properties of CC and SCC

The SCC achieved a compressive strength of 63.5 MPa at 28 days and 68.4 MPa at 90 days. The MOE capacity was 35.1 GPa, with an ultimate strain reading between 0.002 and 0.003. The flexural, split, and direct strengths reached 3.9 MPa, 3.8 MPa, and 8.4 MPa, respectively. However, the CC’s compressive strength was 52.5 MPa at 28 days and 60 MPa at 90 days. The MOE capacity was 24.7 GPa, with an ultimate strain range between 0.003 and 0.004. The flexural, split, and direct shear strengths reached 15 MPa, 7.9 MPa, and 19.9 MPa, respectively. Moreover, the residual strength of the CC at L/600 was 14.4 MPa, and at L/150, it was 11.0 MPa, where L is the length between the supports. It is important to note that the CC achieved a higher tensile strength, shear strength, flexural strength, residual strength, and post-peak performance, which was due to the hybrid steel fibers.

4.2. Concrete-to-Concrete Bond Strength in Compression Test

The compressive strength of the composite samples depended on the surface preparation. The surface preparation affected the compressive strength performance, as demonstrated by WCDN-S’s and WNDC-S’s failure modes. The smooth surface interface separated before and during testing, which is an indication of the formation of a weak bond. However, the rough and wet-to-wet surface preparations achieved similar compressive strengths and failure modes to the CC and SCC controls, which were between 52.5 MPa and 63.5 MPa, respectively. The casting direction did not have any major effects on the bond strength. However, variations in the material affected the composite samples. The composite samples’ compressive strengths ranged between those of the SCC and CC, as shown in Table 1.

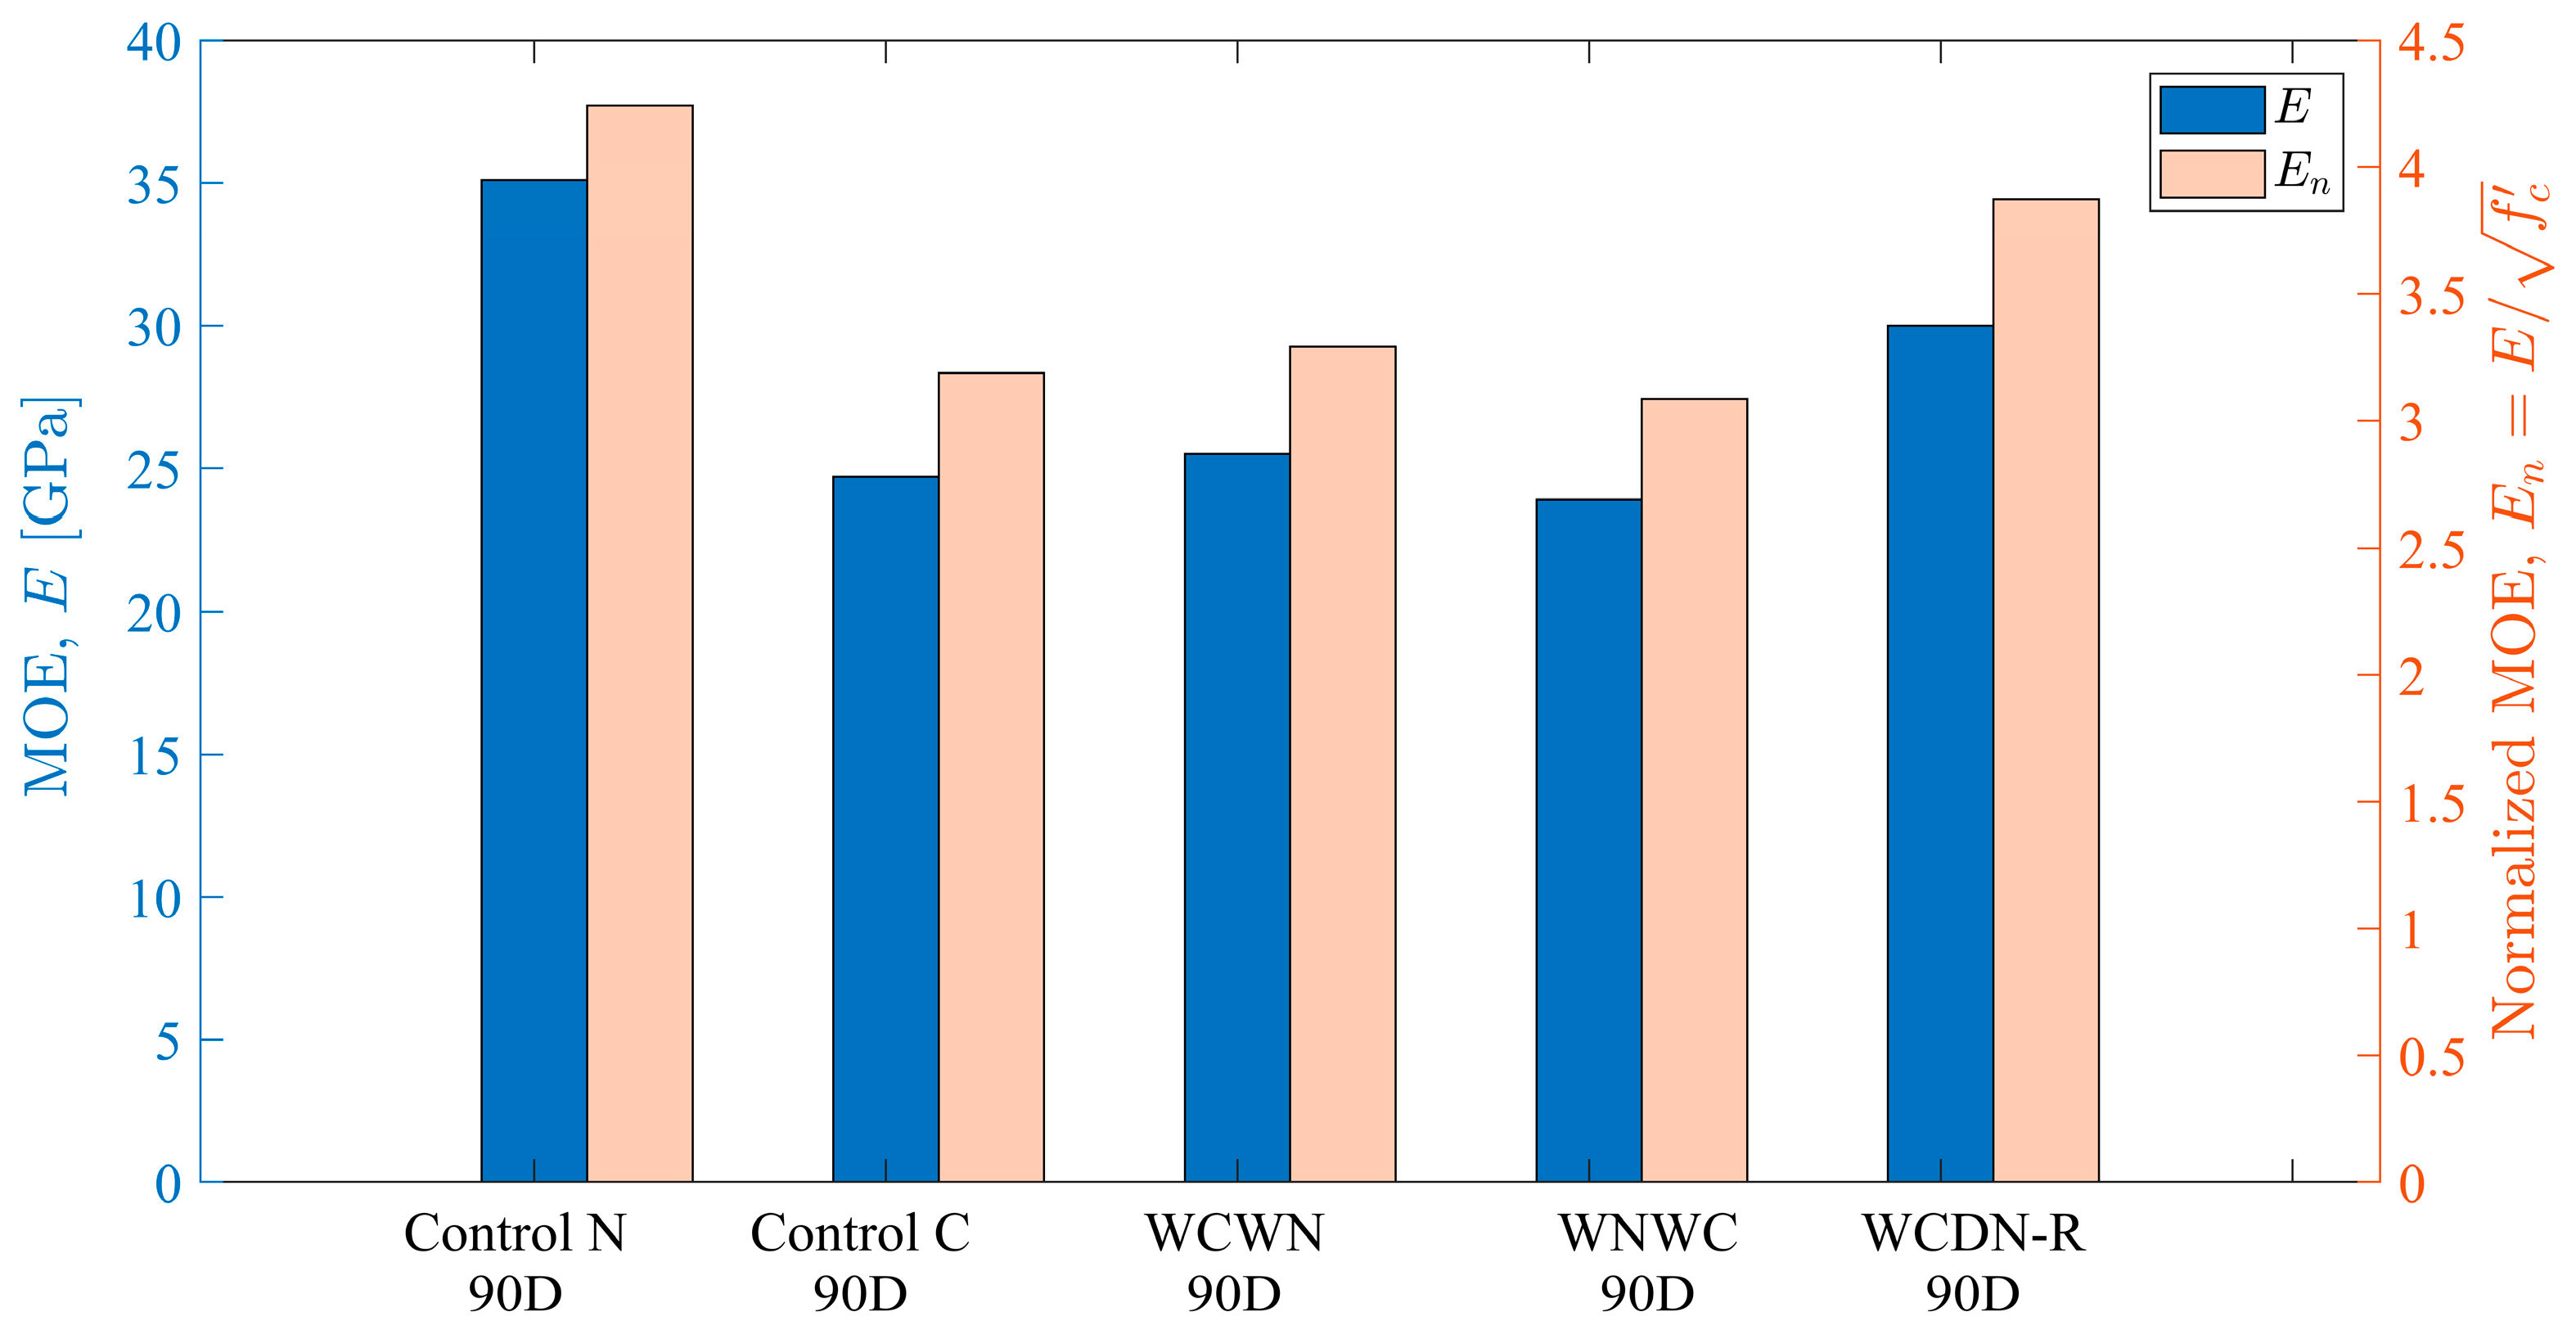
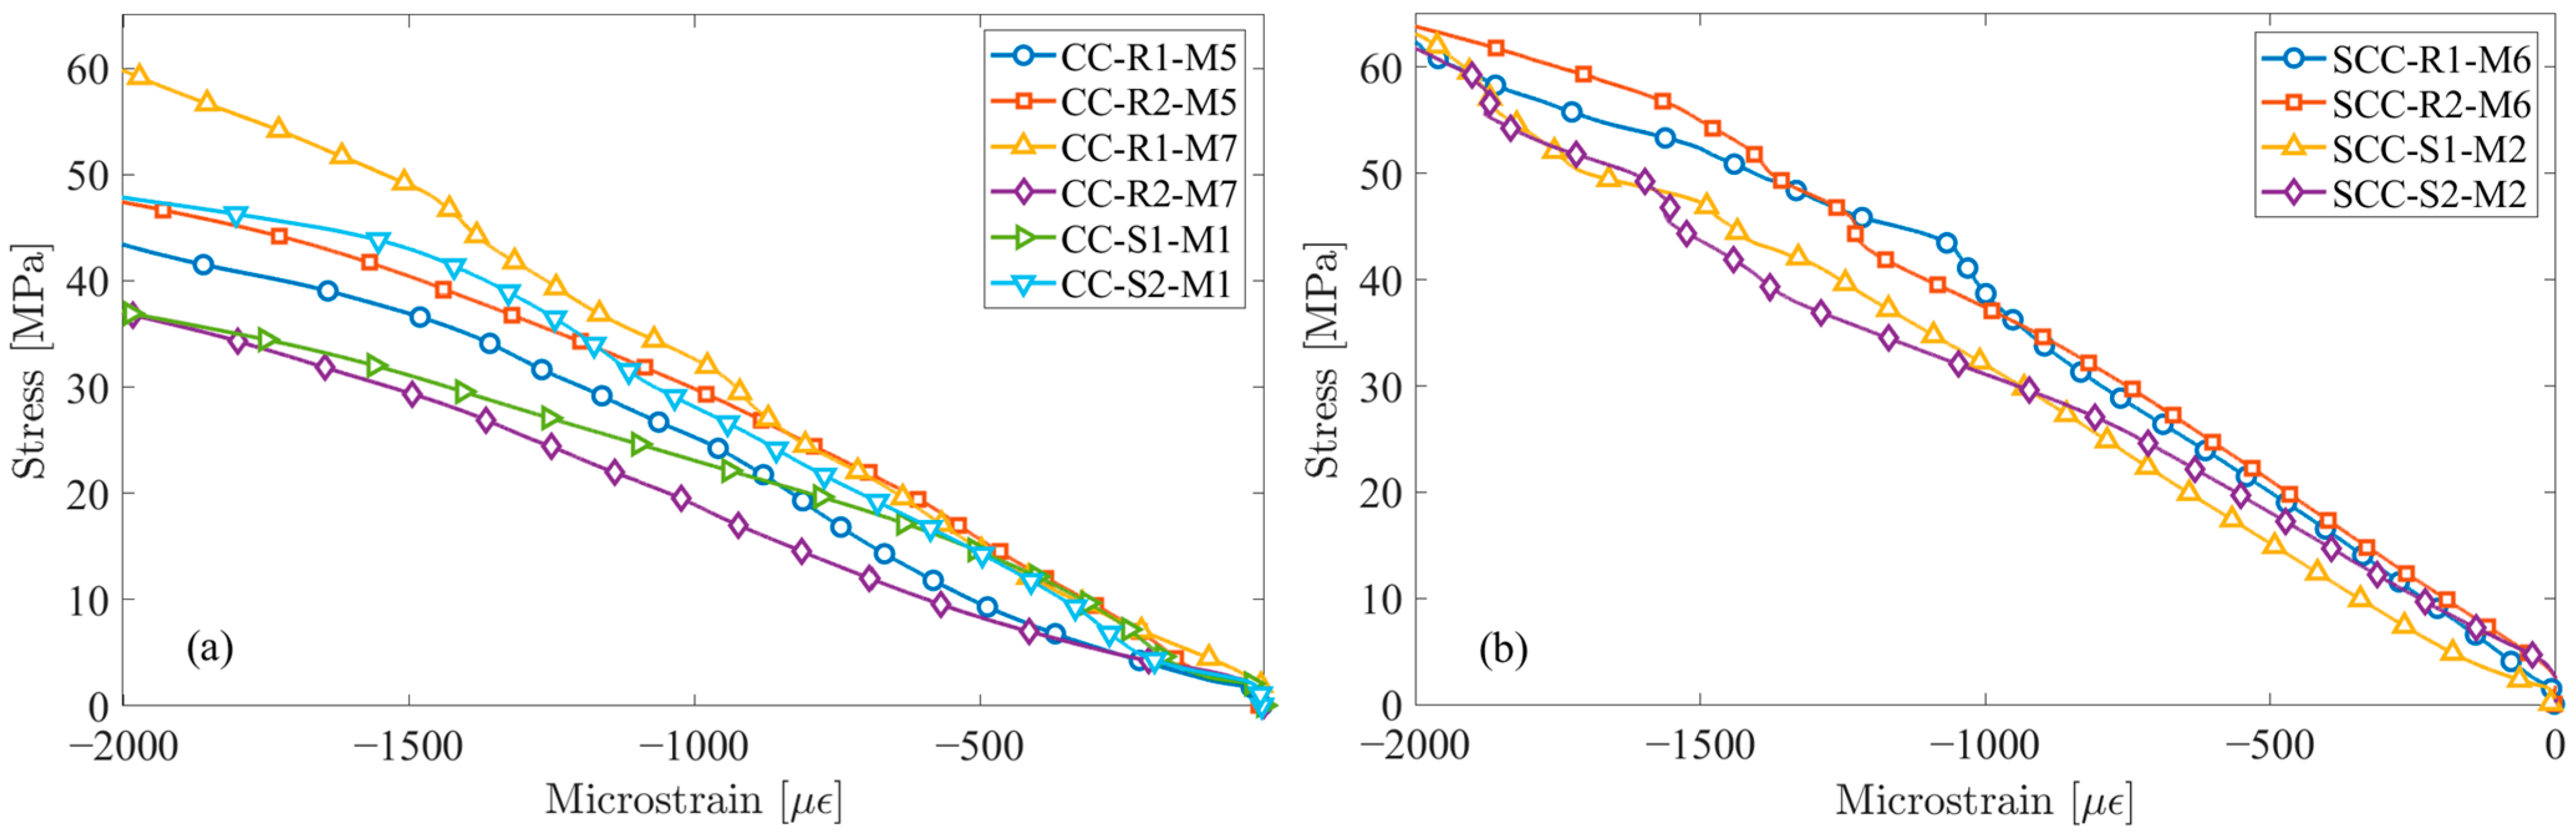
4.3. Concrete-to-Concrete Bond Strength in Modulus of Elasticity Test

Similarly, the surface preparation affected the composite stiffness. The smooth surface interface in the MOE tests had a similar performance to that in the compressive strength test. Some composite samples with a smooth surface interface failed by separation before or during testing. The testing and casting directions did not play major roles. Therefore, WCWN and WNWC both achieved similar MOEs of 25.5 GPa and 23.9 GPa, respectively, as shown in Table 1. The main effect was observed with the variation of the material. The presence of the SCC and CC mix in a composite sample resulted in achieving an ultimate strain range between 0.002 and 0.004, which was observed in both the rough and wet-to-wet samples. It is important to note that all samples, except for those with the smooth surface preparation, achieved similar MOE and strain readings to the control samples.

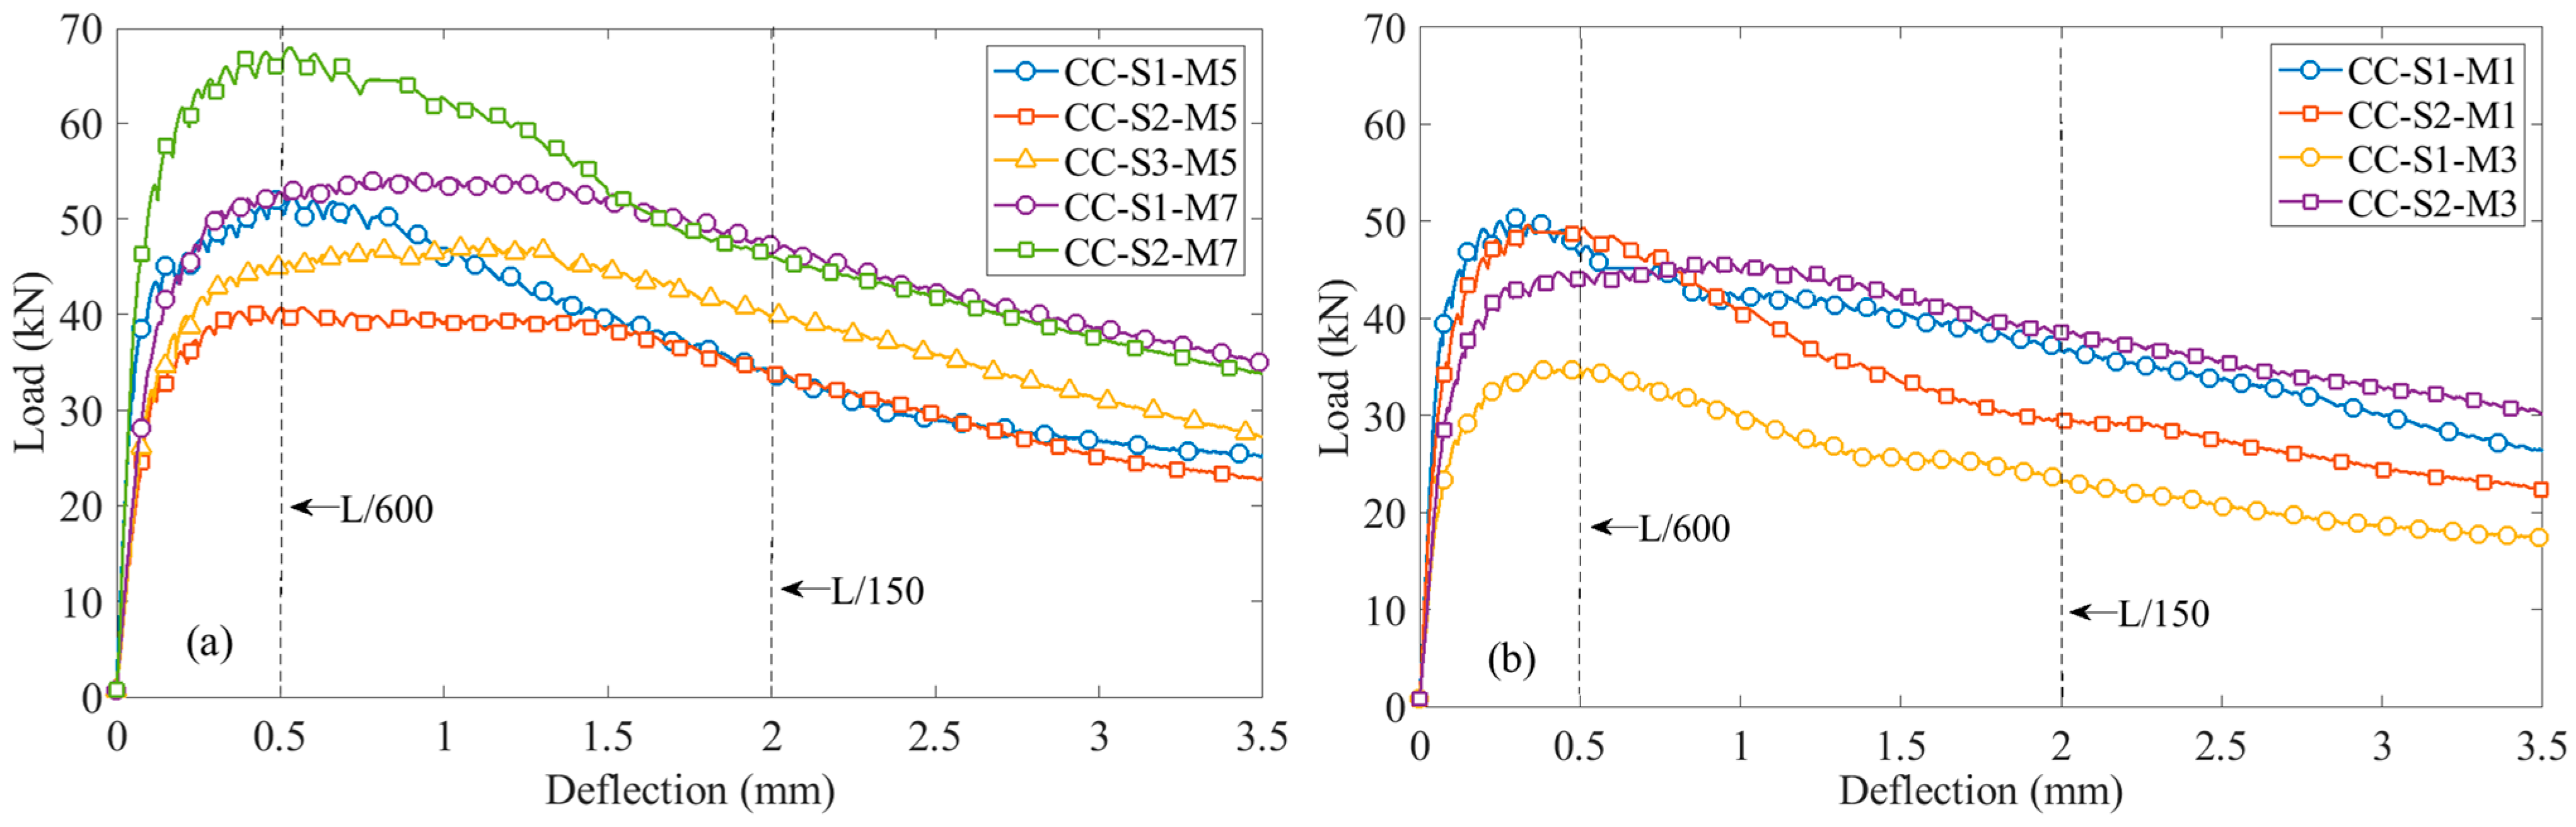
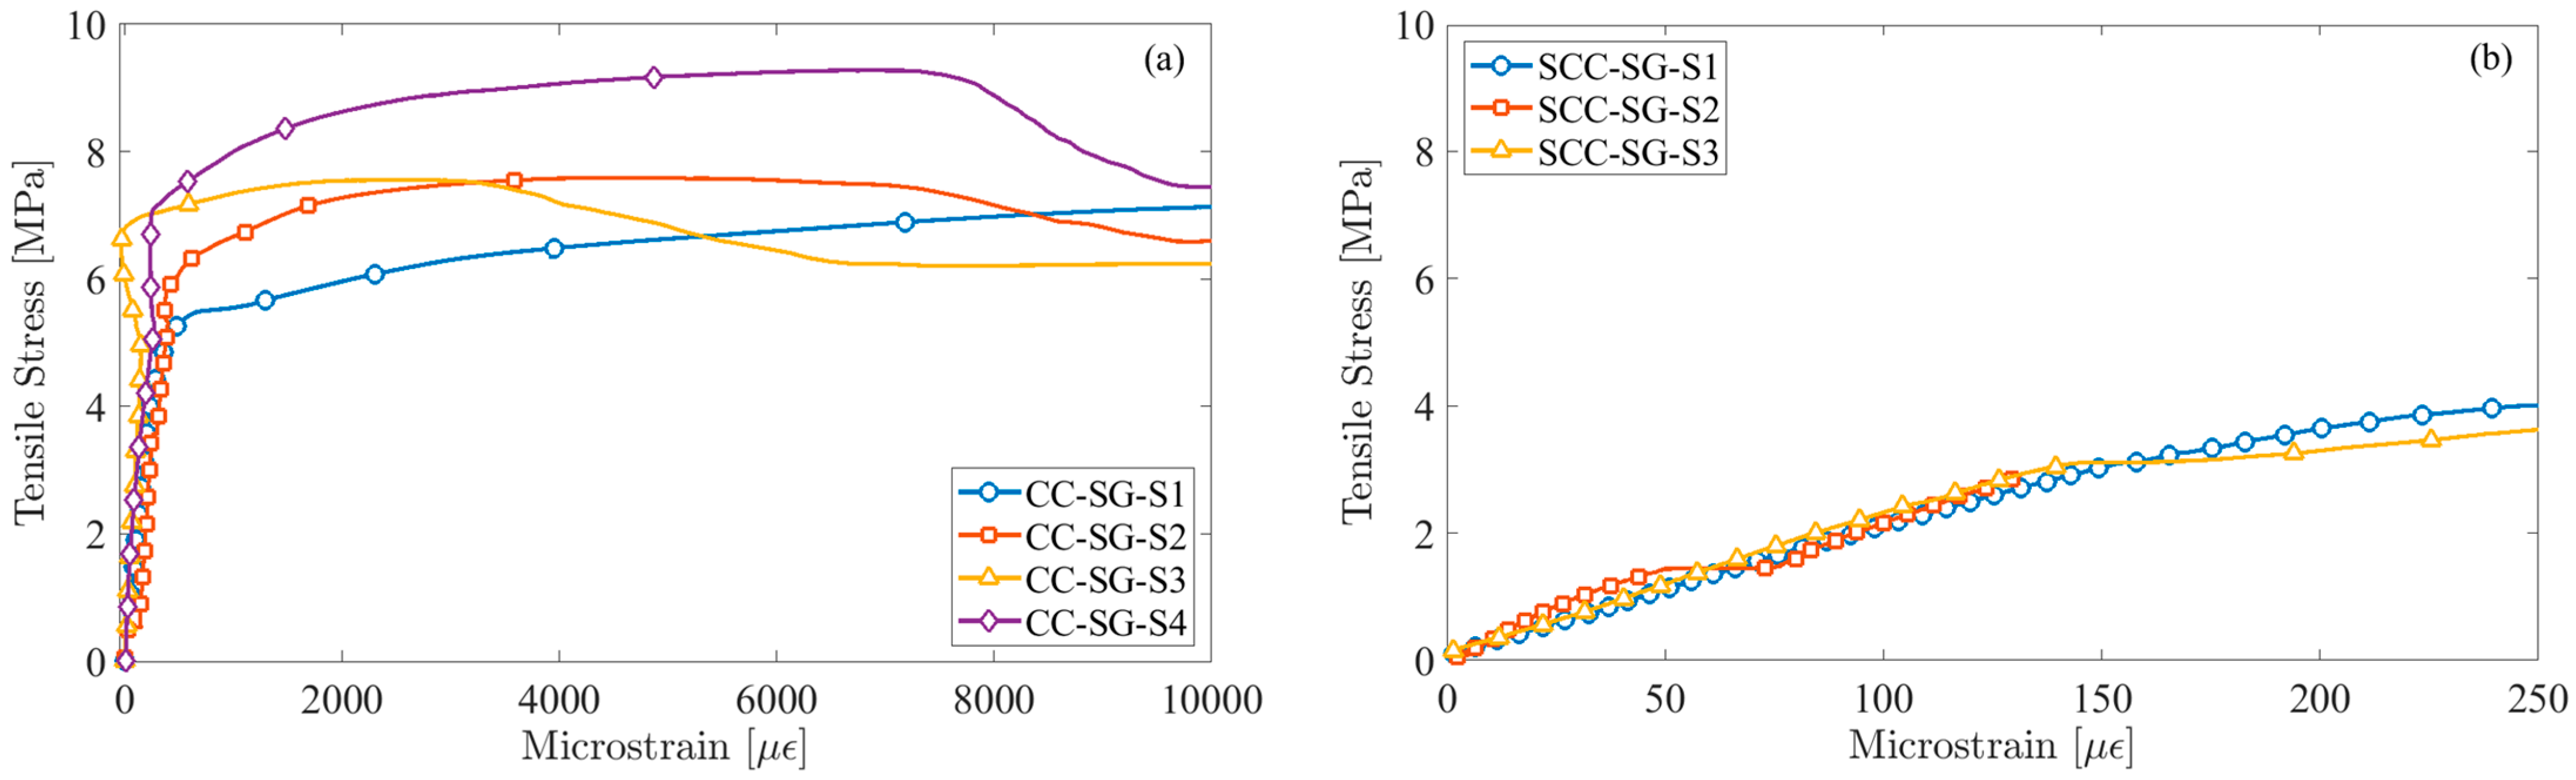
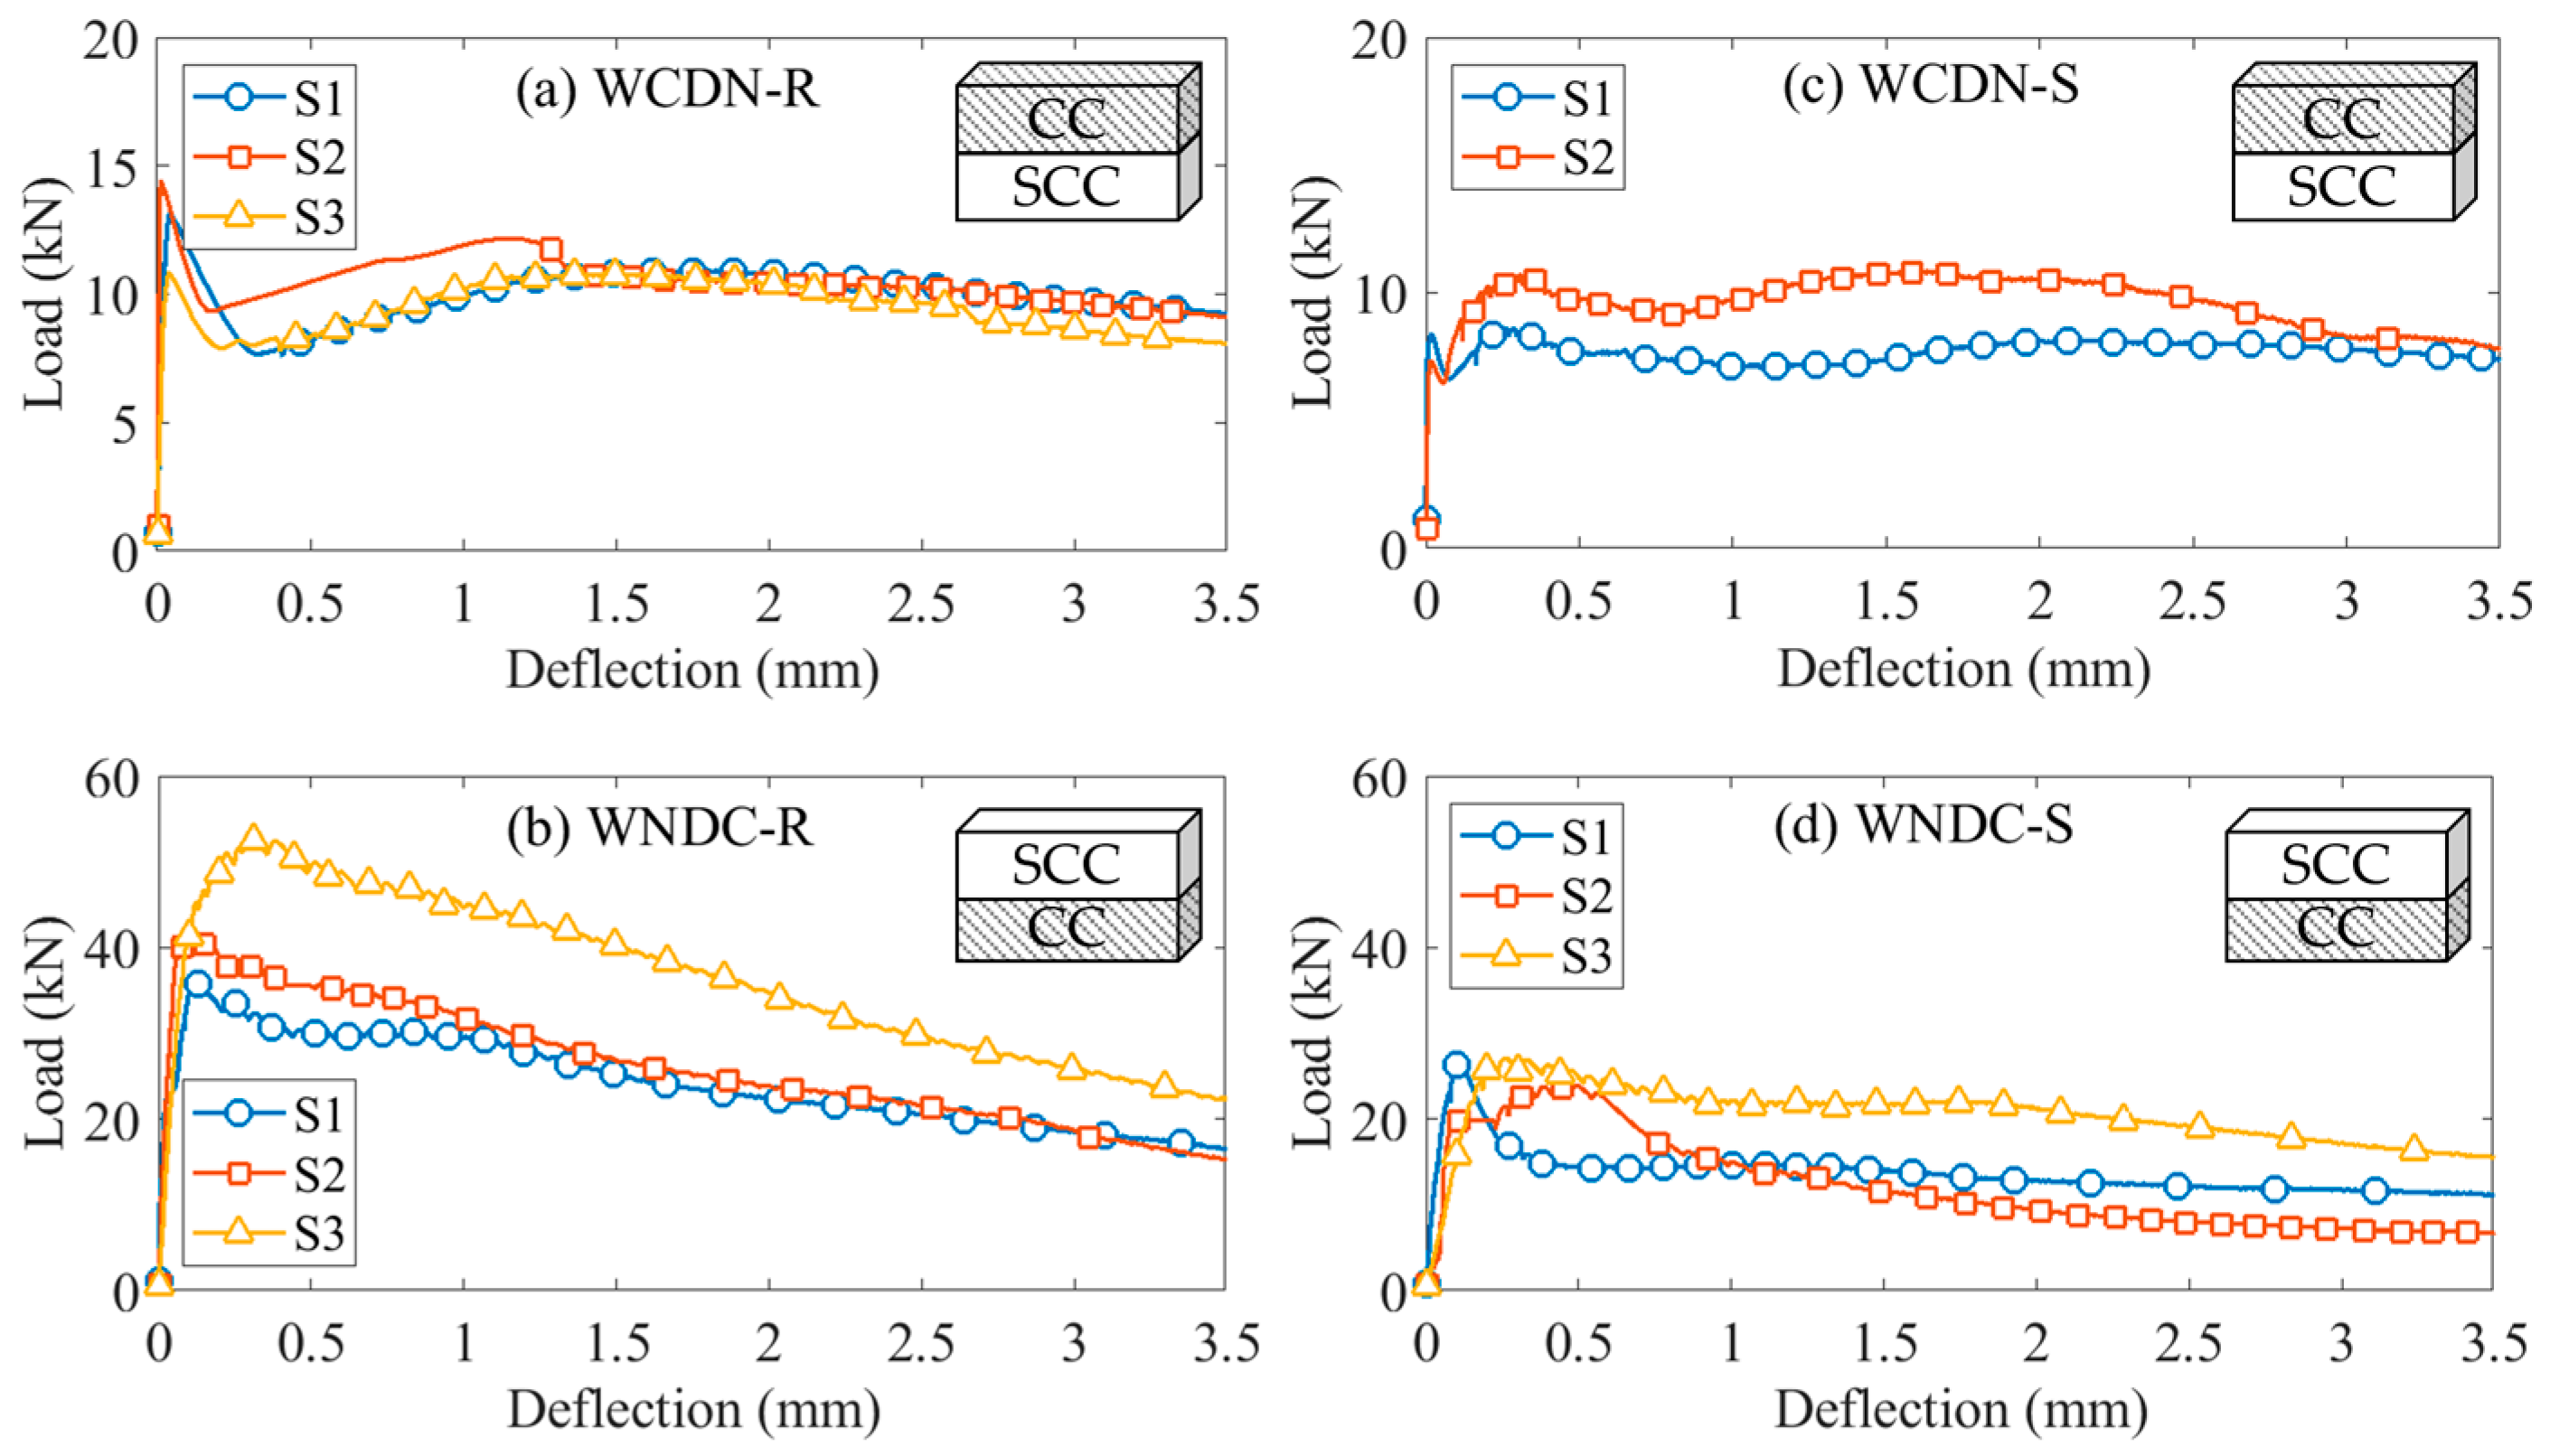
4.4. Concrete-to-Concrete Bond Strength in Flexure Strength Test

The surface preparation and testing direction affected the samples’ flexural strengths. The smooth surface interface failed before and/or during testing, while the rough surface interface exhibited a monolithic failure. Additionally, the surface preparation affected the flexural strength, as well as the residual capacity. Figure 7 provides a visual summary of the peak and residual load of all composite and CC control samples. WNDC-R’s flexural strength was 13.1 MPa, but, by shifting to a smooth surface preparation, the strength dropped to 7.8 MPa, as shown by WNDC-S in Table 1. Moreover, the residual capacity decreased, as shown in Table 2. The composite samples’ testing direction clearly affected the results. Positioning the CC in the tensile region increased the flexural capacity, as shown in Table 2.
In addition, the residual capacity was affected by the layer positioning and the type of surface preparation used, as shown in Table 2. As expected, the maximum residual capacity was achieved by conductive concrete, followed by the composites of conductive concrete placed in the tensile region. It is important to note that the samples’ labels include the testing direction, which is like the casting direction, as WNWC means wet normal concrete cast on a wet conductive concrete substrate. Similarly, WCDN-R means a wet conductive concrete layer cast on a dry rough surface normal concrete substrate.

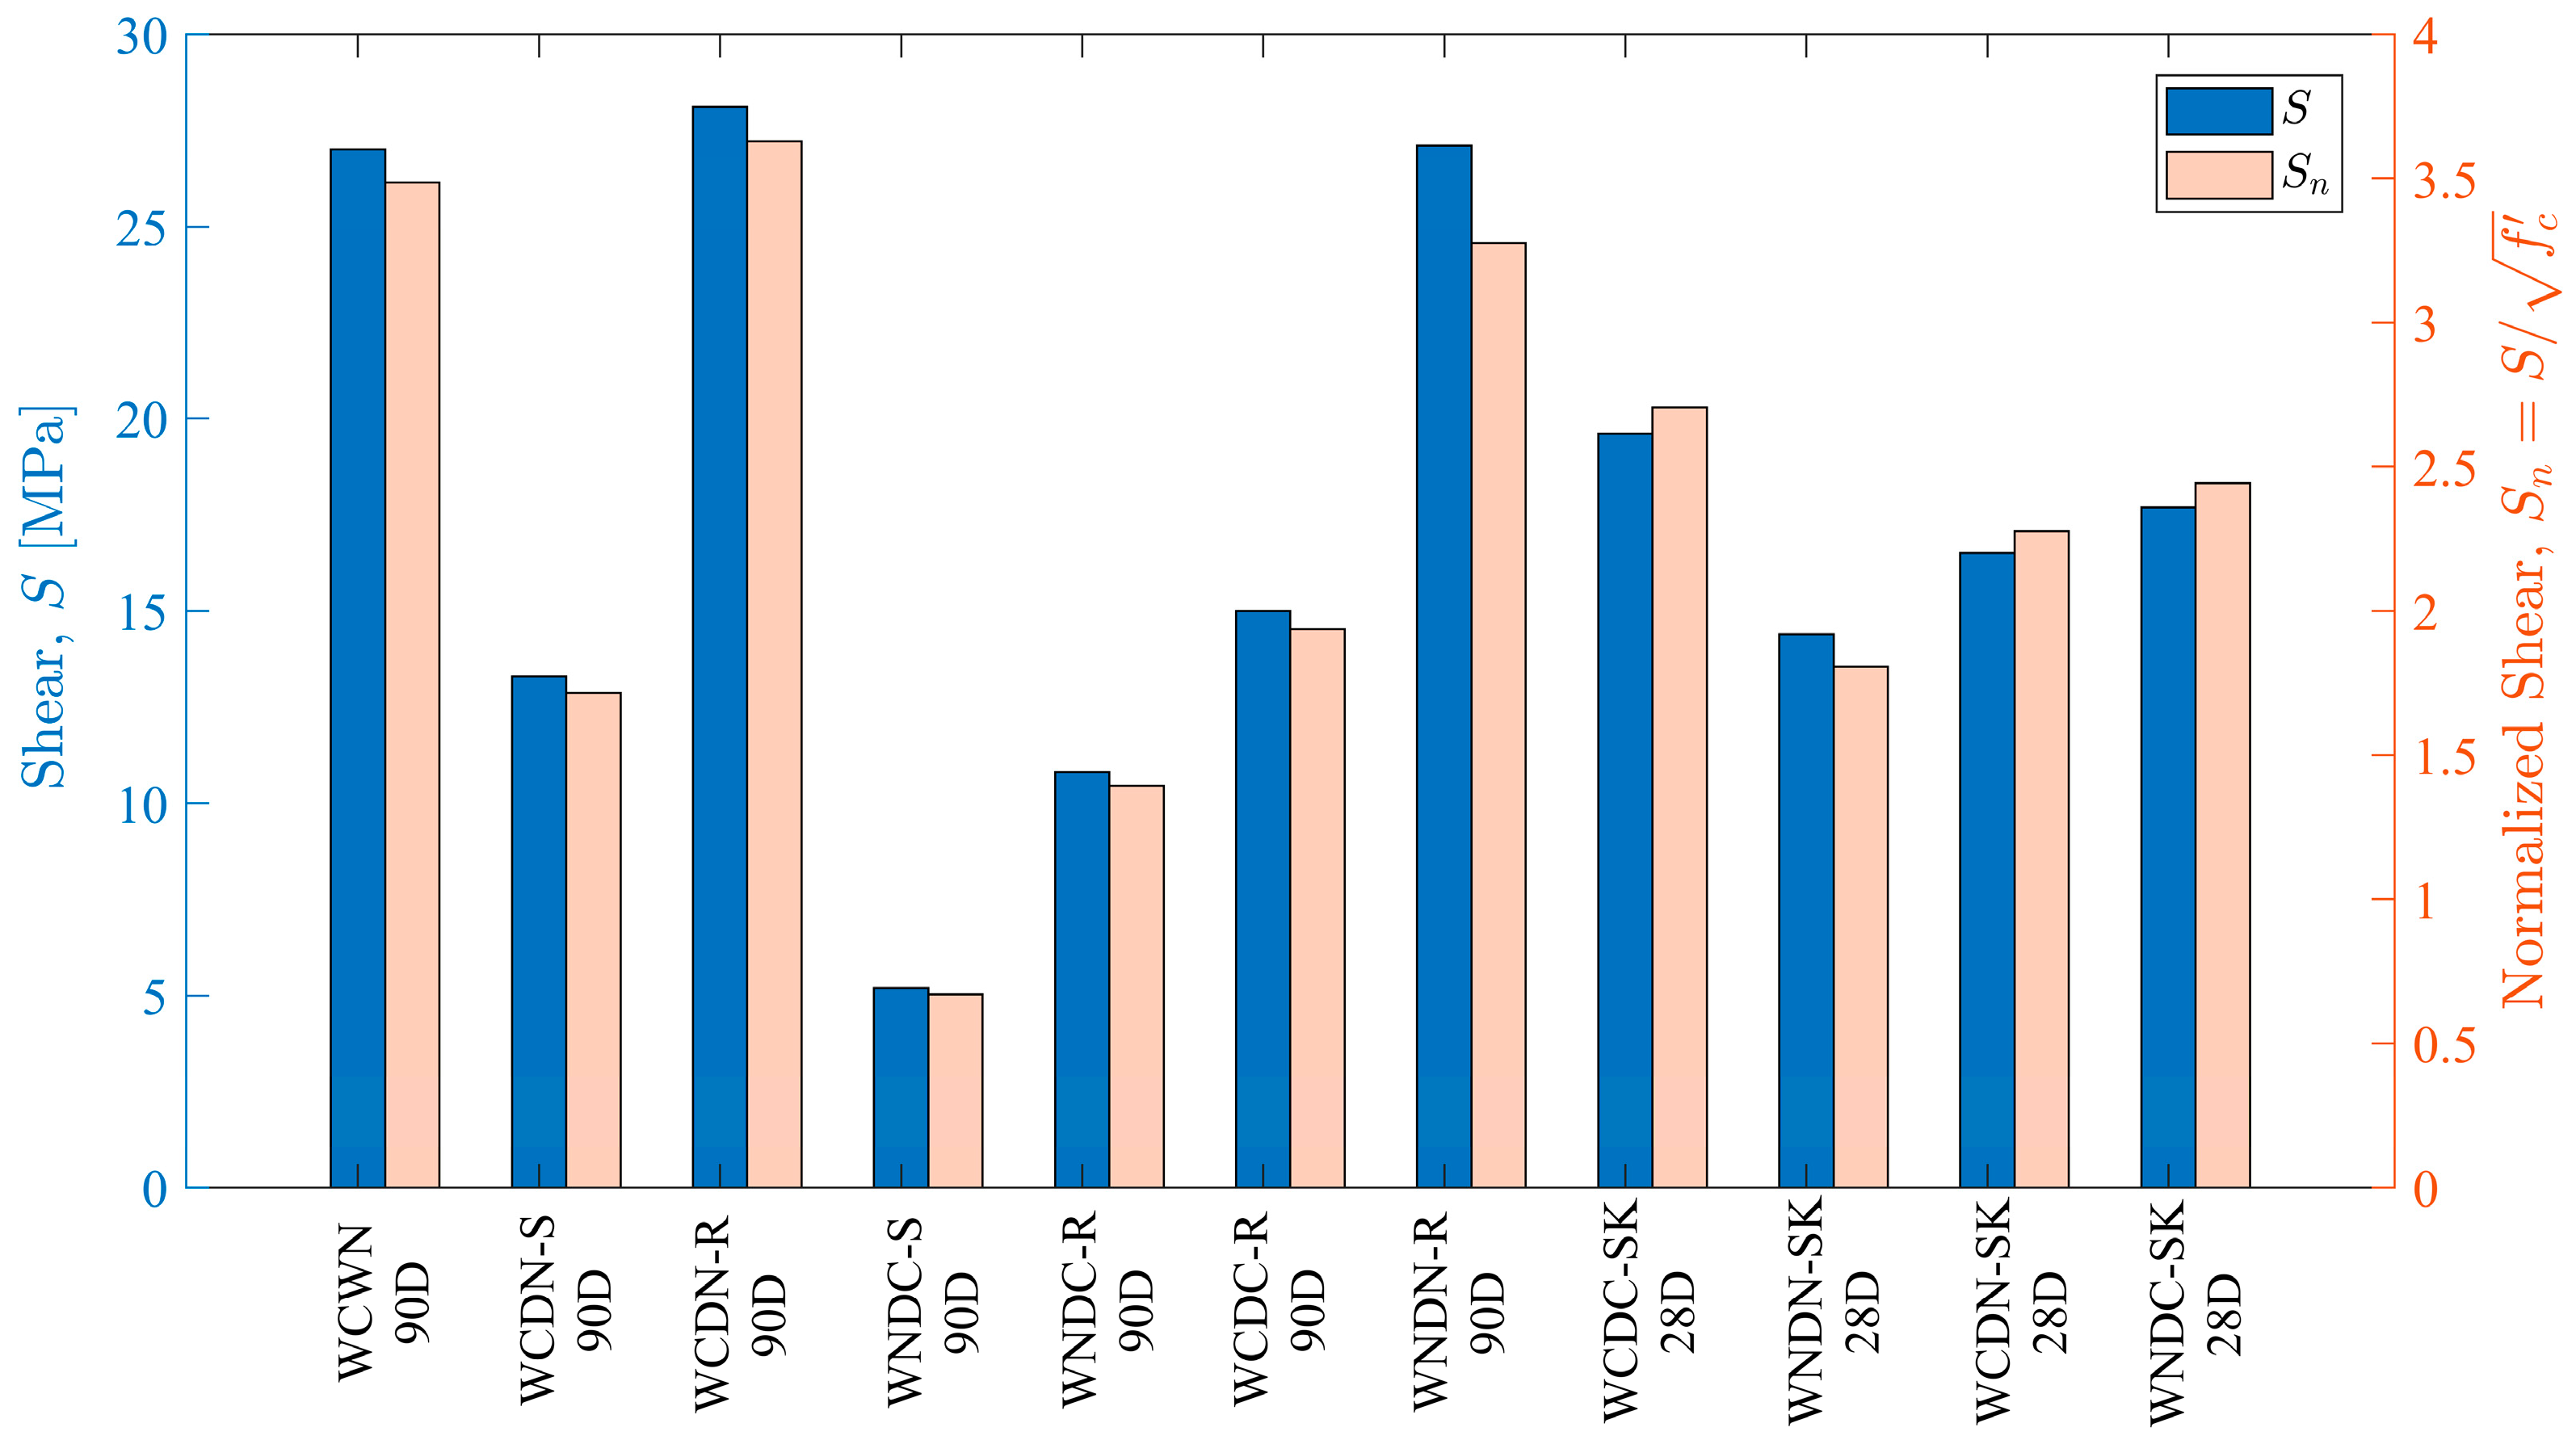
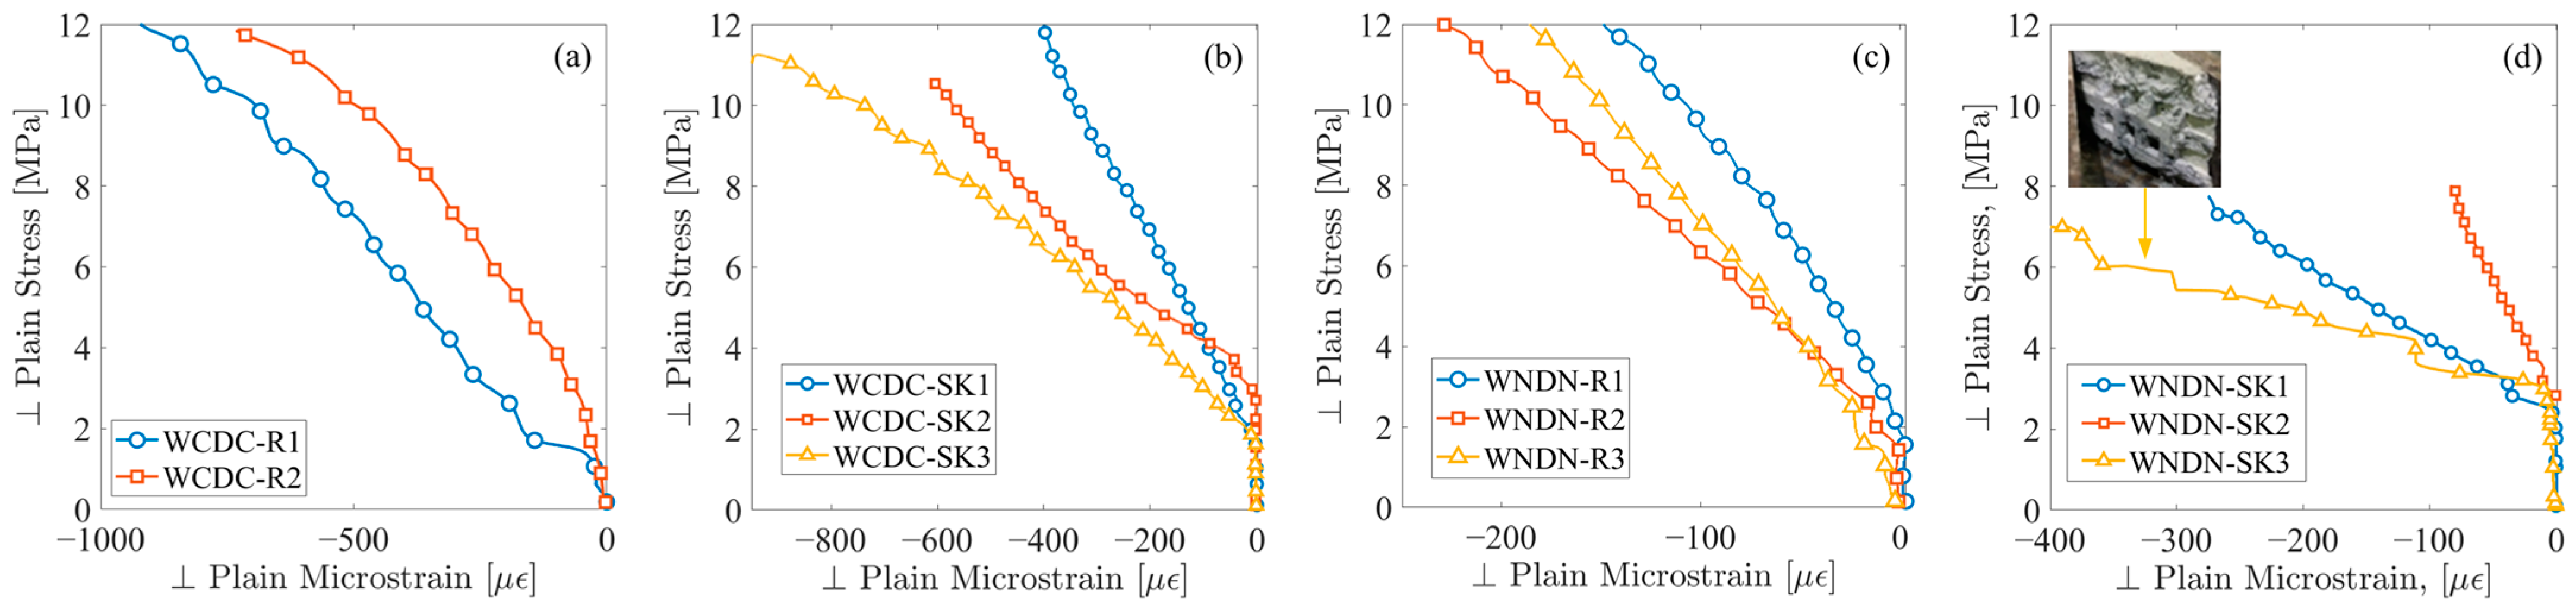
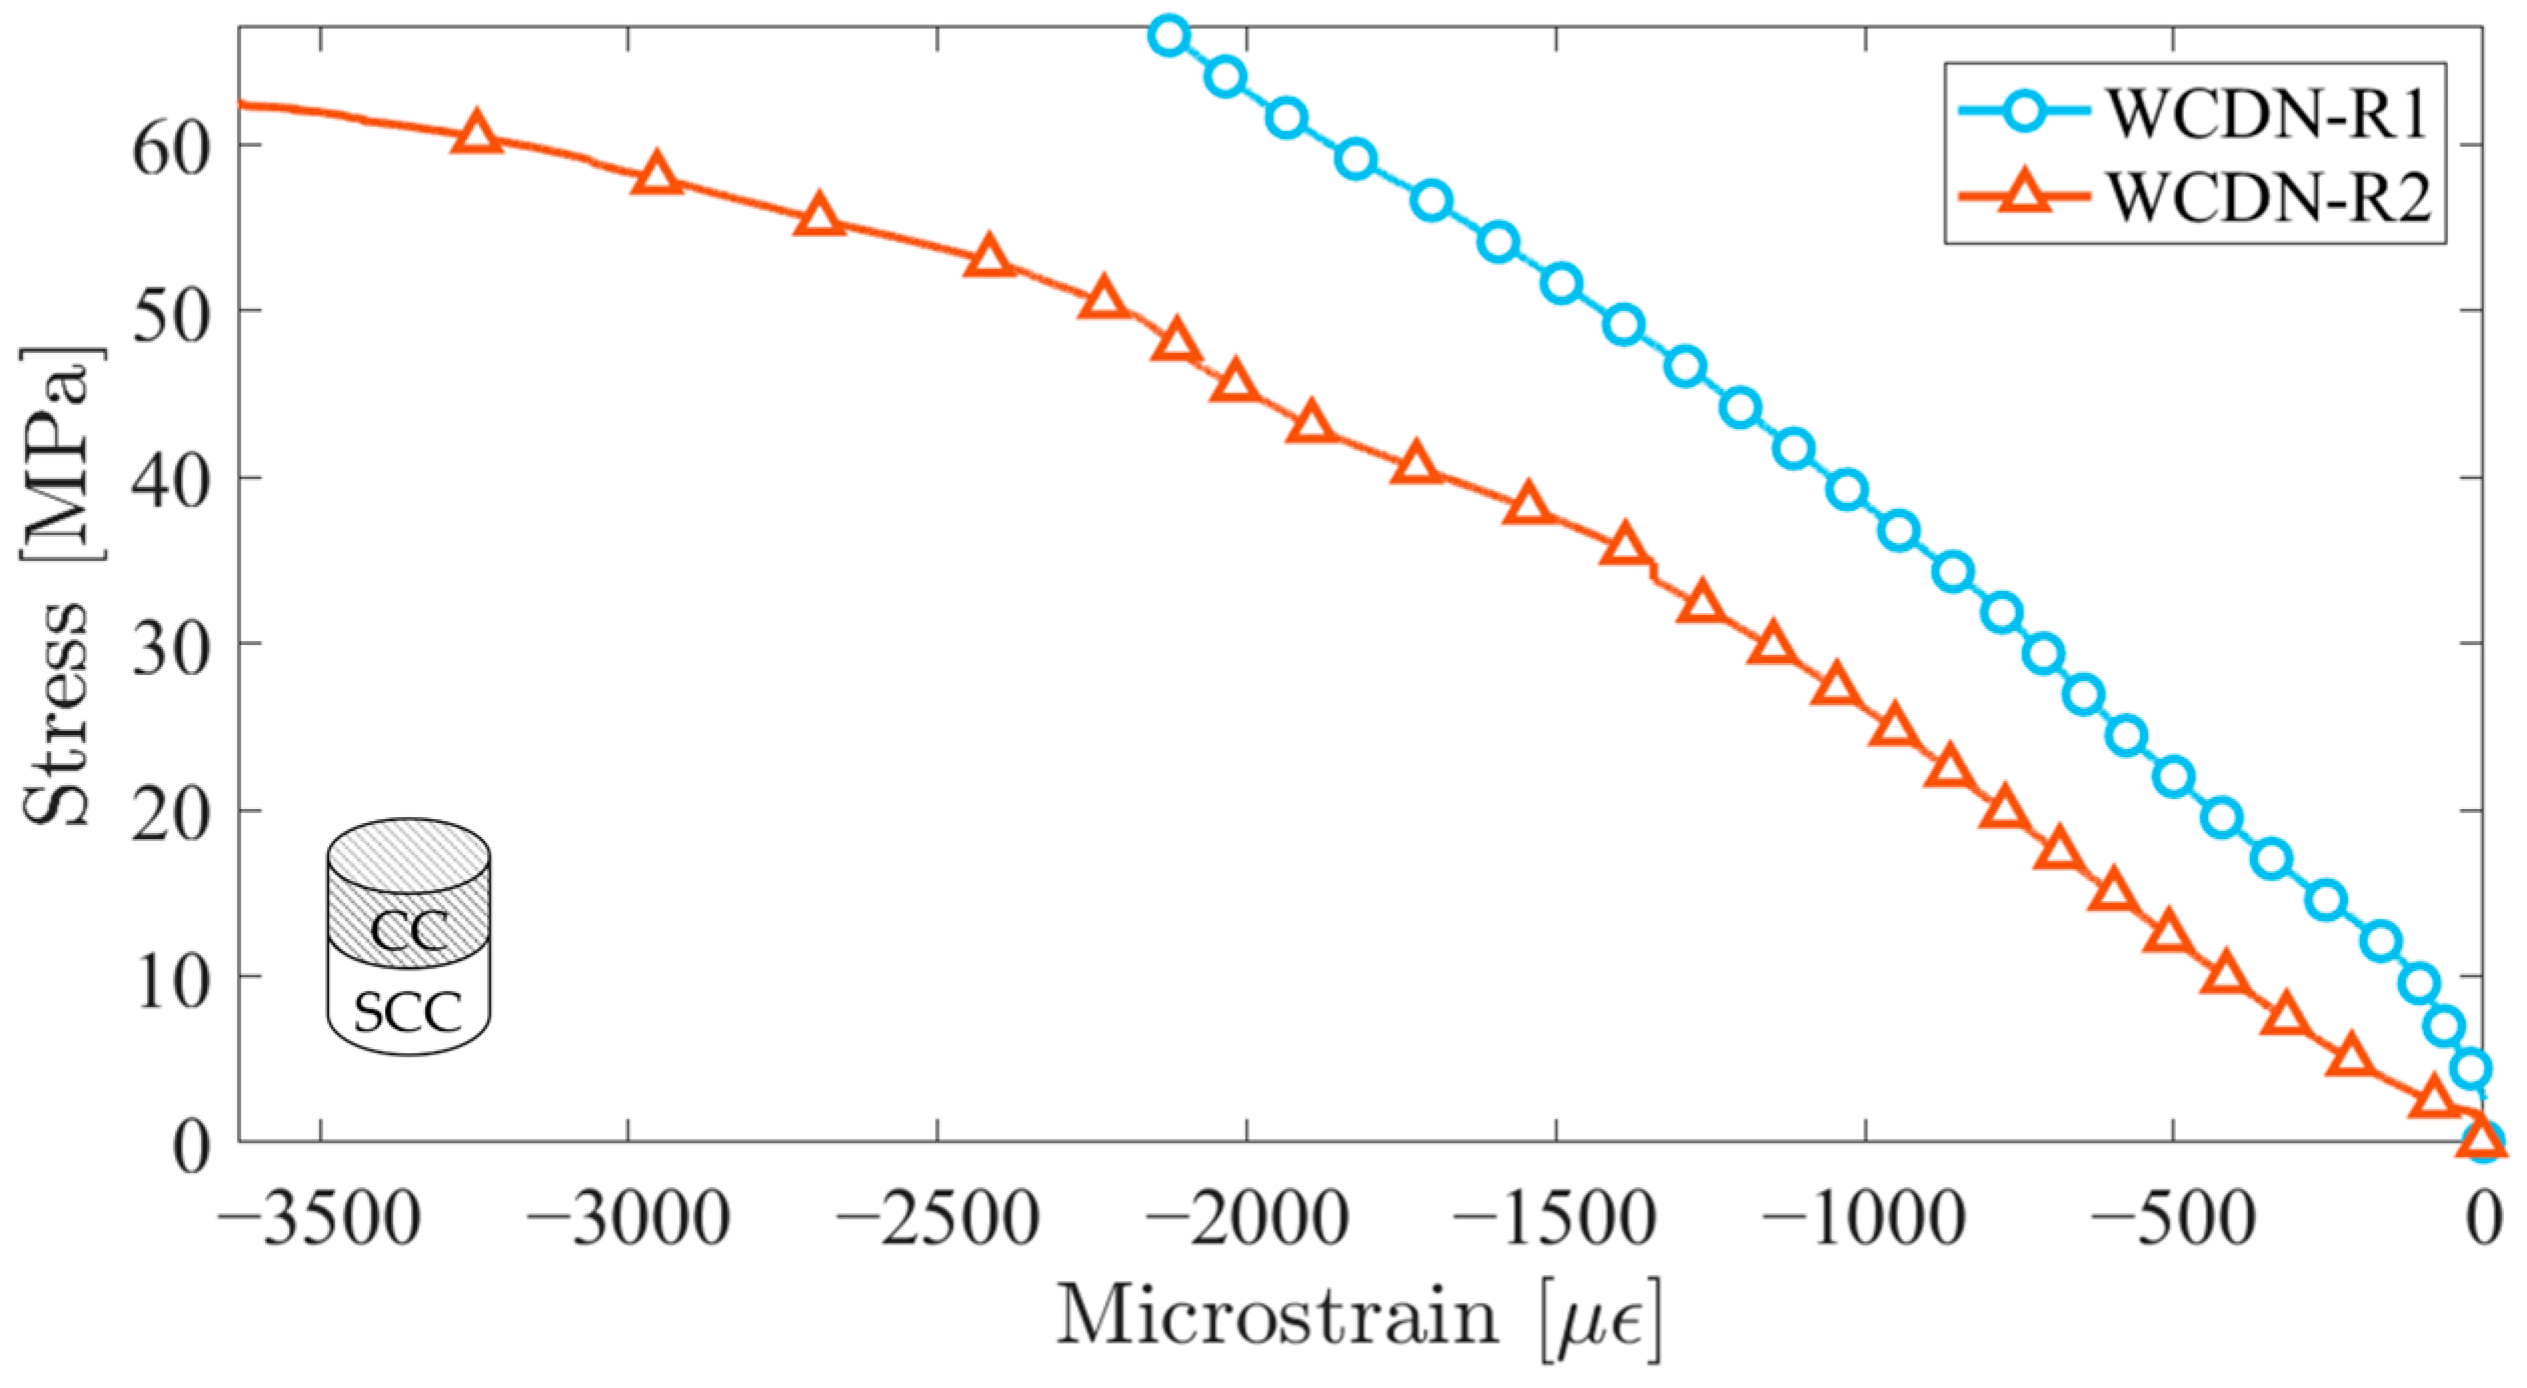
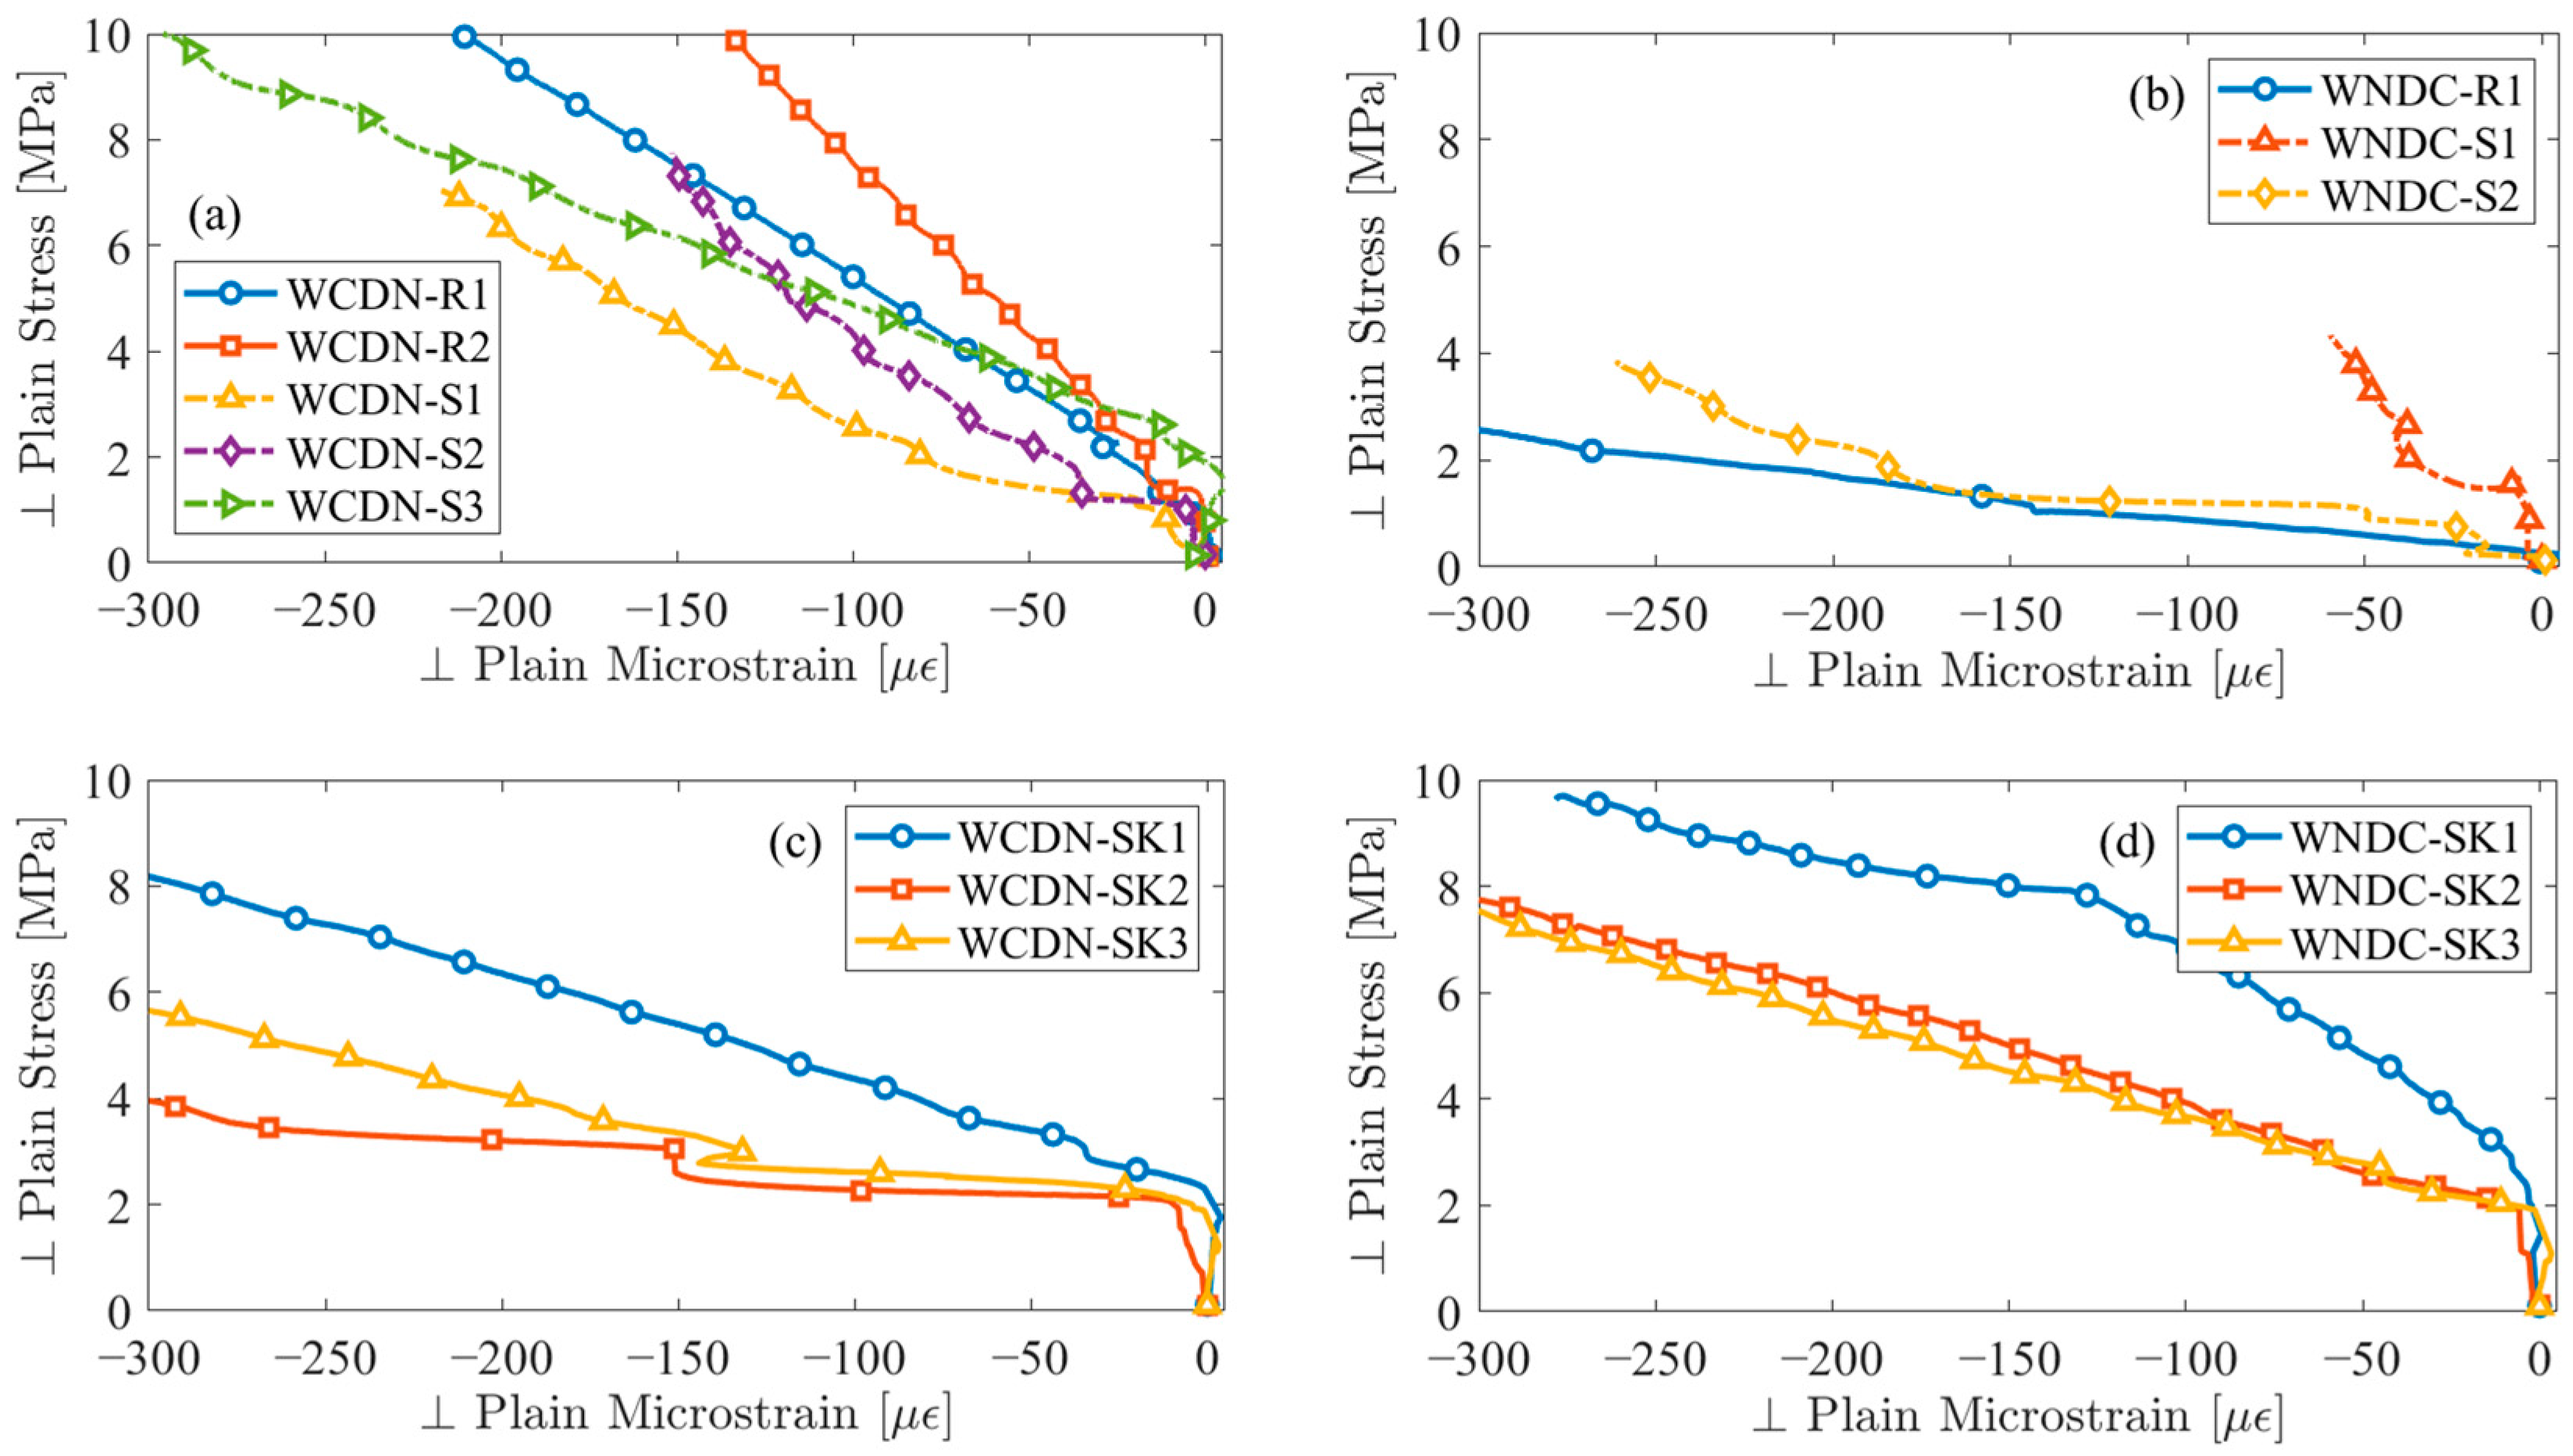
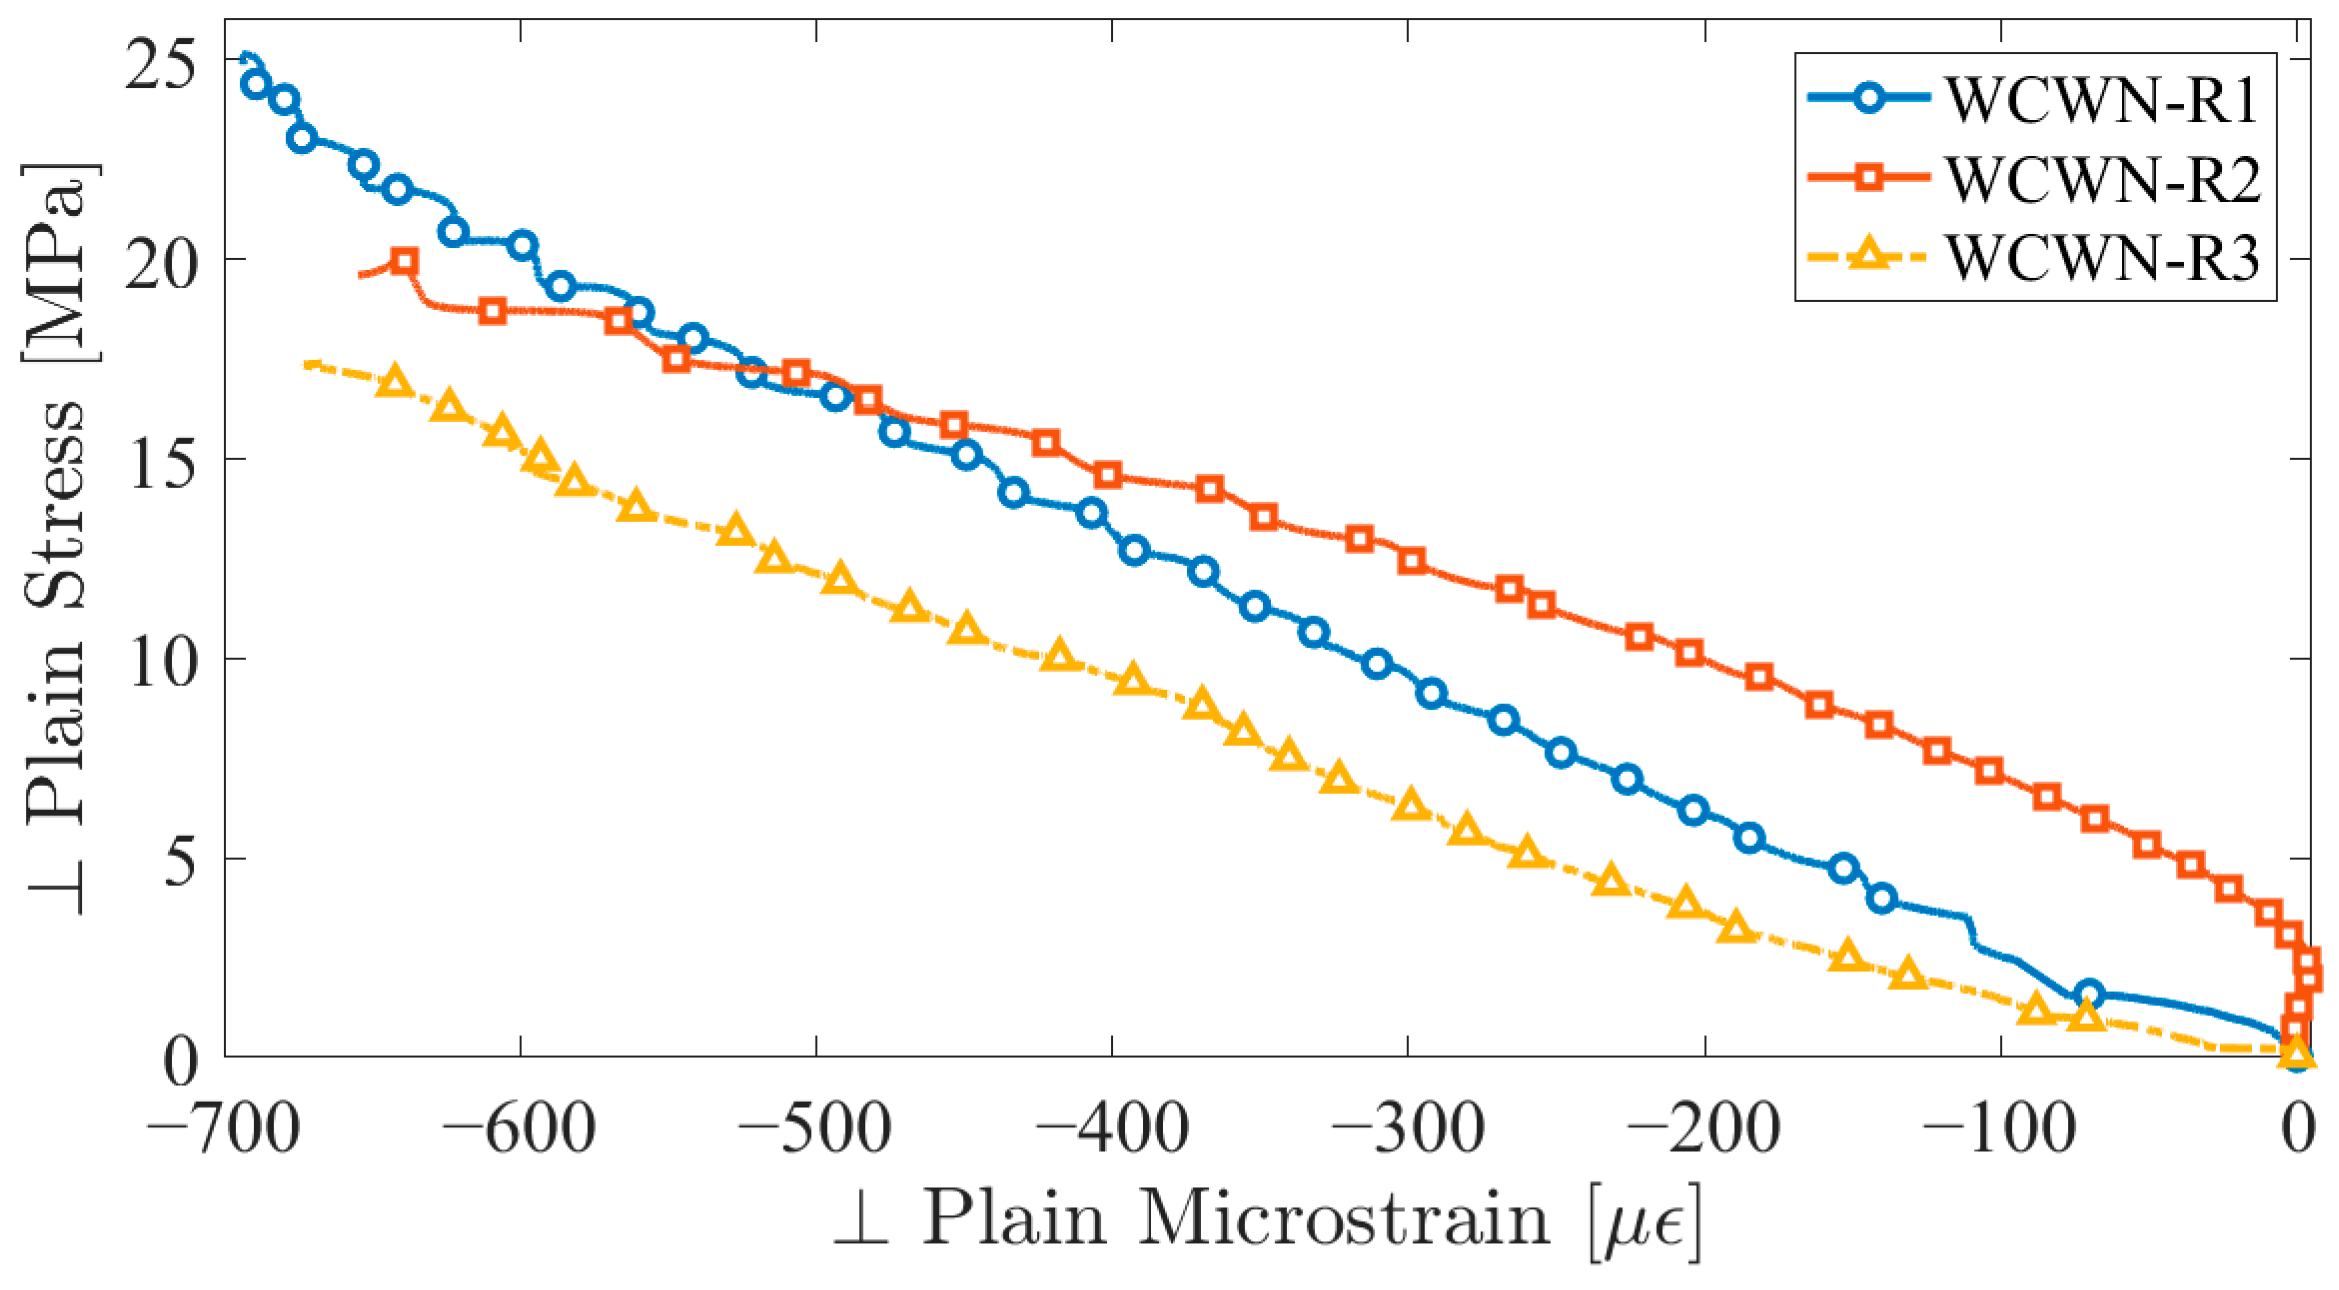
4.5. Concrete-to-Concrete Bond Strength in Slant Shear Test

The slant shear test was performed exclusively to examine the bond strength. To properly understand the measurements, a control group was created. The concept of the control group was to measure the bond performance of the surface preparation without material variation. This was achieved by roughening the concrete surface and placing the same concrete type above it; thus, material variation was eliminated, and the only variable present was the surface preparation. The study found that the smooth surface preparation was not acceptable since it led to the weakest bond strength in all sample configurations. However, the rough surface preparation provided a bond strength of 27.1 MPa in WNDN-R and 15 MPa in WCDC-R, as shown in Table 1. It is important to note that both surface preparations were performed at a bond interface angle of 35° with respect to the vertical axis. Moreover, the shear key surface preparation was expected to increase the bond strength; therefore, the samples’ bond interface angle was 30° with respect to vertical axis. The SK surface preparation had a different outcome, where the CC control outperformed the SCC control. The shear bond strength of WCDC-SK was 19.6 MPa, which was higher than WNDN-SK’s shear bond strength of 14.4 MPa. A similar strength performance was observed with the variation of the material. When the rough surface preparation was performed on dry SCC, it outperformed the bond strength of the dry CC surface preparation because of the difficulty in roughening concrete with a high fiber content. However, with the SK surface preparation, the CC outperformed the SCC, as shown in Table 1; the results of the SK samples are within the acceptable bond strength range of a 30° slant shear sample at 28 days, being between 14 MPa and 21 MPa [29].

4.6. Failure Modes

It was observed that the general failure of the SCC samples was brittle, which represented a sudden energy release. The CC’s failure mode was different such that its failure was ductile and considerably slower than that of the SCC samples. The surface preparation affected the bond failure in all tests. Additionally, the casting and testing direction effect was clearly observed in the flexural strength test. A detailed explanation of the failure modes in each test is presented in the following subsections.

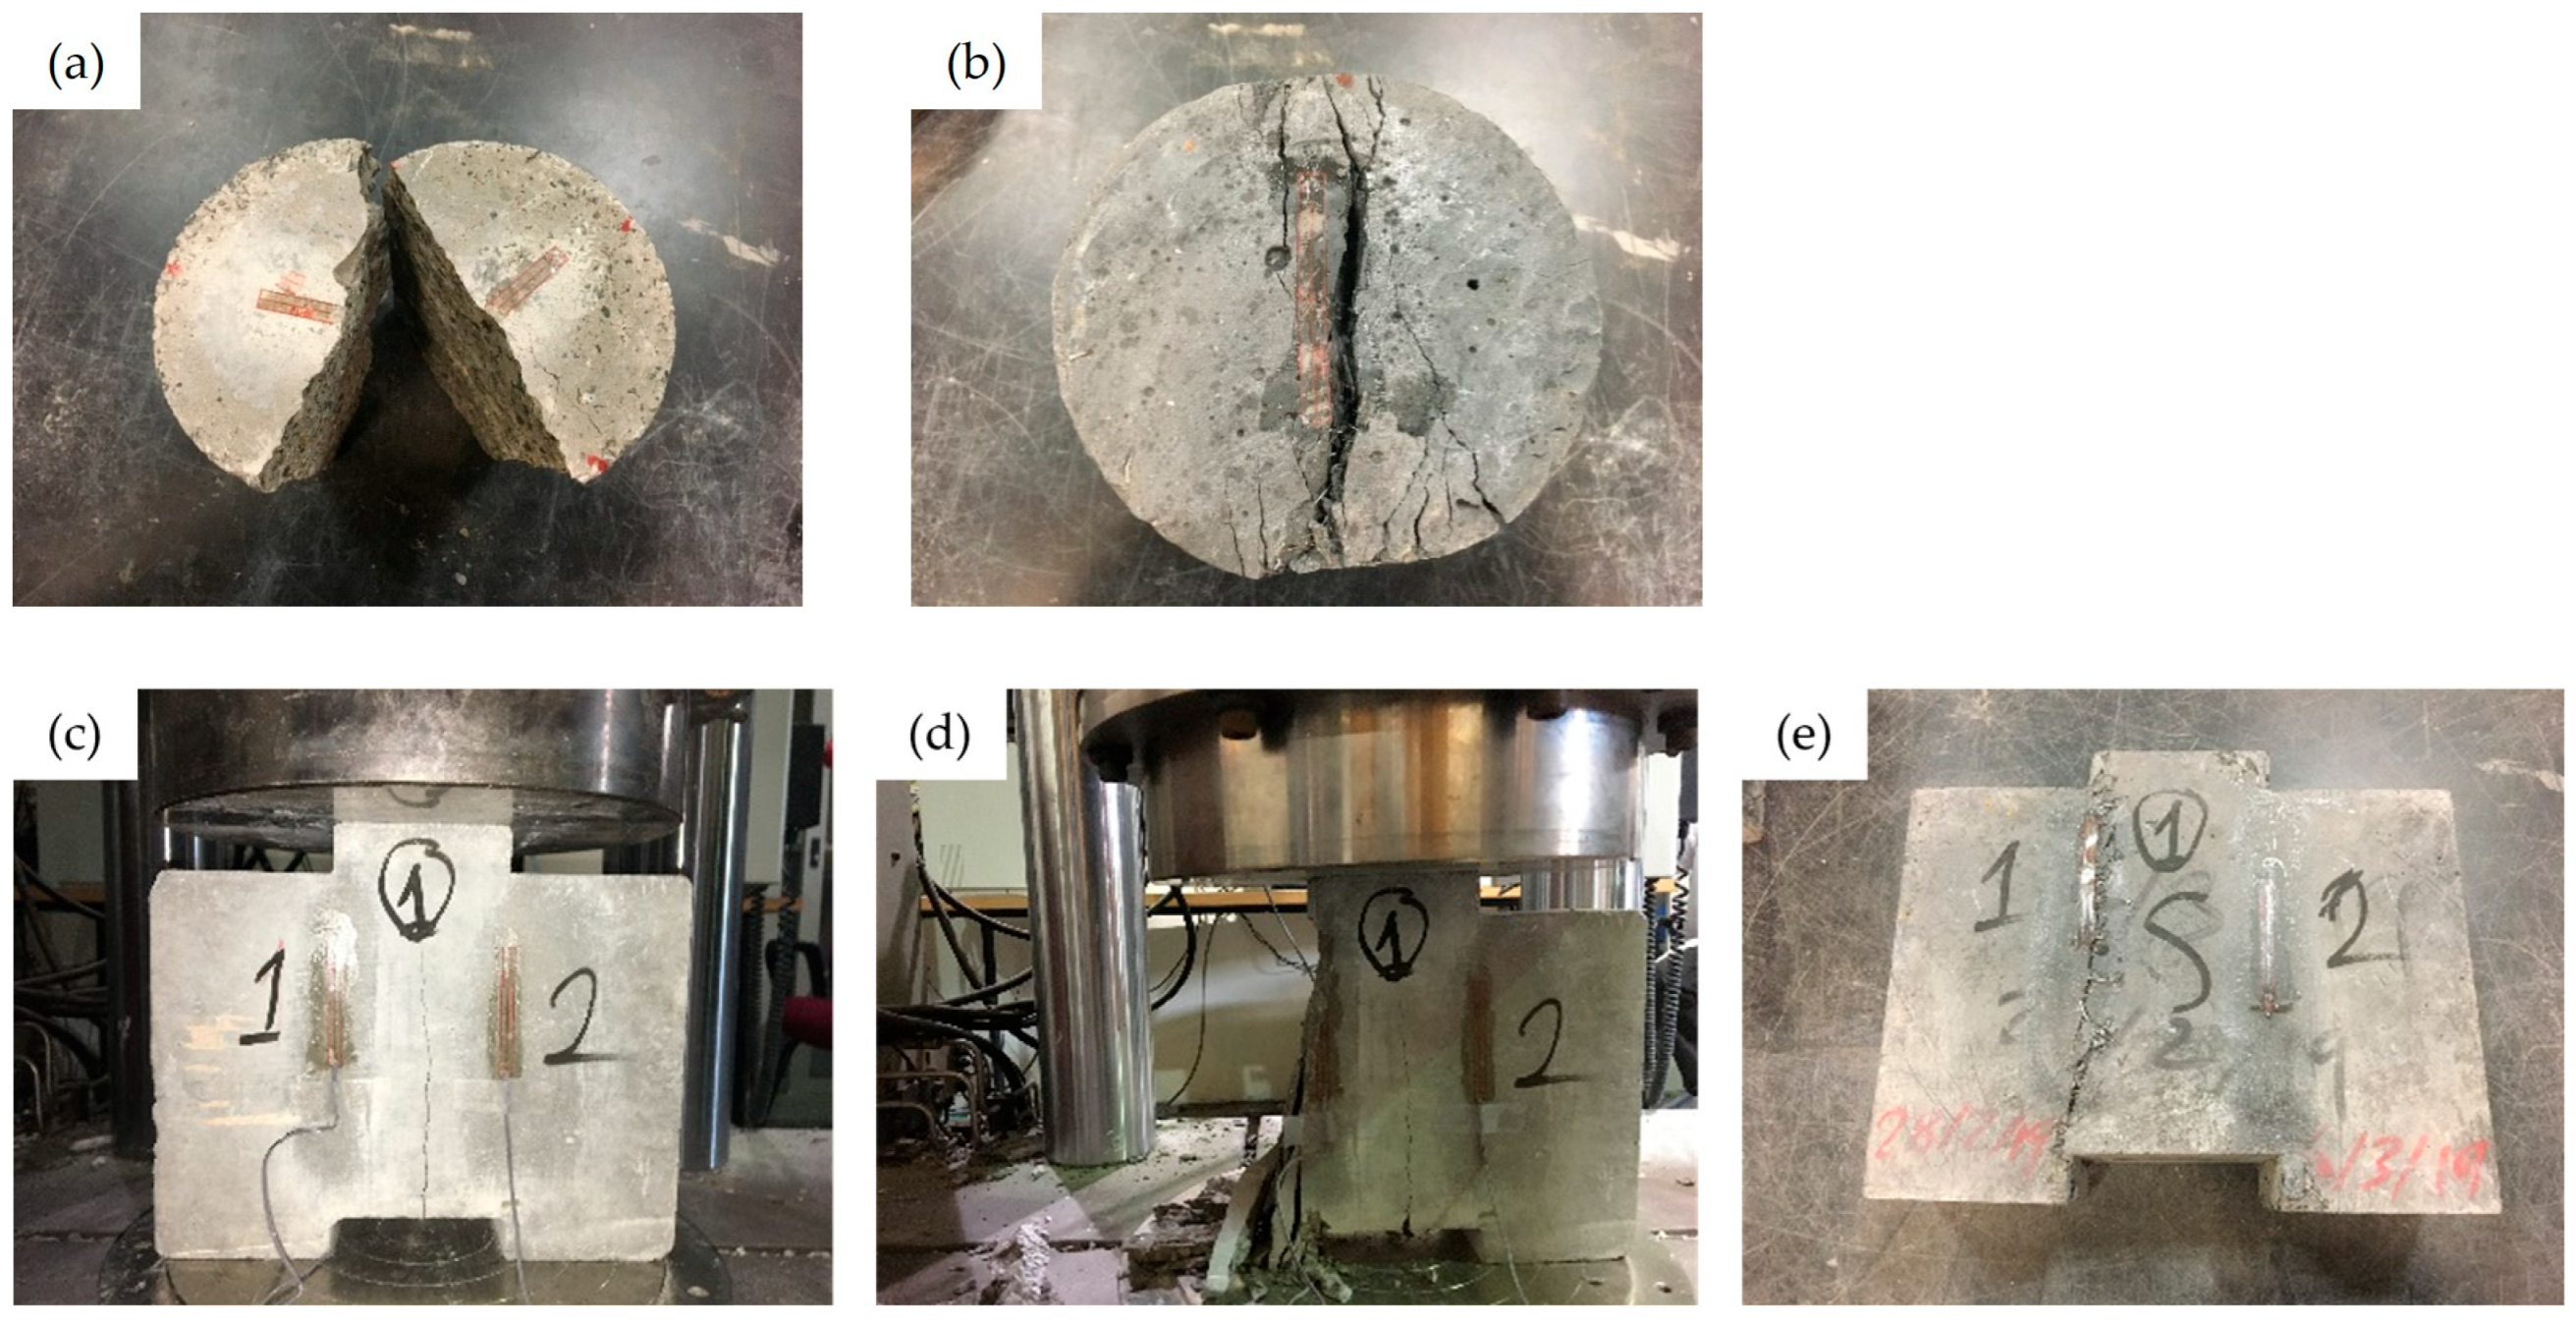
4.6.1. Compression and MOE Failure Modes

The CC’s failure was ductile when compared to the normal concrete’s brittle failure. The concrete-to-concrete samples produced a combination of either ductile failure, blast failure, or both, which represented the method of energy release in the composite sample, as shown in Figure 8. Combined ductile and brittle failures were observed in the wet-to-wet configuration. A sound failure was maintained with the failure of the conductive concrete layer, as shown in Figure 8c. A brittle failure was observed with the normal concrete’s energy release, as shown in Figure 8d. Moreover, a unique failure configuration was observed, where a layer failed with minimal damage to the second layer, as shown in WNDC-S. All the above failure modes were observed in all configurations through different samples. However, the smooth surface preparation was the only sample type to experience a complete bond split. Some of the smooth configuration cylinders split at the bonded region before and after testing, indicating that the bond was weak. Figure 8h shows a smooth-surface-treated sample where separation occurred after testing. Overall, all rough samples achieved monolithic failure, while most smooth surface samples achieved bond failure.

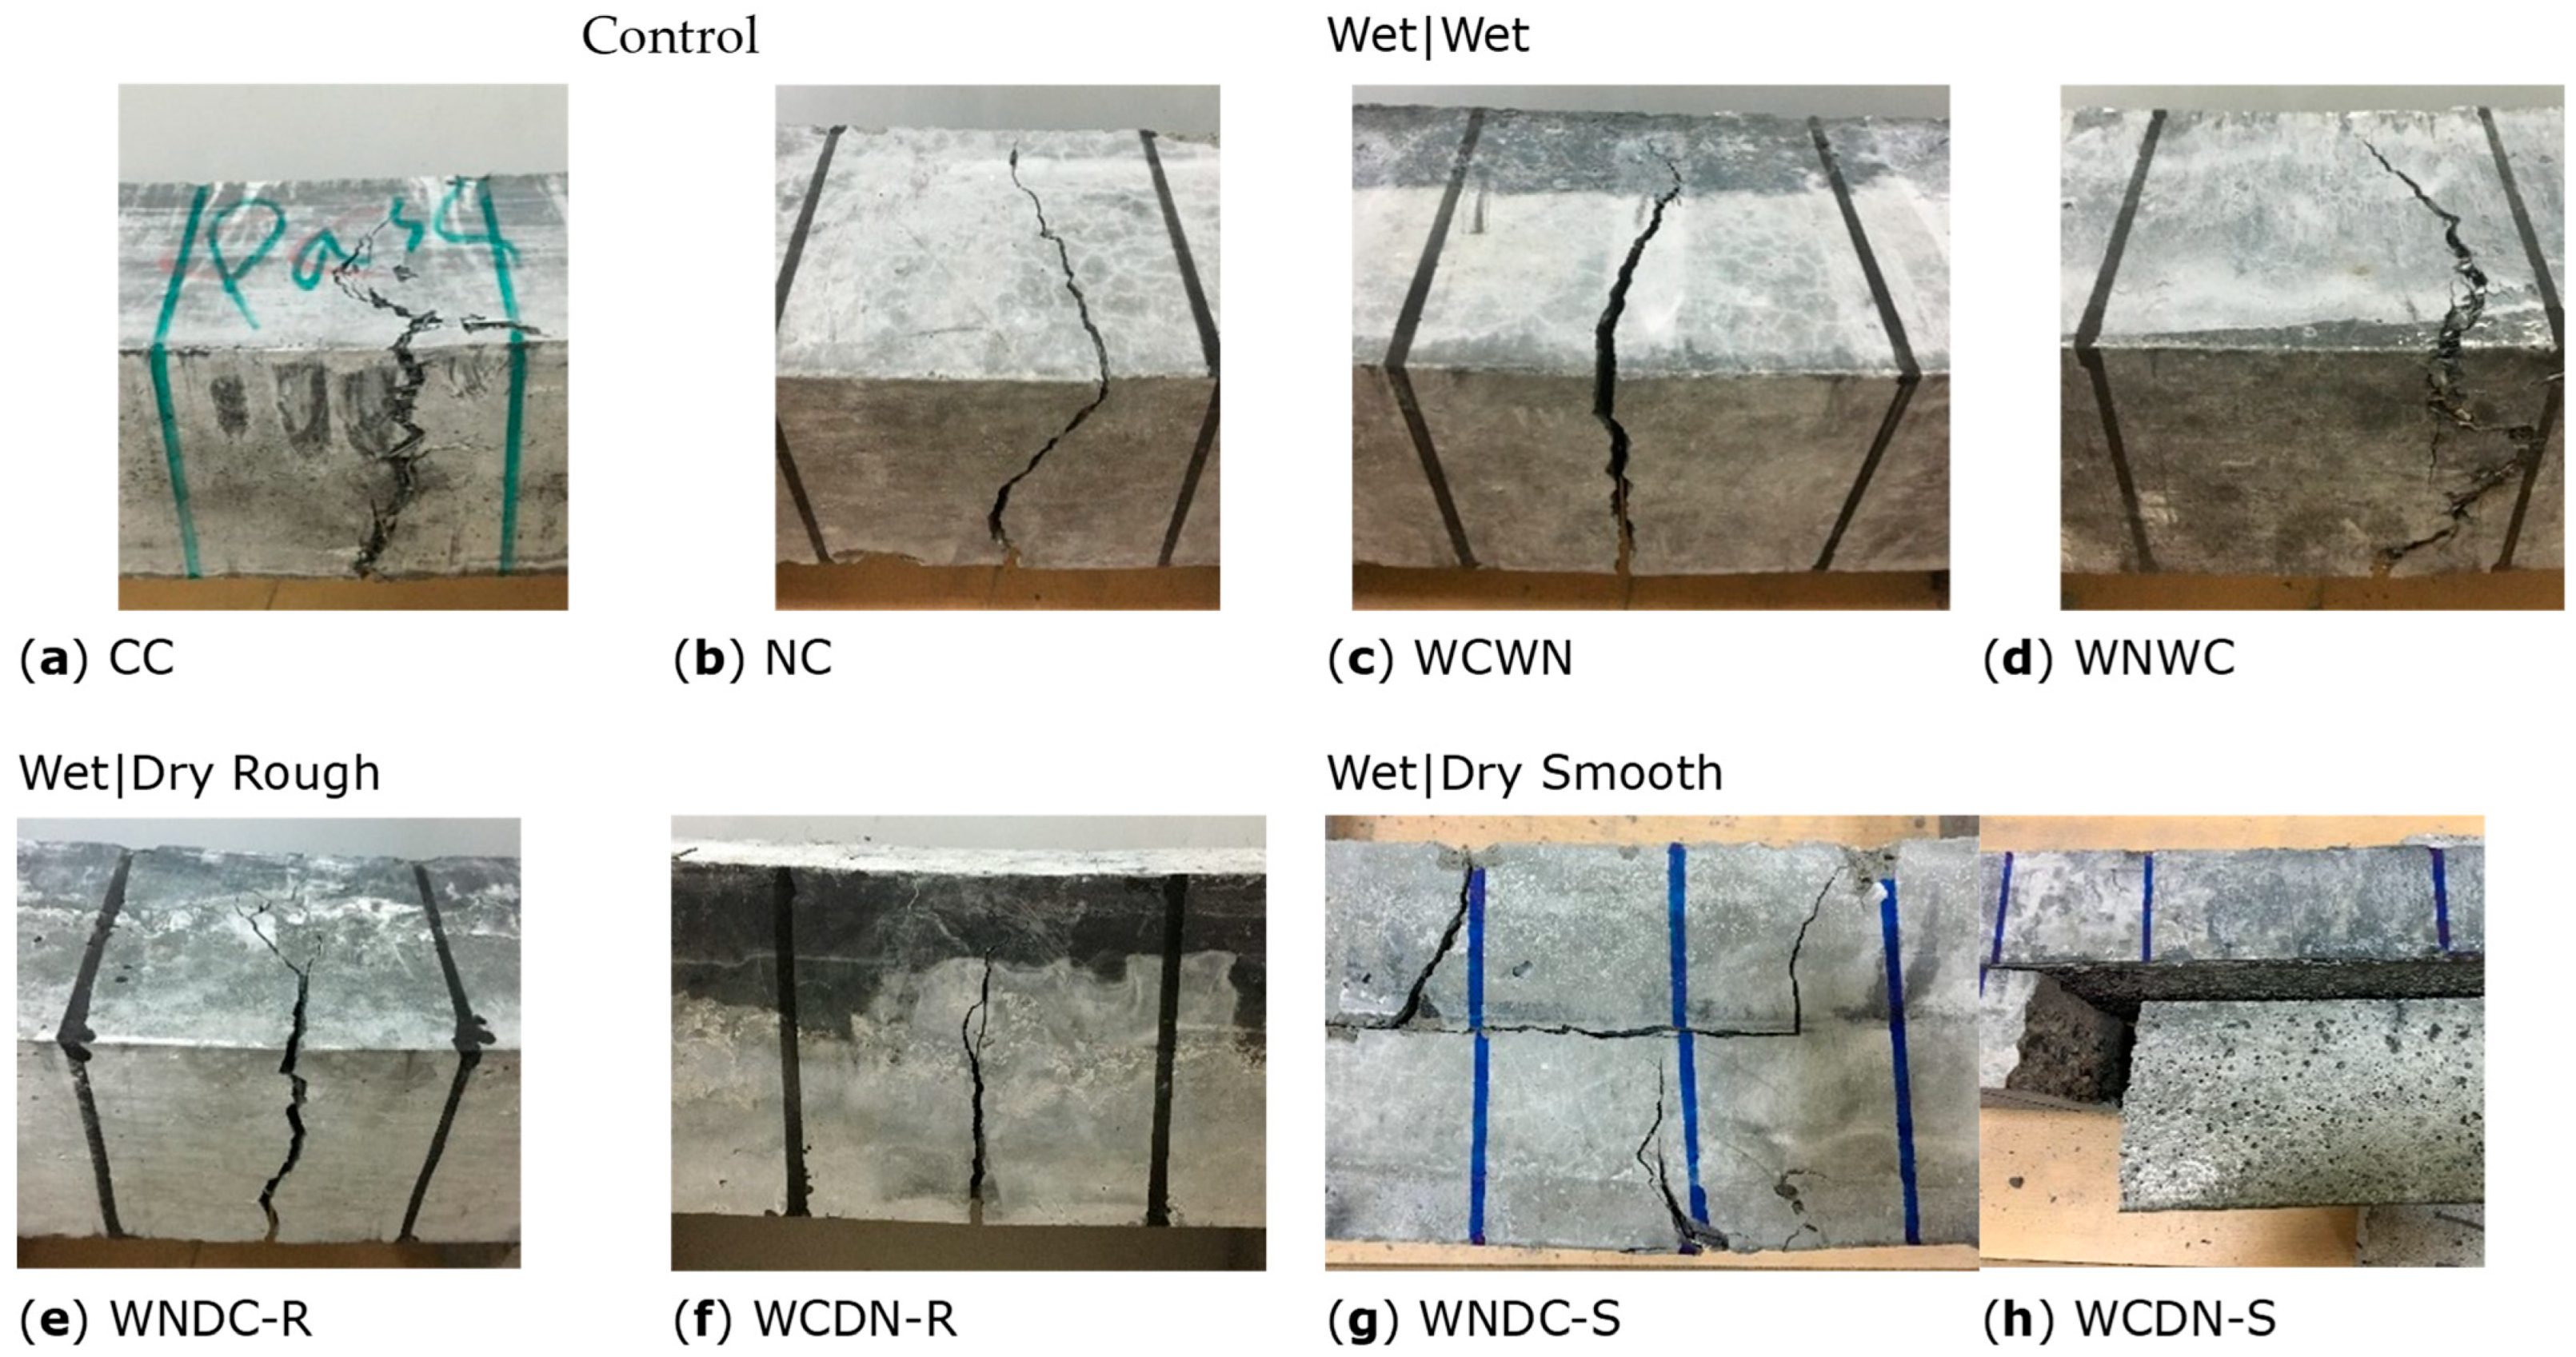
4.6.2. Flexural Failure Modes

The failure modes and crack development were normal, except for in some special cases. The cracks formed from the tensile region of the beam and spread to the compression region.
The cracks presented were all within the middle section, which had a length of L / 3 . It is important to note that the length, L , represents the distance between the supports, as described in ASTM-C78 [45] and ASTM-C1609 [44]. It was observed that the crack formations in the wet-to-wet and rough surface configurations were like those in the control samples, as shown in Figure 9. The cracks in the wet-to-wet and rough surface configurations did not spread through the bonding area, thus attaining a monolithic failure. Furthermore, the special cases shown in Figure 9g–h had cracks propagating through the bond interface of the smooth surface configuration. Thus, crack propagation at the bond interface gave an indication of a weak bond between layers. Therefore, a reduction in the flexural strength of the smooth surface configuration occurred, as shown in Table 1.

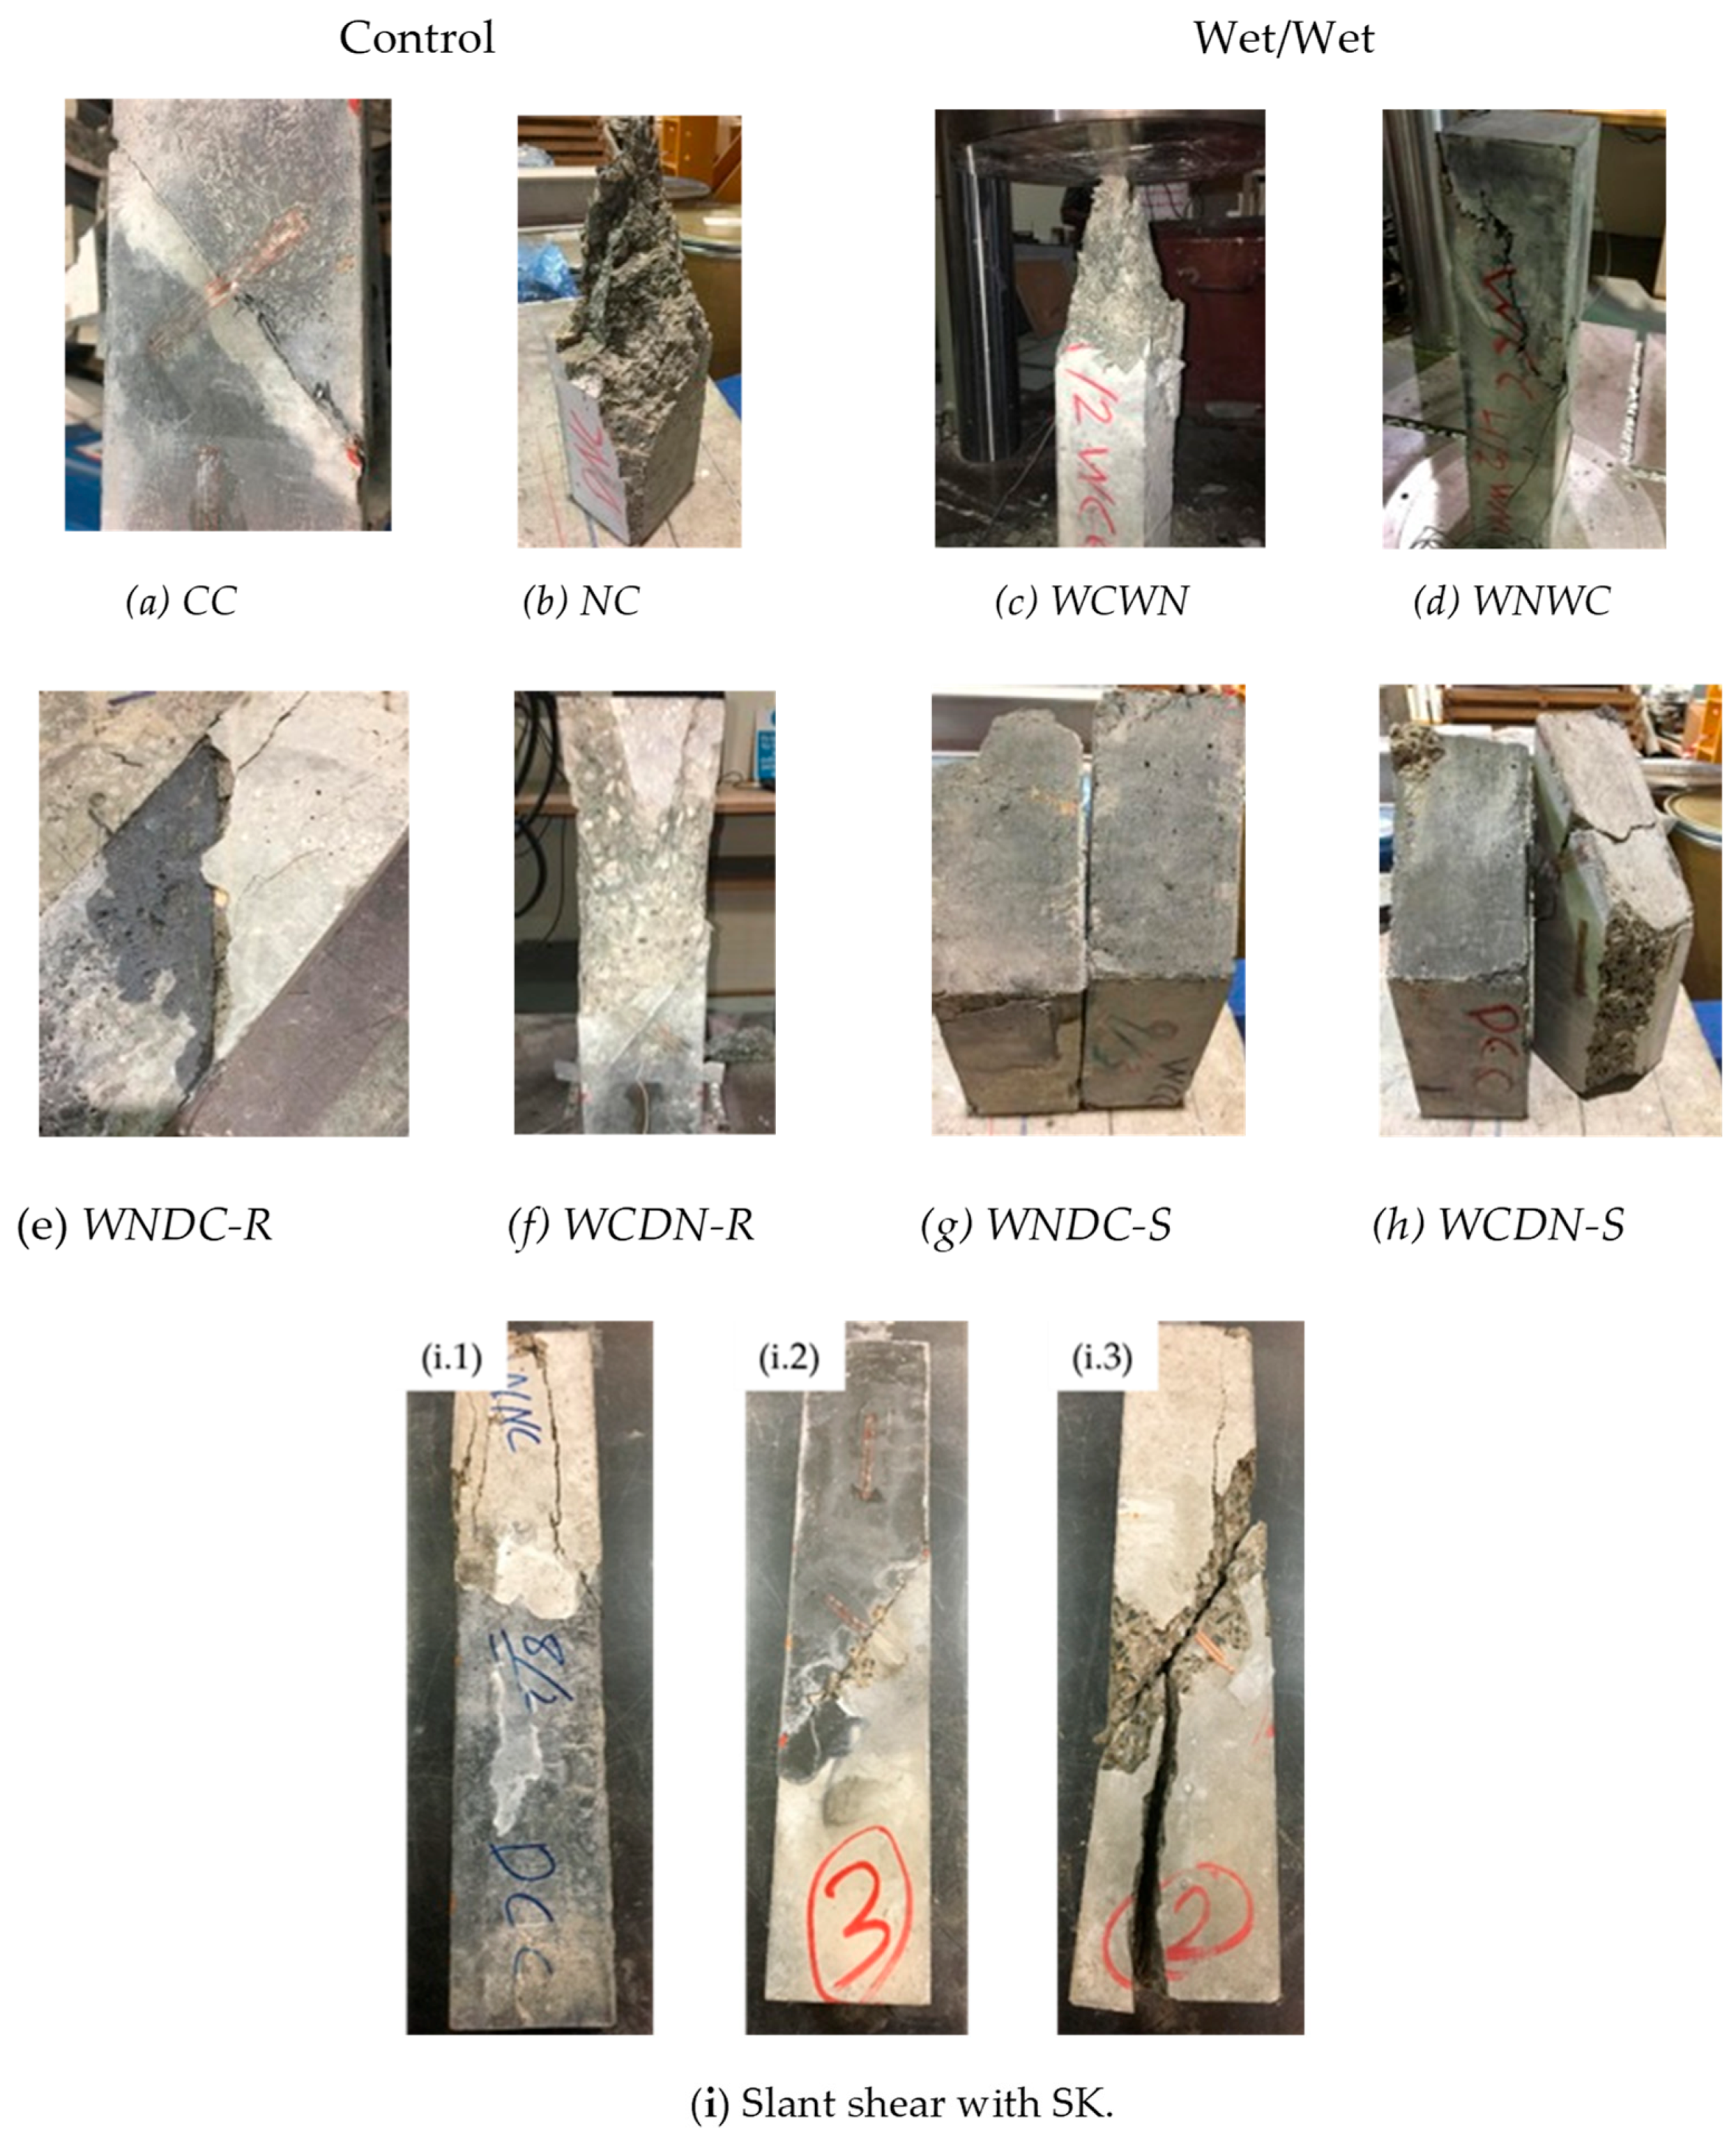
4.6.3. Slant Shear Failure Modes

The first common failure that indicated a strong bond between the two layers was the crushing of the conductive and/or SCC layer without bond failure. This phenomenon was shown in the WNDN, wet-to-wet, and WCDN-R samples, and it represented a monolithic failure, as shown in Figure 10. The second mode of failure was a smooth bond failure, which was related to all samples with the smooth surface preparation. The third failure mode was a partial bond failure, as shown in Figure 10a,e. This failure was associated with the roughening of the dry conductive concrete surface. The concrete separated at the bond interface; however, the steel fibers remained attached between the layers. In terms of the SK surface preparation, three categories of sample failures were observed, namely, a concrete crushing failure (i.1), a bond interface failure (i.2), and a combination of both (i.3), as shown in Figure 10i. It is important to note that each group contained different failure modes, and they are summarized in Table 3.
The dominant failure in WCDC-SK and WNDC-SK was crushing, which suggested that the bond interface was stronger than the bond shear capacity. In addition, WCDN-SK’s bond strength was slightly weaker with a dominant combination failure. Lastly, WNDN-SK’s dominant failure was a bond failure, which resembled the weakest failure mode and shear bond strength, as shown in Table 3.

4.6.4. Split Tension and Direct Shear Failure Modes

The split tension failure mode was influenced by the HSF present in the mix. In the SCC, a brittle failure occurred with complete separation of the sample, as shown in Figure 11a. However, in the CC, a ductile failure occurred without sample separation. The HSF in the mix controlled the crack growth, and it bridged both concrete parts, as shown in Figure 11b. Similarly, the direct shear samples exhibited similar failure modes. The SCC’s failure mode was brittle with complete separation at the expected failure region, as shown in Figure 11d. Conversely, the CC’s failure mode was ductile, with the HSF keeping both parts intact by controlling the cracks propagation, as shown in Figure 11e. It is important to note that, in the SCC, minor tensile cracks formed, as shown in Figure 11c. However, the readings were not affected, as nothing was picked up by the vertical strain gauges. Tensile cracks did not form in the CC samples, which was due to the HSF support.

5. Discussion

This section includes a discussion on the mechanical properties of each mix to further understand the effects of the conductive fillers. Additionally, the bond strength between the SCC and the CC is discussed. This section further includes a discussion on the effects of the surface preparation as well as of the testing and casting directions on the bond strength. Moreover, normalized data are presented to minimize the compressive strength effects. This section is divided into four major parts. First, data normalization is presented to understand the compressive strength effect from 28 days to 90 days on the results. Second, the mechanical properties that resemble the control for this study are discussed. Third, the effects of the surface preparation on the bond strength are shown. Lastly, the casting and testing effects on the bond strength are presented.

5.1. Data Normalization Due to Compressive Strength Variation

To verify that the results were not influenced by the compressive strength of the material, a normalization process was applied. Normalization was performed by dividing the results with the square root of the compressive strength, f c , with respect to the concrete age and type. It is important to note that the composites’ results were normalized based on the conductive concrete compressive strength since the CC was the most similar the control due to its lower compressive strength. Figure 12, Figure 13 and Figure 14 show the current results, as shown in Table 1, and the normalized results of the MOE, flexure, and slant shear tests, respectively.
Initially, these figures present similar mechanical and bond strength trends, meaning that, if sample A achieved a higher performance than B in the original data, it remained true after data normalization. In the MOE data (Figure 12), the initial variation between WCWN and the SCC was 31.7%, and after normalization, the difference was 25.2%, both in favor of the SCC’s MOE. In the case of the flexural strength (Figure 13), the WCDN-R and WNDC-R difference was 110%, and after data normalization, the difference was 104% in favor of WNDC-R.
Similarly, for the shear results (Figure 14), the WCDC-SK and WCDN-SK difference was 17.2%, and after data normalization, the difference was 17.2%, both in favor of WCDC-SK. In the case of the composite samples, the lower f c was the one used for normalization; therefore, the percentage difference was the same in the case of WCDC-SK and WCDN-SK. It is important to note that some percentage differences between the original and normalized data vary. However, the results and conclusions remain true. Thus, the compressive strength can affect the results; however, it did not influence the outcome of this study.

5.2. Control Samples

5.2.1. Compressive and MOE Control Samples

The CC’s and SCC’s compressive strengths ( f c ) both increased with respect to time, as shown in Table 1. Comparing the f c results at 28 days and at 90 days, the f c of the SCC increased by about 7%, while the f c of the CC increased by 14%. The variation in the strength gain can be attributed to the 28-day hydration rate for each mix. The SCC mix at 28 days gained almost more than 90% of its full compressive strength, while the CC experienced slow hydration and strength gain during the same time. The slow strength gain of the CC can be attributed to the carbon and graphite used as conductive fillers in its mix. It is important to note that the addition of the conductive fillers decreased the compressive strength, which is similar to the results in [6,14,49,50,51,52], where the increase in conductive fillers in the mix, such as carbon, contributed to a decrease in the compressive strength. Similarly, the conductive fillers affected the stiffness; therefore, the MOE of both mixes differed by 35%. Moreover, the average ultimate strain in the conductive concrete was 0.0037, and the maximum strain achieved was around 0.004, as shown in Figure 15a. Lee et al. [53] reported a similar strain performance using ultra-high-performance concrete (UHPC) with carbon and steel fibers.
However, the SCC mix, as shown in Figure 15b, had a lower average ultimate strain of 0.0024. In terms of Poisson’s ratio, both materials achieved similar results. The addition of the conductive fillers, carbon, graphite, and HSF affected the overall stiffness performance. The CC mixes had two main responses, as shown in Figure 15a. The CC samples’ initial average stiffness, from a strain of 0 to 0.0015, was 24 GPa, and after the 0.0015 strain mark, the materials softened and dropped to 9 GPa, excluding CC-R1-M7.
Note that Figure 15a,b show the CC and SCC samples, respectively, which were cast from the same batches during the preparation of the bond strength samples.

5.2.2. Flexure Control Samples

The flexural capacity varied between both mixes, which could be attributed to the presence of HSFs. HSFs and conductive fillers were used to improve the electrical conductivity in the CC, and this was the only difference from the SCC mix. The SCC samples, which excluded steel fibers and other conductive materials, had a flexural strength of 3.8 MPa. However, the CC samples’ flexural and residual strengths were influenced mainly by the HSF. The HSF increased the flexural strength and residual strength and enhanced crack initiation, crack control, and post-peak performance. The crack initiation improvements could be seen in the delayed formation of cracks, as shown in Figure 16, and it allowed the CC samples to attain a higher flexural stress of 15 MPa.
Crack control was present in the failure modes, as shown in Figure 9a, where the CC samples did not separate, and the HSF acted as a bridge between both parts in the failure region. Post-peak performance was observed with a residual capacity of 14.4 MPa at L/600 and 11 MPa at L/150 in the CC samples. Therefore, the addition of steel fibers enhanced the flexural strength, which is similar to the results in [41,54,55,56,57,58,59]. Thus, by adding hybrid steel fibers, the flexural and residual capacities increase. Moreover, the HSF enhanced crack initiation, crack control, and post-peak performance. Figure 16 shows all successful CC control samples prepared for the flexural strength evaluation with sample identification; for example, sample CC-S1-M1 refers to conductive concrete (CC), sample 1 (S1), cast from batch 1. At least three samples from each batch were tested to check for homogeneity and repeatability. Additional samples were cast and tested since the ASTM specifications for fiber-reinforced concrete C1609 [45] eliminate any sample that fails outside the loading region, which is L/3 from the support to the applied load.

5.2.3. Slant Control Samples

A unique control was used for the slant shear test, where surface treatment was applied without introducing any material variation. This was applied for both rough and shear key surface preparations. For this study, the maximum stress was recorded regardless of the sample mode of failure, which could be a monolithic failure or a bond failure. The samples developed in this study were cast from mix batch 5 to batch 8. The control’s bond shear stress recorded in the rough surface preparation was 27.1 MPa and 16.1 MPa in WNDN-R and WCDC-R, respectively. In terms of perpendicular plane strain, the WCDC samples went through higher strains than the WNDN samples, as shown in Figure 17a and Figure 17c, respectively, with a percentage difference of 51%. These strains represent the deformations of the samples before failure occurred. These deformations can be linked to the failure of the samples in the bonded region, comparing it to that of WNDN, which failed in compression. In addition, initial layer slippage could be seen in WCDC-R1 around the 2 MPa mark, which suggests that the bond strength was not as high as in WNDN-R. The inferior performance of WCDC-R could be related to the difficulties in roughening the surface of the CC samples, which contained a high volumetric ratio of HSFs. Thus, the rough surface preparation method is not suitable for CC samples.
Moreover, the shear key method had a different effect on the bond strength. WCDC-SK outperformed WNDN-SK in terms of shear bond strength with a difference of 31%. The superior performance of WCDC-SK could be linked to the HSF, which is similar to the findings in [20]. The addition of steel fibers to a mix can increase the bond strength. Moreover, the strain readings in WCDC-SK did not exhibit any sudden changes, as shown in Figure 17b, unlike in the WCDC-R samples. It is important to note that the WNDN-3 sample with the SK surface preparation had a damaged shear key that did not affect the failure or the carrying capacity, as shown in Figure 17d. However, the slippage between the layers increased due to the damaged SK.

5.2.4. Split Tension

The HSF present in the CC mix from mix batch 5 was proven to improve the mix’s tensile stress and strain compared to those of the SCC mix from mix batch 6; the tensile stress difference was about 70% in the CC’s favor. For this test, four CC samples (S1, S2, S3, and S4) and three SCC samples (S1, S2, and S3) were used, each with horizontal strain gauges (SGs). The ultimate strain of the CC samples was generally between 0.002 and 0.008, as shown in Figure 18a. In addition, the behavior of the CC was different from that of the SCC. Figure 18b shows a near linear relationship between the tensile stress and horizontal strains in the SCC, with an ultimate strain reading between 0.0001 and 0.00025. However, the conductive concrete’s behavior presented a bilinear relationship. This relationship was the result of the CC mix and its conductive fillers.

5.2.5. Direct Shear

The direct shear test included two main responses, which were based on the type of concrete mix. If the concrete contained steel fibers, the failure occurred in the expected failure region. In addition, the strain readings were smoother in both the vertical and horizontal strain gauges. However, if the concrete mix did not contain steel fibers, an initial tensile crack formed, which only disturbed the horizontal strain gauge readings. The CC samples from batch M1 experienced a ductile failure, as well as smooth vertical and horizontal readings. The vertical readings in the CC presented a continuous deformation until failure, which was also present in the SCC samples from batch M2, as shown in Figure 19a and Figure 19c, respectively. Similarly, the horizontal strain readings in the CC presented a continuous deformation until shear failure, as shown in Figure 19b. It is important to note that all CC samples did not develop a tensile crack. However, the SCC samples developed tensile cracks, which caused sudden changes in the horizontal strain readings, as shown in Figure 19d. Moreover, the CC’s strain and load readings were both greater than the SCC’s shear capacity. The difference between the CC’s and SCC’s shear strengths was 81% in favor of the CC mix. It is important to note that the samples in Figure 19 are identified by the mix type and sample number, such as conductive concrete sample 1 (CC1). Moreover, the first and second vertical strains are identified as V1 and V2, and the horizontal strain gauge is identified as H.

5.3. Surface Preparation

5.3.1. Surface Preparation Effect on Compression Strength

The surface preparation affected the failure mode of the smooth and rough surface interfaces, as shown in Figure 8. The rough and wet-to-wet interfaces both achieved similar performance to the controls, and both methods achieved a monolithic failure. However, most samples with the smooth surface preparation separated before and/or during testing. Therefore, to maintain the stability of an element and prevent layer separation, a rough surface interface is recommended.

5.3.2. Surface Preparation Effects on MOE

The surface preparation affected the MOE test severely, which could be seen in the strain gauge readings. The wet-to-wet surface preparation and WCDN-R performed like the CC control samples in terms of stiffness. This means that the stiffness of both composite samples dropped compared to that of the SCC control, which was due to the dominant CC layer. It is unlikely that the stiffness drop was due to the surface preparation since the WCDN-R samples had a similar stiffness to that of a fully bonded composite as in the wet-to-wet samples. However, the smooth surface preparation, from batches M1 to M4, affected the performance of the samples during testing, as demonstrated by WNDC-S and WCDN-S. These samples’ strain readings displayed extreme sudden changes, which was due to sample separation. However, the WNDC-R samples failed the tests, and their readings were discarded. WNDC-R1 exhibited an early failure due to the stress concentration, which did not give a clear indication of the material capacity. The WNDC-R2 sample encountered a slight movement in the bonded area, which affected the strain readings.
Figure 20 shows both WCDN-R samples with different maximum strains. It is important to note that the rough surface preparation casting was from batches M5 to M8. The strain variation was due to the variation in the material of the composite sample and not due to the difference in the compressive strength. This could be explained by referring to Figure 12, which shows that the compressive strength did not influence the results, as demonstrated by the WCWN and WCDN-R variations. The original difference and the difference after normalization were both 16.2% in favor of WCDN-R.

5.3.3. Surface Preparation Effects on Flexural Strength

The flexural capacity of the wet-to-wet surface preparation was like that of the CC control samples, as shown in Table 1. Similarly, the flexural strength of the rough surface preparation was like that of both the wet-to-wet samples and controls. The flexural strength difference between them was nearly 2 MPa with respect to the casting direction. Moreover, it was observed that cracks did not form along the bond interface in the wet-to-wet or rough surface preparation, unlike in the smooth surface preparation. This response is similar to that in [18], where a high roughness surface preparation performed better than a low roughness surface preparation. The smooth surface preparation had the lowest flexural and residual strengths out of the three surface preparation methods. In addition, it was observed that cracks propagated from the tensile side to the bonding surface.
Figure 21 presents a summary of the smooth surface (S) preparation and the rough surface (R) preparation for the samples S1, S2, and S3. The samples in the smooth surface preparation study were cast from batches M1 to M4, while the samples with the rough surface preparation were cast from batches M5 to M8. The rough surface preparation clearly outperformed the smooth surface preparation in flexural strength, as well as in residual capacity with respect to the casting direction. The flexural strength difference between each surface preparation was 27% in WCDN and 51% in WNDC, both in favor of the rough surface preparation. Moreover, the differences after data normalization were 26.1% in WCDN and 41.2% in WNDC, similarly, both in favor of the rough surface preparation, as shown in Figure 13. Therefore, the smooth surface preparation lowered the performance, which was emphasized in the bond failure mode of the sample.

5.3.4. Surface Preparation Effects on Slant Shear

The surface preparation methods affected the bond strengths of the samples. The investigated surface preparation methods were the rough, smooth, and shear key methods. The smooth surface preparation achieved the lowest bond strength in all configurations compared to the controls. The samples in the smooth surface preparation study were cast from batches M1 to M4.
However, the rough surface preparation method caused an improvement in the bond strength, which was observed in WCDN-R, shown in Figure 22a. WCDN-R’s bond strength was the closest to the SCC control’s bond strength, with a difference of 4%, and WCDN-R’s bond strength was also similar to the wet-to-wet sample’s bond strength. However, when the rough surface preparation was applied to the CC samples, the bond strength dropped, as shown in Figure 22b.
Thus, the rough surface preparation is not suitable for CC samples. However, the shear key surface preparation method produced different results. The conductive concrete outperformed the self-consolidating concrete, which could be seen in the control samples. Additionally, the percentage difference between WCDC-SK and WNDN-SK after data normalization was 39.8%, in favor of WCDC-SK, as shown in Figure 14. Moreover, a bond strength difference of 1.2 MPa was recorded between WCDN-SK and WNDC-SK, which suggests that both samples’ bond performances were almost the same. However, initial slippage was present in the WCDN-SK samples unlike in the WNDC-SK samples, as shown in Figure 22c and Figure 22d, respectively. Nonetheless, WCDN-SK and WNDC-SK had similar bond strengths. Note that the samples in the rough and shear key surface preparation study were cast from batches M5 to M8.

5.4. Casting and Testing Directions

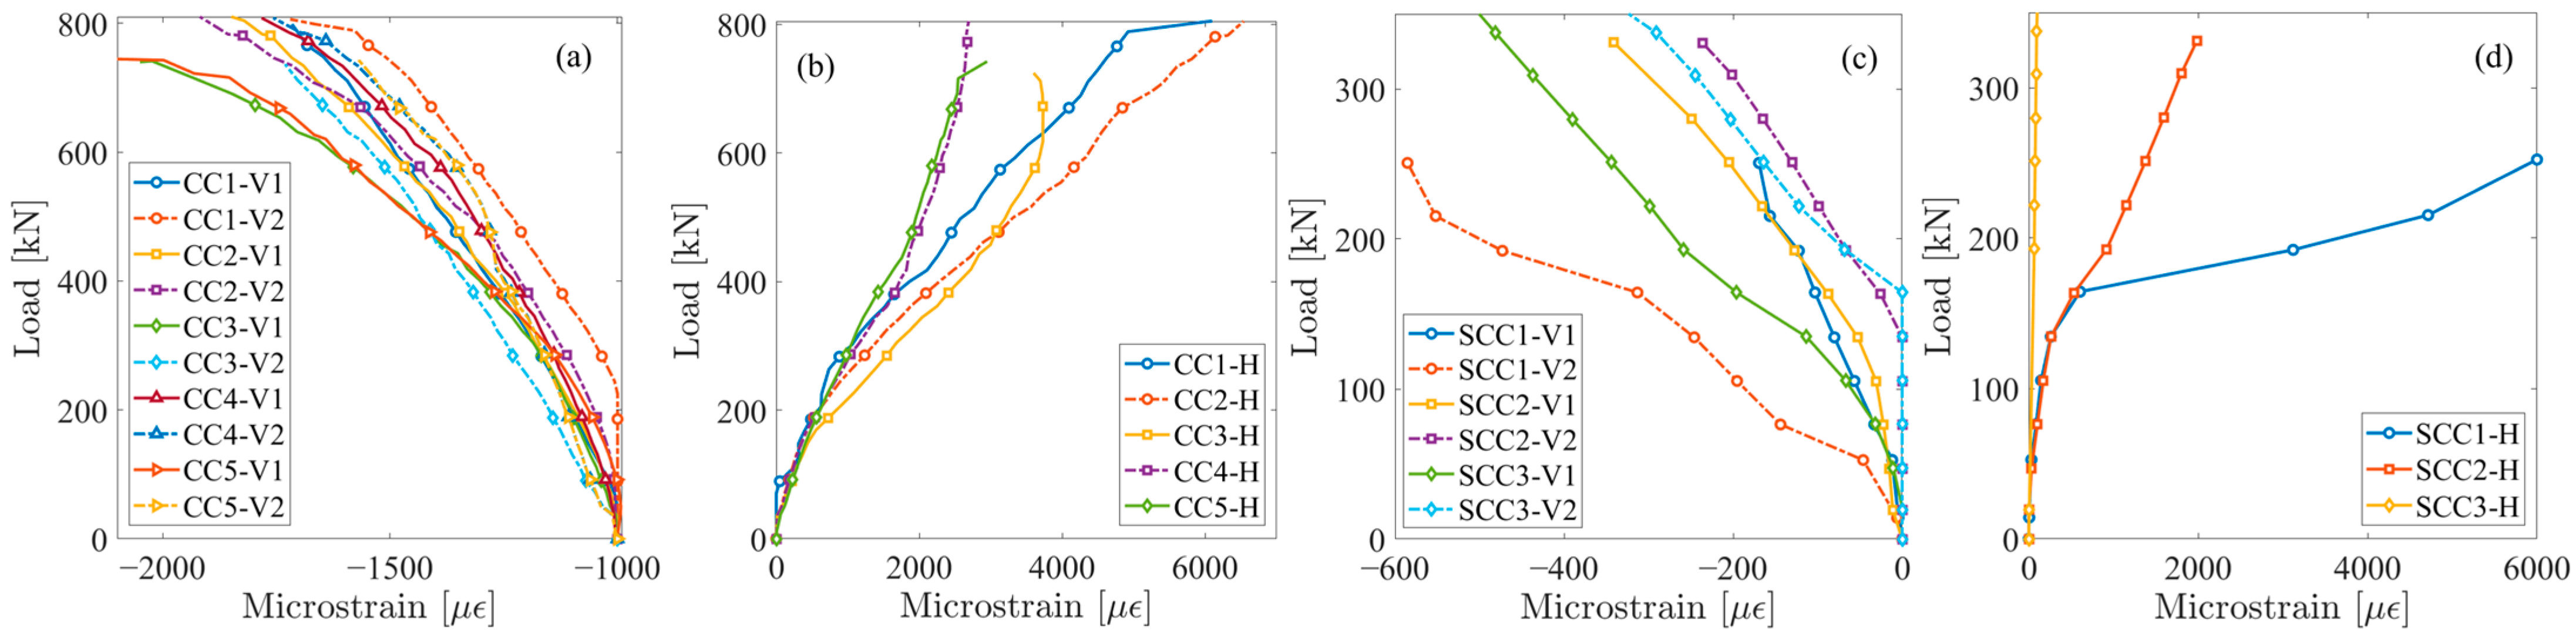
5.4.1. Casting and Testing Direction Effects on Compression Strength

The casting direction did not play a major role; however, the material variation affected the samples’ performance. The samples, including the normal and conductive concrete variations, achieved a lower compression strength than the normal concrete and a higher strength than the conductive concrete, as shown in Table 1.

5.4.2. Casting and Testing Direction Effects on MOE

During the MOE tests, the behavior was affected by the dominant layer rather than the testing direction. The wet-to-wet sample casting and the testing direction had a minor difference of 6.5%, which was due to the heterogeneous nature of concrete. Moreover, the data normalization presented a similar difference of 6.3%. Figure 23 shows that the strain of the composites varied between 0.002 and 0.004, and it displays the contribution of the CC and SCC layers. The wet-to-wet samples were cast from batches M3, M4, M7, and M8.

5.4.3. Casting and Testing Direction Effects on Flexure Strength

The initial behavior and strength were governed by the tensile side layer’s properties. WCWN, whose tensile side layer was normal concrete, presented low initial peaks, as shown in Figure 24a,c. WCWN’s flexural strength was like the normal concrete control’s flexural strength, which was achieved due to the layer arrangement. In addition, the residual capacity slightly increased over the initial peak, which showed the contribution of the CC layer after the complete failure of the SCC layer. It is important to note that the normal concrete suddenly failed, and the CC layer took control of the sample’s behavior. Thus, a slight increase in the residual strength was observed, as shown in Figure 24a,c. Nonetheless, the residual strength was impacted by the normal concrete, resulting in a residual strength lower than that of the conductive concrete control.
By simply changing the layers, the results will differ based on the controlling tensile layer. WNWC, which had conductive concrete in the tensile region, as shown in Figure 24b,d, performed similarly to the conductive concrete control, and this held true after data normalization. The flexural strengths in both the rough and smooth groups were 12.7 MPa and 11.9 MPa, respectively. Compared to the conductive control, the flexural and residual strengths displayed similar trends. Therefore, the tensile side layer in the sample controlled the sample’s flexural and residual strengths. This was observed in all samples containing different layer arrangements. The samples in this study were cast from batches M1, M2, M5, and M6.

5.4.4. Casting and Testing Direction Effects on Slant Shear

The alteration of the sample’s layers was not possible since the casting was performed longitudinally, meaning that the samples during casting were positioned on the ground along the longest length. However, to fully cover the slant shear test, the direction of the samples during testing was altered. The alteration during testing was achieved by flipping the sample vertically and positioning either the conductive concrete or plain concrete at the top. It was observed that the testing direction did not affect the samples of the same type, and all samples achieved similar results with respect to their type. Figure 25 shows the performance of the wet-to-wet samples during direction alteration, and the alteration did not affect the stresses and strains. The wet-to-wet samples in this study were cast from batches M5 and M6.

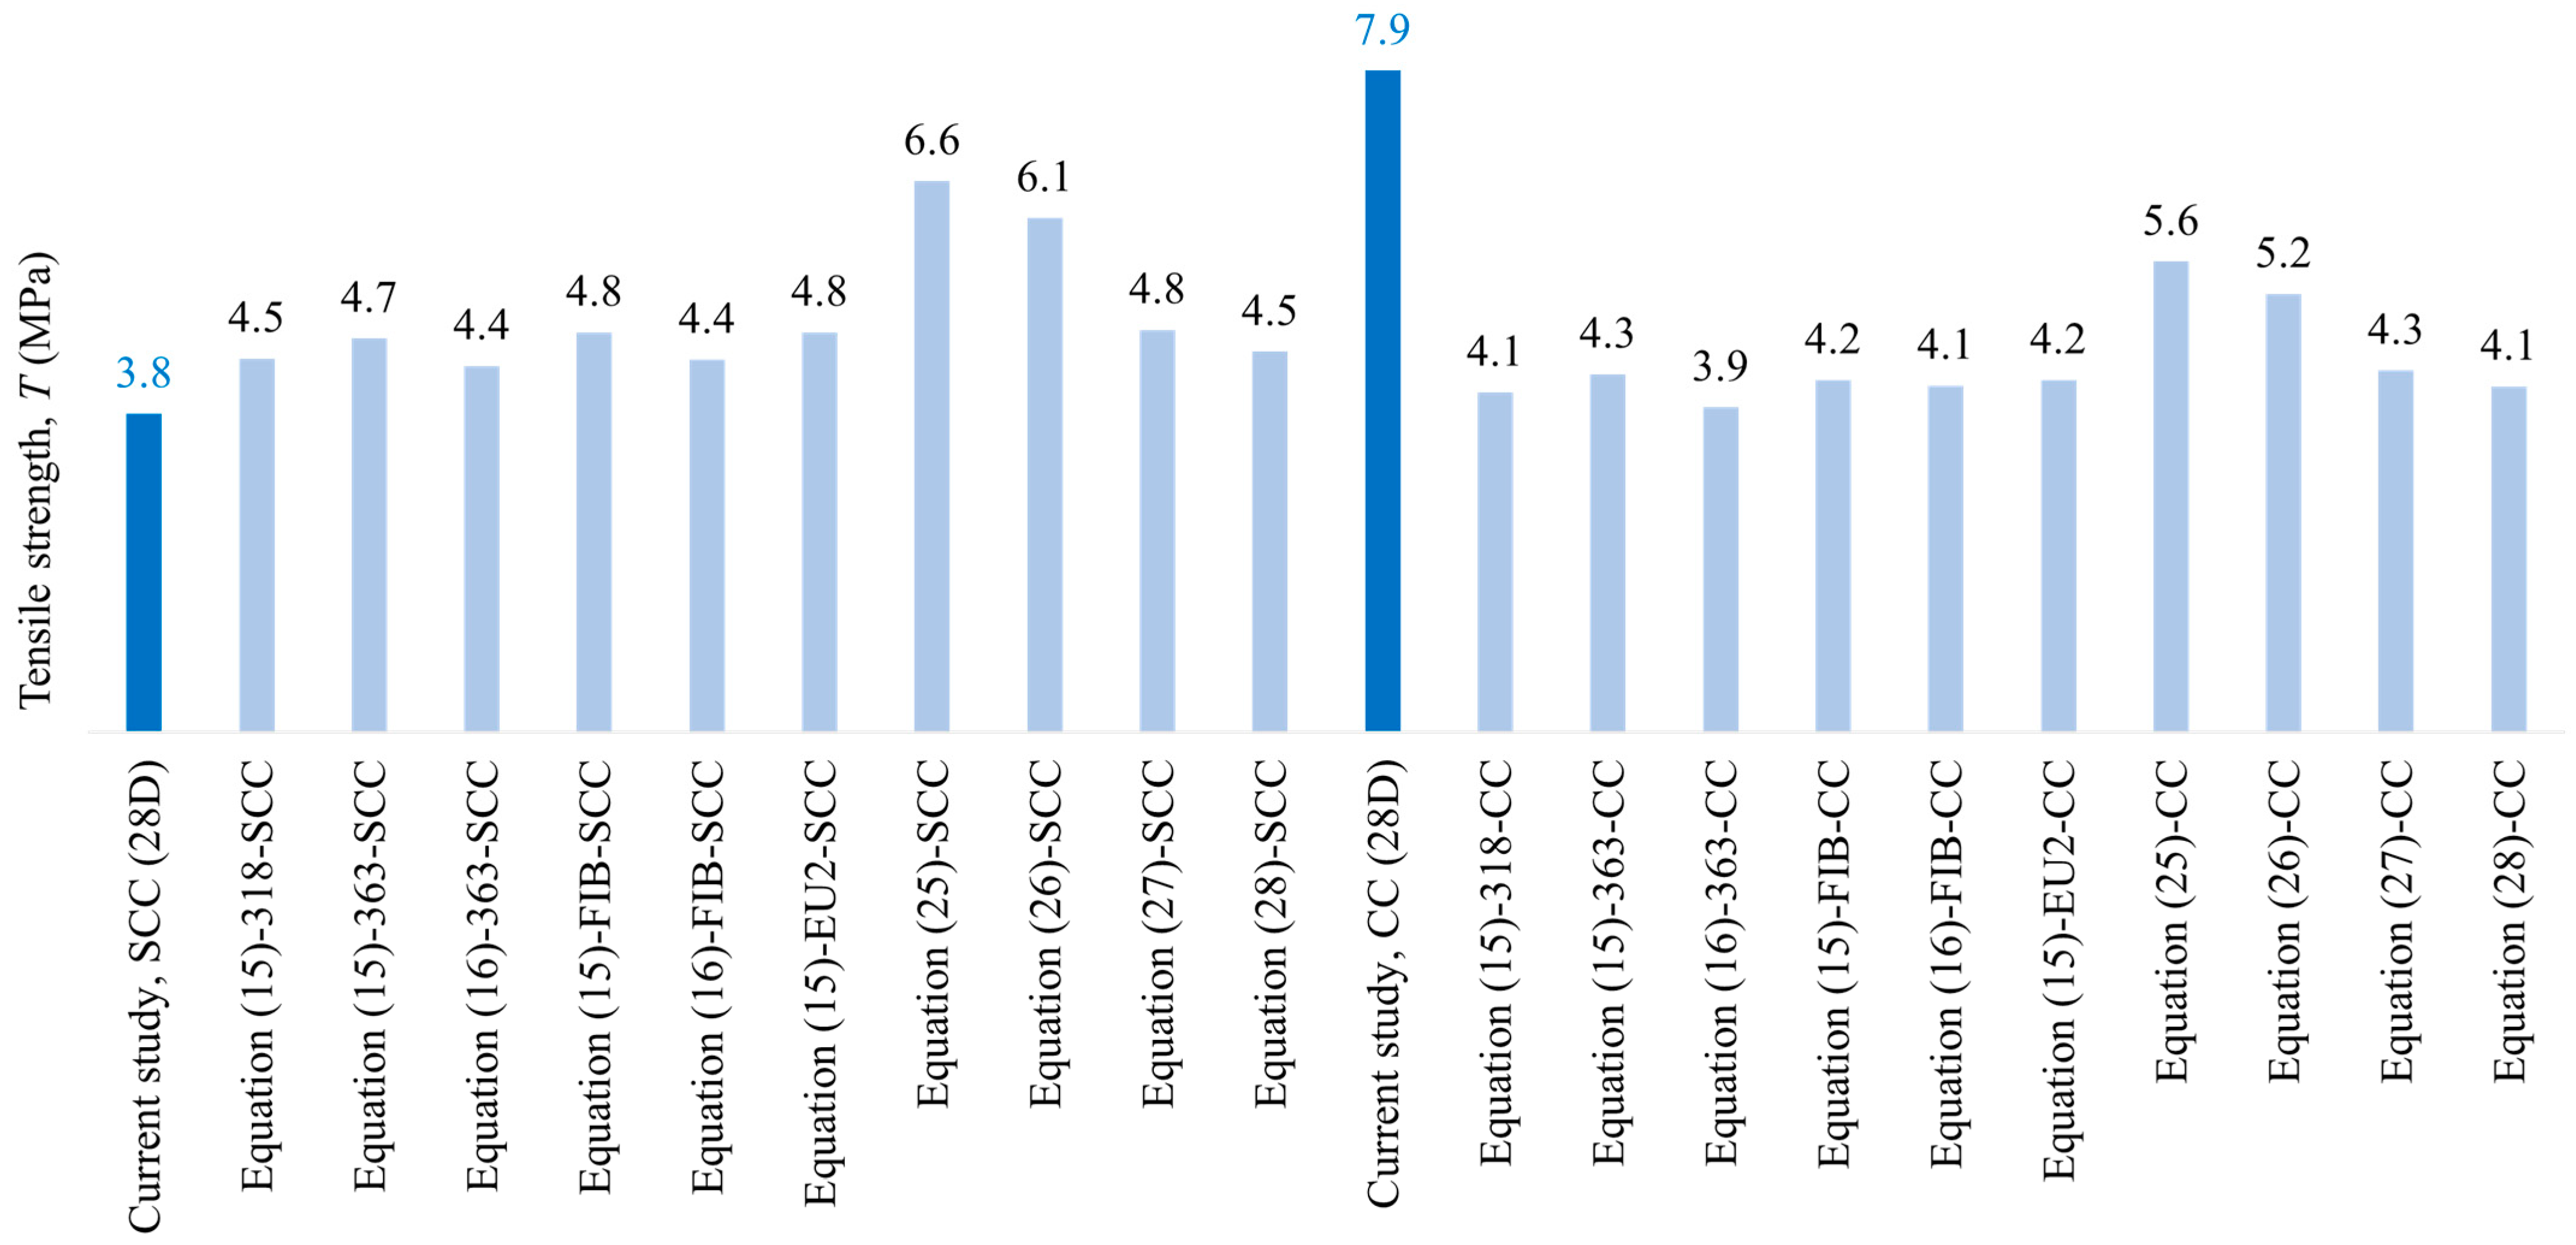
6. Comparison of CC and SCC Mechanical Properties with Published Equations

A comparison was made between the mechanical property results in Table 1 and those predicted by codes and published equations. The codes used were ACI 318 [60], ACI 363 [61], FIB [62], and Eurocode 2 [63], and the published equations were from [64,65,66,67,68,69], as shown in Table 4 and Table 5. The formulas collected from the codes and the literature should cover MOE, flexural, and split tension predictions.
The MOE predictions varied with the use of different equations. The ACI 318 and Eurocode 2 predictions overestimated the MOEs of the CC and SCC, as shown in Figure 26. The highest percentage difference in the SCC was 13% and 14% with respect to ACI 318 and Eurocode 2, respectively. However, the CC predictions were worse, and the percentage difference increased to 38% and 44% with respect to ACI 318 and Eurocode 2, respectively. The predictions closest to the actual results were from ACI 363 and FIB. The ACI 363 predictions, Equations (8)–(11), were suitable for the SCC mix, with a 2 GPa difference. The FIB equations depended heavily on the aggregate types in the mix; the closest SCC and CC predictions with a 2 GPa difference were from Equations (10) and (11), respectively. However, published Equations (17) and (18) in Table 5 successfully predicted the CC’s MOE with a difference of 2 GPa.
The flexural strength and split tension predictions from ACI 318, FIB, and Eurocode 2 for the SCC were mostly accurate, and the variation was around 1 MPa, as shown in Figure 27 and Figure 28, respectively. However, ACI 363 slightly overestimated the flexural strength but provided an accurate split tension prediction. Conversely, all codes underestimated the flexural and split tension capacities of the CC mix. This was due to the HSF presence in the mix, which boosted these mechanical properties. In terms of the published equation predictions for the CC mix, the closest split tension prediction was from Equation (15) with a 2 MPa difference. However, the flexural strength was similarly underestimated by all equations, which was due to the different fiber percentages and aspect ratios present in the CC mix. Therefore, it is possible to predict the SCC’s mechanical properties. However, care must be taken when attempting to predict the CC’s mechanical properties since conductive fillers decrease the compressive strength and stiffness of the mix. It is important to note that the published equations from [64,65,67,68] consider the steel fiber’s contribution to the mechanical properties.

7. Conclusions

This study aimed to investigate the mechanical properties of and bond strength between conductive concrete (CC) and self-consolidated concrete (SCC). The bond strength was investigated based on two main parameters. The first parameter was the surface preparation method used on each layer, which included smooth surface, rough surface, shear key, and wet-to-wet methods. The second parameter was the effects of the casting and testing directions on the sample’s bond strength. This study performed on CC and SCC shows the following:
  • The SCC’s compressive strength and stiffness were superior to those of the conductive concrete. The difference in compressive strength was due to the addition of conductive fillers, which replaced parts of the mix. The conductive fillers added to the mix were carbon, graphite, and hybrid steel fibers (HSFs). The compressive strength difference was 19% at 28 days and 13% at 90 days, both in favor of the SCC mix; similarly, the stiffness difference was 35% in favor of the SCC.
  • The CC flexural, tensile, and shear strengths were superior to those of the SCC mix. This was due to the presence of HSFs in the mix, which increased the performance. In addition, the HSF allowed the CC mix to be more ductile than the SCC mix, which was observed in the CC samples’ failure modes. The CC’s flexural strength improvement was 4 times that of the SCC’s flexural strength. Similarly, the CC’s tensile and shear strengths were 2 times that of the SCC’s strengths. Moreover, the HSF allowed for better crack growth control and post-peak performance.
  • The most suitable surface preparation method to fully utilize the CC mix was the shear key method. The shear key method is based on a groove grid performed initially on a mold, after which the mix is cast into it. However, the rough surface preparation, performed using hand chiseling and a steel wire brush, achieved a similar bond strength to the wet-to-wet surface preparation when the roughness was applied to the SCC’s surface in the slant shear test. However, if the rough surface preparation is applied to the CC mix’s surface, the bond strength would fail. It is important to note that wet-to-wet surface preparation is performed to simulate the maximum bond strength.
  • The casting and testing directions played important roles, which could be seen in the flexural strength tests. The most suitable position for conductive concrete is in the tensile region of an element. If the SCC mix is present in the tensile region, it will weaken the sample’s strength and residual capacity. In WNWC, the flexural strength and post-peak performance were similar to those of the CC control. However, in WCWN, the strength dropped significantly, which was due to the SCC’s position. Moreover, the SCC’s presence in the tensile region subjected the sample to a sudden stress due to its initial sudden failure, after which the CC carried the rest of the load.
  • An attempt to predict the SCC’s and CC’s mechanical properties based on codes and published equations was made. Most codes and published equations could predict the SCC’s MOE, flexural, and tensile strength. However, care must be taken with CC mixes, since most equations overestimated the MOE and underestimated the tensile and flexural strengths. This issue occurred only due to the presence of conductive fillers, which affected the mechanical properties by either increasing or decreasing performance.

Author Contributions

Conceptualization, S.Y., T.L. and M.E.-A.; methodology, M.E.-A., S.Y., T.L. and M.E.; software, T.L., M.E.-A., N.Q. and S.Y.; validation, S.Y., T.L., M.E. and M.E.-A.; formal analysis, M.E.-A., S.Y. and T.L.; investigation, M.E.-A., S.Y. and N.Q.; resources, S.Y., M.E. and N.Q.; data curation, M.E.-A., T.L. and S.Y.; writing—original draft preparation, M.E.-A., S.Y., T.L., N.Q. and M.E. writing—review and editing, S.Y., T.L., M.E.-A., N.Q. and M.E.; visualization, T.L., M.E.-A. and S.Y.; supervision, S.Y., T.L. and N.Q.; project administration, S.Y., T.L. and N.Q.; funding acquisition, S.Y., TL. and N.Q. All authors have read and agreed to the published version of the manuscript.

Funding

This research was funded by the American University of Sharjah, Faculty Research Grant number FRG-EFRG18-MSE-CEN-21, and by the Open Access Program from the American University of Sharjah.

Data Availability Statement

The raw and processed data required to reproduce these findings cannot be shared at this time, as they are part of an ongoing study.

Acknowledgments

The authors acknowledge the support provided by the research office at the American University of Sharjah (AUS). The work in this paper was supported, in part, by the Open Access Program from the American University of Sharjah. In addition, the authors would like to acknowledge Mohamed Ansari, AUS Laboratory Technician, for helping during sample preparation and testing.

Conflicts of Interest

The authors declare no conflict of interest. The funders had no role in the design of the study; in the collection, analyses, or interpretation of data; in the writing of the manuscript; or in the decision to publish the results.

Disclaimer

This paper represents the opinions of the author(s) and does not mean to represent the position or opinions of the American University of Sharjah.

Abbreviations

The following abbreviations are used in this manuscript:
CCConductive concrete
DNDry normal
DCDry conductive
HSFHybrid steel fiber
LVDTLinear variable displacement transducer
M1, M3, M5, M7Odd numbers used for CC mixes
M2, M4, M6, M8Even numbers used for SCC mixes
MOEModulus of elasticity
SCCSelf-consolidated concrete
SFsSteel fibers
SGStrain gauge
SKShear key
UHPCUltra-high-performance concrete
UTMUniversal testing machine
WCWet conductive
WNWet normal
WADBWet concrete type A on dry concrete type B
WAWBWet concrete type A on wet concrete type B
WCWNWet conductive concrete over wet normal concrete
WCDN-SWet conductive over dry normal with smooth surface
WCDN-RWet conductive over dry normal with rough surface
WNDC-SKWet normal over dry conductive with shear key
A Interface area
A s Expected shearing area
b Average width of specimen
d 0 Cylinder diameter
E Modulus of elasticity
f r Flexural strength
f s Shear strength
f c Compressive strength
h Specimen depth
P Maximum load
T Tensile strength
α Slant shear angle with respect to the y-axis
ε 1 , ε 2 Longitudinal strain
ε t 1 , ε t 2 Transverse strain
σ 1 , σ 2 Stress
σ n Normal stress
τ n Shear stress
v Poisson’s ratio

References

  1. Yehia, S.; Qaddoumi, N.; Hassan, M.; Swaked, B. Conductive Concrete for Electromagnetic Shielding Applications. Adv. Civ. Eng. Mater. 2014, 3, 270–290. [Google Scholar] [CrossRef]
  2. Han, J.; Pan, J.; Cai, J.; Li, X. A review on carbon-based self-sensing cementitious composites. Constr. Build. Mater. 2020, 265, 120764. [Google Scholar] [CrossRef]
  3. Wang, L.; Aslani, F. A review on material design, performance, and practical application of electrically conductive cementitious composites. Constr. Build. Mater. 2019, 229, 116892. [Google Scholar] [CrossRef]
  4. Yehia, S.; Tuan, C.Y.; Ferdon, D.; Chen, B. Conductive concrete overlay for bridge deck deicing: Mixture proportioning, optimization, and properties. ACI Struct. J. 2000, 97, 172–181. [Google Scholar]
  5. Azhari, F.; Banthia, N. Carbon fiber-reinforced cementitious composites for tensile strain sensing. ACI Mater. J. 2017, 114, 129–136. [Google Scholar]
  6. El-Dieb, A.; El-Ghareeb, M.; Abdel-Rahman, M.; Nasr, E. Multifunctional electrically conductive concrete using different fillers. J. Build. Eng. 2018, 15, 61–69. [Google Scholar] [CrossRef]
  7. Han, B.; Ding, S.; Yu, X. Intrinsic self-sensing concrete and structures: A review. Meas. J. Int. Meas. Confed. 2015, 59, 110–128. [Google Scholar] [CrossRef]
  8. Khalid, T.; Albasha, L.; Qaddoumi, N.; Yehia, S. Feasibility Study of Using Electrically Conductive Concrete for Electromagnetic Shielding Applications as a Substitute for Carbon-Laced Polyurethane Absorbers in Anechoic Chambers. IEEE Trans. Antennas Propag. 2017, 65, 2428–2435. [Google Scholar] [CrossRef]
  9. Swaked, B.; Qaddoumi, N.; Yehia, S.; Farhana, S.; Nguyen, L. Conductive Concrete for Smart Cities Applications. In Proceedings of the 2019 AEIT International Annual Conference (AEIT), Florence, Italy, 18–20 September 2019; pp. 1–5. [Google Scholar]
  10. Han, B.; Wang, Y.; Dong, S.; Zhang, L.; Ding, S.; Yu, X.; Ou, J. Smart concretes and structures: A review. J. Intell. Mater. Syst. Struct. 2015, 26, 1303–1345. [Google Scholar] [CrossRef]
  11. Gomis, J.; Galao, O.; Gomis, V.; Zornoza, E.; Garcés, P. Self-heating and deicing conductive cement. Experimental study and modeling. Constr. Build. Mater. 2015, 75, 442–449. [Google Scholar] [CrossRef]
  12. Wanasinghe, D.; Aslani, F.; Ma, G.; Habibi, D. Advancements in electromagnetic interference shielding cementitious composites. Constr. Build. Mater. 2020, 231, 117116. [Google Scholar] [CrossRef]
  13. Momayez, A.; Ehsani, M.R.; Ramezanianpour, A.A.; Rajaie, H. Comparison of methods for evaluating bond strength between concrete substrate and repair materials. Cem. Concr. Res. 2005, 35, 748–757. [Google Scholar] [CrossRef]
  14. Cristina, Z.; Banthia, N.; Giovanni, P. A study of some factors affecting bond in cementitious fiber reinforced repairs. Cem. Concr. Res. 2014, 63, 117–126. [Google Scholar]
  15. Santos, P.; Julio, E. Factors affecting bond between new and old concrete. ACI Mater. J. 2011, 108, 449–456. [Google Scholar]
  16. Afandi, M.E.L.; Yehia, S.; Landolsi, T.; Qaddoumi, N.; Elchalakani, M. Concrete-to-concrete bond Strength: A review. Constr. Build. Mater. 2023, 363, 129820. [Google Scholar] [CrossRef]
  17. Elbakry, H.M.F.; Tarabia, A.M. Factors affecting bond strength of RC column jackets. Alexandria Eng. J. 2016, 55, 57–67. [Google Scholar] [CrossRef]
  18. Gadri, K.; Guettala, A. Evaluation of bond strength between sand concrete as new repair material and ordinary concrete substrate (The surface roughness effect). Constr. Build. Mater. 2017, 157, 1133–1144. [Google Scholar] [CrossRef]
  19. Munoz, M.; Harris, D.; Ahlborn, T.; Froster, D. Bond Performance between Ultrahigh-Performance Concrete and Normal-Strength Concrete. Mater. Civ. Eng. 2014, 26, 04014031. [Google Scholar] [CrossRef]
  20. Zanotti, C.; Randl, N. Are concrete-concrete bond tests comparable? Cem. Concr. Compos. 2019, 99, 80–88. [Google Scholar] [CrossRef]
  21. Zanotti, C.; Borges, P.H.R.; Bhutta, A.; Banthia, N. Bond strength between concrete substrate and metakaolin geopolymer repair mortar: Effect of curing regime and PVA fiber reinforcement. Cem. Concr. Compos. 2017, 80, 307–316. [Google Scholar] [CrossRef]
  22. Silfwerbrand, J. Shear bond strength in repaired concrete structures. Mater. Struct. Constr. 2003, 36, 419–424. [Google Scholar] [CrossRef]
  23. Banthia, N.; Zanotti, C.; Sappakittipakorn, M. Sustainable fiber reinforced concrete for repair applications. Constr. Build. Mater. 2014, 67, 405–412. [Google Scholar] [CrossRef]
  24. Yazdi, M.A.; Dejager, E.; Debraekeleer, M.; Gruyaert, E.; Van Tittelboom, K.; De Belie, N. Bond strength between concrete and repair mortar and its relation with concrete removal techniques and substrate composition. Constr. Build. Mater. 2020, 230, 116900. [Google Scholar] [CrossRef]
  25. Feng, S.; Xiao, H.; Li, H. Comparative studies of the effect of ultrahigh-performance concrete and normal concrete as repair materials on interfacial bond properties and microstructure. Eng. Struct. 2020, 222, 111122. [Google Scholar] [CrossRef]
  26. Courard, L.; Piotrowski, T.; Garbacz, A. Near-to-surface properties affecting bond strength in concrete repair. Cem. Concr. Compos. 2014, 46, 73–80. [Google Scholar] [CrossRef]
  27. Wang, B.; Li, Q.; Liu, F.; Wang, J.; Xu, S. Shear bond assessment of UHTCC repair using push-out test. Constr. Build. Mater. 2018, 164, 206–216. [Google Scholar] [CrossRef]
  28. Mirmoghtadaei, R.; Mohammadi, M.; Samani, N.; Mousavi, S. The impact of surface preparation on the bond strength of repaired concrete by metakaolin containing concrete. Constr. Build. Mater. 2015, 80, 76–83. [Google Scholar] [CrossRef]
  29. Jafarinejad, S.; Rabiee, A.; Shekarchi, M. Experimental investigation on the bond strength between Ultra high strength Fiber Reinforced Cementitious Mortar & conventional concrete. Constr. Build. Mater. 2019, 229, 116814. [Google Scholar]
  30. Costa, H.; Carmo, R.N.F.; Júlio, E. Influence of lightweight aggregates concrete on the bond strength of concrete-to-concrete interfaces. Constr. Build. Mater. 2018, 180, 519–530. [Google Scholar] [CrossRef]
  31. Zhang, Y.; Zhu, P.; Liao, Z.; Wang, L. Interfacial bond properties between normal strength concrete substrate and ultra-high-performance concrete as a repair material. Constr. Build. Mater. 2020, 235, 117431. [Google Scholar] [CrossRef]
  32. Zhang, X.; Zhang, S.; Luo, Y.; Wang, L. Effects of Interface Orientations on Bond Strength between Old Conventional Concrete and New Self-Consolidating Concrete. ACI Struct. J. 2020, 117, 191–201. [Google Scholar]
  33. Tayeh, B.; Bakar, B.H.A.; Johari, M.A.M. Characterization of the interfacial bond between old concrete substrate and ultra high-performance fiber concrete repair composite. Mater. Struct. 2013, 46, 743–753. [Google Scholar] [CrossRef]
  34. Tayeh, B.A.; Bakar, B.H.A.; Johari, M.A.M.; Voo, Y.L. Evaluation of bond strength between normal concrete substrate and ultra high-performance fiber concrete as a repair material. Procedia Eng. 2013, 54, 554–563. [Google Scholar] [CrossRef]
  35. Semendary, A.A.; Svecova, D. Factors affecting bond between precast concrete and cast in place ultra-high performance concrete (UHPC). Eng. Struct. 2020, 216, 110746. [Google Scholar] [CrossRef]
  36. Diab, A.; Elmoaty, A.E.A.; Eldin, M.T. Slant shear bond strength between self-compacting concrete and old concrete. Constr. Build. Mater. 2017, 130, 73–82. [Google Scholar] [CrossRef]
  37. Ju, Y.; Shen, T.; Wang, D. Bonding behavior between reactive powder concrete and normal strength concrete. Constr. Build. Mater. 2020, 242, 118024. [Google Scholar] [CrossRef]
  38. Gao, D.; Chen, X.; Chen, G.; Zhang, L.; Zhan, Z. Shear-bond behaviour between concrete and hybrid fibre-reinforced cementitious composites for repairing: Experimental and modelling. J. Build. Eng. 2023, 64, 105636. [Google Scholar] [CrossRef]
  39. Skominas, R.; Gurskis, V.; Sadzevicius, R.; Damulevicius, V.; Radzevicius, A. Evaluation of cement mortar suitability for repairing concrete in hydraulic structures. KSCE J. Civ. Eng. 2017, 21, 2814–2820. [Google Scholar] [CrossRef]
  40. Daneshvar, D.; Behnood, A.; Robisson, A. Interfacial bond in concrete-to-concrete composites: A review. Constr. Build. Mater. 2022, 359, 129195. [Google Scholar] [CrossRef]
  41. Yehia, S.; Douba, A.E.; Abdullahi, O.; Farrag, S. Mechanical and durability evaluation of fiber-reinforced self-compacting concrete. Constr. Build. Mater. 2016, 121, 120–133. [Google Scholar] [CrossRef]
  42. ASTM C39/C39M; Standard Test Method for Compressive Strength of Cylindrical Concrete Specimens. ASTM International: West Conshohocken, PA, USA, 2021; pp. 1–8.
  43. ASTM C469-22; Standard Test Method for Static Modulus of Elasticity and Poisson’s Ratio of Concrete in Compression. ASTM International: West Conshohocken, PA, USA, 2022; Volume 4, pp. 1–5.
  44. ASTM C496/496M-17; Standard Test Method for Splitting Tensile Strength of Cylindrical Concrete Specimens. ASTM International: West Conshohocken, PA, USA, 2017; pp. 1–5.
  45. ASTM C1609/C1609M-19; Standard Test Method for Flexural Performance of Fiber-Reinforced Concrete (Using Beam with Third-Point Loading). ASTM International: West Conshohocken, PA, USA, 2019; pp. 1–9.
  46. ASTM C78-22; Standard Test Method for Flexural Strength of Concrete (Using Simple Beam with Third-Point Loading). ASTM International: West Conshohocken, PA, USA, 2022; pp. 1–3.
  47. BS EN 12615:1999; Products and Systems for the Protection and Repair of Concrete Structures. The British Standards Institution: London, UK, 1999; Volume 3.
  48. BS 1881-116:1983; Testing Concrete. British Standards Institution: London, UK, 2003; pp. 1–3.
  49. Tuan, C.Y.; Yehia, S. Evaluation of electrically conductive concrete containing carbon products for deicing. ACI Mater. J. 2004, 101, 287–293. [Google Scholar]
  50. Erdem, S.; Hanbay, S.; Blankson, M.A. Self-sensing damage assessment and image-based surface crack quantification of carbon nanofibre reinforced concrete. Constr. Build. Mater. 2017, 134, 520–529. [Google Scholar] [CrossRef]
  51. Cholker, A.K.; Tantray, M.A. Micro carbon fiber-based concrete as a strain-damage sensing material. Mater. Today Proc. 2019, 19, 152–157. [Google Scholar] [CrossRef]
  52. Chen, M.; Gao, P.; Geng, F.; Zhang, L.; Liu, H. Mechanical and smart properties of carbon fiber and graphite conductive concrete for internal damage monitoring of structure. Constr. Build. Mater. 2017, 142, 320–327. [Google Scholar] [CrossRef]
  53. Lee, S.H.; Kim, S.; Yoo, D.Y. Hybrid effects of steel fiber and carbon nanotube on self-sensing capability of ultra-high-performance concrete. Constr. Build. Mater. 2018, 185, 530–544. [Google Scholar] [CrossRef]
  54. Liu, Y.; Shi, C.; Zhang, Z.; Li, N.; Shi, D. Mechanical and fracture properties of ultra-high performance geopolymer concrete: Effects of steel fiber and silica fume. Cem. Concr. Compos. 2020, 112, 103665. [Google Scholar] [CrossRef]
  55. Karimipour, A.; Ghalehnovi, M.; de Brito, J. Mechanical and durability properties of steel fibre-reinforced rubberised concrete. Constr. Build. Mater. 2020, 257, 119463. [Google Scholar] [CrossRef]
  56. Keneth Celestine, A.; Prakash, M.; Satyanarayanan, K.S.; Rajah Surya, T.; Parthasarathi, N. The interpretation of mechanical study of concrete using crimped steel fibres. Mater. Today Proc. 2020, 40, S88–S92. [Google Scholar] [CrossRef]
  57. Ghoneim, M.; Yehia, A.; Yehia, S.; Abuzaid, W. Shear strength of fiber reinforced recycled aggregate concrete. Materials 2020, 13, 4183. [Google Scholar] [CrossRef]
  58. Wang, W.; Shen, A.; Lyu, Z.; He, Z.; Nguyen, K. Fresh and rheological characteristics of fiber reinforced concrete—A review. Constr. Build. Mater. 2021, 296, 123734. [Google Scholar] [CrossRef]
  59. Wani, T.A.; Ganesh, S. Study on fresh properties, mechanical properties and microstructure behavior of fiber reinforced self compacting concrete: A review. Mater. Today Proc. 2022, 62 Pt 12, 6663–6670. [Google Scholar] [CrossRef]
  60. ACI 318; An ACI Standard Building Code Requirements for Structural Concrete (ACI 318-19) Commentary on Building Code Requirements for Structural Concrete (ACI 318R-19). ACI: Farmington Hills, MI, USA, 2019.
  61. ACI-363-10; Report on High-Strength Concrete. American Concrete Institute: Farmington Hills, MI, USA, 2010.
  62. FIB-International. FIB Model Code; FIB: Lausanne, Switzerland, 2010; Volume 1. [Google Scholar]
  63. ENV 1992-1-1:1992; Eurocode 2: Design of Concrete Structures. British Standards Institution: London, UK, 2015; pp. 1–194.
  64. Kim, K.-C.; Yang, I.-H.; Joh, C. Effects of Single and Hybrid Steel Fiber Lengths and Fiber Contents on the Mechanical Properties of High-Strength Fiber-Reinforced Concrete. Adv. Civ. Eng. 2018, 2018, 7826156. [Google Scholar] [CrossRef]
  65. Suksawang, N.; Wtaife, S.; Alsabbagh, A. Evaluation of elastic modulus of fiber-reinforced concrete. ACI Mater. J. 2018, 115, 239–249. [Google Scholar] [CrossRef]
  66. Thomas, J.; Ramaswamy, A. Mechanical Properties of Steel Fiber-Reinforced Concrete. Mater. Civ. Eng. 2008, 19, 385–392. [Google Scholar] [CrossRef]
  67. Xu, B.W.; Shi, H.S. Correlations among mechanical properties of steel fiber reinforced concrete. Constr. Build. Mater. 2009, 23, 3468–3474. [Google Scholar] [CrossRef]
  68. Perumal, R. Correlation of Compressive Strength and Other Engineering Properties of High-Performance Steel Fiber–Reinforced Concrete. Mater. Civ. Eng. 2014, 27, 04014114. [Google Scholar] [CrossRef]
  69. Rashid, M.A.; Mansur, M.A.; Paramasivam, P. Correlations between Mechanical Properties of High-Strength Concrete. Mater. Civ. Eng. 2002, 14, 230–238. [Google Scholar] [CrossRef]
Figure 1. Summary of the experimental study carried out on SCC and CC.
Fibers 11 00106 g001
Figure 2. Configuration used for (a) direct shear specimen, (b) flexural prisms, (c) cylinders, and (d) slant shear prisms.
Fibers 11 00106 g002
Figure 3. Image summary of applied roughness on concrete bond interfaces. Cylinders are shown in (a,b). Prisms are shown in (cf).
Fibers 11 00106 g003
Figure 4. Special mold design for the shear key surface preparation.
Fibers 11 00106 g004
Figure 5. Cylinder experimental tests for (a) compressive strength, (b) modulus of elasticity, and (c) split tension. The strain gauge (SG) locations are shown on the cylinders.
Fibers 11 00106 g005
Figure 6. (a) Slant shear test preformed on a prism sample in UTM hydraulic machine. (b) Direct shear sketch with dimensions (mm) and strain gauge positioning. (c) Direct shear test setup.
Fibers 11 00106 g006
Figure 7. Conductive concrete flexural sample results with a visual rep of peak load, L/600, and L/150 position on a load versus deformation graph.
Fibers 11 00106 g007
Figure 8. General failure modes for compression and MOE samples.
Fibers 11 00106 g008
Figure 9. General failure modes for flexure samples.
Fibers 11 00106 g009
Figure 10. (ah) General failure modes for slant shear samples. (i) Slant shear with SK surface preparation failure modes for (i.1) crushing failure, (i.2) bond failure, and (i.3) combination of both.
Fibers 11 00106 g010
Figure 11. Split tension failure modes for (a) SCC sample and (b) CC sample. Direct shear failure modes: (c,d) for SCC samples and (e) for CC sample.
Fibers 11 00106 g011
Figure 12. MOE ( E ) and normalized MOE ( E n ) for different concrete mixes and casting types.
Fibers 11 00106 g012
Figure 13. Flexure ( f r ) and normalized flexure ( f r n ) for different concrete mixes and casting types.
Fibers 11 00106 g013
Figure 14. Shear ( S ) and normalized shear ( S n ) for different concrete mixes and casting types.
Fibers 11 00106 g014
Figure 15. Stress–strain graphs for (a) CC samples and (b) SCC samples.
Fibers 11 00106 g015
Figure 16. Load versus deflection graphs of conductive concrete flexural strength control samples: (a) samples prepared from batches M5 and M7, and (b) samples prepared from batches M1 and M3.
Fibers 11 00106 g016
Figure 17. Perpendicular stress–strain graph of CC with (a) rough and (b) shear key surface preparations and SCC with (c) rough and (d) shear key surface preparations.
Fibers 11 00106 g017
Figure 18. Split tension test on (a) four CC samples (S1, S2, S3, S4) and (b) three SCC samples (S1, S2, S3), showing strain gauge (SG) readings of tensile stress vs. horizontal strain.
Fibers 11 00106 g018
Figure 19. Direct shear test on CC, including (a) load and vertical strain as well as (b) load and horizontal strain graphs, and on SCC, including (c) load and vertical strain as well as (d) load and horizontal strain graphs.
Fibers 11 00106 g019
Figure 20. Stress–strain graph; wet-to-dry samples.
Fibers 11 00106 g020
Figure 21. Prism results for wet-to-dry casting sequence for (a) WCDN-R, (b) WNDC-R, (c) WCDN-S, and (d) WNDC-S.
Fibers 11 00106 g021
Figure 22. Perpendicular stress–strain graphs of (a) WCDN, (b) WNDC samples with rough (R1, R2) and smooth (S1, S2, S3) surface preparation, (c) WCDN, and (d) WNDC samples with shear key (SK) surface preparation.
Fibers 11 00106 g022
Figure 23. Stress–strain graph and wet-to-wet samples cast from batches M3, M4, M7, and M8.
Fibers 11 00106 g023
Figure 24. Prism results for wet-to-wet casting sequence for (a) WCWN, (b) WNWC from M5, M6 and (c) WCWN, (d) WNWC from M1, M2.
Fibers 11 00106 g024
Figure 25. Perpendicular stress–strain graph and wet-to-wet samples cast from batches M5 and M6.
Fibers 11 00106 g025
Figure 26. MOE theoretical and experimental comparison of SCC and CC mixes.
Fibers 11 00106 g026
Figure 27. Flexural strength theoretical and experimental comparison of SCC and CC mixes.
Fibers 11 00106 g027
Figure 28. Split tension theoretical and experimental comparison of SCC and CC mixes.
Fibers 11 00106 g028
Table 1. Summary of results of mechanical properties and bond strength.
TestSample Size (mm)Testing CodeSample Prep.No. of Samples f c (MPa)
Compression100 × 200 (S)
150 × 300 (L)
ASTM C39 [42]Control N, 28D2S & 2L63.5
Control C, 28D2S & 2L52.5
Control N, 90D1S & 7L68.4
Control C, 90D1S & 9L60
WCDN-R, 90D4L66.5
WNDC-R, 90D3L51.3
WCDN-S, 90D1S65.1
WNDC-S, 90D2L63.8
WCWN, 90D2S & 6L66.3
WNWC, 90D1S & 6L65.5
TestSample Size (mm)Testing CodeSample Prep.No. of Samples E (GPa) (v)
MOE150 × 300ASTM C39 [42] (Loading)
ASTM C469 [43] (Calculations)
Control N, 90D4L35.1 (0.28)
Control C, 90D6L24.7 (0.24)
WCWN, 90D3L25.5 (0.24)
WNWC, 90D3L23.9 (0.16)
WCDN-R, 90D2L30.0 (0.27)
WNDC-R *, 90D--
WCDN-S *, 90D--
WNDC-S *, 90D--
TestSample Size (mm)Testing CodeSample Prep.No. of Samples f r (MPa)
Flexure100 × 100 × 500ASTM C1609 [44]WCWN, 28D54.7
Including steel fiberWNWC, 28D412.3
WCDN-S, 28D22.9
WCDN-R, 28D33.8
WNDC-S, 28D37.8
WNDC-R, 28D313.1
ASTM C78 [45]Control C, 28D9 full15.0
Excluding steel fiberControl N, 28D12 full3.8
TestSample Size (mm)Testing CodeSample Prep.No. of SamplesBond Shear (MPa)
Slant Shear100 × 100 × 500
Figure 2a
BS EN 12615:1999 [46]
loading rate + inclination angle
WCWN, 90D327.2
WCDN-S, 90D313.3
WCDN-R, 90D228.1
WNDC-S, 90D25.2
WNDC-R, 90D210.8
WCDC-R, 90D3 full15.0
WNDN-R, 90D3 full27.1
WCDC-SK, 28D3 full19.6
WNDN-SK, 28D3 full14.4
WCDN-SK, 28D316.5
WNDC-SK, 28D317.7
TestSample Size (mm)Testing CodeSample Prep.No. of Samples T (MPa)
Split Tension150 × 300ASTM C496/C496M-17 [47]Control N, 28D43.8
Control C, 28D47.9
TestSample Size (mm)Testing CodeSample Prep.No. of SamplesShear Strength (MPa)
Direct ShearFigure 2aLoading based on BS 1881 [48]Control N, 28D38.4
Control C, 28D519.9
(*) indicates that the samples separated; strain readings were disturbed during testing.
Table 2. Flexural residual capacity.
Sample PreparationAvg. L/600 (MPa)Avg. L/150 (MPa)
WCWN, 28D3.93.9
WNWC, 28D11.36.8
WCDN-S, 28D2.62.8
WCDN-R, 28D2.73.2
WNDC-S, 28D6.34.3
WNDC-R, 28D11.58.1
Control C, 28D14.411.0
Control N, 28D--
Table 3. Slant shear—SK samples’ failure summary.
SampleFailure Criteria *Avg. Shear Stress (MPa)
WCDC-SK-1b19.6
WCDC-SK-2a19.6
WCDC-SK-3a19.6
WNDN-SK-1c14.4
WNDN-SK-2c14.4
WNDN-SK-3a14.4
WCDN-SK-1b16.5
WCDN-SK-2a16.5
WCDN-SK-3b16.5
WNDC-SK-1a17.7
WNDC-SK-2a17.7
WNDC-SK-3c17.7
* (a) crushing failure, (b) bond failure, and (c) combination of both.
Table 4. Used codes’ mechanical property equations.
TestEquation No.ACI-318 (MPa)ACI-363 (MPa)FIB 2010 (MPa)Eurocode 2
MOE(8) 0.043 w c 1.5 f c 320 f c + 6900 ; 21 < f c < 83 E = 25800 f c m / 10 1 / 2   ;
basalt, dense limestone aggr.
E c m = 9.5 f c k + 8 1 / 3
(9) 4700 f c 3.385 × 10 5 w c 2.5 f c 0.325 ; f c < 84 E = 21500 f c m / 10 1 / 2 ;
quartzite aggr.
-
(10)- 14495 + 2176 f c E = 19400 f c m / 10 1 / 2 ;
limestone aggr.
-
(11)- 9500 f c 0.3 ; 25 < f c < 85 E = 15100 f c m / 10 1 / 2 ;
limestone aggr.
-
(12)- 3.385 × 10 5 × w c 2.55 f c 0.315 --
Flexure(13)0.62 f c 0.94 f c   ; 21 < f c < 83 --
(14)- 0.25 f c 0.79 ; moist, steam cured--
Split
Tension
(15) 0.56 f c 0.5 0.59 f c 0.5 ; 21 < f c < 83 f c t m = 0.3 f c k 2 / 3   ; f c 50 f c t m = 0.3 f c k 2 / 3
(16)- 0.32 f c 0.63 f c t m = 2.12 ln 1 + 0.1 f c k + 8 ; f c > 50 -
Table 5. Published equations for mechanical properties.
TestEquation No.EquationRef.
MOE(17) E c = 3360 f c k ; f c k 200   M P a [64]
(18) E c = 4700 × 0.5 1 + 0.7 V f f c [65]
(19) E c = 4.2 f c y ; 30   M P a < f c y < 75   M P a [66]
Flexure(20) f c t = 0.42 0.6 + V f f c [64]
(21) f f t = 0.39 f c s 0.59 [67]
(22) f r f = 0.259 f c f 0.843 [68]
(23) f r = 0.42 f c 0.68 ;   5   M P a < f c < 120   M P a [69]
(24) f f l = 0.79 f c y   ; 30   M P a < f c y < 75   M P a [66]
Split
Tension
(25) f s p t = 0.21 f c s 0.83 [67]
(26) f s p f = 0.188 f c f 0.84 [68]
(27) f s p = 0.47 f c 0.56 ; 5   M P a < f c < 120   M P a [69]
(28) f s p c = 0.57 f c y   ; 30   M P a < f c y < 75   M P a [66]
Disclaimer/Publisher’s Note: The statements, opinions and data contained in all publications are solely those of the individual author(s) and contributor(s) and not of MDPI and/or the editor(s). MDPI and/or the editor(s) disclaim responsibility for any injury to people or property resulting from any ideas, methods, instructions or products referred to in the content.

