Article

Experimental and Modeling Studies of Bond Coat Species Effect on Microstructure Evolution in EB-PVD Thermal Barrier Coatings in Cyclic Thermal Environments

1
School of Materials and Metallurgy Engineering, University of Science and Technology Liaoning, No. 185 High-Tech District, An Shan 114051, China
2
School of Materials Science and Engineering, Changwon National University Changwon, Gyeongnam 51140, Korea
3
Department of Mechanical and Energy Engineering, Indiana University-Purdue University Indianapolis, Indianapolis, IN 46202-5132, USA
*
Author to whom correspondence should be addressed.
Coatings 2019, 9(10), 626; https://doi.org/10.3390/coatings9100626
Submission received: 26 July 2019 / Revised: 10 September 2019 / Accepted: 11 September 2019 / Published: 28 September 2019
(This article belongs to the Special Issue Science and Technology of Thermal Barrier Coatings)

Abstract

:
In this work, the effects of bond coat species on the thermal barrier coating (TBC) microstructure are investigated under thermal cyclic conditions. The TBC samples are prepared by electron beam-physical vapor deposition with two species of bond coats prepared by either air-plasma spray (APS) or high-velocity oxygen fuel (HVOF) methods. The TBC samples are evaluated in a variety of thermal cyclic conditions, including flame thermal fatigue (FTF), cyclic furnace thermal fatigue (CFTF), and thermal shock (TS) tests. In FTF test, the interface microstructures of TBC samples show a sound condition without any delamination or cracking. In CFTF and TS tests, the TBCs with the HVOF bond coat demonstrate better thermal durability than that by APS. In parallel with the experiments, a finite element (FE) model is developed. Using a transient thermal analysis, the high-temperature creep-fatigue behavior of the TBC samples is simulated similar to the conditions used in CFTF test. The FE simulation predicts a lower equivalent stress at the interface between the top coat and bond coat in bond coat prepared using HVOF compared with APS, suggesting a longer cyclic life of the coating with the HVOF bond coat, which is consistent with the experimental observation.

1. Introduction

Thermal barrier coatings (TBCs) are insulating overlayers deposited on superalloy substrates, which are usually employed in high-temperature components of gas turbines. TBCs reduce the surface temperature of the metallic component substrate, improving the thermal durability and increasing the fuel efficiency in gas turbines [1,2,3,4,5,6]. The TBC is usually comprised of four different layers: (1) a ceramic top coat, (2) a metallic bond coat, (3) a Ni- and/or Co-based superalloy substrate, and (4) a thin thermally grown oxide (TGO) layer. The TGO layer acts as a protective layer to retard the thermal and oxidation diffusion. However, the TGO layer may increase the internal stress in TBC systems, which causes potential cracking at the interface between the bond and top coats, eventually leading to spallation or delamination of the top coat [7,8,9,10]. The bond coat in a TBC system is to ensure the structural integrity and to protect the superalloy substrate from oxidation. Moreover, the metallic bond coat can reduce the coefficient of thermal expansion (CTE) mismatch between the superalloy substrate and the ceramic top coat, and enhance adhesion with the top coat [11,12,13,14,15]. The bond coat can be deposited by a variety of thermal spraying processes, such as vacuum plasma spray, high-velocity oxygen fuel (HVOF), and air-plasma spray (APS). Although MCrAlY (M = Ni and/or Co) feedstock has been used for a bond coat for several decades, the failure of the TBC system is often resulted from the thermomechanical mismatch between the bond and top coats. The durability and stability of TBC systems can be improved by reducing the CTE mismatch between the top and bond coats, decreasing the excessive TGO layers, and eliminating the resultant residual stresses. For example, TGO layer growth may be modified through powder oxidation which forms a duplex oxide scale with an outer layer and an inner Al2O3 layer composed of NiAl2O4, Cr2O3, and other spinel structures [16].
In the present study, a new combined experimental and modeling study of the effect of bond coat species on the microstructure evolution of electron beam-physical vapor deposition processed (EB-PVD) yttria stabilized zirconia (YSZ) TBCs is conducted. Three types of thermal exposure tests, i.e., flame thermal fatigue (FTF), cyclic furnace thermal fatigue (CFTF), and thermal shock (TS), are employed in order to understand the TBCs’ thermomechanical properties in thermal cyclic environments. A finite element (FE) model is developed to simulate the distribution of stresses in different bond coats and thermal exposure environments. The relationship between coating failure behavior and the bond coat is investigated, based on the microstructure evaluation in the thermal cyclic tests.

2. Experimental Procedure

2.1. Coating Materials and Sample Preparation

In this study, Ni-based superalloy (GTD–111, with the nominal composition of Ni–14Cr–9.5Co–4.9Ti–3.8W–3Al–2.8Ta–1.5Mo–0.1C–0.03Zr, in wt.%) is used as the substrate. The diameter and thickness of the test specimen are 25.4 and 5 mm, respectively. The surface of the substrate is blasted using an alumina powder, cleaned before coating processes, and then the coatings are deposited within 2 h. AMDRY 962 (Nominal composition of Ni–22Cr–10Al–1.0Y in wt.% and particle size of 56–106 μm; Sulzer Metco Holding AG, Winterthur, Switzerland) and AMDRY 9951 (Nominal composition of Co–32Ni–21Cr–8Al–0.5Y in wt.% and particle size of 5–37 μm; Sulzer Metco Holding AG) are used as the feedstock powders to fabricated the bond coats by APS and HVOF process, respectively. The top coat is formed by the EB-PVD process on the bond coats using 204C-NS (particle size of 45–140 μm, Oerlikon Metco AG, Pfäffikon, Switzerland). The thicknesses of the bond and top coats are designed as 300 ± 20 and 600 ± 50 μm, respectively. In the spray process of TBCs, the parameters recommended by the Chrome-Alloying Co. Ltd (London, UK) are employed.

2.2. Characterizations

To obtain the cross-sectional microstructure and mechanical properties of the TBCs, the specimens are cold-mounted with an epoxy resin and then polished using SiC papers and finally polished with 3 and 1 μm diamond pastes in sequence. The cross-sectional microstructures of TBC samples are observed using a scanning electron microscope (SEM; Model JSM–5610, JEOL, Tokyo, Japan). The hardness of the coatings is determined using a microindentor (HM-114, Mitutoyo Corp., Kanagawa, Japan) with a Vickers tip for a load of 3 N [17]. More than 10 indentation points are measured for achieving statistical results. The sizes of hardness impression are measured using the SEM and all experiments are performed at a room temperature. The adhesive strength of the TBC samples is determined following the American society for testing and materials (ASTM) standard (ASTM C-633-01) [18].

2.3. Cyclic Furnace Thermal Fatigue, Flame Thermal Fatigue, and Thermal Shock Tests

CFTF test are performed for all samples in a specially designed programmable furnace until 1429 cycles. The surface of the sample is about 1100 °C and the backside of the sample is air-cooled to keep the temperature difference of 150 °C. The dwell time is 60 min. Then the samples are cooled in a static air environment for 10 min. FTF tests are also performed for 1429 cycles using liquefied petroleum gas as the heating source. The top surface of sample is heated with flame of about 1100 °C for 5 min. Then the samples are cooled in a static air environment for 25 min. The criterion of failure in FTF test is defined as over 25% spalling of top coat. The TBC samples are cycled to the failure criterion for observing indication of failure. For TS tests, the TBC samples are heated in a muffle furnace till 1100 °C for 60 min, then the samples are directly quenched in water for 5 min. The water temperature is kept at 20–35 °C during the test. For failure criteria, over 50% of the spalled region in top coat is used [19,20,21,22]. In TS tests, more than five specimens are tested to achieve statistical results.

3. Model Details

3.1. Finite Element Model

Due to symmetry, a two-dimensional (2D) axisymmetric FE model of TBCs is developed to simulate the coating behavior in CFTF test conditions, and correlate the predictions with the experimental observations. The model consists of an YSZ coat (top), NiCrCoAlY bond coat (middle), and Inconel 718 substrate (bottom). Because the TGO layer is very thin, it is not included in the model. The dimensions of the TBCs are consistent with those described in Section 2.1. The computation is conducted using FE software ANSYS Workbench (ANSYS 19) with PLANE182 axisymmetric element type.

3.2. Properties of Materials Used in the FE Model

To evaluate the thermal cyclic effect on the TBCs, the fatigue-creep behavior of the bond coat is focused on as a potential contributor leading to TBCs failure. The creep of the bond coat leads to TBC system failure and spalling due to differential stresses in the coating layers during thermal cycling. This means that life prediction of the TBC system must take into account of the fatigue-creep of the bond coat.
In this FE model, a secondary steady-state creep equation is incorporated to account for high-temperature creep, using Norton power-law creep (ɛ = Aσn). The temperature-dependent creep constants “A” and “n” for YSZ, Inconel 718, and NiCoCrAlY bond coat made using HVOF and APS [23,24] are noted in Table 1. The materials properties of YSZ [25], bond coat [25], and substrate Inconel 718 [26] as listed in Table 2.

3.3. Boundary Conditions

A transient thermomechanical analysis is conducted with the same cycle timings and boundary conditions as CFTF test described in Section 2.3. In transient thermal analysis, a single cycle of total 4200 s, with 3600 s of constant heating at 1100 °C, is followed by 600 s of cooling at ambient thermal conditions of 25 °C. The convection coefficient between samples and the environment is assumed as 25 W/(m2·°C). Because the TBC samples are rested on a sample holder, the bottom surface is assumed to be perfectly insulated.

4. Results and Discussion

4.1. The Microstructure Analysis

The cross-sectional microstructures of the TBC samples are shown in Figure 1, where Figure 1(a–1,b–1) are the microstructures of the bond coats fabricated by APS and HVOF, respectively. The top layers of all the samples are prepared by the same method using the EB-PVD method. The top coat of all the coating systems show a columnar structure with small gaps between the columns. The gaps develop from the interface between the top and bond coats to the coating surface. The fine inter columnar pores are mostly aligned to the heat flow direction. These pores help reducing the thermal conductivity of TBC systems. The interface of the TBC samples (Figure 1(a–2,b–2)) shows no cracks and a relatively flat shape. A thin TGO layer about 1–2 μm is found at the interface of each samples without thermal tests. The heat treatment for deposition of the top coat is the main reason for the formation of the thin TGO layer. The dense TGO layer can prevent oxygen diffusing into the bond coat. The bond coat prepared by APS shows several intrinsic defects, such as unmelted particles, oxides, and pores. The microstructures of bond coats that prepared by HVOF are denser and don’t have oxide formation and interlayer cracks.

4.2. Service Life of TBC Systems

The cross-sectional microstructures of TBCs with different bond coats after FTF tests are shown in Figure 2. During cyclic thermal exposure tests, the ceramic top coat appear starting sintering phenomenon. The microstructures of the top coats are more compact and the porosity is reduced due to the densification during the sintering process.
After FTF tests, the interface microstructures are very similar to each other, compared with the as-prepared samples. There is no cracking or delamination in the interface microstructures of each TBC system, as shown in Figure 2(a–2,b–2). The relatively short heating time (5 min) and continuous high-temperature time of the interface (only 2 min) result in that the TGO layer is not fully developed after 1429 cycles. The total heating time is only 119 hours. The thickness of the TGO layer is in the range of 2–3 μm without substantial increase.
Figure 3 shows the cross-sectional microstructures of each TBCs system after CFTF tests. The APS and HVOF bond coats (Figure 3(a–1,b–1)) are delaminated at the interface between the TGO layer and the bond coat in the range of 100–380 and 210–390 cycles, respectively. The APS bond coat shows more degree of oxidation in the interbond coat after CFTF test compared with APS bond coat without any test. The oxidation of the bond coat leads to a change in the sign of stresses due to the smaller CTEs of the TGO layer. It is assumed that small cracks will be created at the peak tips [27]. After CFTF test, the HVOF bond coat shows a different oxidation behavior compared with APS bond coat. No internal oxides are found, but element segregation occurs.
The service lives of the all the TBC systems are summarized in Figure 4. The safe zone of the TBC systems with the HVOF bond coat is twice that with the APS bond coat, although they can reach the same ultimate lifetime. After CFTF tests, the HVOF bond coat TBCs (Figure 3(b–2)) show a diffusion zone near the interface, indicating that these elements are involved in the late reaction to form the TGO consisting of mixed oxide clusters [28]. The increase of the thickness of the TGO layer leads to TBC system failure. In addition, the TBCs with the APS bond coat show a different oxidation behavior. The outer APS bond coat near the interface of the top and bond coats shows a diffusion zone similar to the HVOF bond coat, while the inter-APS bond coat has more oxidation. The lifetime of the TBCs indicates that the TBC systems with the HVOF bond coat show a better thermal durability than those with the APS bond coat.
Figure 5 shows the cross-sectional microstructures of the TBCs after TS tests. It shows a typical mode of delamination at the interface between the bond coat and the TGO layer. During the thermal shock process, a large temperature difference is developed between the substrate and the top coat, which causes thermal or residual stresses at the interface between the TGO layer and the bond coat. When the TGO layer reaches a certain thickness in cyclic thermal fatigue, the TBC will be cracked or delaminated at the interface between the TGO layer and the bond coat, owing to the relatively low adhesive strength of the TGO layer and bond coat in the EB-PVD TBC system. In addition, the mismatch in the CTEs between the ceramics layer, TGO layer, and the bond coat leads to delamination and failure. In TS test, the lifetime of TBCs with the HVOF bond coat is obviously longer than those with the APS bond coat. The TBCs with the HVOF bond coat are delaminated in the range of 345–372 cycles, whereas the TBCs with the APS bond coats are delaminated in the range of 44–80 cycles, showing an aluminum depletion region in the HVOF bond coats similar to that after CFTF test. The results of thermal durability for the TBCs with different bond coats are summarized in Table 3 as a function of thermal exposure species.

4.3. Mechanical Properties

The hardness values of top coats before and after cyclic thermal exposure, which were measured using a Vickers indentation method, are shown in Figure 6.
The indentation tests are conducted on the samples’ sectional planes. For the as-prepared samples, the hardness values of top coats, APS and HVOF bond coats, are determined to be 3.1 ± 0.3 (mean ± standard deviation) and 3.0 ± 0.3 GPa, respectively. After FTF tests, the hardness values of top coats are increased to 3.6 ± 0.4 and 3.4 ± 0.3, 3.3 ± 0.3 GPa for the APS and HVOF bond coats, respectively. The increase in the hardness values after FTF tests is due to the reduction of gaps between the adjacent columns, which is consistent with the microstructure evolution (Figure 2a,b). The microstructure evolution of the EB-PVD top coat is more advanced in CFTF and TS tests. The microstructure is densified owing to resintering in CFTF and TS tests, resulting in the disappearance of space between the columns and showing the delamination of the top coat at the interface between the TGO layer and the bond coat.
Adhesive strength is an important mechanical property for TBC systems, with a direct connection to interface stability. Therefore, the adhesive strength values of samples are measured before and after FTF test, which are shown in Figure 7. For the as-prepared samples with APS and HVOF bond coats, the adhesive strength values are determined to be 66.8 ± 5.4 and 76.9 ± 1.2 MPa, respectively. After FTF tests, the adhesive strength values of the samples with APS and HVOF bond coats are determined to be 35.7 ± 13.1 and 70.1 ± 8.9 MPa, respectively. The adhesive strength values of the samples with APS bond coats show a significant decrease, due to the TGO growth and internal APS bond coat oxidation behavior during FTF tests. The TBCs with HVOF bond coats show no obvious change after FTF test by virtue of the HVOF bond having a better oxidation resistance than APS bonds.
The surface photographs and cross-sectional microstructures of the as-prepared samples after measuring the adhesive strength are shown in Figure 8. All of the as-prepared samples are completely delaminated near the interface between the jig fixture and the epoxy adhesive, indicating that the adhesive strength of the EB-PVD is sufficiently high.
The surface and cross-sectional microstructures after measuring the adhesive strength values for the TBCs after FTF tests for 1429 cycles are shown in Figure 9.
The fracture microstructure of the samples with APS bond coat is entirely different from the samples with HVOF bond coat. Adhesive failure, such as cracking, fragmentation, and spallation, in the samples with APS bond coat is initiated near the interface between the TGO layer and the bond coat with a complete delamination. The samples with the HVOF bond coats are completely delaminated near the interface between the jig fixture and the epoxy adhesive, indicating that the interface stability of the sample with HVOF bond coat is better than that with APS bond coat. Therefore, the samples with the HVOF bond coats will provide a superior TBC performance in cyclic thermal exposure environments.

4.4. Simulated Temperature Evolution

Under cyclic thermal conditions, the temperature response of TBCs increases in a transient manner initially and reaches a steady-state temperature after approximately 700 s. The temperature falls rapidly during the cooling phase. The temperature evolution is shown in Figure 10.
The temperature distribution of TBCs is shown in Figure 11, during the transient heating and cooling phases. Figure 11a,b shows the results of the two bond coats. Because the thermal conductivity of TBCs is similar in both APS and HVOF, the temperature distribution is similar in both cases.

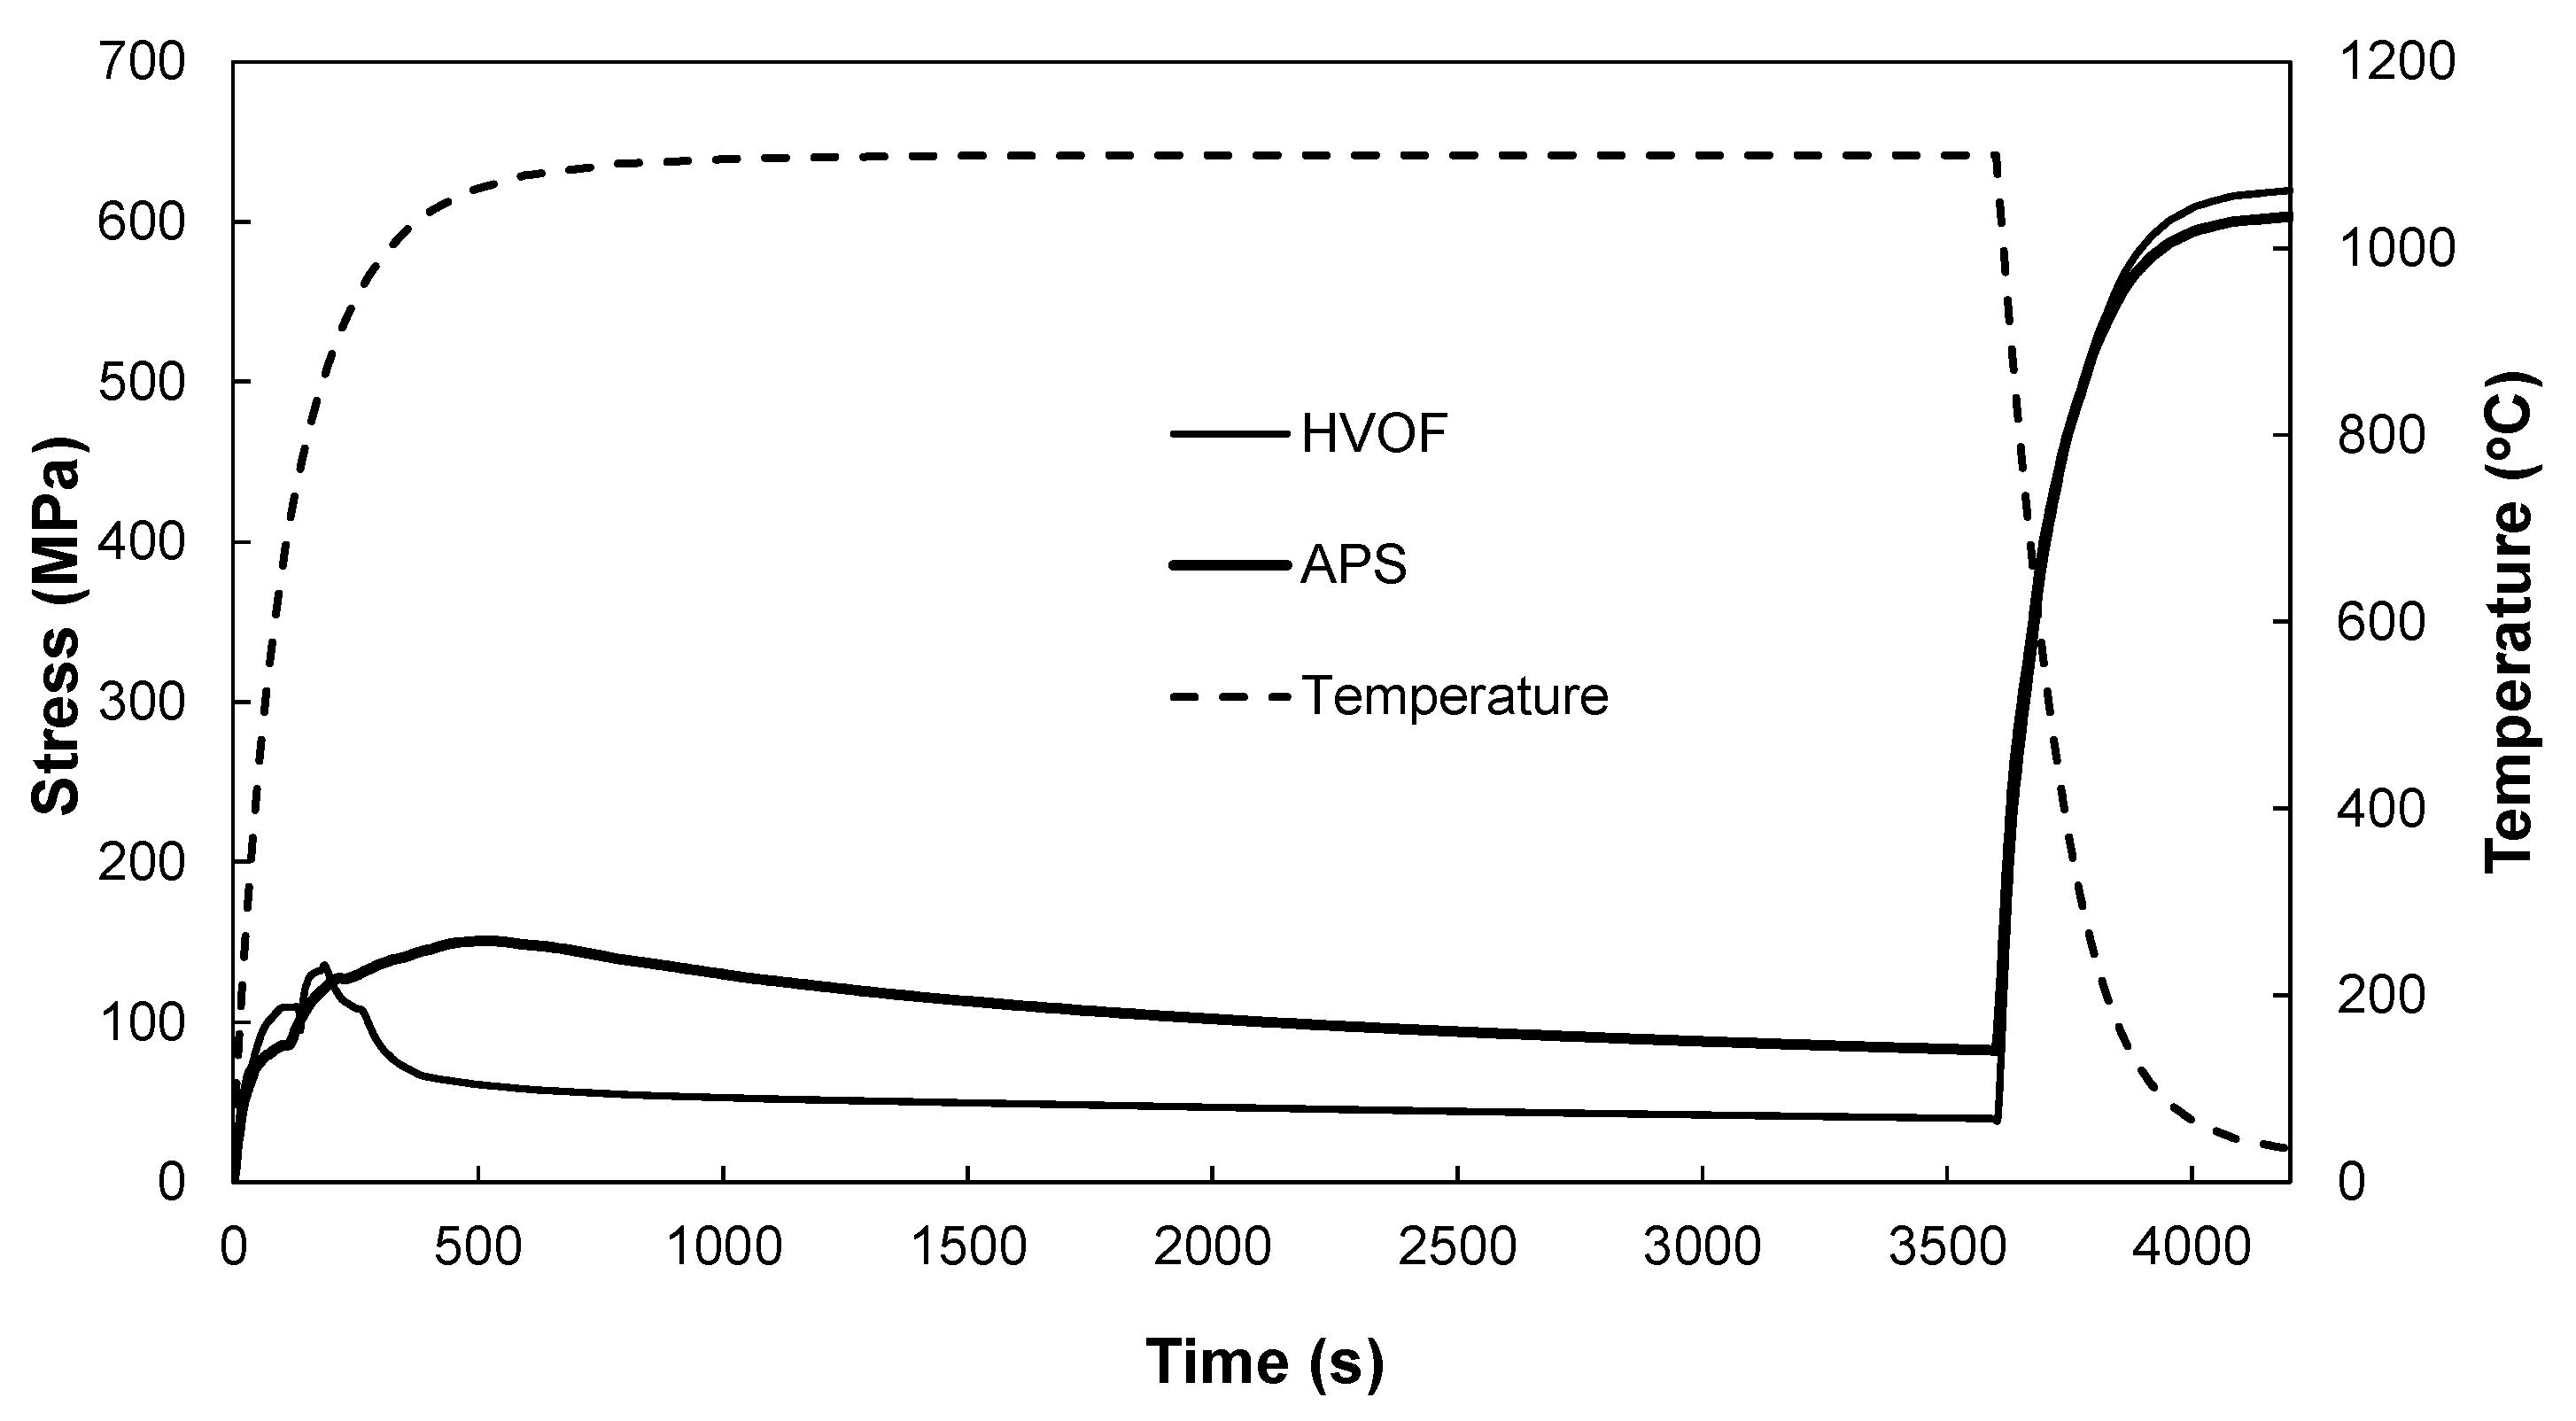
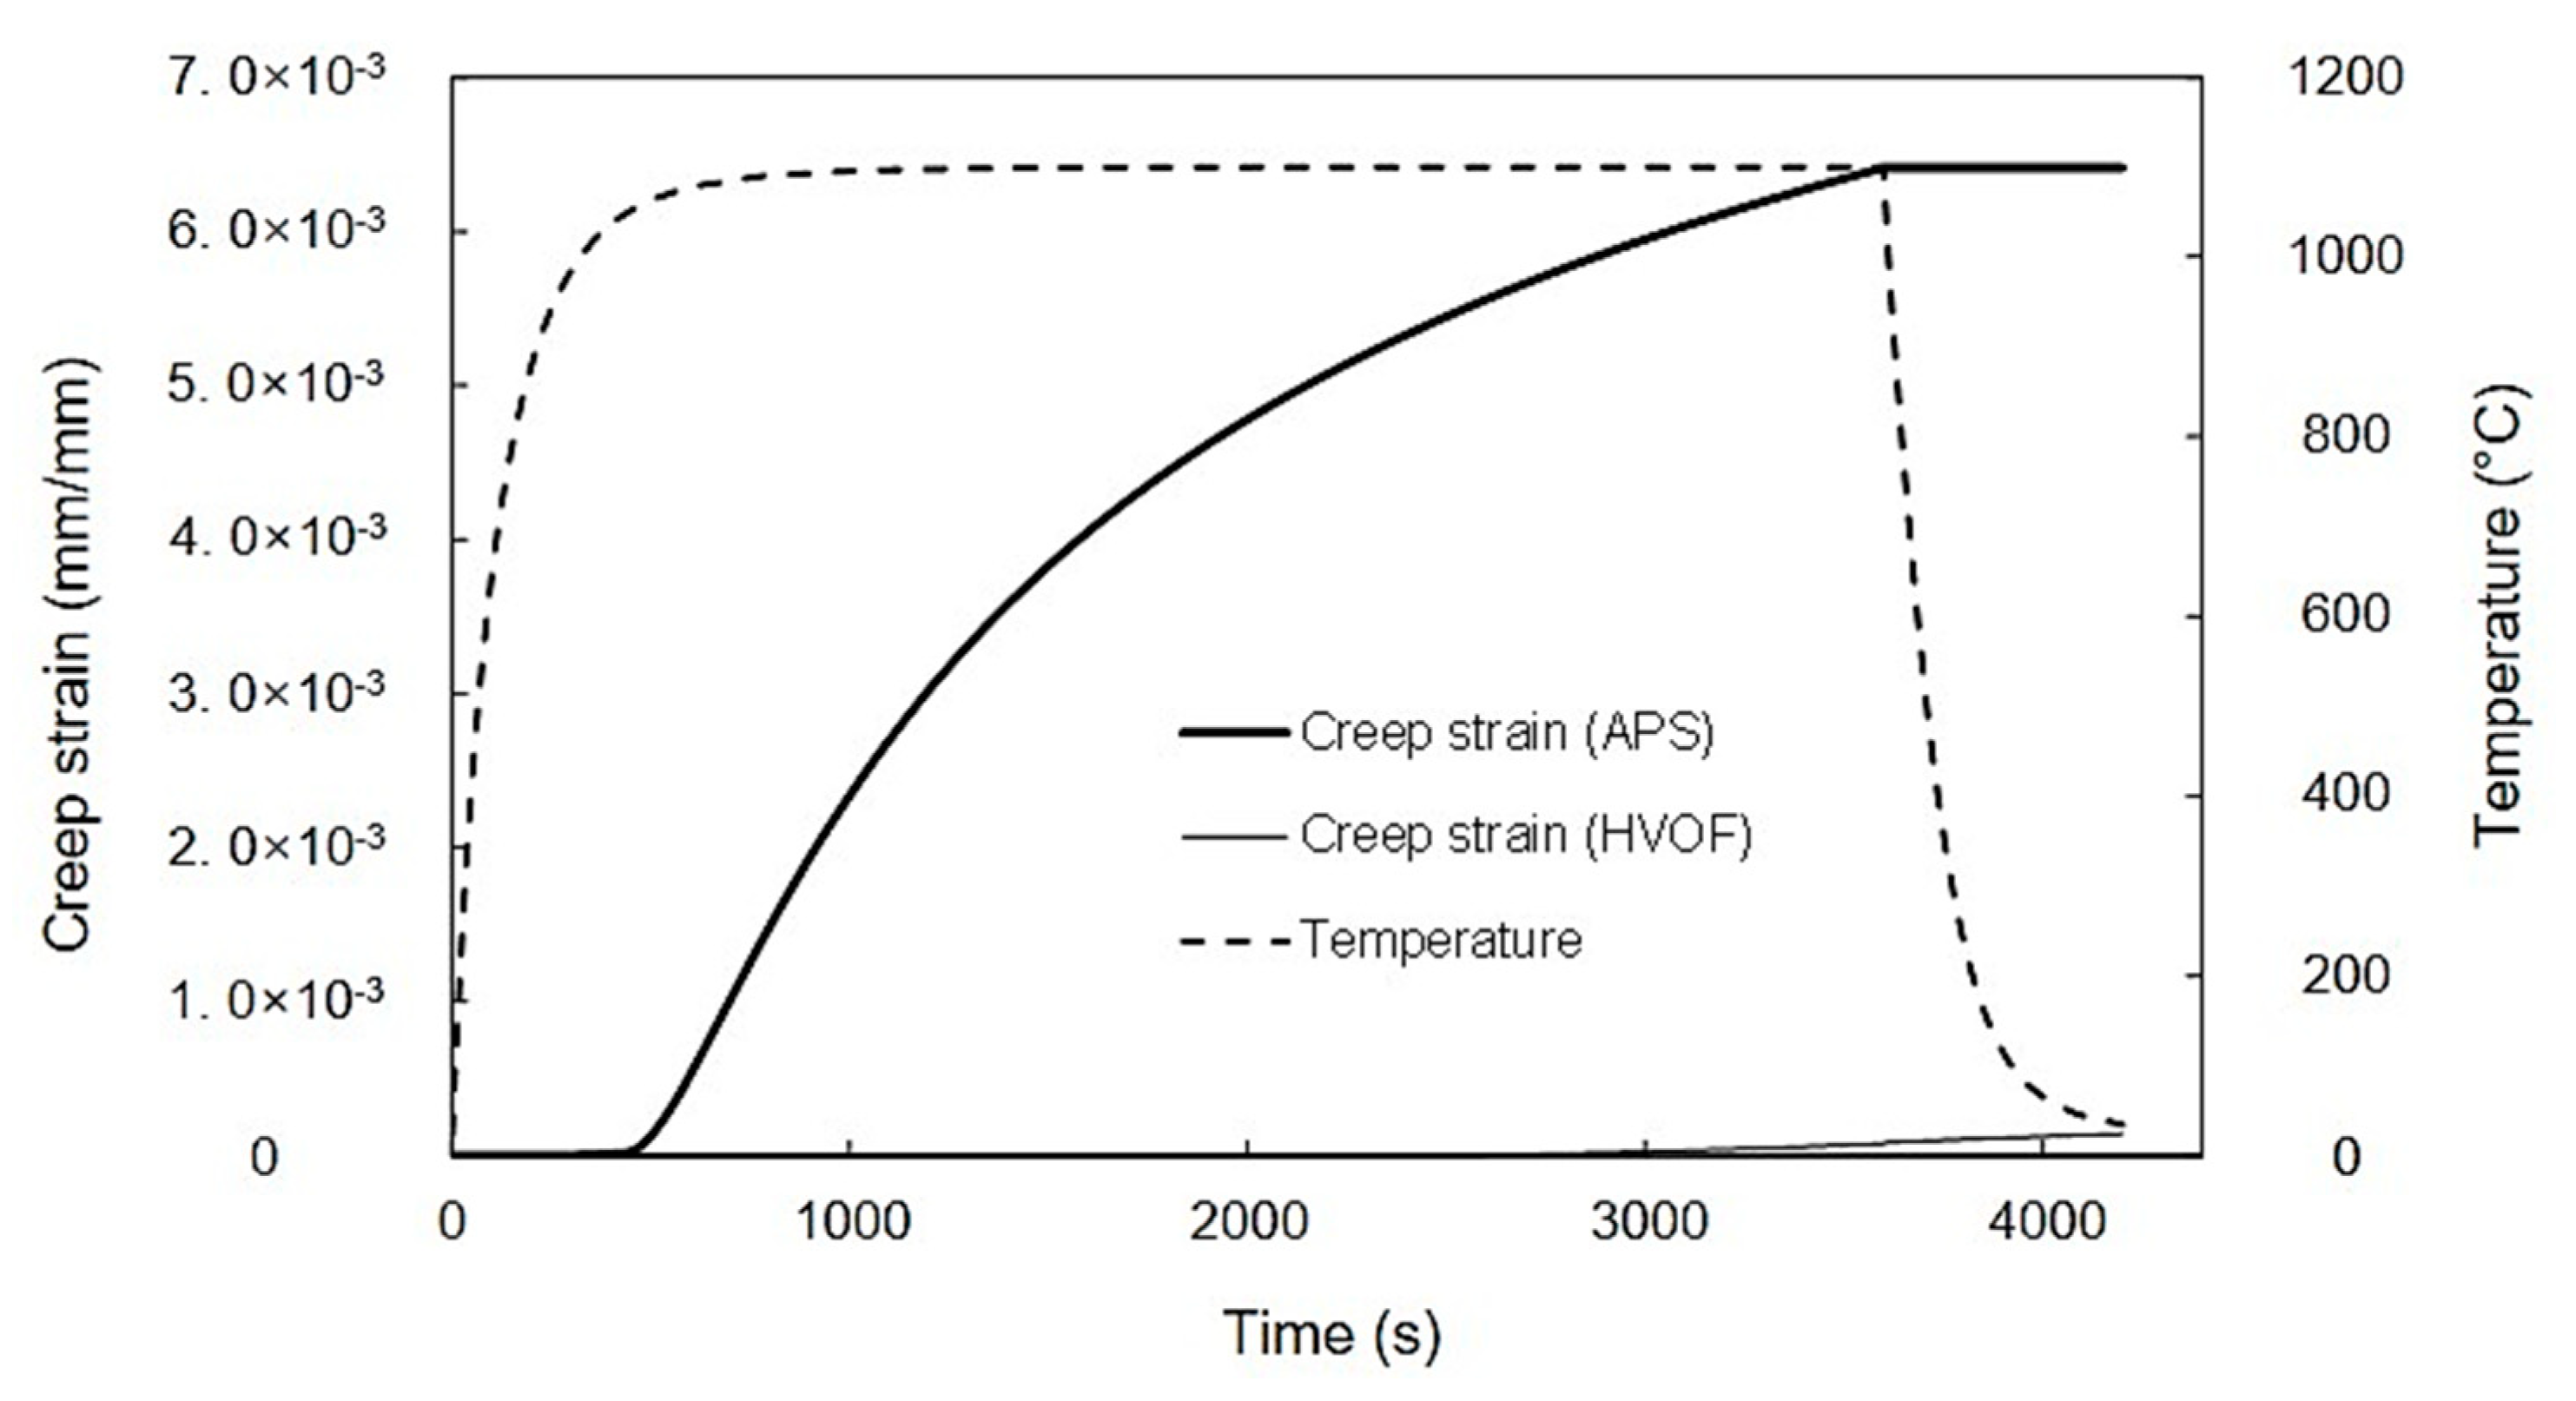
4.5. Simulated Stress and Creep Strain Evolutions

Figure 12 shows a comparison of the equivalent von Mises stress of TBCs in both cases at the end of the heating cycle, i.e., at 3600 s. In both cases, the maximum stresses are observed at the interface between the bond coat and substrate. For the APS deposited bond coat (Figure 12a), the maximum stress is about 83 MPa, and the stress difference within the bond coat is large. In comparison, the maximum stress in the HVOF deposited bond coat (Figure 12b) is only about 40 MPa, so the stress variation within the coat is less than the APS case.
A comparison of equivalent stress evolution in the YSZ layer in response to temperature in both cases is plotted in Figure 13. The results are extracted from the extreme node at the interface of YSZ and bond coat, indicated by “Max” in Figure 12.
In the case of a bond coat made using the HVOF process, the equivalent stress increases with a corresponding increasing temperature until 750 °C. The creep constants are defined to actuate at 750 °C, and thus a stress relaxation is observed once the temperature is beyond 750 °C. The relaxation in the case of TBCs made using APS is not as steep—it relaxes gradually until the end of the heating cycle. In addition, creep strain in the YSZ layer is plotted on the same location (Figure 14). It is evident that in the case of bond coat prepared using HVOF, the induced creep strain is significantly lower than with APS, suggesting that the HVOF bond coat has a better cyclic life.

5. Conclusions

The effects of bond coat species on the thermal durability of EB-PVD TBC samples are investigated through cyclic thermal exposure tests. The major conclusions are summarized below.
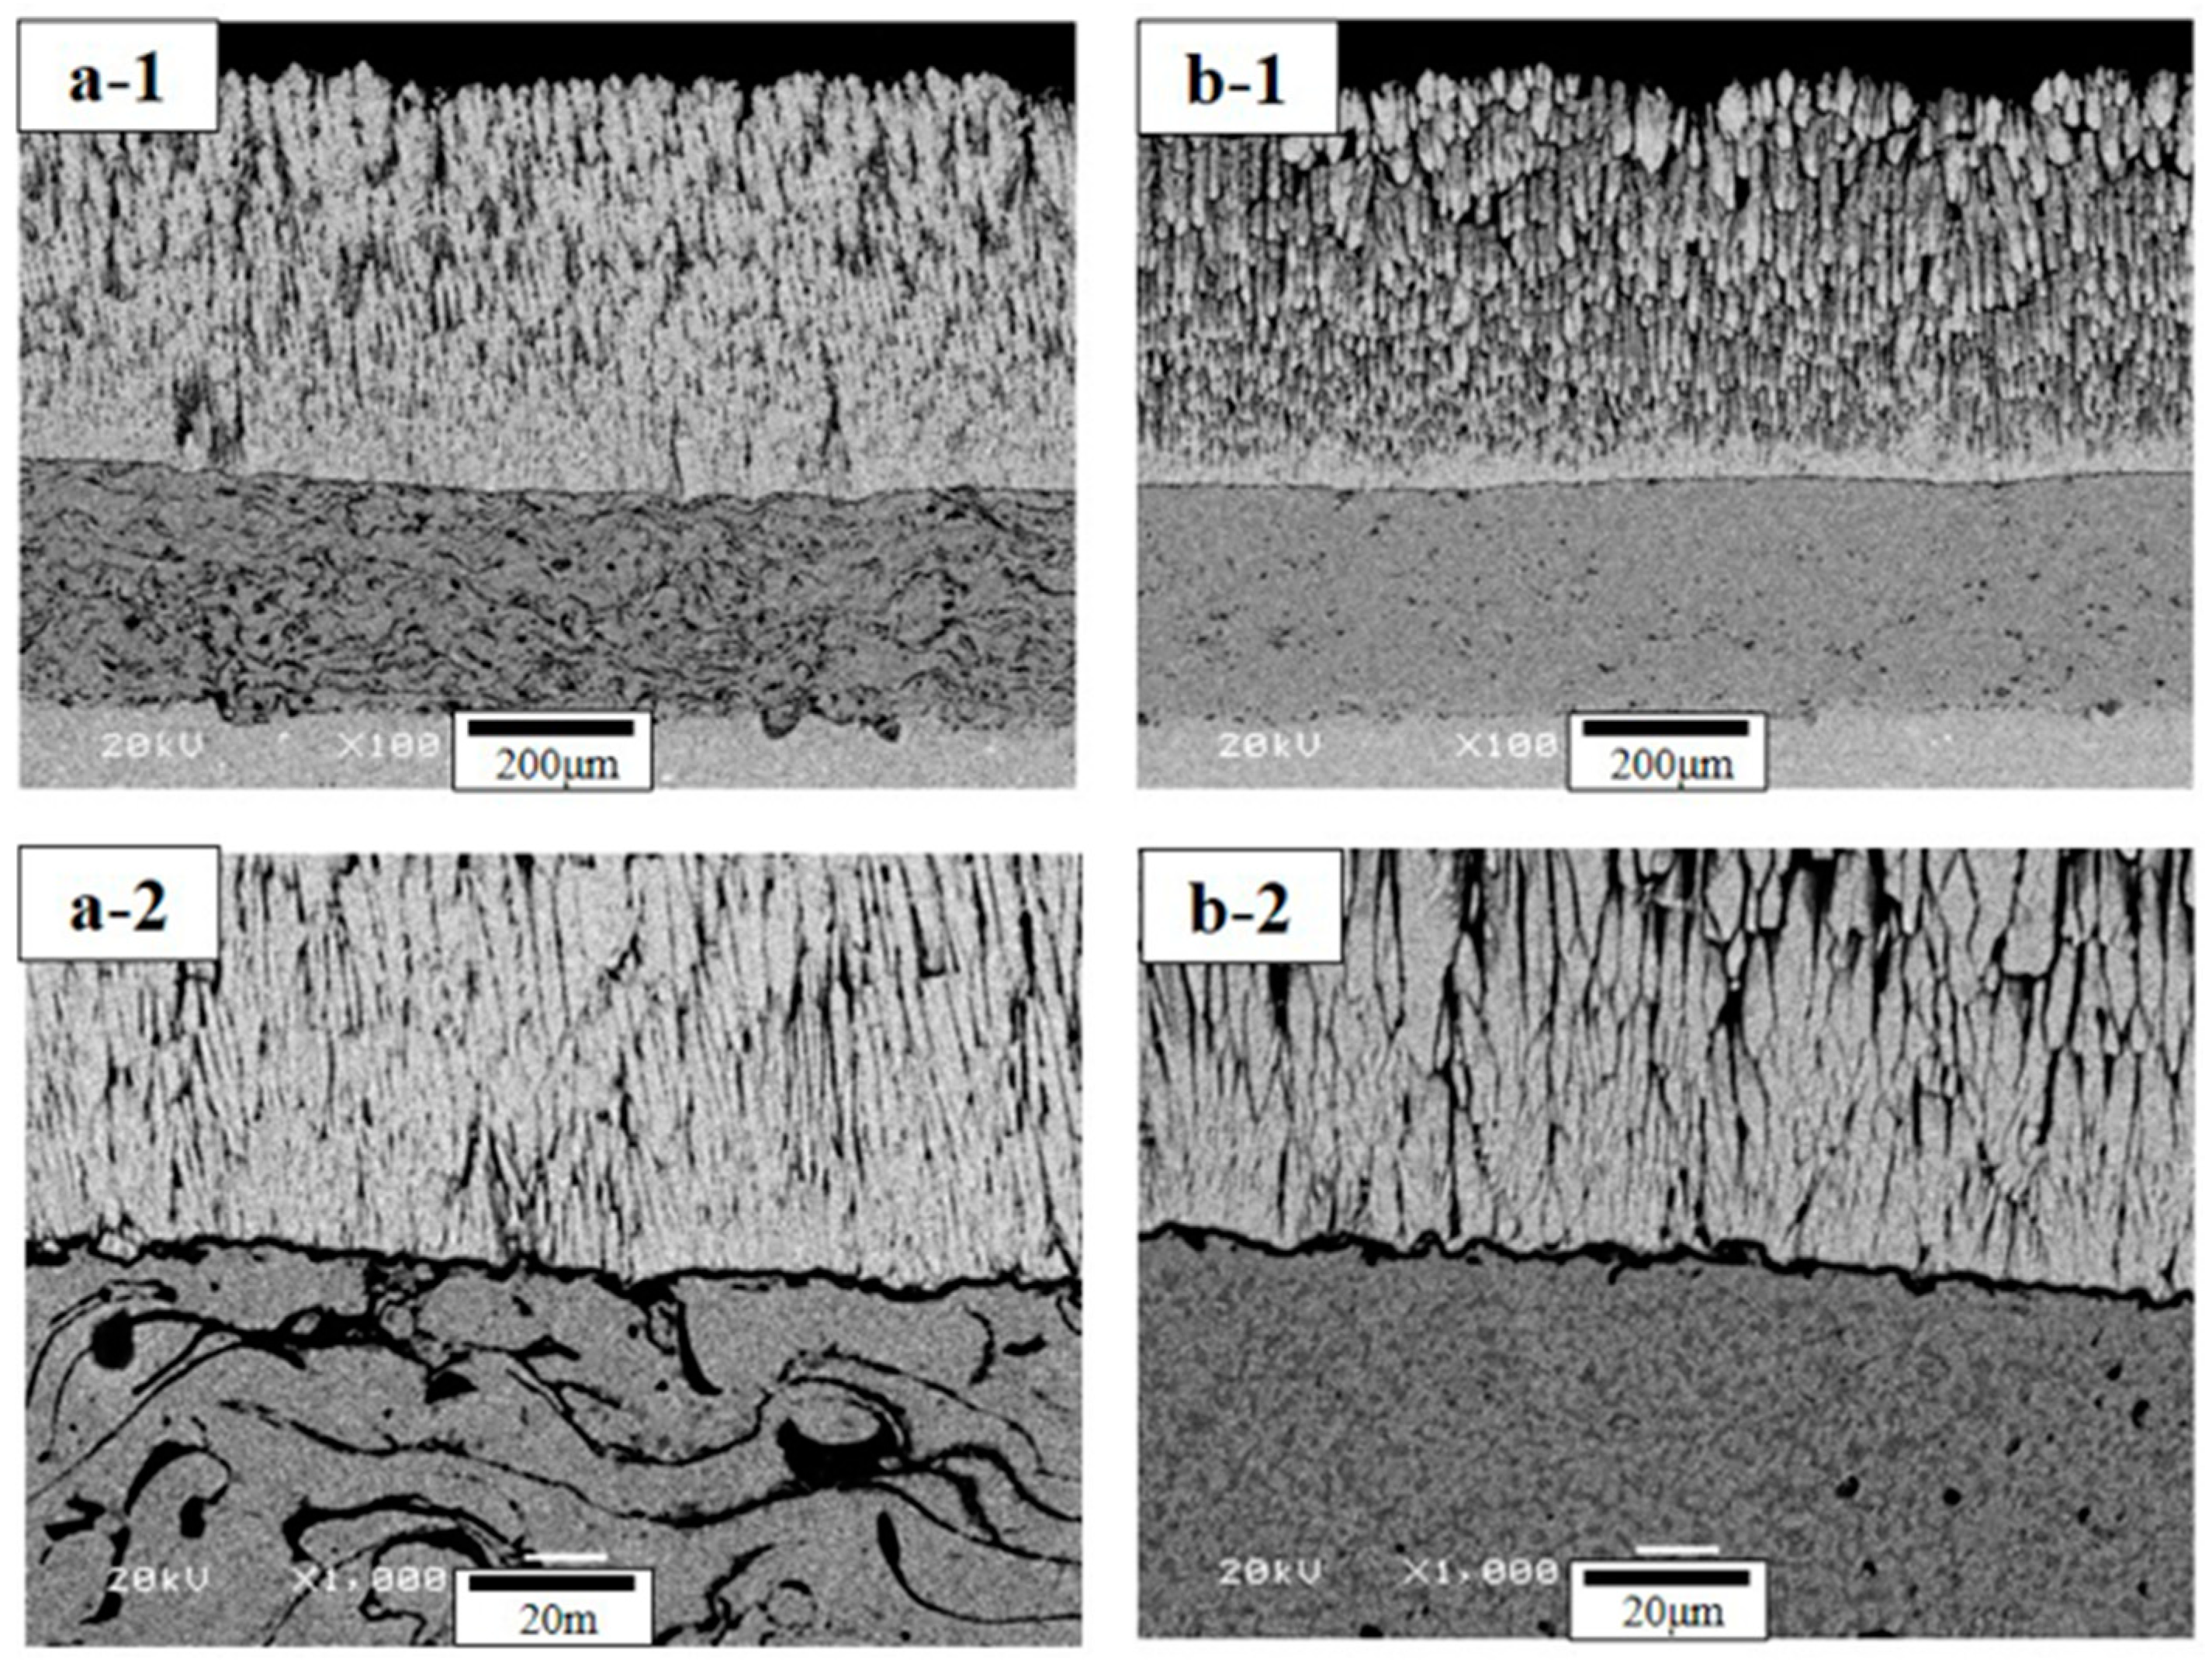
  • After FTF tests, the TBC samples show a sound condition without cracking or delamination, independent of bond coat species. The interface microstructures show a thin TGO layer of 1–2 μm in thickness. The TGO layer is not fully developed in FTF tests, owing to the relatively short thermal exposure time.
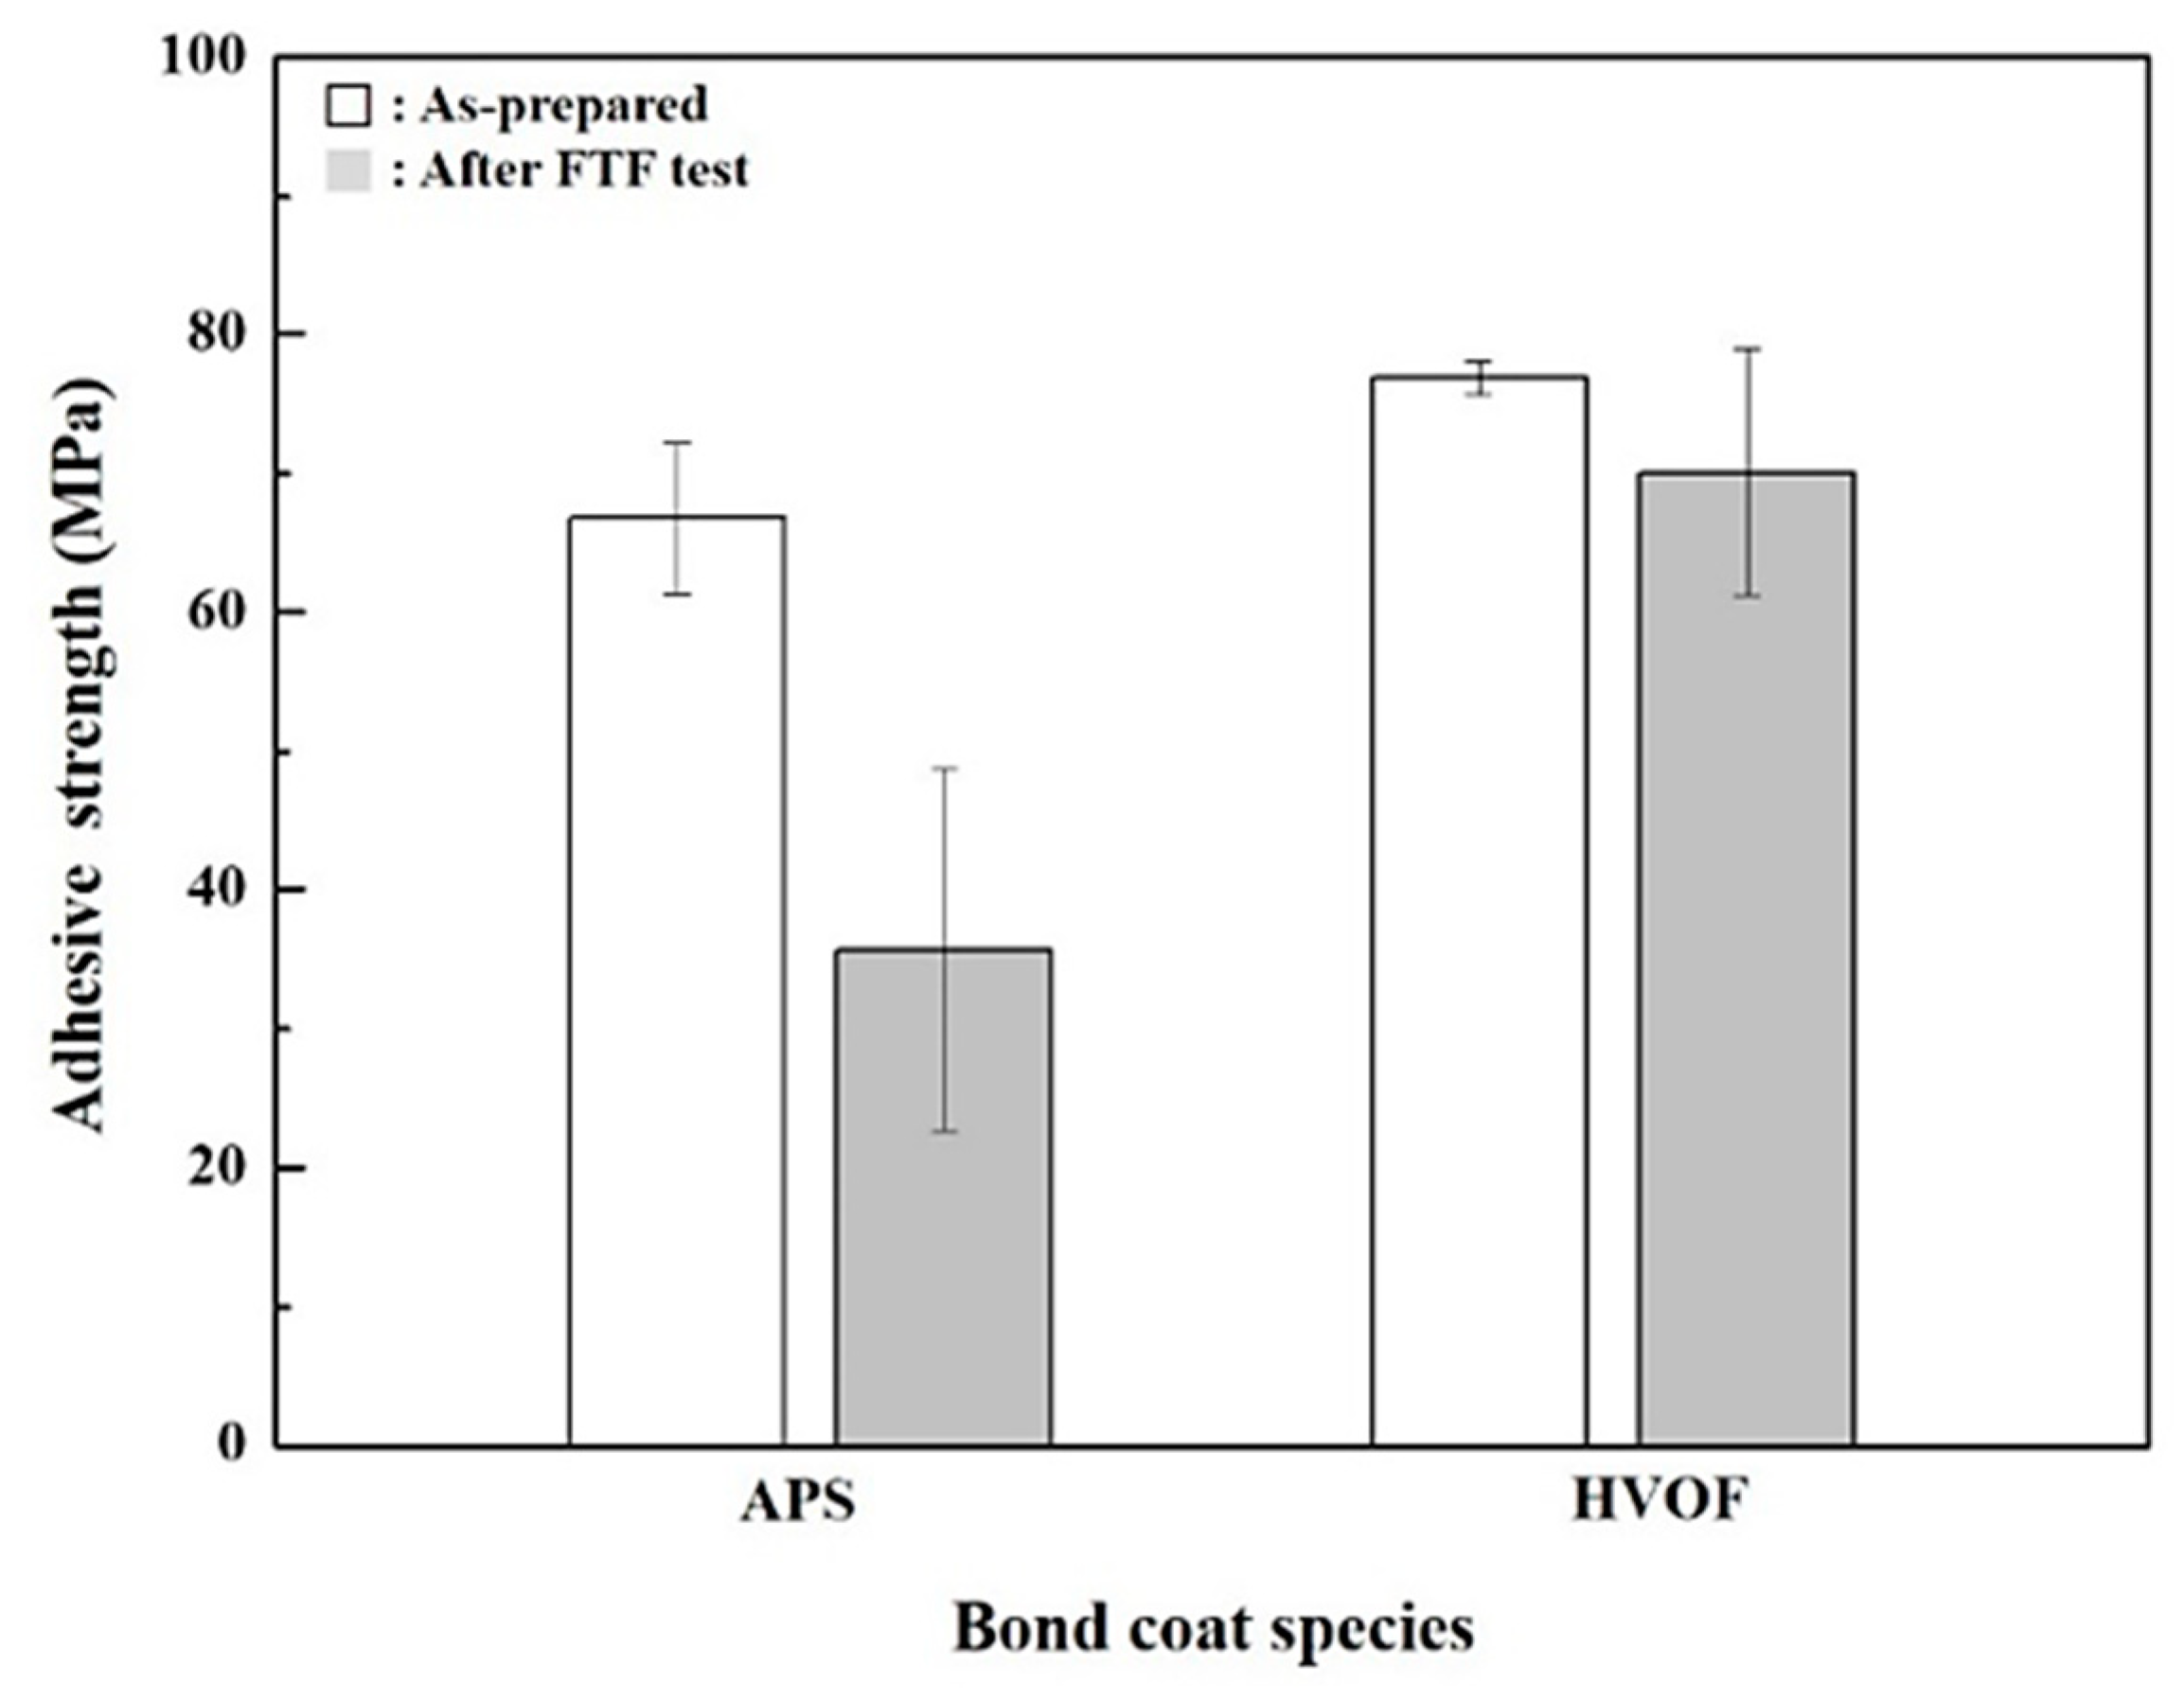
  • After FTF tests for 1429 cycles, the hardness values of top coats are slightly increased. The adhesive strength values are reduced, with a higher value for the TBCs with the HVOF bond coat than the APS ones.
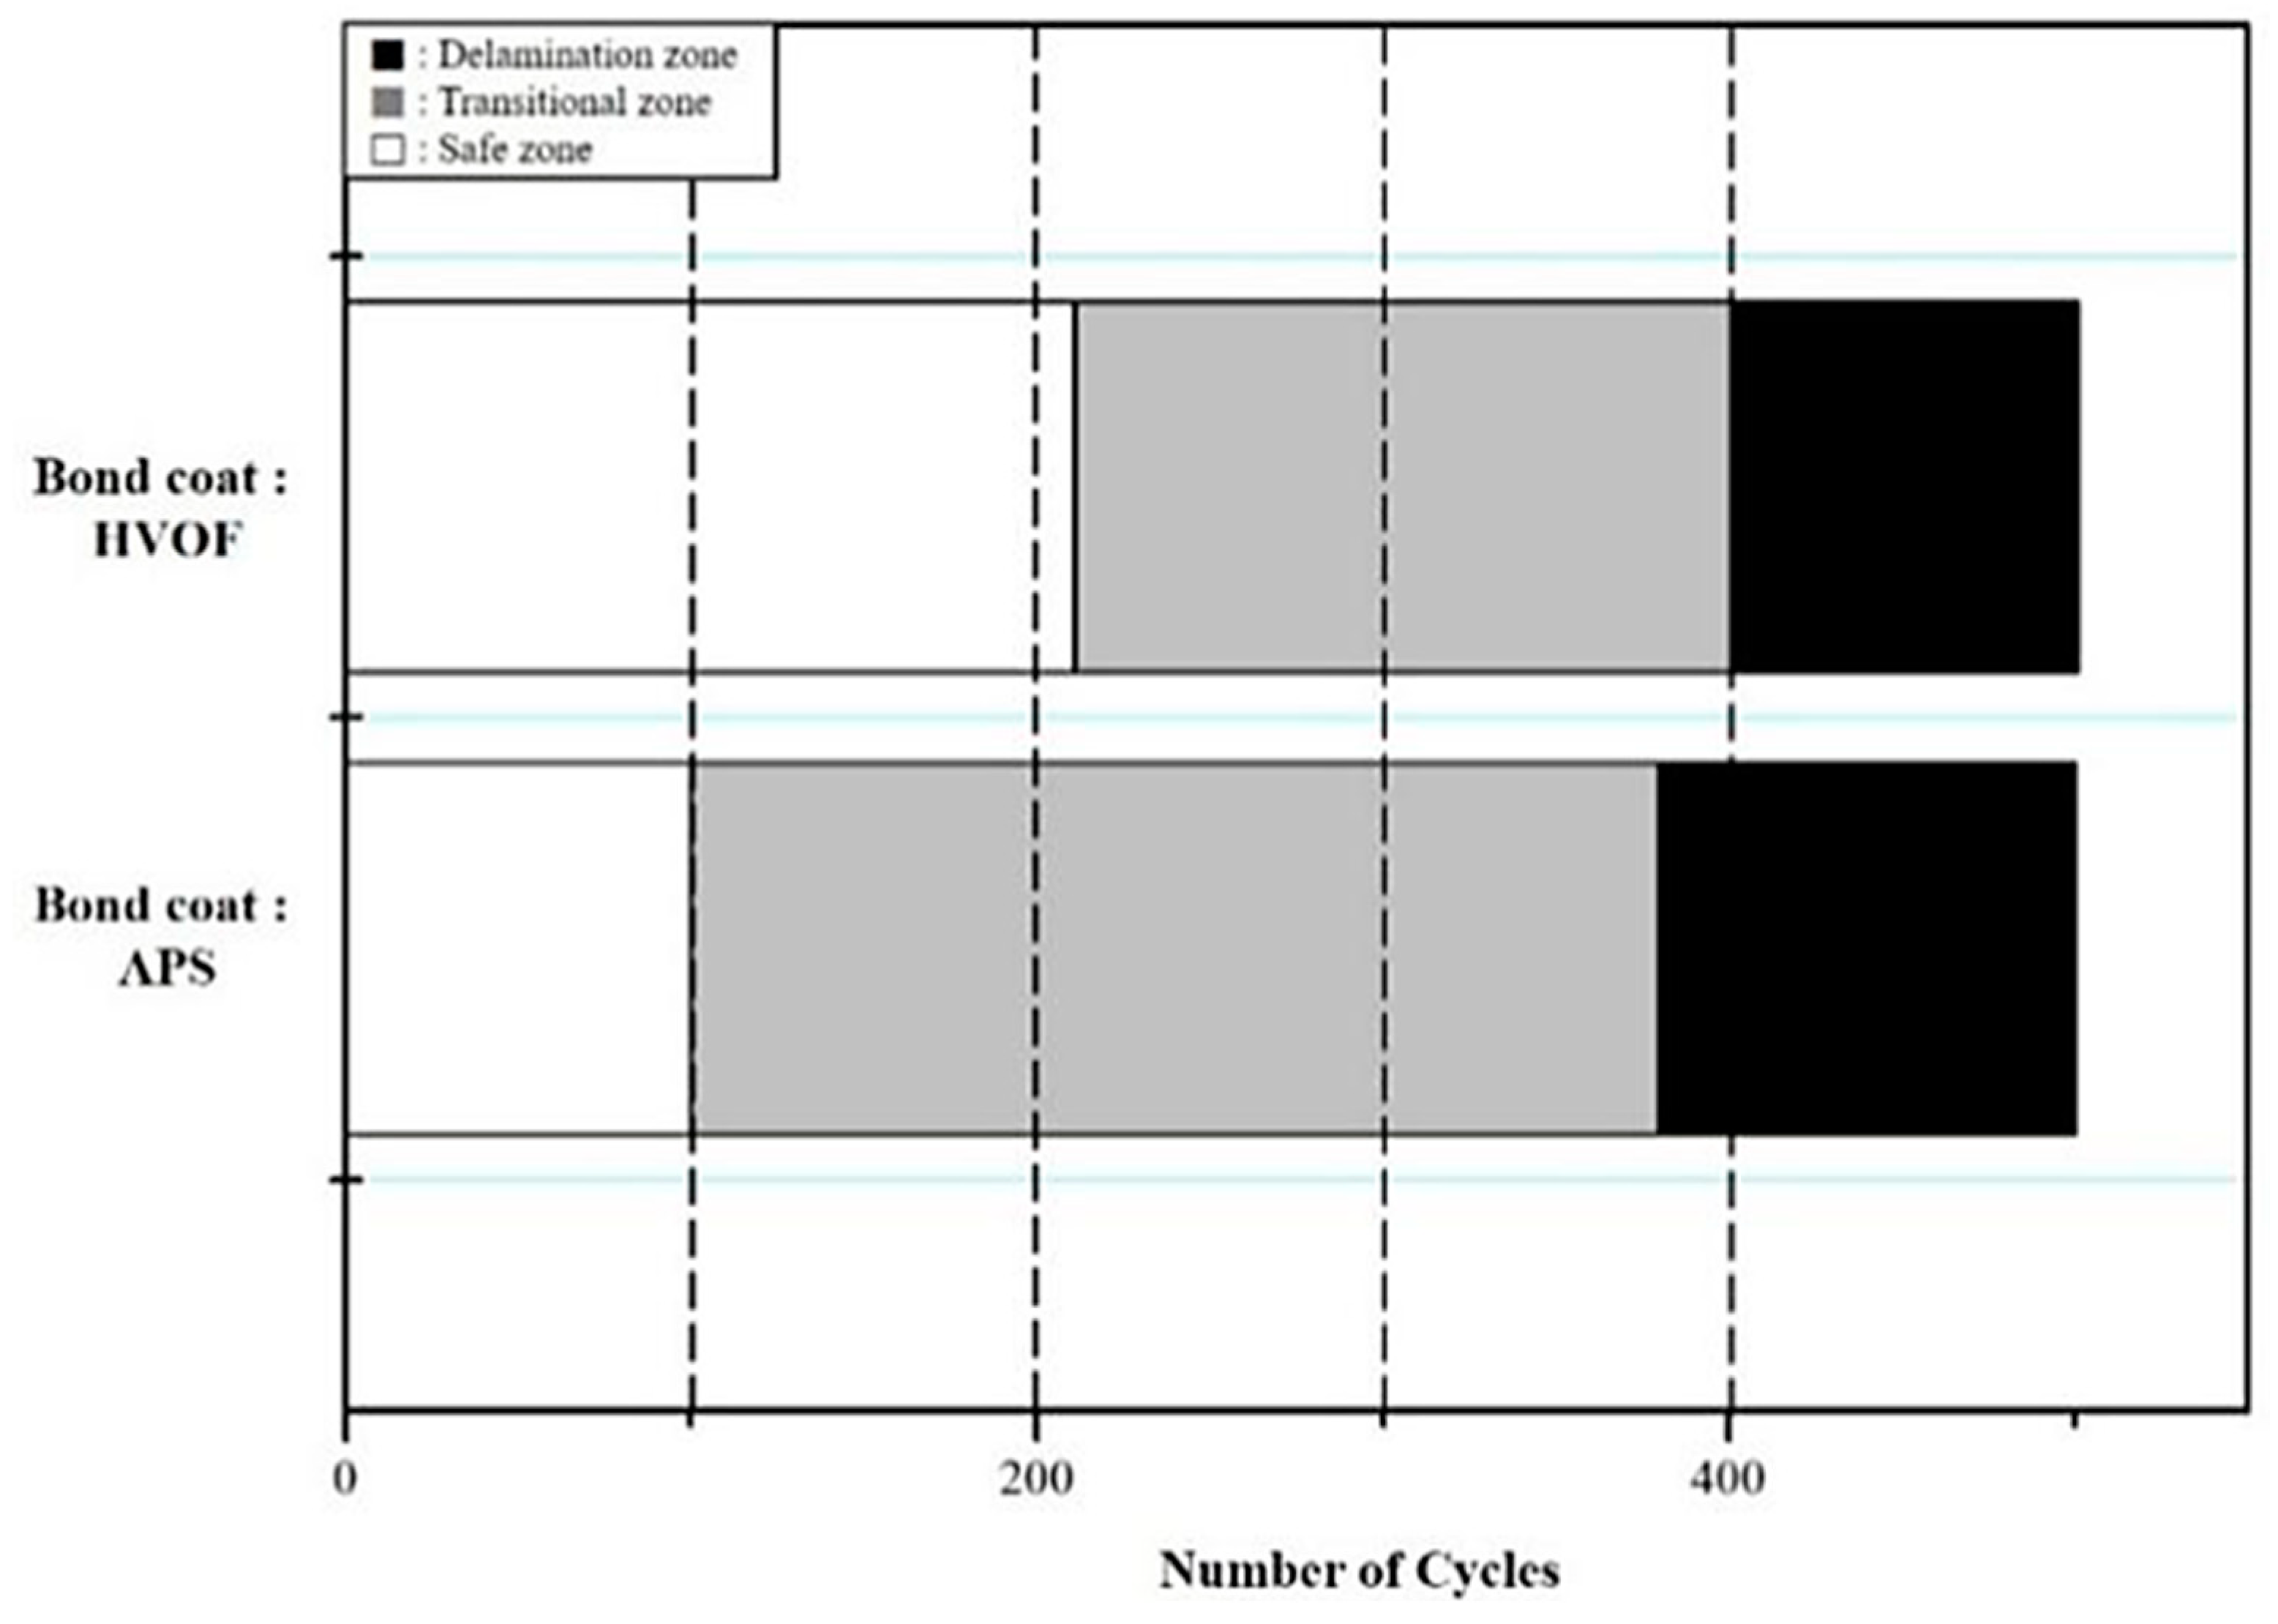
  • In CFTF tests, the TBCs with the APS and HVOF bond coats are delaminated in the range of 100–380 and 210–390 cycles, respectively.
  • In TS tests, the TBCs with the bond coats prepared using the APS and HVOF processes are fully delaminated after 44–80 and 345–372 cycles, respectively, suggesting that HVOF bond coat is more effective in improving thermal durability than APS.
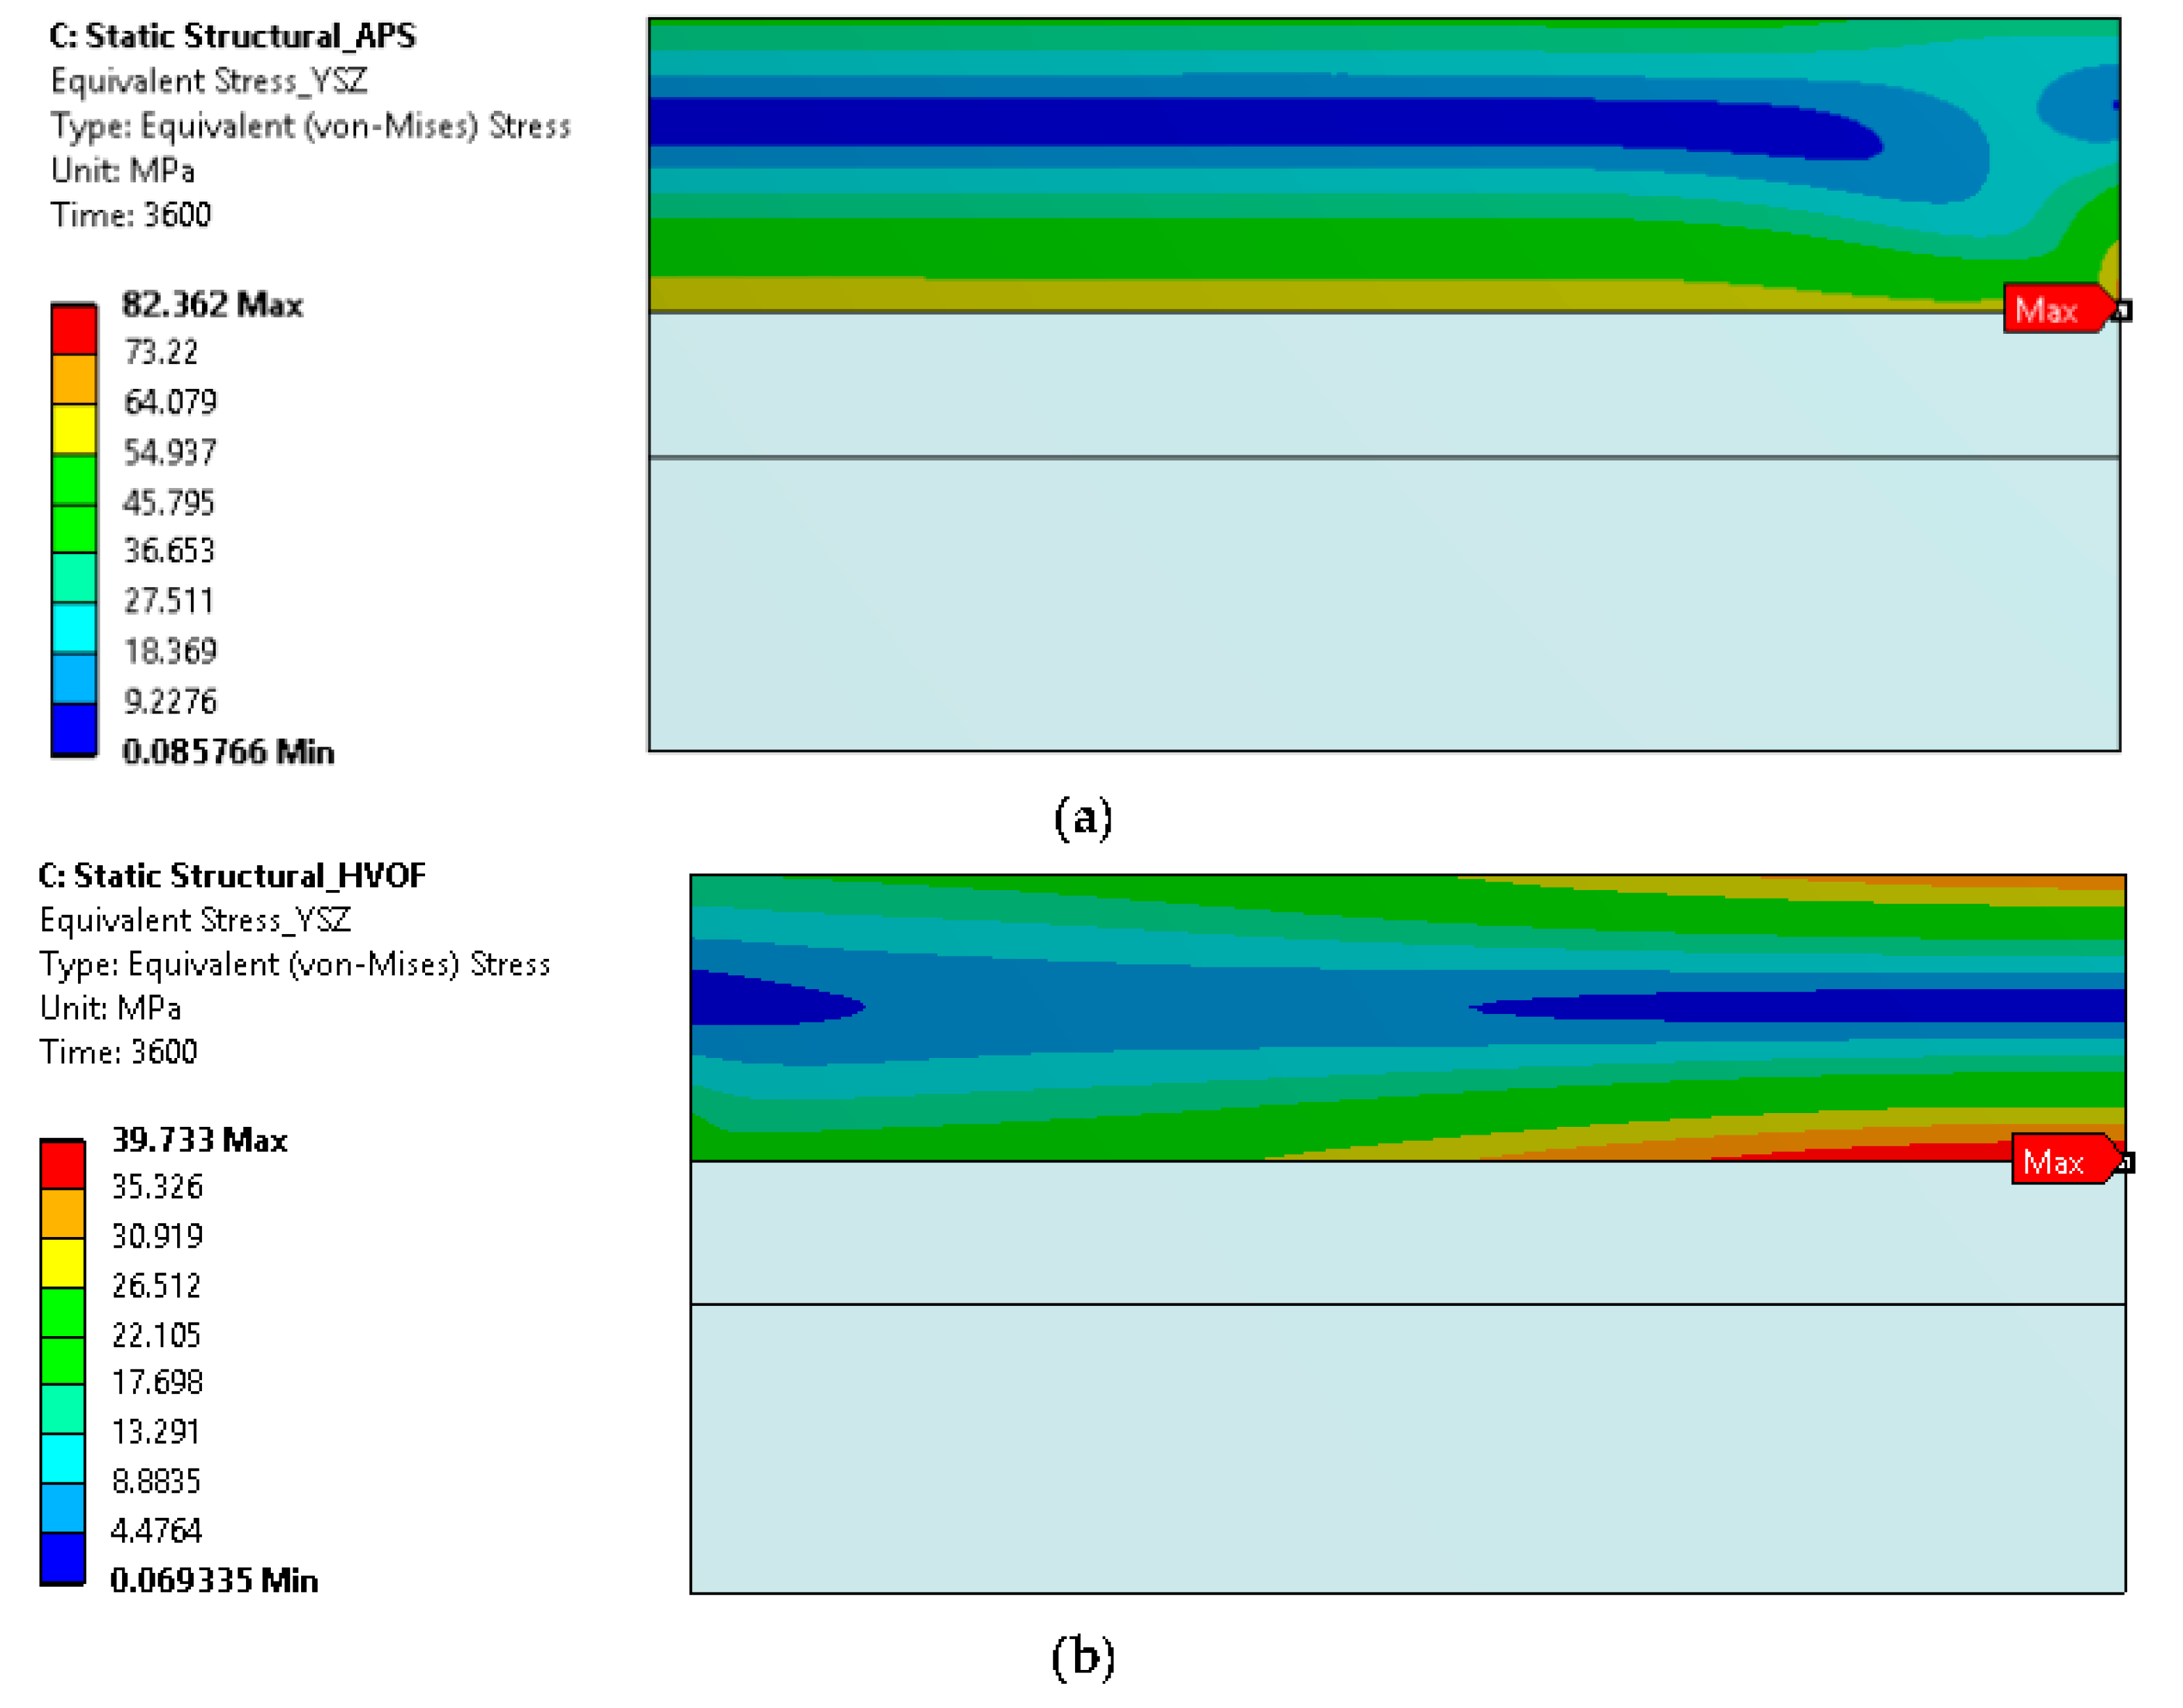
  • The FE model simulation predicts a lower equivalent stress at the interface of the top coat and bond coat interface in TBCs prepared using the HVOF process compared with APS, suggesting a longer cyclic life of the coating with the HVOF bond coat, which is consistent with the experimental observations.

Author Contributions

Conceptualization, Z.L., Y.-G.J. and J.Z.; methodology, Z.L., Y.-G.J. and J.Z.; software, J.Z. and A.G.; validation, Z.L., H.-M.P., J.S.K. and G.L.; investigation, Z.L., J.S.K. and G.L.; resources, Z.L. and Y.-G.J.; writing—original draft preparation, Z.L. and G.L.; writing—review and editing, Y.-G.J., G.L. and J.Z.; supervision, Y.-G.J. and J.Z.; project administration, Y.-G.J.; funding acquisition, Z.L. and Y.-G.J.

Funding

This work was supported by the “Human Resources Program in Energy Technology” of the Korea Institute of Energy Technology Evaluation and Planning (KETEP), with financial support from the Ministry of Trade, Industry and Energy, Korea (No. 20194030202450), by the National Nature Science Foundation of China (Nos. 51702145), outh Foundation and Innovation Group Project from the University of Science and Technology Liaoning (2016QN03 & 2017TD01).

Acknowledgments

The authors wish to acknowledge Jing Zhang for providing the FE analysis in the present study.

Conflicts of Interest

The authors declare no conflict of interest.

References

  1. DeMasi-Marcin, J.T.; Gupta, D.K. Protective coatings in the gas turbine engine. Surf. Coat. Technol. 1994, 68, 1–9. [Google Scholar] [CrossRef]
  2. Stecura, S. NASA Technical Memorandum; NASA Lewis Research Center: Cleveland, OH, USA, 1985. [Google Scholar]
  3. Strangman, T.E. Thermal barrier coatings for turbine airfoils. Thin Solid Films 1985, 127, 93–106. [Google Scholar] [CrossRef]
  4. Meier, S.M.; Gupta, D.K.; Sheffler, K.D. Ceramic thermal barrier coatings for commercial gas turbine engines. JOM 1991, 43, 50–53. [Google Scholar] [CrossRef]
  5. Łatka, L. Thermal barrier coatings manufactured by suspension plasma spraying—A review. Adv. Mater. Sci. 2018, 18, 95–117. [Google Scholar] [CrossRef]
  6. Sokołowski, P.; Nylen, P.; Musalek, R.; Łatka, L.; Kozerski, S.; Dietrich, D.; Lampke, T.; Pawłowski, L. The microstructural studies of suspension plasma sprayed zirconia coatings with the use of high-energy plasma torches. Surf. Coat. Technol. 2017, 318, 250–261. [Google Scholar] [CrossRef]
  7. Shillington, E.; Clarke, D. Spalling failure of a thermal barrier coating associated with aluminum depletion in the bond-coat. Acta Mater. 1999, 47, 1297–1305. [Google Scholar] [CrossRef]
  8. Rabiei, A. Failure mechanisms associated with the thermally grown oxide in plasma-sprayed thermal barrier coatings. Acta Mater. 2000, 48, 3963–3976. [Google Scholar] [CrossRef]
  9. Cheng, Z.; Yang, J.; Shao, F.; Zhong, X.; Zhao, H.; Zhuang, Y.; Ni, J.; Tao, S. Thermal stability of YSZ coatings deposited by plasma spray–physical vapor deposition. Coatings 2019, 9, 464. [Google Scholar] [CrossRef]
  10. Miller, R.A.; Lowell, C.E. Failure mechanisms of thermal barrier coatings exposed to elevated temperatures. Thin Solid Films 1982, 95, 265–273. [Google Scholar] [CrossRef] [Green Version]
  11. Evans, A.; Mumm, D.; Hutchinson, J.; Meier, G.; Pettit, F. Mechanisms controlling the durability of thermal barrier coatings. Prog. Mater. Sci. 2001, 46, 505–553. [Google Scholar] [CrossRef]
  12. Vaßen, R.; Jarligo, M.O.; Steinke, T.; Mack, D.E.; Stöver, D. Overview on advanced thermal barrier coatings. Surf. Coat. Technol. 2010, 205, 938–942. [Google Scholar] [CrossRef]
  13. Vassen, R.; Stuke, A.; Stöver, D. Recent developments in the field of thermal barrier coatings. J. Therm. Spray Technol. 2009, 18, 181–186. [Google Scholar] [CrossRef]
  14. Sidhu, T.S.; Prakash, S.; Agrawal, R.D. Investigations on role of HVOF sprayed Co and Ni based coatings to combat hot corrosion. Corros. Eng. Sci. Technol. 2008, 43, 335–342. [Google Scholar] [CrossRef]
  15. Jung, S.-H.; Jeon, S.-H.; Lee, J.-H.; Jung, Y.-G.; Kim, I.-S.; Choi, B.-G. Effects of composition, structure design, and coating thickness of thermal barrier coatings on thermal barrier performance. J. Korean Ceram. Soc. 2016, 53, 689–699. [Google Scholar] [CrossRef]
  16. Young Seok, S.; Jung, S.I.; Kwon, J.Y.; Lee, J.H.; Jung, J.G.; Paik, U.Y. Fracture behavior of plasma-sprayed thermal barrier coatings with different bond coats upon cyclic thermal exposure. Mater. Sci. Forum 2009, 620, 343–346. [Google Scholar]
  17. Lawn, B. Fracture of Brittle Solids; Cambridge University Press: Cambridge, UK, 1993. [Google Scholar]
  18. ASTM Standards C633 Standard Test Method for Adhesion or Cohesion Strength of Thermal Spray Coatings; American Society of Testing and Materials: Philadelphia, PA, USA, 2001.
  19. Tsantrizes, P.G.; Kim, G.G.; Brezinski, T.A. Thermal barrier coatings. In Proceedings of the AGARD Smp Meeting, Aalborg, Denmark, 15–16 October 1997. [Google Scholar]
  20. Knight, R.; Zhangxiong, D.; Kim, E.H.; Smith, R.W.; Sahoo, P.; Bucci, D. Influence of bond coat surface characteristics on the performance of Tbc systems. In Proceedings of the 15th International Thermal Spray Conference, ASM Thermal Spray Society, Nice, France, 25–29 May 1998. [Google Scholar]
  21. Chwa, S.O.; Ohmori, A. Microstructures of ZrO2–8wt.%Y2O3 coatings prepared by a plasma laser hybrid spraying technique. Surf. Coat. Technol. 2002, 153, 304–312. [Google Scholar] [CrossRef]
  22. Ma, X.; Takemoto, M. Quantitative acoustic emission analysis of plasma sprayed thermal barrier coatings subjected to thermal shock tests. Mater. Sci. Eng. A 2001, 308, 101–110. [Google Scholar] [CrossRef]
  23. Bednarz, P. Finite Element Simulation of Stress Evolution in Thermal Barrier Coating Systems; Forschungszentrum, Zentralbibliothek: Julich, Germany, 2006. [Google Scholar]
  24. Chen, H.; Hyde, T.H.; Voisey, K.T.; McCartney, D.G. Application of small punch creep testing to a thermally sprayed CoNiCrAlY bond coat. Mater. Sci. Eng. A 2013, 585, 205–213. [Google Scholar] [CrossRef] [Green Version]
  25. Zhu, D.; Miller, R.A. Determination of creep behavior of thermal barrier coatings under laser imposed high thermal and stress gradient conditions. J. Mater. Res. 1999, 14, 146–161. [Google Scholar] [CrossRef]
  26. Wang, L.; Zhong, X.H.; Zhao, Y.X.; Tao, S.Y.; Zhang, W.; Wang, Y.; Sun, X.G. Design and optimization of coating structure for the thermal barrier coatings fabricated by atmospheric plasma spraying via finite element method. J. Asian Ceram. Soc. 2014, 2, 102–116. [Google Scholar] [CrossRef] [Green Version]
  27. Chang, G.C.; Phucharoen, W.; Miller, R.A. Behavior of thermal barrier coatings for advanced gas turbine blades. Surf. Coat. Technol. 1987, 30, 13–28. [Google Scholar] [CrossRef]
  28. Cui, Q.; Seo, S.-M.; Yoo, Y.-S.; Lu, Z.; Myoung, S.-W.; Jung, Y.-G.; Paik, U. Thermal durability of thermal barrier coatings with bond coat composition in cyclic thermal exposure. Surf. Coat. Technol. 2015, 284, 69–74. [Google Scholar] [CrossRef]
Figure 1. Cross-sectional microstructures of as-prepared TBCs: APS bond coat TBC system (the overall (a–1) and the interface (a–2) microstructures), and HVOF bond coat TBC system (the overall (b–1) and the interface (b–2) microstructures).
Coatings 09 00626 g001
Figure 2. Cross-sectional microstructures of TBC system after FTF tests: APS bond coat TBC system (the overall (a–1) and the interface (a–2) microstructures) and HVOF bond coat TBC system (the overall (b–1) and the interface (b–2) microstructures).
Coatings 09 00626 g002
Figure 3. Cross-sectional microstructures of TBCs after CFTF tests: TBC with APS bond coat (the overall (a–1) and the interface (a–2) microstructures) and TBC with HVOF bond coat (the overall (b–1) and the interface (b–2) microstructures).
Coatings 09 00626 g003
Figure 4. The service lives of TBCs with different bond coats after CFTF tests.
Coatings 09 00626 g004
Figure 5. Surface micrographs and cross-sectional microstructures of TBCs after TS tests: TBC with APS bond coat (the surface micrographs (a–1), cross-sectional (a–2) and magnified interface (a–3) microstructures) and TBC with HVOF bond coat (the surface micrographs (a–1), cross-sectional (a–2) and magnified interface (a–3) microstructures).
Coatings 09 00626 g005
Figure 6. Hardness values of top coats before and after cyclic thermal exposure. Indentation for hardness was conducted on the sectional planes with a load of 3 N. Open and filled marks indicate the hardness values of top coats before and after FTF tests, respectively.
Coatings 09 00626 g006
Figure 7. Adhesive strength values of TBCs before and after FTF tests.
Coatings 09 00626 g007
Figure 8. Surface and cross-sectional microstructures after measuring adhesive strength for as-prepared TBCs: TBC with APS bond coat (the entire (a–1) and magnified (a–2) microstructures) and TBC with HVOF bond coat (the entire (b–1) and magnified (b–2) microstructures). Surface morphologies of each sample are inserted in each figure.
Coatings 09 00626 g008
Figure 9. Surface and cross-sectional microstructures after measuring adhesive strength for TBCs after 1429 cycles in FTF tests: TBC with APS bond coat (the entire (a–1) and magnified (a–2) microstructures) and TBC with HVOF bond coat (the entire (b–1) and magnified (b–2) microstructures). Surface morphologies of each sample are inserted in each figure.
Coatings 09 00626 g009
Figure 10. Temperature evolution in the coating.
Coatings 09 00626 g010
Figure 11. Temperature distribution in the coatings (a) during the heating cycle, and (b) during the cooling cycle.
Coatings 09 00626 g011
Figure 12. Temperature distribution in the coatings (a) during the heating cycle and (b) during the cooling cycle.
Coatings 09 00626 g012
Figure 13. Comparison of equivalent stress of TBC with a bond coat made using APS and HVOF.
Coatings 09 00626 g013
Figure 14. Comparison of creep strain of TBC with a bond coat made using APS and HVOF.
Coatings 09 00626 g014
Table 1. Temperature-dependent creep constants used in the FE model [23,24].
MaterialTemperature (°C)An
YSZ7502.00 × 10−224.5
8502.00 × 10−204.32
9503.00 × 10−184.15
10503.77 × 10−163.98
11504.80 × 10−143.8
NiCrCoAlY (HVOF)7501.25 × 10−144.5
8501.40 × 10−113.8
9502.30 × 10−223.1
10509.50 × 10−82.55
NiCrCoAlY (APS)7506.00 × 10−207.9
Inconel 718104.85 × 10−361.0
12002.25 × 10−93.0
Table 2. Temperature-dependent material properties used in the FE model [25,26].
MaterialTemperature, T (°C)Young’s Modulus, E (GPa)Coefficient of Thermal Expansion, α (10–6/°C)Poisson’s Ratio, νThermal Conductivity, k (W/(m·°C))Specific Heat, C (J/(kg·°C))
YSZ25537.20.251.5500
400529.40.251.2576
80046160.251.2637
NiCoCrAlY25225140.34.3501
400186240.36.4592
800147470.310.2781
Inconel 7182520511.80.32114.7480
400175.514.10.33918.3493.9
500168.514.40.34419.6514.8
65014215.10.36122556.2
750130.516.20.38123.2594.35
Table 3. Thermal durability of TBCs with bond coat species in various thermal exposure tests.
Specimen SpeciesTBC with APS Bond CoatTBC with HVOF Bond Coat
Cyclic furnace thermal fatigue (CFTF)100–380 cycles210–390 cycles
Flame thermal fatigue (FTF)1429 cycles1429 cycles
Thermal shock (TS)44–80 cycles345–372 cycles

