Multi-Layered Mesoporous TiO2 Thin Films: Photoelectrodes with Improved Activity and Stability

Institute of Chemistry, Chemical Technology 1, Carl von Ossietzky University of Oldenburg, D-26129 Oldenburg, Germany
*
Author to whom correspondence should be addressed.
Coatings 2019, 9(10), 625; https://doi.org/10.3390/coatings9100625
Submission received: 25 August 2019
/
Revised: 24 September 2019
/
Accepted: 24 September 2019
/
Published: 28 September 2019
(This article belongs to the Special Issue Mesoporous Metal Oxide Films)
Abstract
:This work aims at the identification of porous titanium dioxide thin film (photo)electrodes that represent suitable host structures for a subsequent electrodeposition of plasmonic nanoparticles. Sufficient UV absorption and electrical conductivity were assured by adjusting film thickness and TiO crystallinity. Films with up to 10 layers were prepared by an evaporation-induced self-assembly (EISA) method and layer-by-layer deposition. Activities were tested towards the photoelectrochemical oxidation of water under UV illumination. Enhanced activities with each additional layer were observed and explained with increased amounts of immobilized TiO and access to more active sites as a combined effect of increased surface area, better crystallinity and improved transport properties. Furthermore, films display good electrochemical and mechanical stability, which was related to the controlled intermediate thermal annealing steps, making these materials a promising candidate for future electrochemical depositions of plasmonic noble metal nanoparticles that has been further demonstrated by incorporation of gold.
1. Introduction
Since the seminal discovery of water photolysis by Fujishima and Honda in 1972 [1], TiO-based materials have experienced a rarely diminished attention in material research. Due to its unique set of properties, namely being inexpensive, environmentally benign, stability in aqueous media, recyclability and having favorable band energies, TiO is an appealing material choice [2,3,4]. Moreover, its very flexible processability and intensively explored synthesis routes to modify its structure lead to a wide range of energy and environmental applications [5,6,7]. To name a few non-photocatalytic applications, these can be sensors [8,9], photovoltaic devices [10,11] and Li-ion batteries [12,13]. Additionally, TiO can be found in various (heterogenous) photocatalytic applications ranging from self-cleaning/sterilizing and anti-fogging surfaces [3,14], over water and air purification [15,16] and anticorrosive coatings [17,18] to CO photoreduction [19,20,21] and H evolution from water [5,22].
To achieve a good photocatalytic performance, it is necessary to know the desired application before optimizing the catalyst with respect to both its structure and its optoelectrochemical properties. Structurally, mass transfer (reactant to active sites), charge transfer (catalyst surface to reactant) and charge transport (catalyst bulk to its surface) must be considered [4]. Access to more active sites, an improved collection/harvesting of photogenerated charge carriers and light trapping [23] are desirable approaches towards higher quantum yields. In light of this, extensively documented experimental techniques towards various target structures have emerged over the course of recent decades [4]. Today, TiO can be shaped into films [24,25,26], spheres [27,28], fibers [29,30], rods [31,32], tubes [26,33], etc. with variable pore sizes and/or pore size distributions ranging from micro- [34,35] to macroporous [36,37] and—occasionally—bimodal hierarchical [38,39].
Optoelectrochemical properties highly depend on the nanostructural features of titanium dioxide, such as crystallinity and crystallite size, grain boundaries and the types and amounts of defects. However, there are also two major drawbacks that intrinsically impair the efficiency of pure TiO-based photocatalysts: the first is a band gap of ≈3.0–3.2 eV which limits photon absorption to the UV spectrum and thus to the small fraction of ≈5% solar photon energy [2,40]; the second is relatively fast recombination rates of photogenerated electron–hole pairs due to their limited mobility and short lifetimes [2,41]. There are numerous approaches to address these two issues including metal and/or nonmetal-doping [40,42,43] (to partially replace either the Ti and/or O sites), heterojunction formation [20,44], Z-schemes [45,46], decoration with quantum dots [47] and—with more recent success—hydrogenation towards “black” TiO [48] or introduction of surface plasmon resonance (SPR) active noble metal nanoparticles (NPs) [41,49,50,51,52,53]. To develop TiO photocatalysts, it is, therefore, necessary to address both origins—structure and intrinsic optoelectrochemical properties.
The scope of the present study is focused on a TiO-based system to identify suitable mesoporous host structures for further modifications related to both origins. It is important to understand the intended modifications, since they define requirements for the investigated material. At a later stage of this study, the electrochemical deposition (ED) of SPR-active Au-NPs is outlined. The basic appeal of decorating TiO with such NPs is that both major drawbacks can be tackled simultaneously: Visible-light response can be attained via the SPR effect plus subsequent injection of hot electrons into the conduction band of TiO [54] (where they can be consumed for reduction processes [55,56]) and improved electron/hole separation, since the metal–TiO interface forms a Schottky barrier thus decelerating charge carrier recombination [41,51]. SPR features are not only size and shape dependent [57], but the surrounding chemical environment and its interaction with the NPs also plays a crucial role. When considering the latter fact together with the intended ED, the most important requirement for the TiO host system becomes apparent: being a (meso)porous TiO electrode.
Mesoporous TiO thin films (MTTFs) not only display tunable host matrices due to their well-definable pore system [58,59], they are also beneficial for facilitated product recovery due to their immobilized nature. A frequently reported technique towards MTTFs—which is commonly used for dip-, spin-coating [60]—is the balanced combination of sol-gel chemistry and the evaporation-induced self-assembly (EISA) in the presence of surfactants which yield the metal oxide and the porous network, respectively [61,62,63]. Five steps, namely (i) precursor selection and initial sol preparation, (ii) deposition, (iii) controlled aging, (iv) template removal and (v) wall crystallization, govern the final film properties as Soler-Illia et al. pointed out [62]. Recently, the same authors contributed to state-of-the-art designs of plasmon-enhanced MTTFs with structural control of both the host and SPR-active NPs guests [64,65,66,67,68]. Their groups prepared well-ordered MTTFs derived either from mild oxidative at 350 C air calcination [64,65,66] or extractive template removal [67,68] and employed an impregnation–reduction method to introduce noble metal NPs. The resulting films were for example tested for surface-enhanced Raman scattering (SERS) activity for sensing applications.
The electrochemical incorporation of metallic NPs into MTTFs necessitates electronic conductivity of the films. Thus, improved crystallinity is required to allow deposition throughout the film rather than on the electrode’s back contact. This can be achieved by elevated annealing temperatures which usually are accompanied by significant mesostructural deterioration due to mass migration and crystal growth [58,62]. The trade-off between loss of active surface area and improved crystallinity can be manipulated to some extent with an additional thermal treatment under inert-gas atmosphere [47,69]. However, the degree of mesoporosity—which determines accessibility of active sites and diffusion of molecules through the film—seems to be more important than the order of the porosity [62,70].
Photocatalytic activity not only depends on crystal sizes and structure alone but also on the portion of absorbed photons. The EISA approach mostly results limited amount of material per deposited layer [71,72,73] due the low viscosity and diluted concentrations of EISA-sols [58]. This necessitates a more time-consuming but worthwhile layer-by-layer deposition to prepare thicker films [47,72,74,75]. Such MTTFs display considerably high active surface sites that are accessible throughout the film as result of its mesoporosity and maximize the number of exploitable photogenerated electron–hole pairs for photocatalytic reactions.
Briefly, the present study aims at the preparation and identification of MTTF (photo)electrode materials that represent suitable host structures for a subsequent (photo)electrodeposition of plasmonic noble metal nanoparticles. Thus, the layer-by-layer deposition of multi-layered TiO onto FTO/glass substrates and its effect on performance, structure and film stability is investigated. At first, single-layered MTTFs were prepared according to an established procedure and were further optimized with respect to a calcination temperature of 550 C. In the second part, the layer-by-layer deposition and characterization of multi-layered films are performed showing that an undiminished activity up to 10 layers is observed. Thirdly, performance and mechanical stability tests are conducted to demonstrate the film’s durability. Finally, their suitability as porous hosts for subsequent loadings is briefly demonstrated in terms of pulsed electrochemical incorporation of SPR-active Au-NPs.
2. Materials and Methods
2.1. Chemicals, Materials
FTO/glass substrates (Pilkington “NSG TEC A7”, 7 , 2.2 mm thickness, manufacturer: NSG Group, Gladbeck, Germany), acetone (Carl Roth, ≥99.9%), Pluronic P123 (Sigma Aldrich, M ≈ 5800 g·mol), glycerol (VWR, 99.8%), 1,6-diisocyanatohexane (Sigma Aldrich, ≥98%), abs. ethanol (Fisher Scientific, 99.5%), HCl(aq) (Fisher Scientific, 37 wt.%), Ti(OEt) (Alfa Aesar, >99%), de-ionized HO (18.2 M cm), HAuCl × 3 HO (Alfa Aesar, 48.5–50.25 wt.% Au), HClO (Bernd Kraft, 70 wt.%). All chemicals were used without further purification.
2.2. Preparation of Mesoporous TiO Thin Films
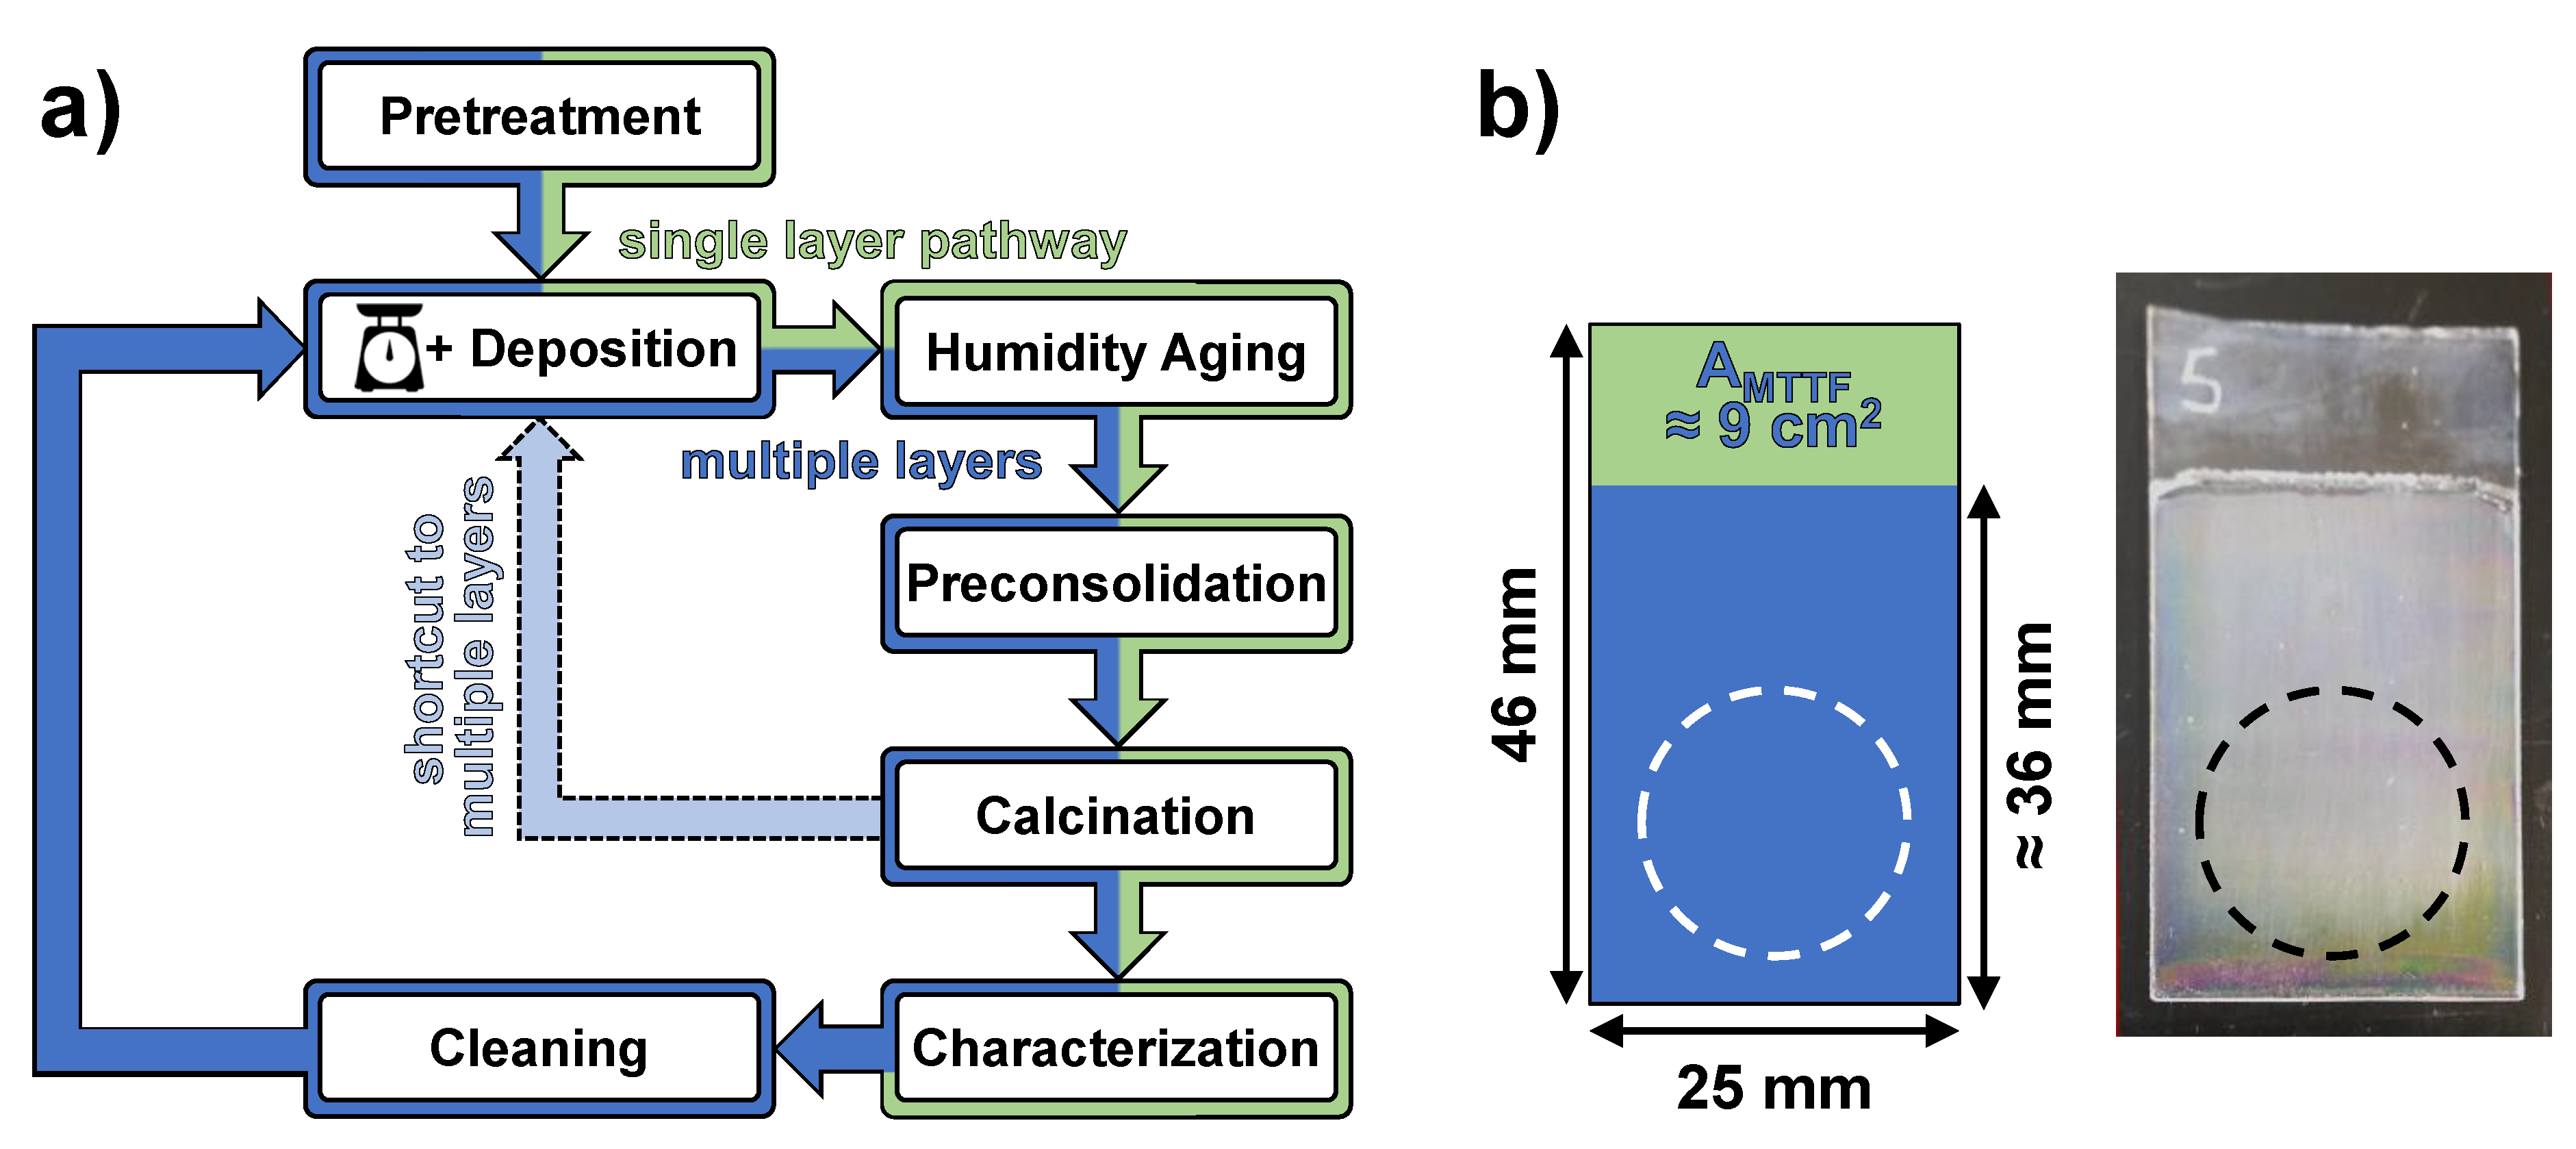
The preparation of MTTFs proceeded according to the flowchart depicted in Figure 1a.
Pretreatment: FTO/glass substrates were cut into pieces of 25 mm × 46 mm and cleaned by four consecutive ultrasonication steps (namely in 0.1 M NaOH(aq), 0.1 M HCl(aq), ethanol and acetone; each lasting 10 min at 37 kHz). Cleaned substrates were modified with a so-called “cross-linked P123”. This strategy has proven to promote the orthogonal orientation of two-dimensional mesochannels (by providing a surface chemically neutral towards both the hydrophilic (PEO) and hydrophobic (PPO) parts of the triblock-copolymer of P123) and was first demonstrated for MTTFs by the Rankin group [76,77]. For doing so, cleaned FTO/glass slides were dip-coated into an acetone-based solution with equimolar amounts of P123 and 1,6-diisocyanatohexane (both 0.696 mM) where the triol glycerol enabled cross-linkage. This solution was prepared by dissolving 0.404 g P123 and a droplet of glycerol into 100 mL acetone (15 min ultrasonication at 37 kHz), precooling in a refrigerator and addition of 12 mg of the diisocyanate inside a glovebox. It was readily used due to the ongoing isocyanate-hydroxyl polyaddition reaction towards polyurethane and the dip-coating procedure was performed at ambient conditions with a 70 mm·min immersion rate, 20 s holding time and withdrawal rate of 20 mm·min with an IDLAB 4 AC Coater device.
Deposition (dip-coating): EISA-sols were prepared by dissolving 1.30 g P123 in 15.0 g ethanol (15 min ultrasonication at 37 kHz). After being cooled in the refrigerator for 30 min, 3.06 g of concentrated HCl(aq) were added dropwise under vigorous stirring. The resulting mixture was further ultrasonicated and placed in a refrigerator for 30 min again. The precooled solution was transferred into a glovebox where 4.20 g of Ti(OEt) were added dropwise under vigorous stirring. The resulting molar ratio in the EISA-sol was Ti(OEt):P123:EtOH:HCl:HO = 1.00:0.0122:17.7:1.6:5.9. Both the chemicals and their stoichometric ratios were adopted from Choi et al. and are known to promote the formation of hexagonal mesopores [78]. However, little changes regarding the used solvent were made towards thicker films based on the procedure described in [76].
Films were deposited onto cross-linked FTO/glass substrates via dip-coating (IDLAB 4 AC Coater) into a teflon-made tank (reservoir dimensions: 38 mm height, 28 mm width, 8 mm depth) with a 70 mm·min immersion rate, 20 s holding time and a 20 mm·min withdrawal rate. Air-conditioning allowed operation at T < 15 C and relative humidities >70 %RH. After 2 min of hanging inside the dip-coater, the substrates were taken out for the aging phase. Prior to the deposition, the backsides of the cross-linked substrates were masked with a solvent resistant scotch tape.
Humidity aging, preconsolidation, calcination: As-deposited films were aged at low temperatures (4 C) and high relative humidities (>90%) for 2–3 h. This environment has proven to favor the relatively quick formation of ordered mesostructures [78] and was established by placing substrates in dedicated aging boxes, namely sealable boxes with a reservoir of saturated KNO(aq) that can be stored inside a refrigerator. To evaporate remaining volatile compounds and complete the polycondensation, the films were stored inside a drying furnace at 100 C overnight. For template removal and network crystallization, the scotch tape was peeled of and preconsolidated films were calcined in air by increasing the temperature with +5 C min to elevated values of 350–650 C holding for 2 h and natural cooling to room temperature.
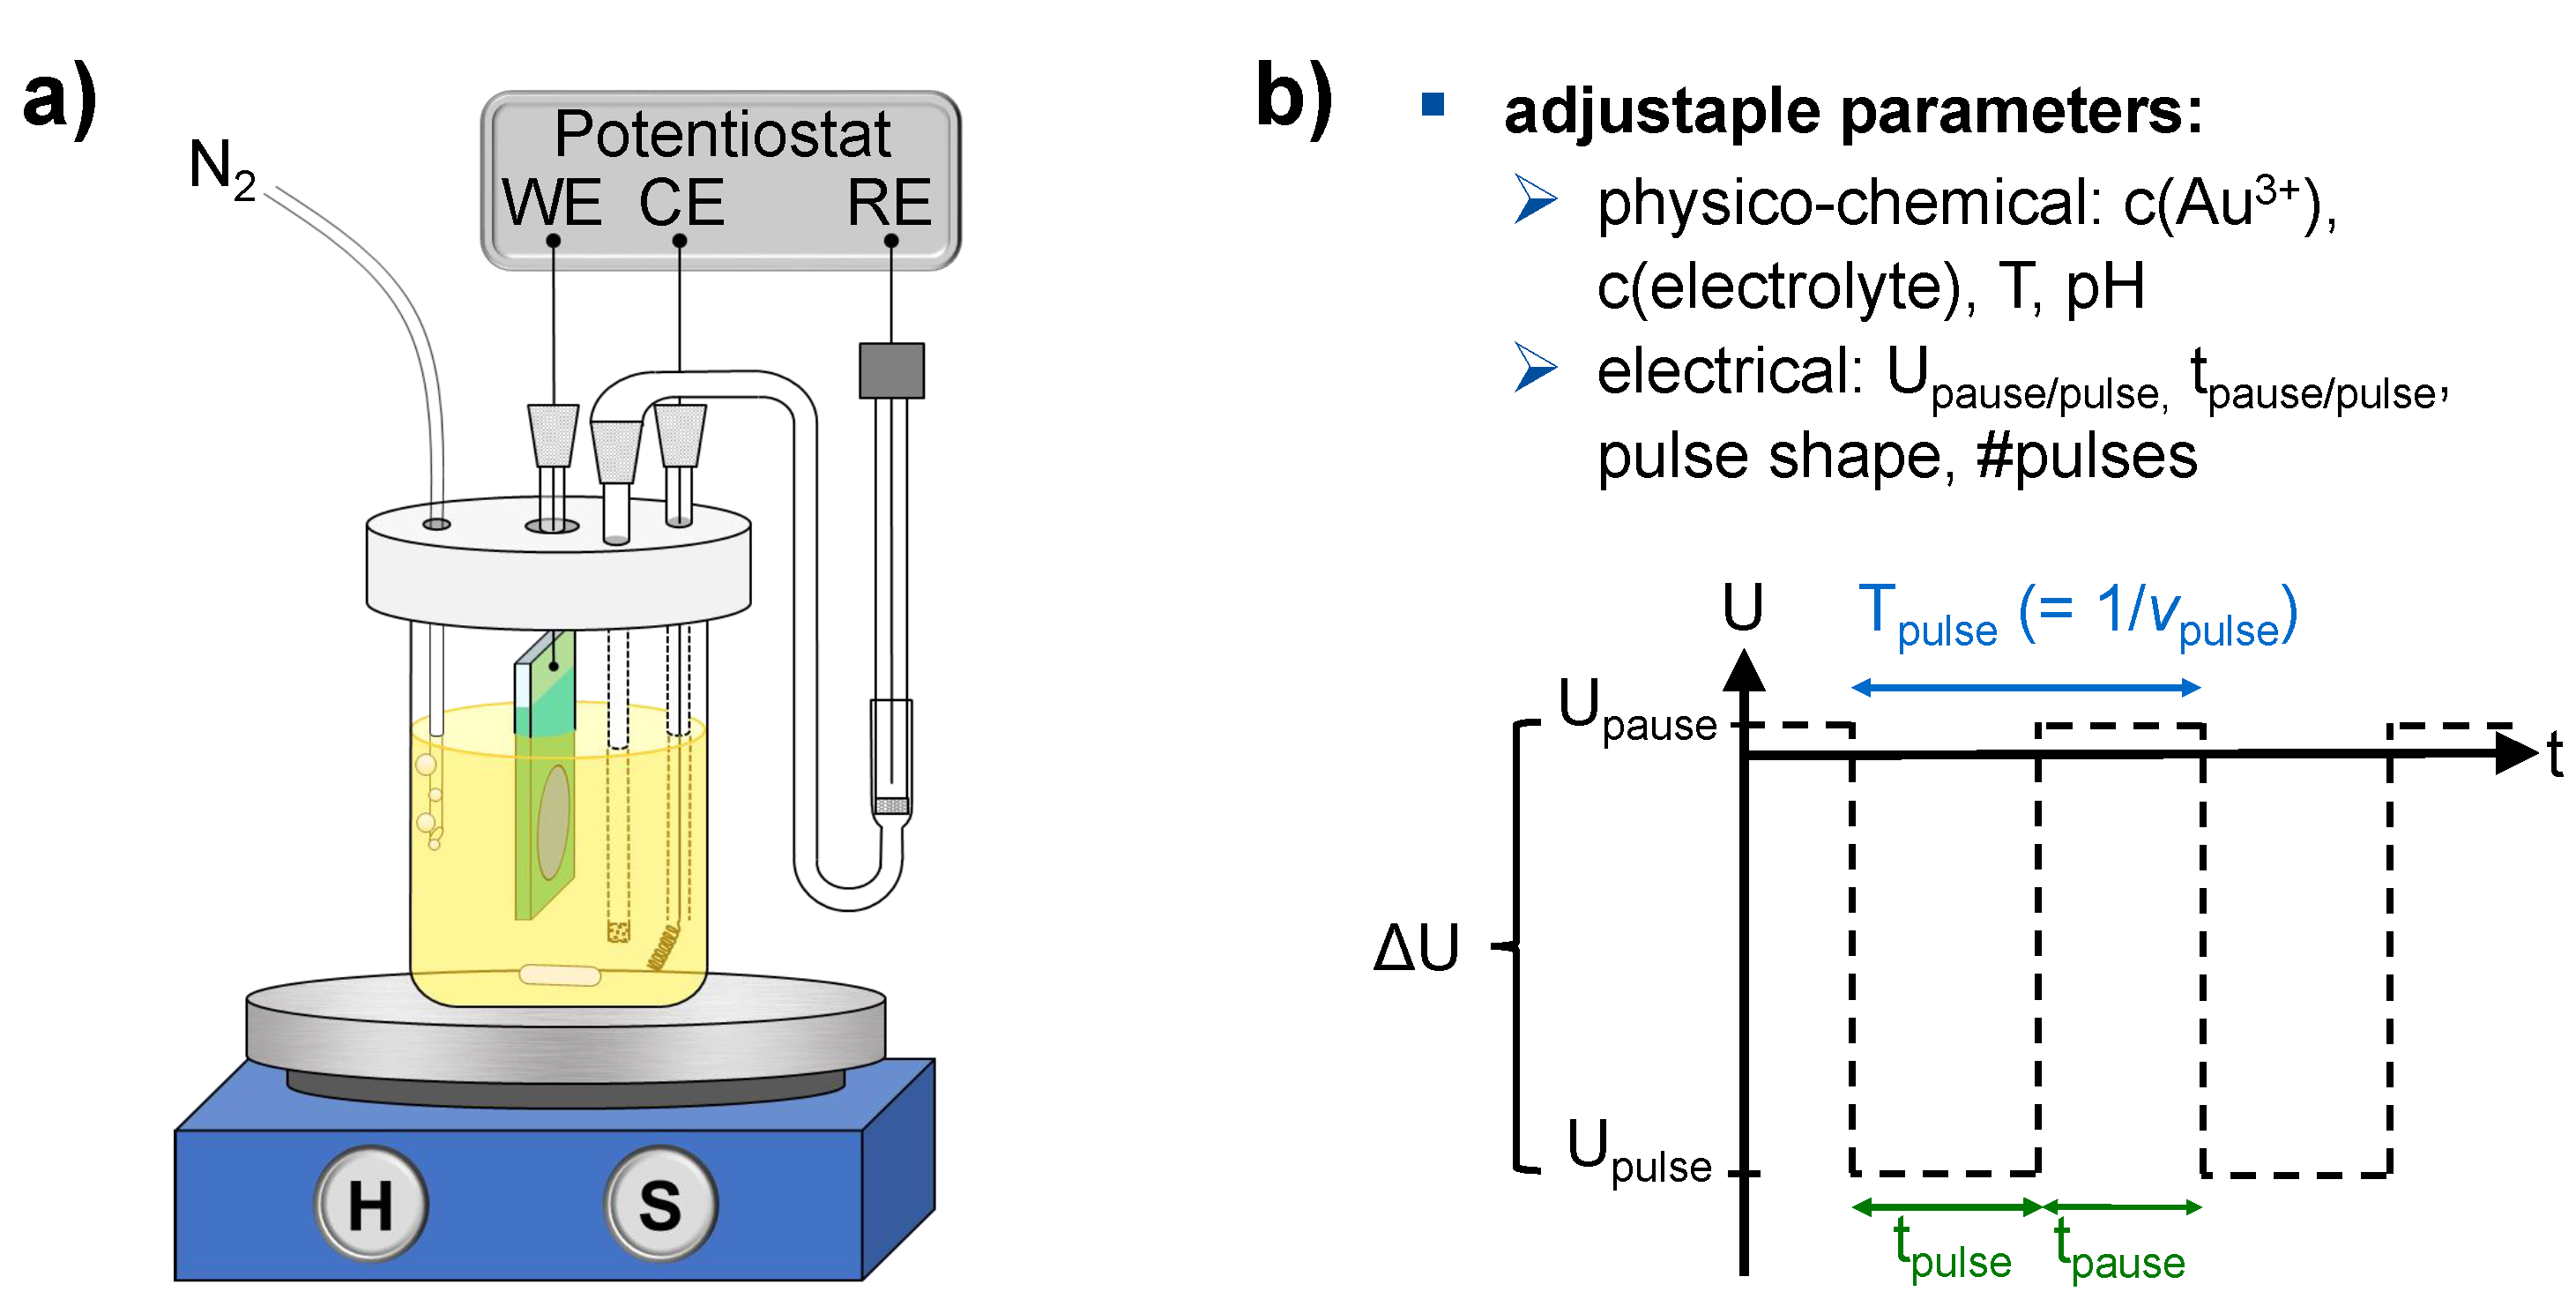
Pulsed electrodeposition of gold nanoparticles was carried out in a tree-electrode configuration schematically depicted in Figure 2a. A Pt coil, Ag/AgCl(sat. KCl) and a MTTF were connected to an AMEL 7050 potentiostat and were used as counter, reference and working electrodes, respectively. A salt bridge was used to separate reference electrode and deposition bath.
An aqueous solution of 10 mM HClO and 70 M HAuCl with a pH value of 2.1 was used as deposition bath and prior to the addition of the gold salt, the 10 mM HClO(aq) was purged with nitrogen for 30 min [50]. To ensure that a defined geometric sample area is exposed to the electrolyte solution, the MTTF was masked with a solvent resistant scotch tape leaving out a circular zone of 2 cm diameter (=3.14 cm). Electrodeposition was carried out at room temperature on single-layered MTTFs and involved reduction reaction towards elemental gold shown in Equation (1) [79]. Two oxidation reactions at the Pt anode are expectable when considering the used chemicals and applied potentials. They are mentioned in Equations (2) and (3) [79] but are of minor importance here.
The used electrochemical parameters rely on a previous study by Bannat et al. and involved a pulse potential of U = –2.0 V vs. Ag/AgCl, a pause potential of U = +0.1 V vs. Ag/AgCl, a pulse duration of t = 3.0 s, a pause duration of t = 0.1 s and a rectangular pulse shape [50]. Three different amounts of pulses were applied, namely 1, 8 and 16.
All involved physicochemical conditions are summarized in Figure 14 for better comparison.
2.3. Characterization of Mesoporous TiO Thin Films
Individual multi-layered MTTFs were characterized by means of UV/Vis and fluorescence spectroscopy as well as photoelectrochemical (PEC) water oxidation prior to a next deposition. Further experiments such as XRD, scanning electron microscopy (SEM) and nitrogen sorption were used for selected final samples only.
UV/Vis transmittance spectra in the range of = 200–800 nm were recorded with a Varian Cary 4000 UV/Vis spectrophotometer. Prior to the actual measurement, baseline correction was ensured by measuring a cleaned blank FTO/glass substrate that has been calcined with the same temperature program as the investigated MTTF sample.
Fluorescence emissions were measured in the range of = 400–600 nm with a Varian Cary Eclipse fluorescence spectrophotometer. The excitation wavelength was 380 nm.
Photoelectrochemical (PEC) measurements were performed using an electrochemical workstation with a main potentiostat (ZAHNER ZENNIUM Pro) and a secondary potentiostat (ZAHNER PP211) to power a UV-LED ( = 375 nm, = nm, 70 W·m incident photon flux). The experiments were controlled with a computer and the THALES XT software package. A PEC cell (ZAHNER PECC-2) was filled with aqueous 1 M NaOH of pH = 13.6 and a three-electrode configuration was established by using a platinum wire, Ag/AgCl(sat. KCl) and the MTTF as counter, reference and working electrodes, respectively. Electrical contact to the films was made with help of copper wires and copper tapes attached to the bare FTO part of each sample. All experiments were performed under front-side illumination, thus the light entered the PEC cell from the electrolyte side through a quartz window. To eliminate interference by external irradiation, the PEC cell was placed into a light exclusion box.
For better comparison towards results from literature, the applied potentials versus Ag/AgCl(sat. KCl) were also translated into potentials relative to the reversible hydrogen electrode (RHE) by using the Nernst equation:
Chronoamperometry (It) under UV irradiation was performed with six illumination-dark-periods of 10 s each at a fixed potential of 1.20 V versus RHE. Linear voltammetric scans, or briefly (IV) scans, were carried out under UV irradiation or in the dark to ensure that no impurity-related adulterations of the It data was present. Accordingly, voltage scans were performed in the range of +0.4 V to +2.25 V versus RHE with a scan rate of 15 mV·s. Prior to photoelectrochemical measurements of gold-loaded MTTFs, the electrolyte had to be purged for 30 min with nitrogen to replace dissolved air oxygen. This step is necessary to eliminate the reductive dark current related to the oxygen reduction reaction.
Cleaning was necessary to remove characterization-related impurities prior to the deposition of an additional MTTF layer. Conductive adhesive and remaining NaOH from the PEC characterization were removed by acetone and rinsing with de-ionized water, respectively. The cleaning was completed by a short period of ultrasonication in de-ionized water and an overnight drying at 100 C.
Scanning electron microscopy (SEM) was carried out using a FEI Helios NanoLab 600i. Prior to the experiment, substrates were cut and affixed onto aluminum sample holders using conductive carbon tape and copper wires before applying conductive silver adhesive. SEM images of both surfaces and breaking edges were recorded with a secondary electron detector in a working distance of 4 mm and with an acceleration voltage of 10 kV and an electron beam current of 0.17 nA.
Combined energy dispersive X-ray spectroscopy and scanning electron microscopy (EDX-SEM) was used for gold-loaded MTTFs. Acceleration voltage and electron beam current were raised to 20 kV and 5.5 nA, respectively. F, Si, Ti, Sn and Au were selected as elements to assign and overlay pictures of the collected EDX mappings were generated with the EDX Genesis software.
Grazing incident X-ray diffractograms (GI-XRD) were obtained with a PANalytical Empyrean diffractometer with CuK = 1.54 Å radiation at an incident angle of 0.5. The Scherrer equation was applied to determine the average crystallite sizes.
Nitrogen adsorption-desorption was measured with a Micromeritics ASAP 2020 device. Prior to the adsorption measurements, the samples were degassed at 150 C for 2 h at a base pressure of 2 × 10 mm Hg. For each measurement, two identically prepared MTTF substrates were placed inside a special substrate holder. Surface areas calculated according to the formalism established by Brunauer, Emmett and Teller (BET) from two selected partial pressures (0.005 p/p and 0.038 p/p) and were related to the MTTFs’ geometric surfaces due to the very low and in general hard to determine mass of individual films. The two-point calculation was selected in all cases since it was only possibly to collect full sorption isotherms for samples with >4 layers. Pore size distributions were calculated from the desorption branches of the isotherms using the Barrett–Joyner–Halenda (BJH) model.
3. Results and Discussion
3.1. Single-Layered Films
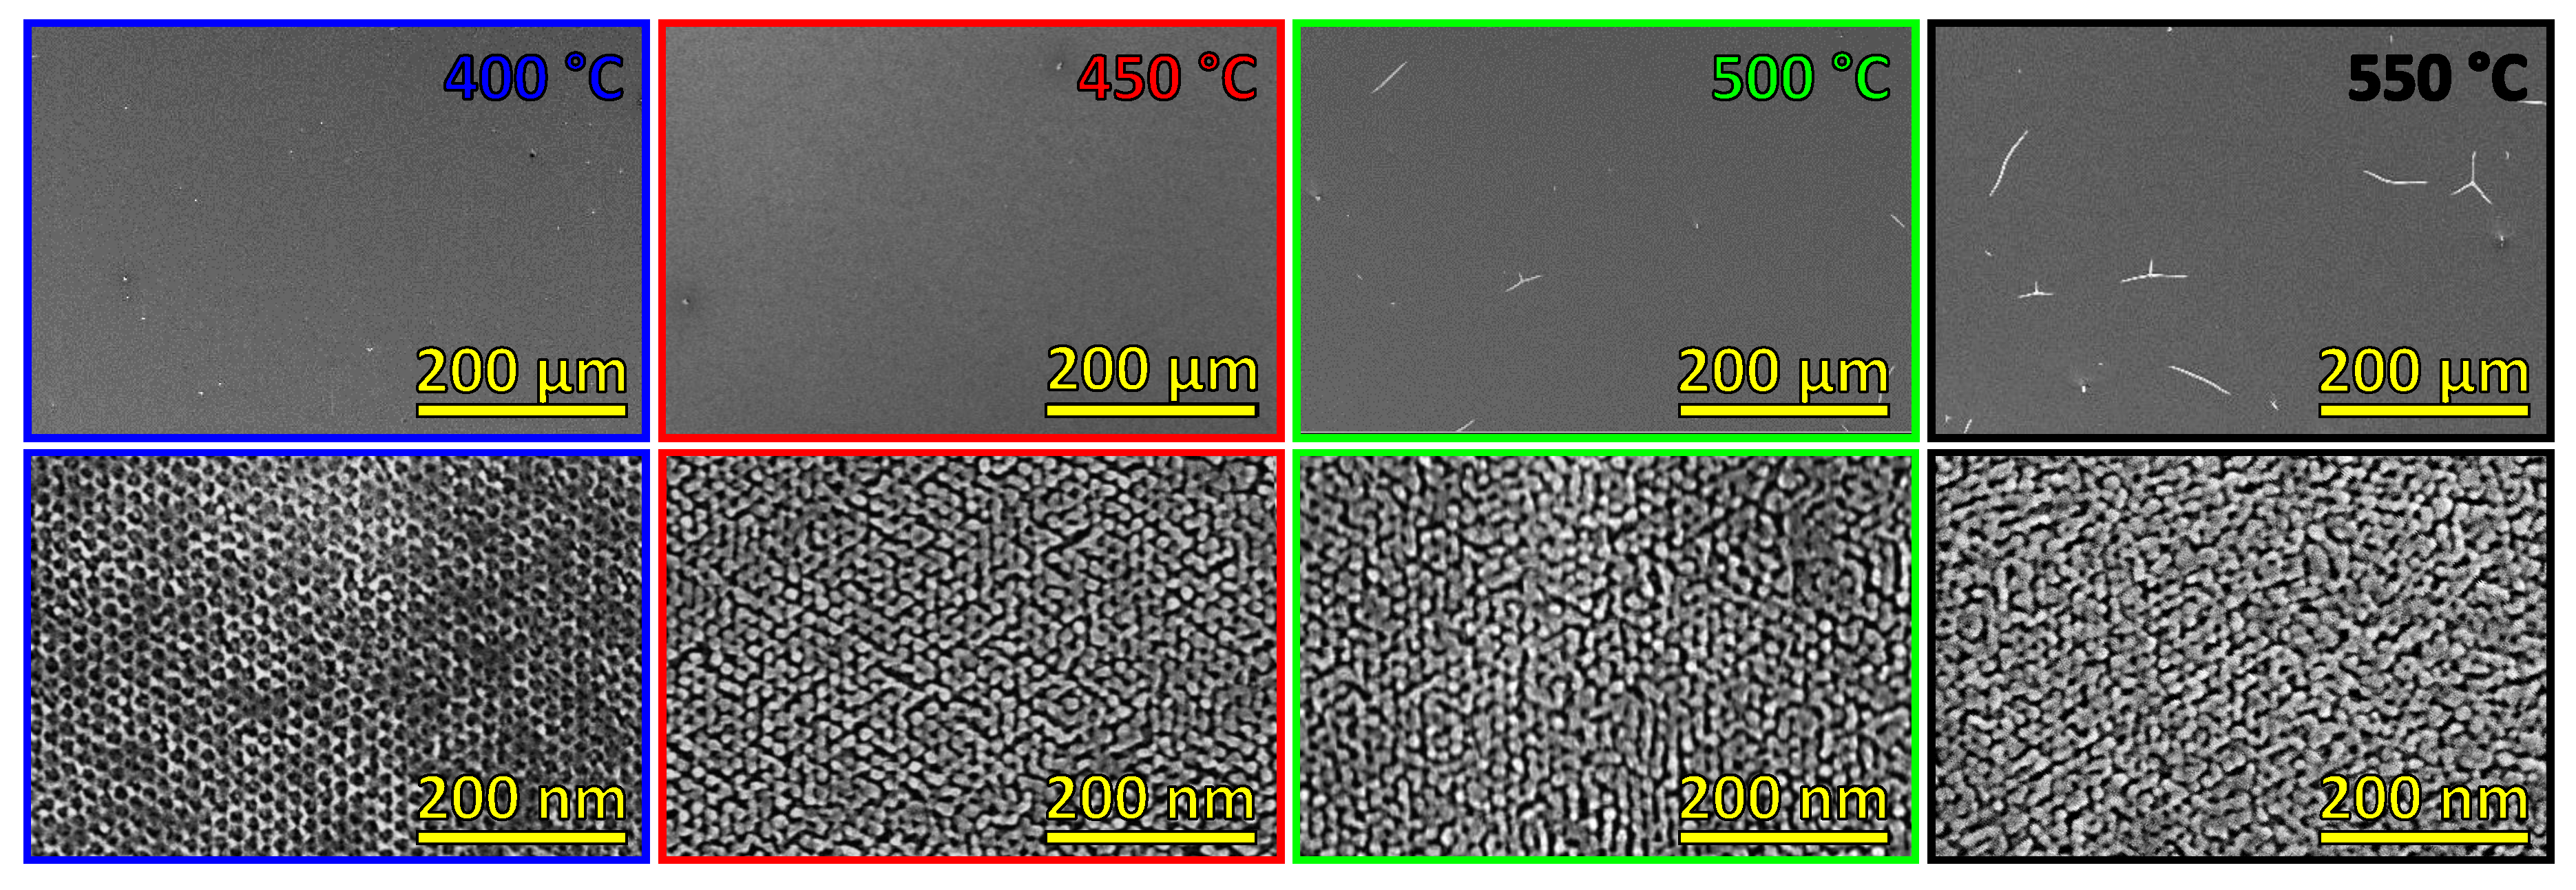
Figure 3 shows top-view SEM images of four single-layered MTTFs after different calcination temperatures between 400–550 C. After the 400 C treatment, the desired well-ordered mesoporous structure was obtained which is in good agreement with the protocol by Nagpure et al. [77]. With higher temperatures, the mesostructure becomes increasingly deteriorated, involving wall collapses and particle agglomeration. This observation that a formerly pristine network consisting of closely packed micelles within an amorphous TiO matrix experiences structural deterioration (and formation of worm-like structures) upon air calcination has been commonly observed for MTTFs and is explained in terms of mass migration that accompanies the proceeding crystallization [62,80]. At the macroscopic scale, higher temperature treatment affected the structure of the film leading to cracks encompassing larger regions of FTO which appear much brighter than the TiO in the SEM images. The measured thickness was around 450 nm for a single-layered film calcined at 550 C (shown later in Figure 7). This is almost twice as much as the ≈250 nm mentioned by Rankin et al. [77] who reported the use of an identical EISA-sol composition as well as similar aging/thermal treatment. Unfortunately, these authors did not mention their dip-coating conditions (most importantly the used withdrawal rate). Other thicknesses were not determined within this study, but it was shown elsewhere that the thermally induced structural collapse is accompanied with a shrinkage of films [81].
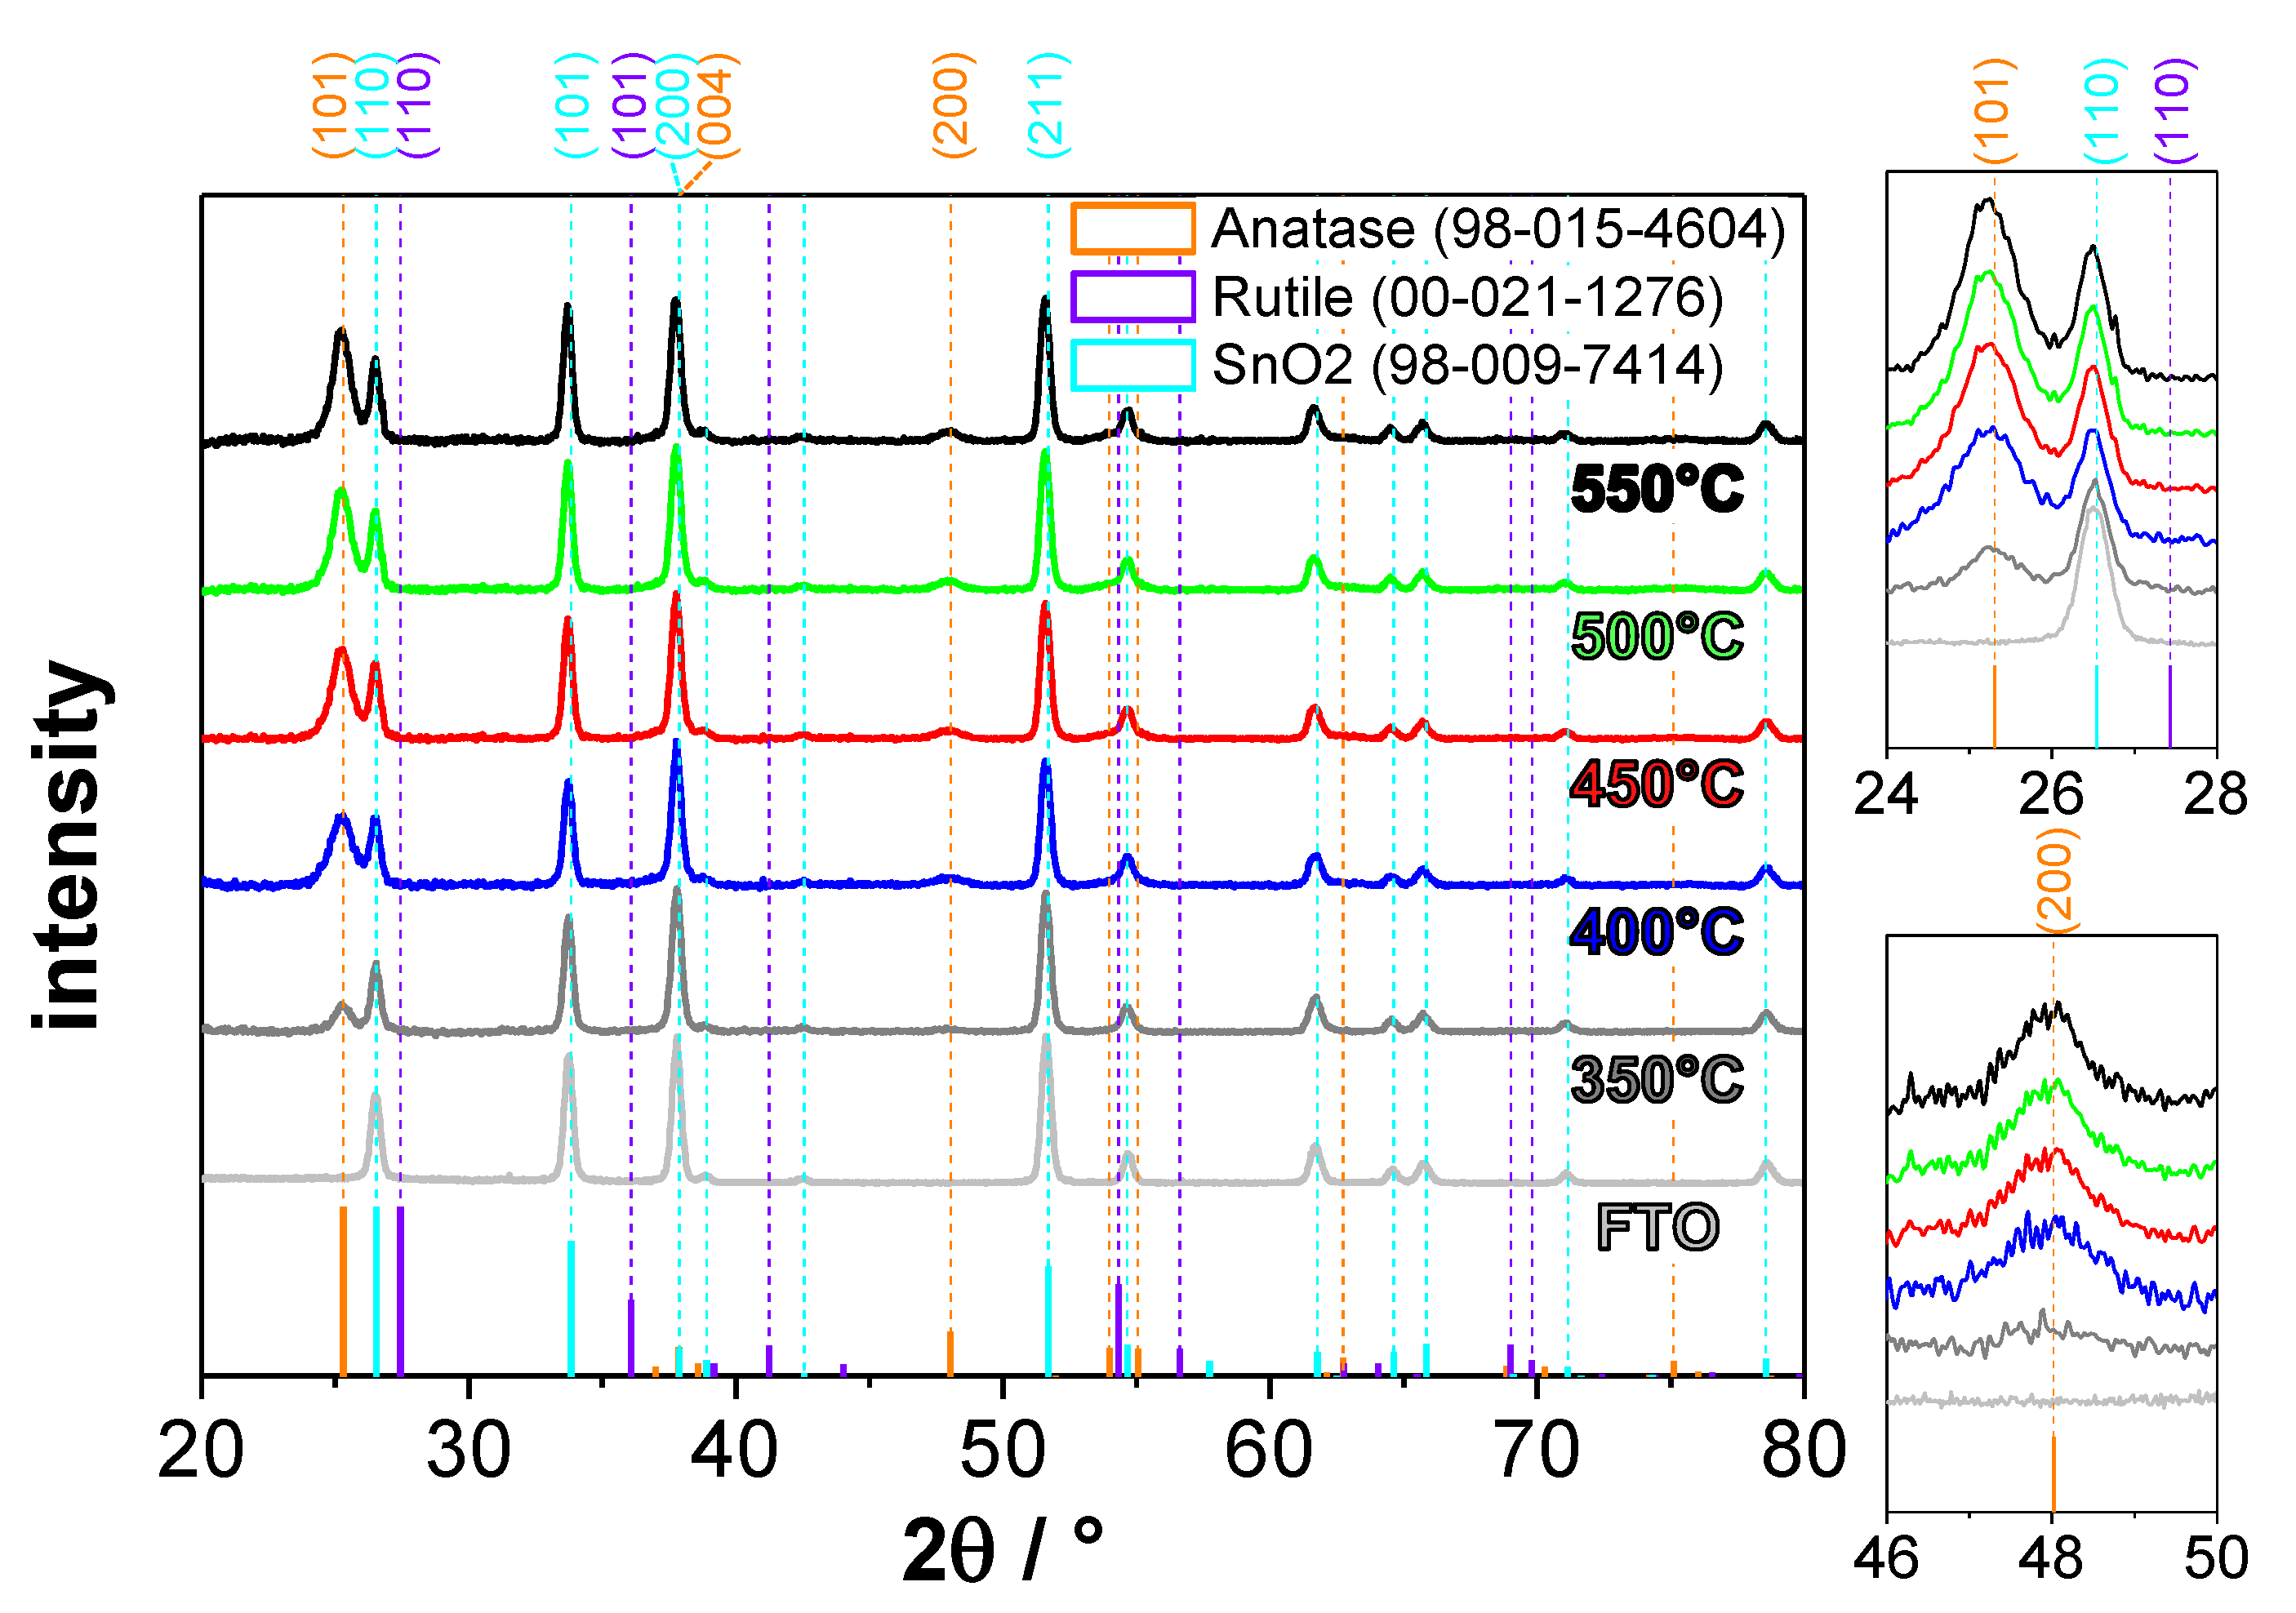
To analyze phase composition and crystallinity as a function of calcination temperature, grazing incidence X-ray diffraction was used. The obtained diffractograms for single-layered MTTFs treated at different temperatures between 350–550 C are shown in Figure 4. Reference patterns of anatase TiO [82], rutile TiO [83] and SnO [84] (as a representative for FTO) are included for reflex assignment and a diffractogram of a blank FTO/glass substrate was measured to identify the contribution of the FTO to the recorded diffractograms.
The observed reflexes in the blank FTO diffractogram can be explained with the used reference pattern of SnO in its rutile modification [84]. It is worth mentioning that the (200) orientation at 37.5 of 2 is preferential in the used FTO/glass substrates. After a 350 C thermal treatment, a weak anatase (101) reflex at 25.3 of 2 is already visible but FTO-related reflexes dominate (e.g., those related to the (110), (101), (200) and (211) planes at 26.3, 33.7, 37.5 and 51.3 of 2, respectively). Those reflexes are part of all diffractograms of single-layered MTTFs as result of the small TiO thickness. However, they start to diminish with additionally deposited layers (shown later in Figure 8). With higher calcination temperatures, the anatase phase becomes more crystalline as more intense (still broad) signals are observed (see insets). Average crystallite sizes for the most pronounced anatase reflex, namely (101), were calculated using the Scherrer equation and the results are summarized in Table 1. The observed average grain size increases for elevated calcination temperatures from 16 nm to 28 nm for samples treated at 400 and 550 C, respectively are caused by mass migration and particle agglomeration during crystallization [62,80]. This agrees with the structural deterioration observed from the SEM imaging. No formation of rutile was observed in the investigated temperature range, indicating anatase is the exclusive phase in the MTTF. For instance, the most prominent rutile reflex, namely the (110) plane expected at 27.4 of 2, was not formed at all (see upper inset in Figure 4). However, also less pronounced rutile reflexes such as its (101), (111), and (301) plane (expected around round 36.0, 41.2 and 69.0 of 2, respectively) were absent. This is in accordance with previous reports, where highly thermally stable MTTFs were investigated and the formation of rutile was not observed for temperatures below 700 C [60,85,86].
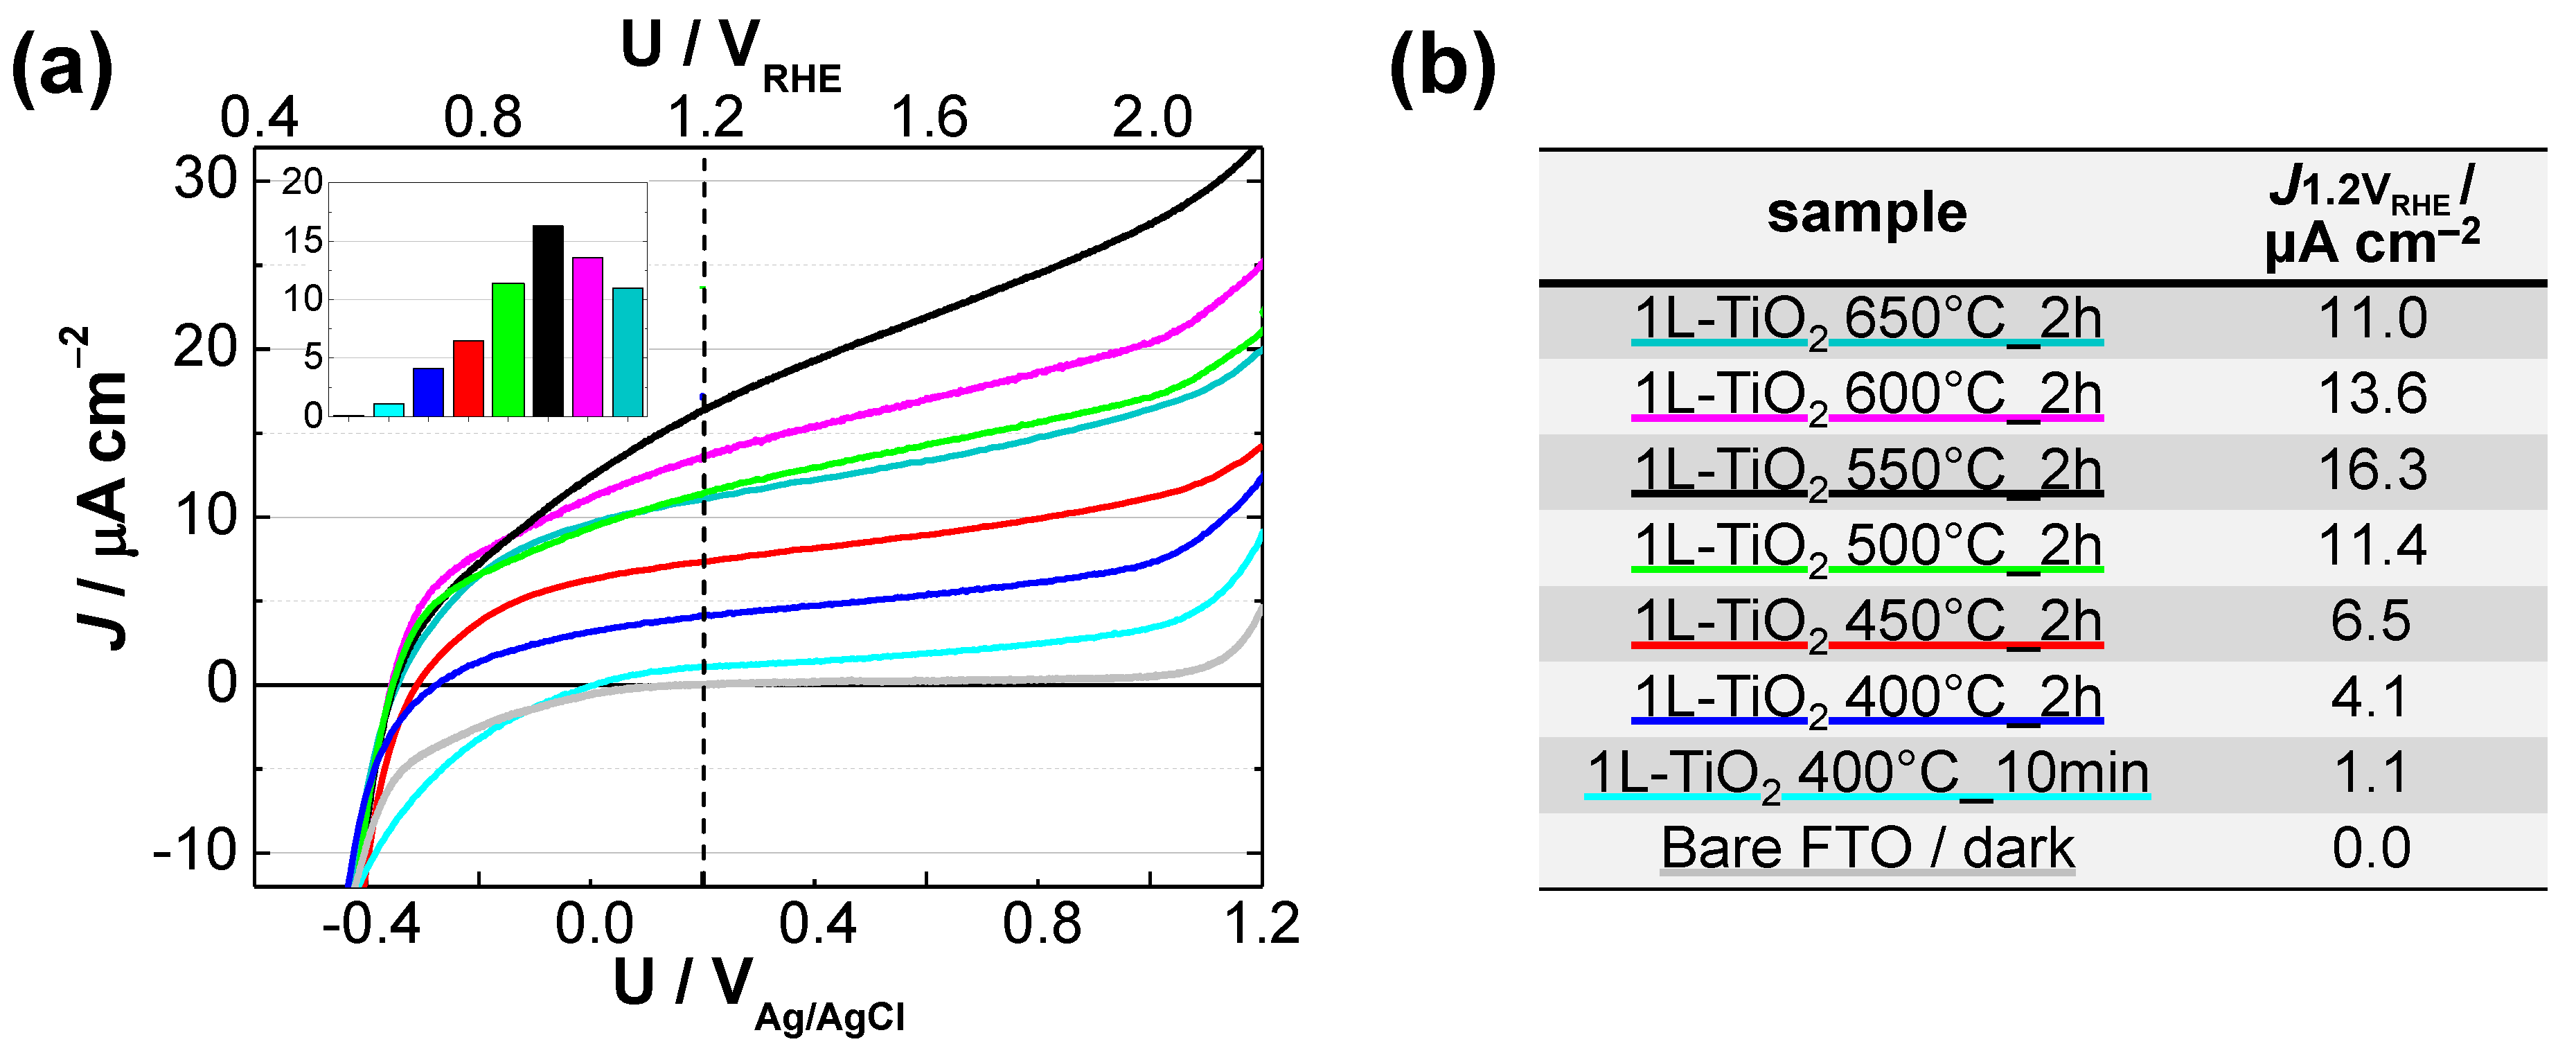
The photoactivity of single-layered films was measured by means of photoelectrochemical water oxidation under UV illumination. Linear voltammetric scans of thermally treated MTTFs at different temperatures are shown in Figure 5.
The observed photocurrent densities strongly depend on the chosen calcination program and reach a maximum for the 550 C treated samples. Higher calcination temperatures result in decreased photocurrent densities, which is likely related to a larger degree of mesostructural collapse that can no longer be overcompensated by simultaneously improving crystallinity of the MTTF. Such trade-offs between improved optoelectrochemical properties on the one hand and loss of accessible active sites on the other are commonly observed for MTTFs [58,62]. The optimal temperature for a given photocatalytic device not only depends on the involved chemicals and their procession but also on its later purpose. In the context of this study, the calcination program with a holding temperature of 550 C was chosen for the preparation of multi-layered films. This thermal treatment gives highest photoactivities due to improved crystallinity and a still accessible (albeit deteriorated) pore structure.
3.2. Multi-Layered Films
Multi-layered films with up to 10 layers have been prepared in terms of an “interrupted” layer-by-layer deposition which is schematically depicted in Figure 1 on page 3. Accordingly, a typical deposition cycle consisted of the dip-coating deposition, followed by a high humidity aging treatment at low temperatures, an overnight preconsolidation at 100 C and finally the calcination at the optimized temperature of 550 C. It is emphasized that the term “interrupted” derives from the fact that individual films were characterized prior to the next layer deposition. Such a characterization usually involved UV/Vis and fluorescence spectroscopy and—more importantly—photoelectrochemical characterization in terms of water oxidation in a highly alkaline media. This interim characterization/cleaning is meant to ensure (i) the sole effect of additional layers by avoiding sample variations and (ii) the robustness of the films without losing activities. However, its potential effect on the observed photoelectrocatalytical and structural properties must be considered in context of our experimental findings.
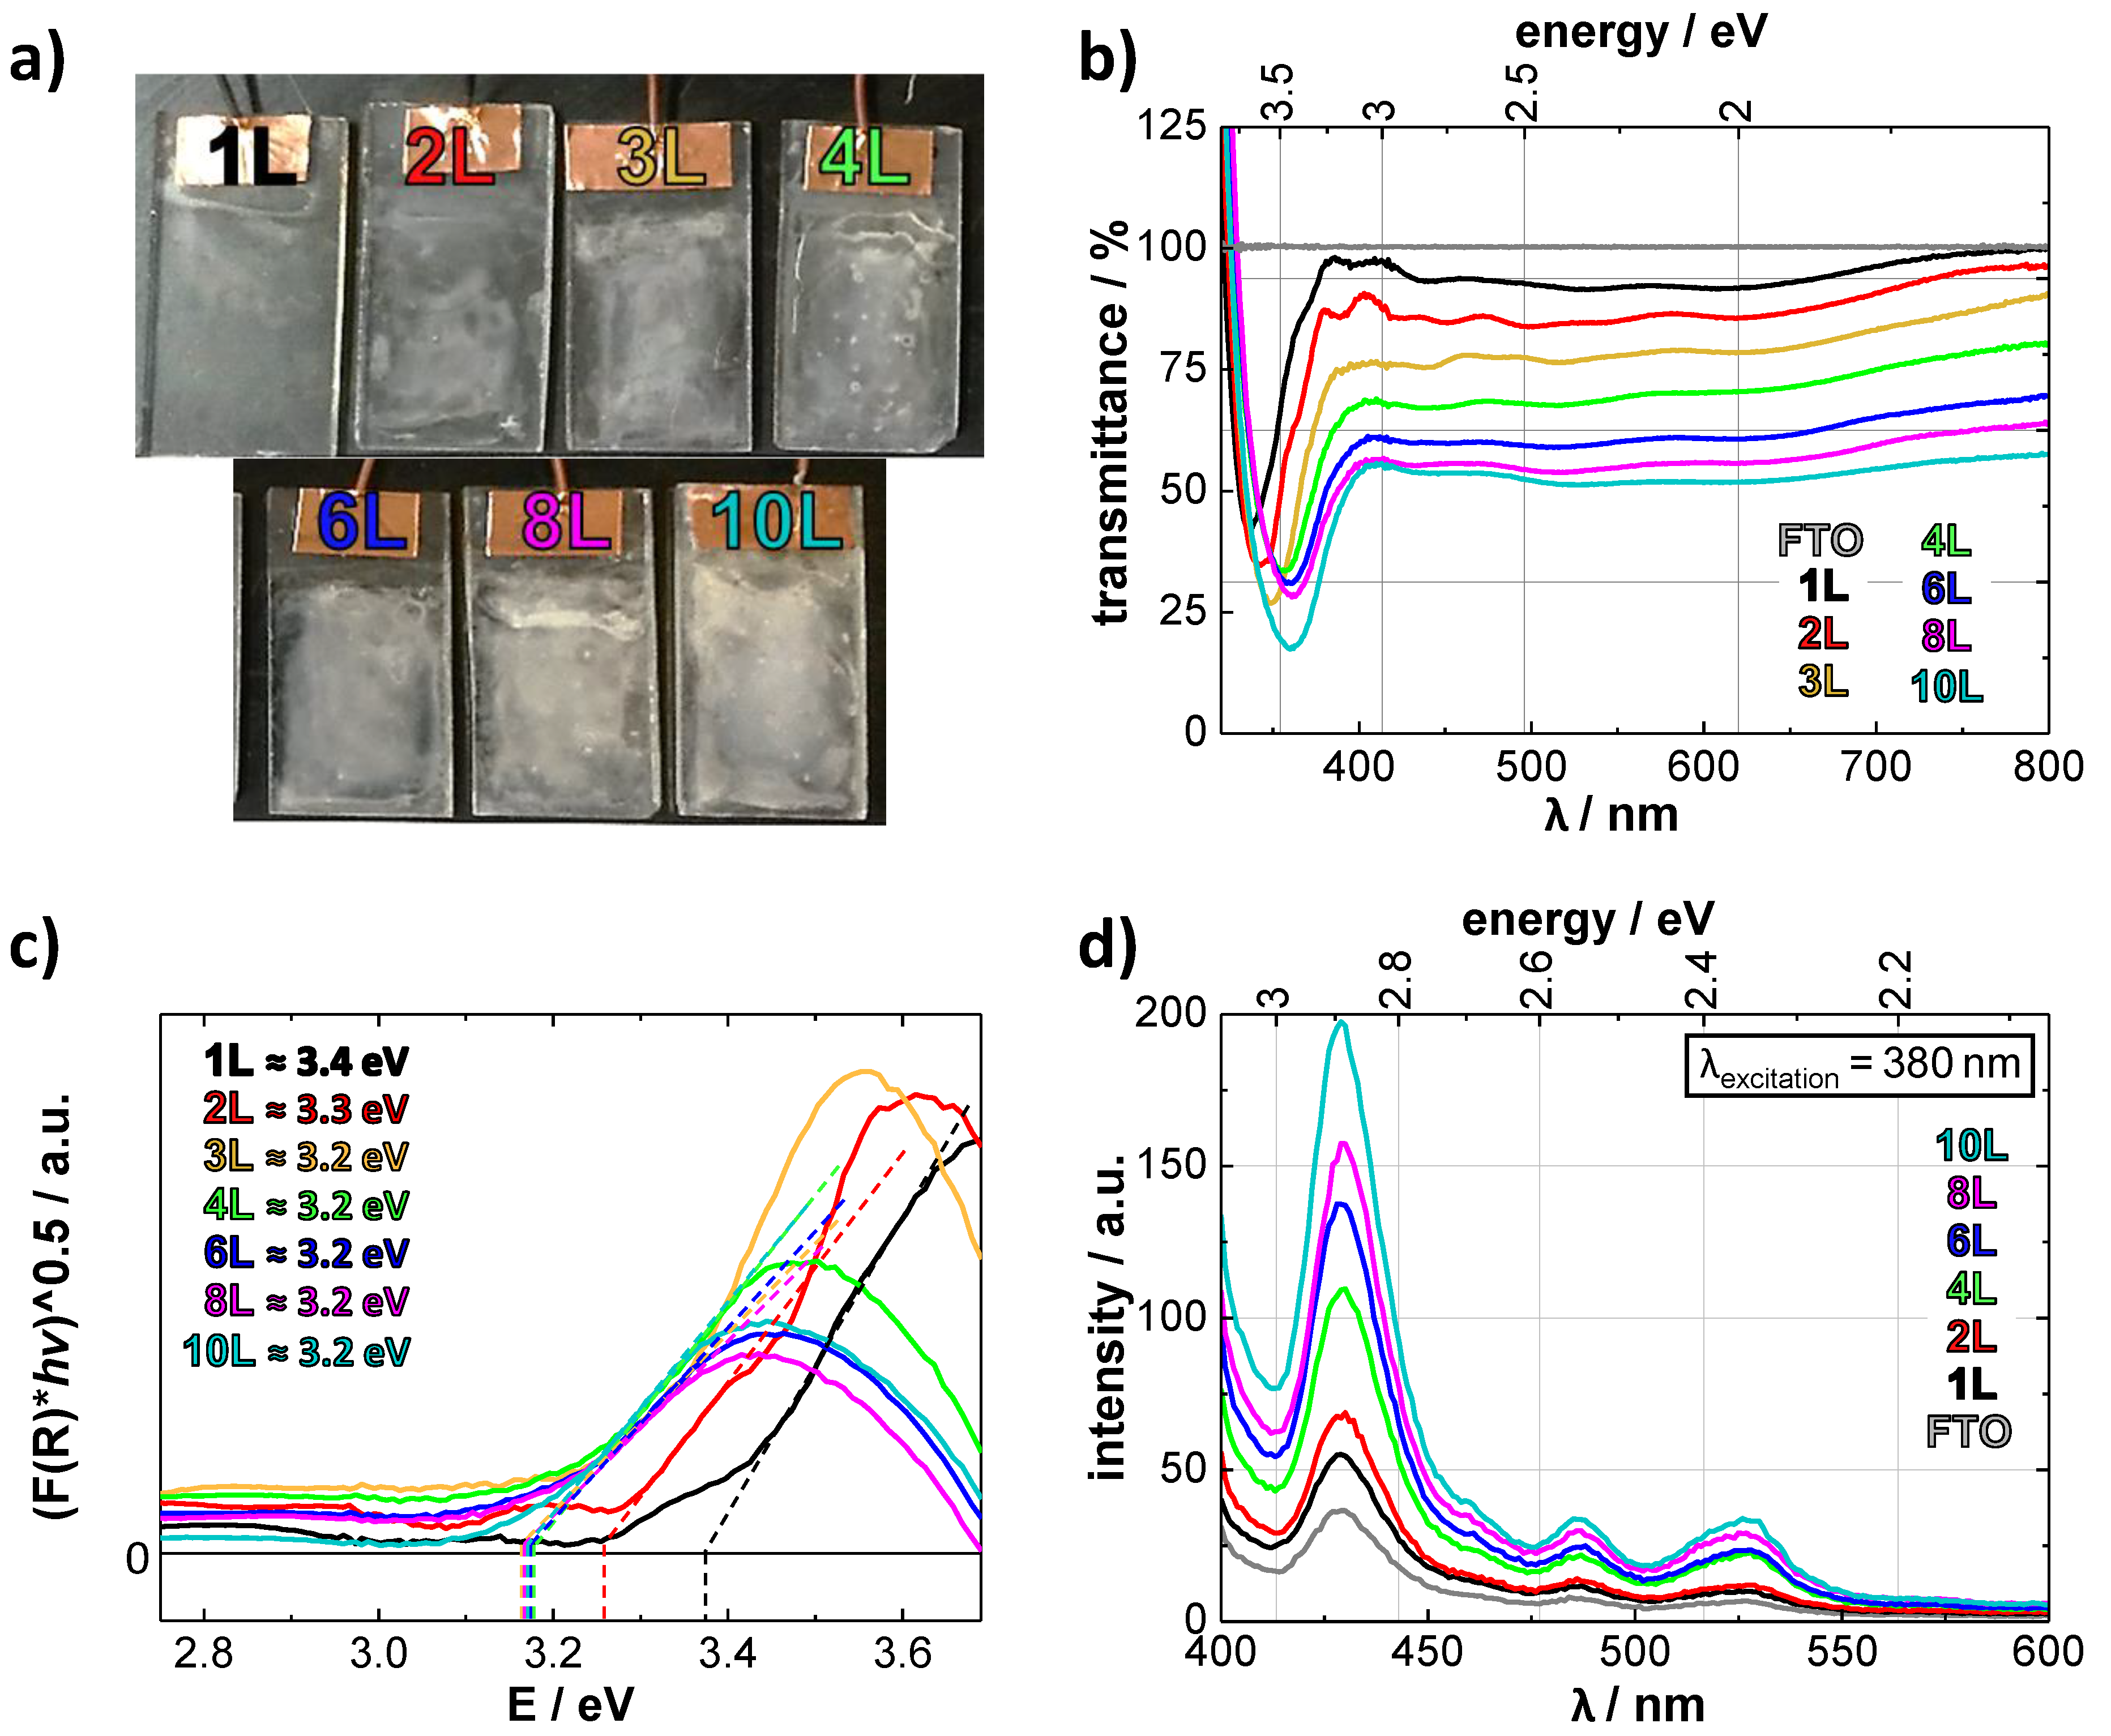
Figure 6 illustrates the optical properties of the obtained MTTFs. Part (a) shows a side-by-side photograph of selected multi-layered substrates. Increasing opacities in the visible range already indicate additional amounts of TiO with each new layer.
This observation is confirmed in terms of the UV/Vis transmittance spectra shown in Figure 6b where the increasing opacity is apparent in both the UV and visible range. While reduced UV transmittance is entirely intentional and the decisive motivation for multi-layer formation in the first place, the optical opacity might be beneficial for intended future incorporation of plasmonic nanoparticles. The intense back-scattering of visible photons within the film implies that more visible photons could be consumed for surface plasmon resonance.
Figure 6c shows the Tauc plots and optical band gaps. While single- and double-layered films show slightly higher band gaps of ≈3.4 eV and ≈3.3 eV respectively, films consisting of four and more layers display values close to the expected 3.2 eV of TiO in its anatase modification [2]. This observation of slightly larger optical band gaps for 1L and 2L could hint at quantum size effects that disappear with particle growth due to the additional thermal processing of multi-layered films. Analysis of peak broadening from the Gi-XRD pattern (Figure 8) however, does not reveal increased grain sizes. In fact, the average crystallite sizes for the most dominant (101) reflexes remain relatively unaltered at 27 nm. However, these grains might consist of coalesced (aggregated) small nanoparticles, which only sinter completely during additional thermal treatment.
The deposition of additional TiO is furthermore confirmed by fluorescence spectroscopy as increasingly intense fluorescence emissions indicate in Figure 6d. These results are only considered to be qualitative indicators for the presence of higher TiO amounts and any further interpretation is not considered here. Briefly, the experience that one and the same sample occasionally shows noticeable fluctuations of fluorescence intensities gives reason for this perception.
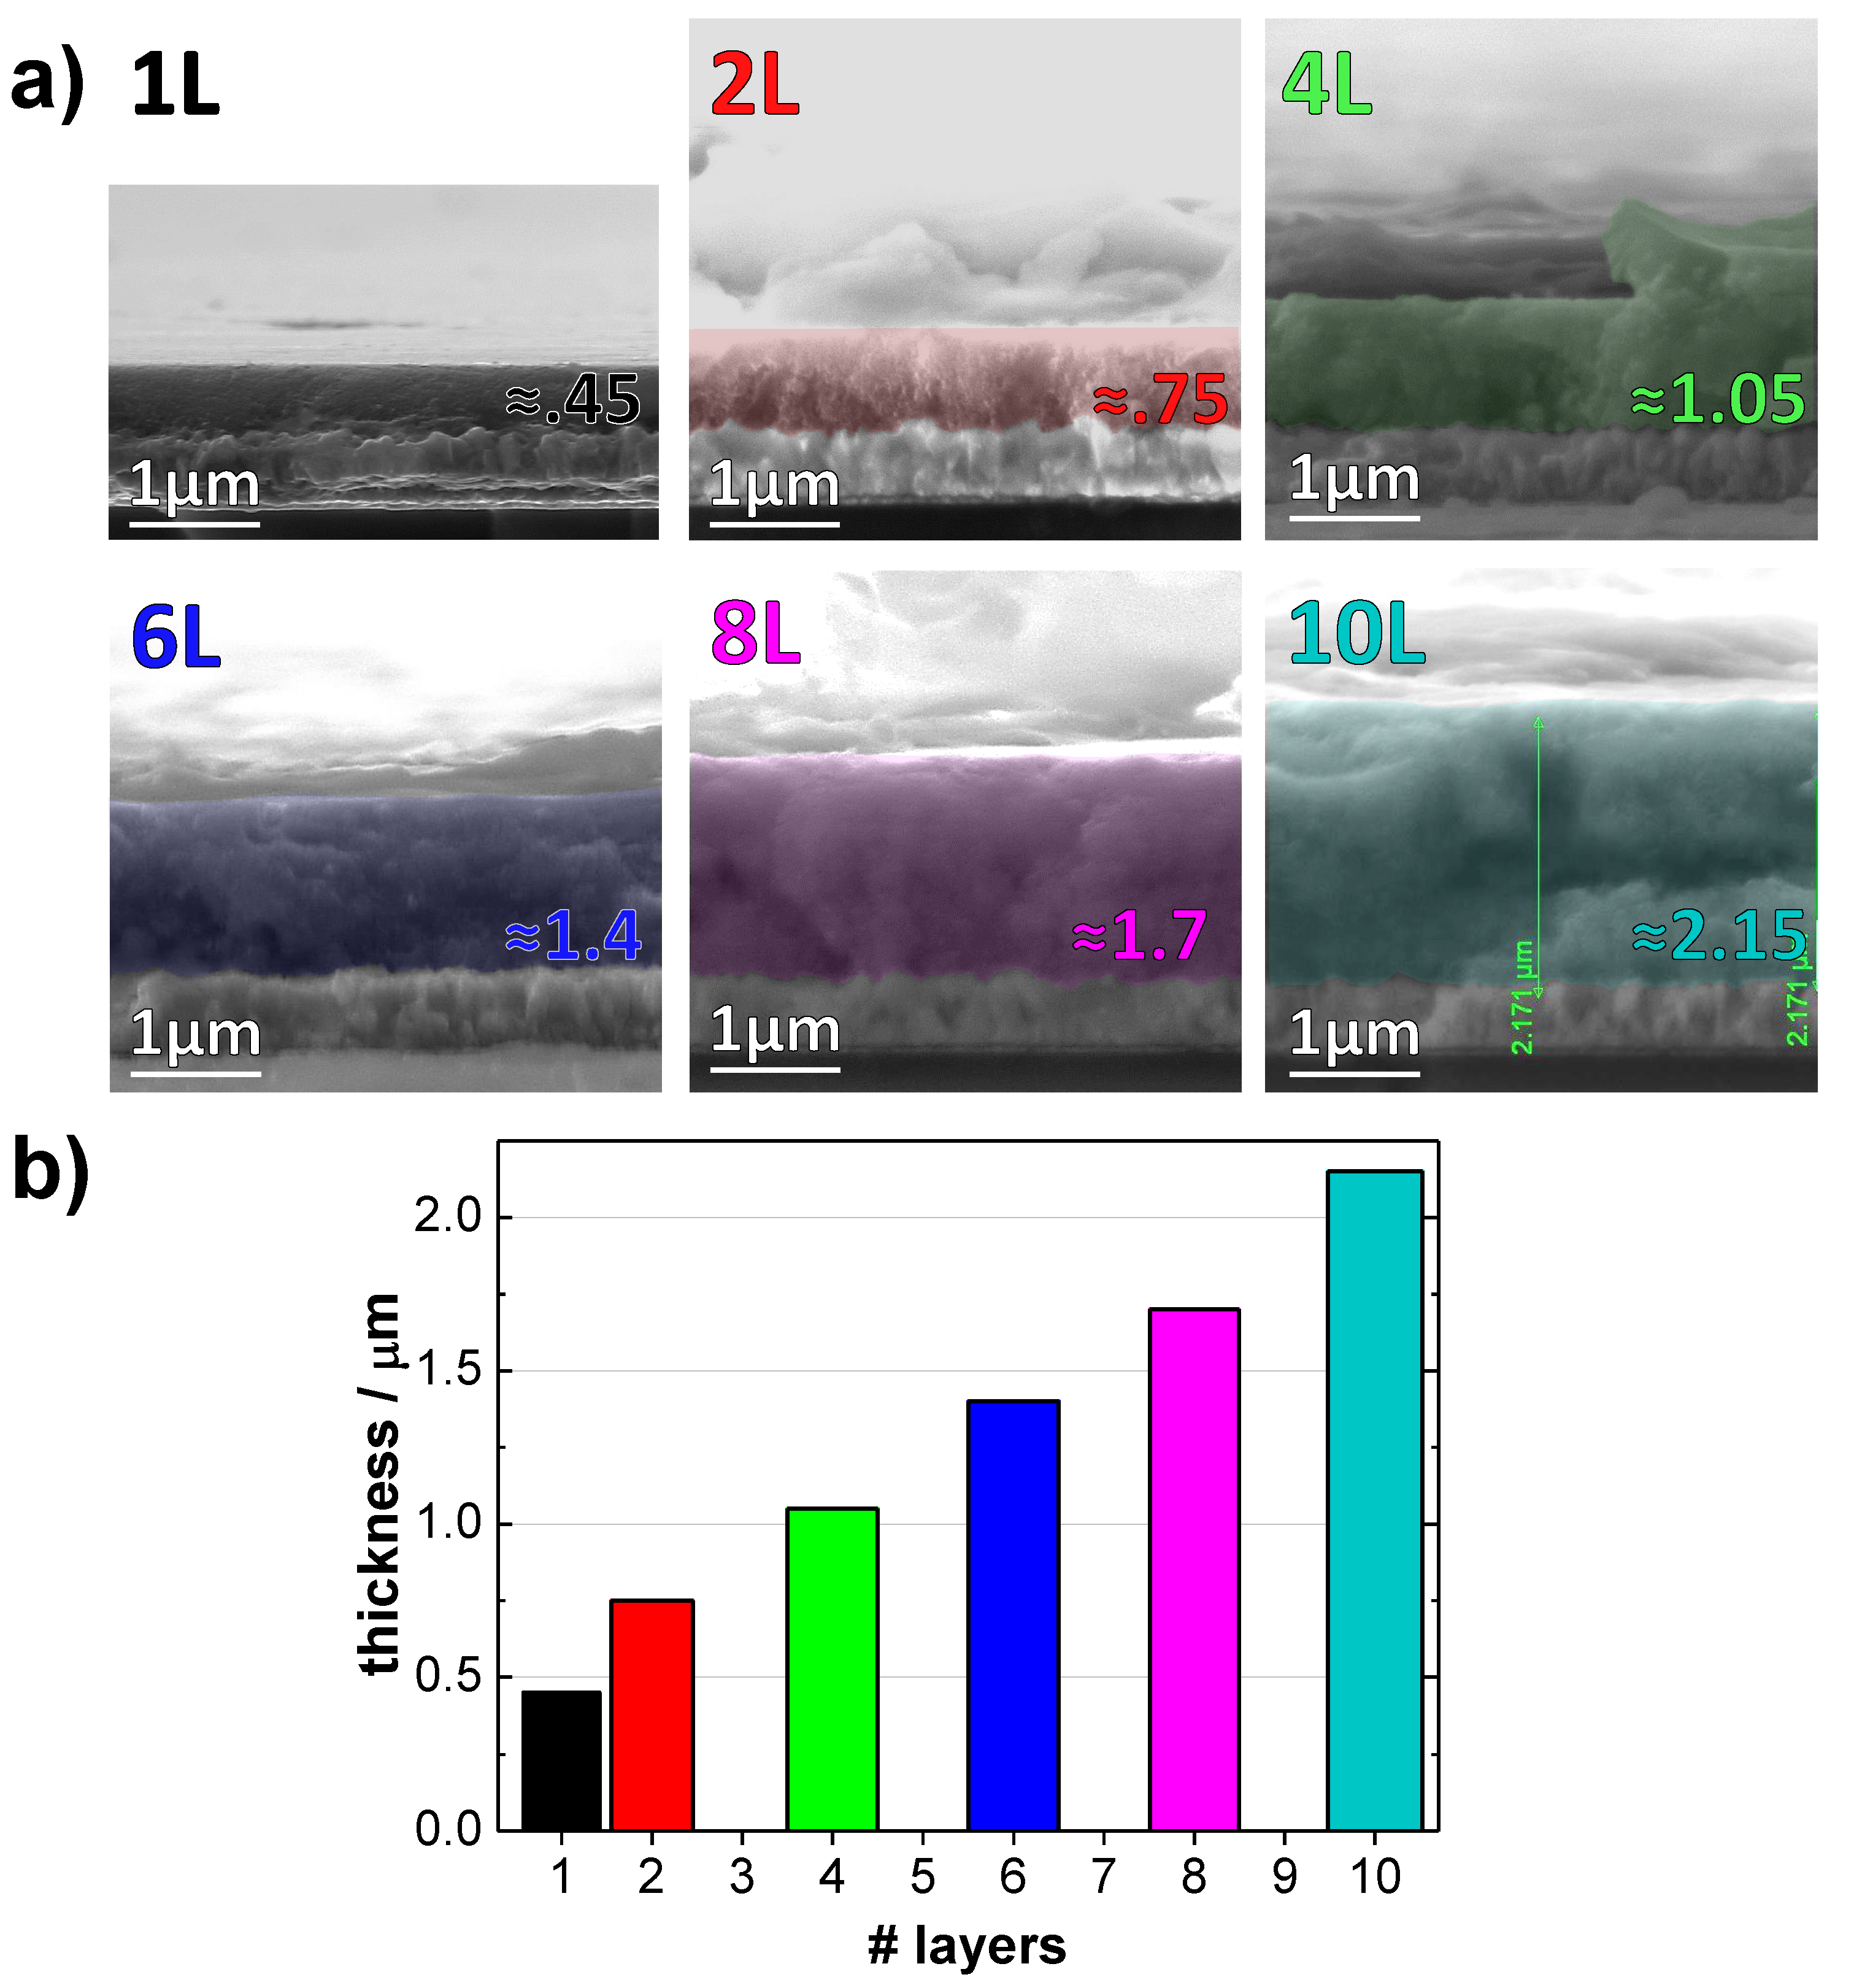
A more reliable evidence for the additional deposition of TiO is the development of film thickness which was determined by SEM imaging of breaking edges and is shown in Figure 7.
The development of 0.45, 0.75, 1.05, 1.4, 1.7 and 2.15 m for 1-, 2-, 4-, 6-, 8- and 10-layered films, respectively is in fact not as clearly indicative for a linear correlation between film thickness and number of deposited layers as claimed by other authors [47,73,74,75,87,88]; however, a subsequent gain of TiO is evident. Considering the development from 2–10 layers, a linear increase (of ≈150–200 nm per layer) can be determined. Thus, only the first two layers with their above-the-average thickness exhibit an exception.
One possible explanation for the exceptionally high thickness of 0.45 m of the first layer could be that the surface initially deposited onto (FTO) displays a significantly different environment compared to that of all subsequent layers (mesoporous TiO). Another explanation regarding the second layer could be related to the 550 C air calcination and total oxidative removal of surfactants that fully exposes the porous structure of the first layer. This in turn might allow another EISA-sol infiltration compared to higher-layered MTTFs later. In fact, the Grosso group reported a layer-by-layer synthesis route involving an interposed dip-coating into a diluted ethanolic surfactant solution (just these two chemicals) to allow pore refilling of thermally exposed mesopores prior to subsequent dip-coating into EISA-sol [73]. Such a treatment allowed a linear increase of film thickness. For more than two layers indeed, a more or less linear dependence is observed indicating an “equilibrated sub-surface” for the subsequent deposition cycle.
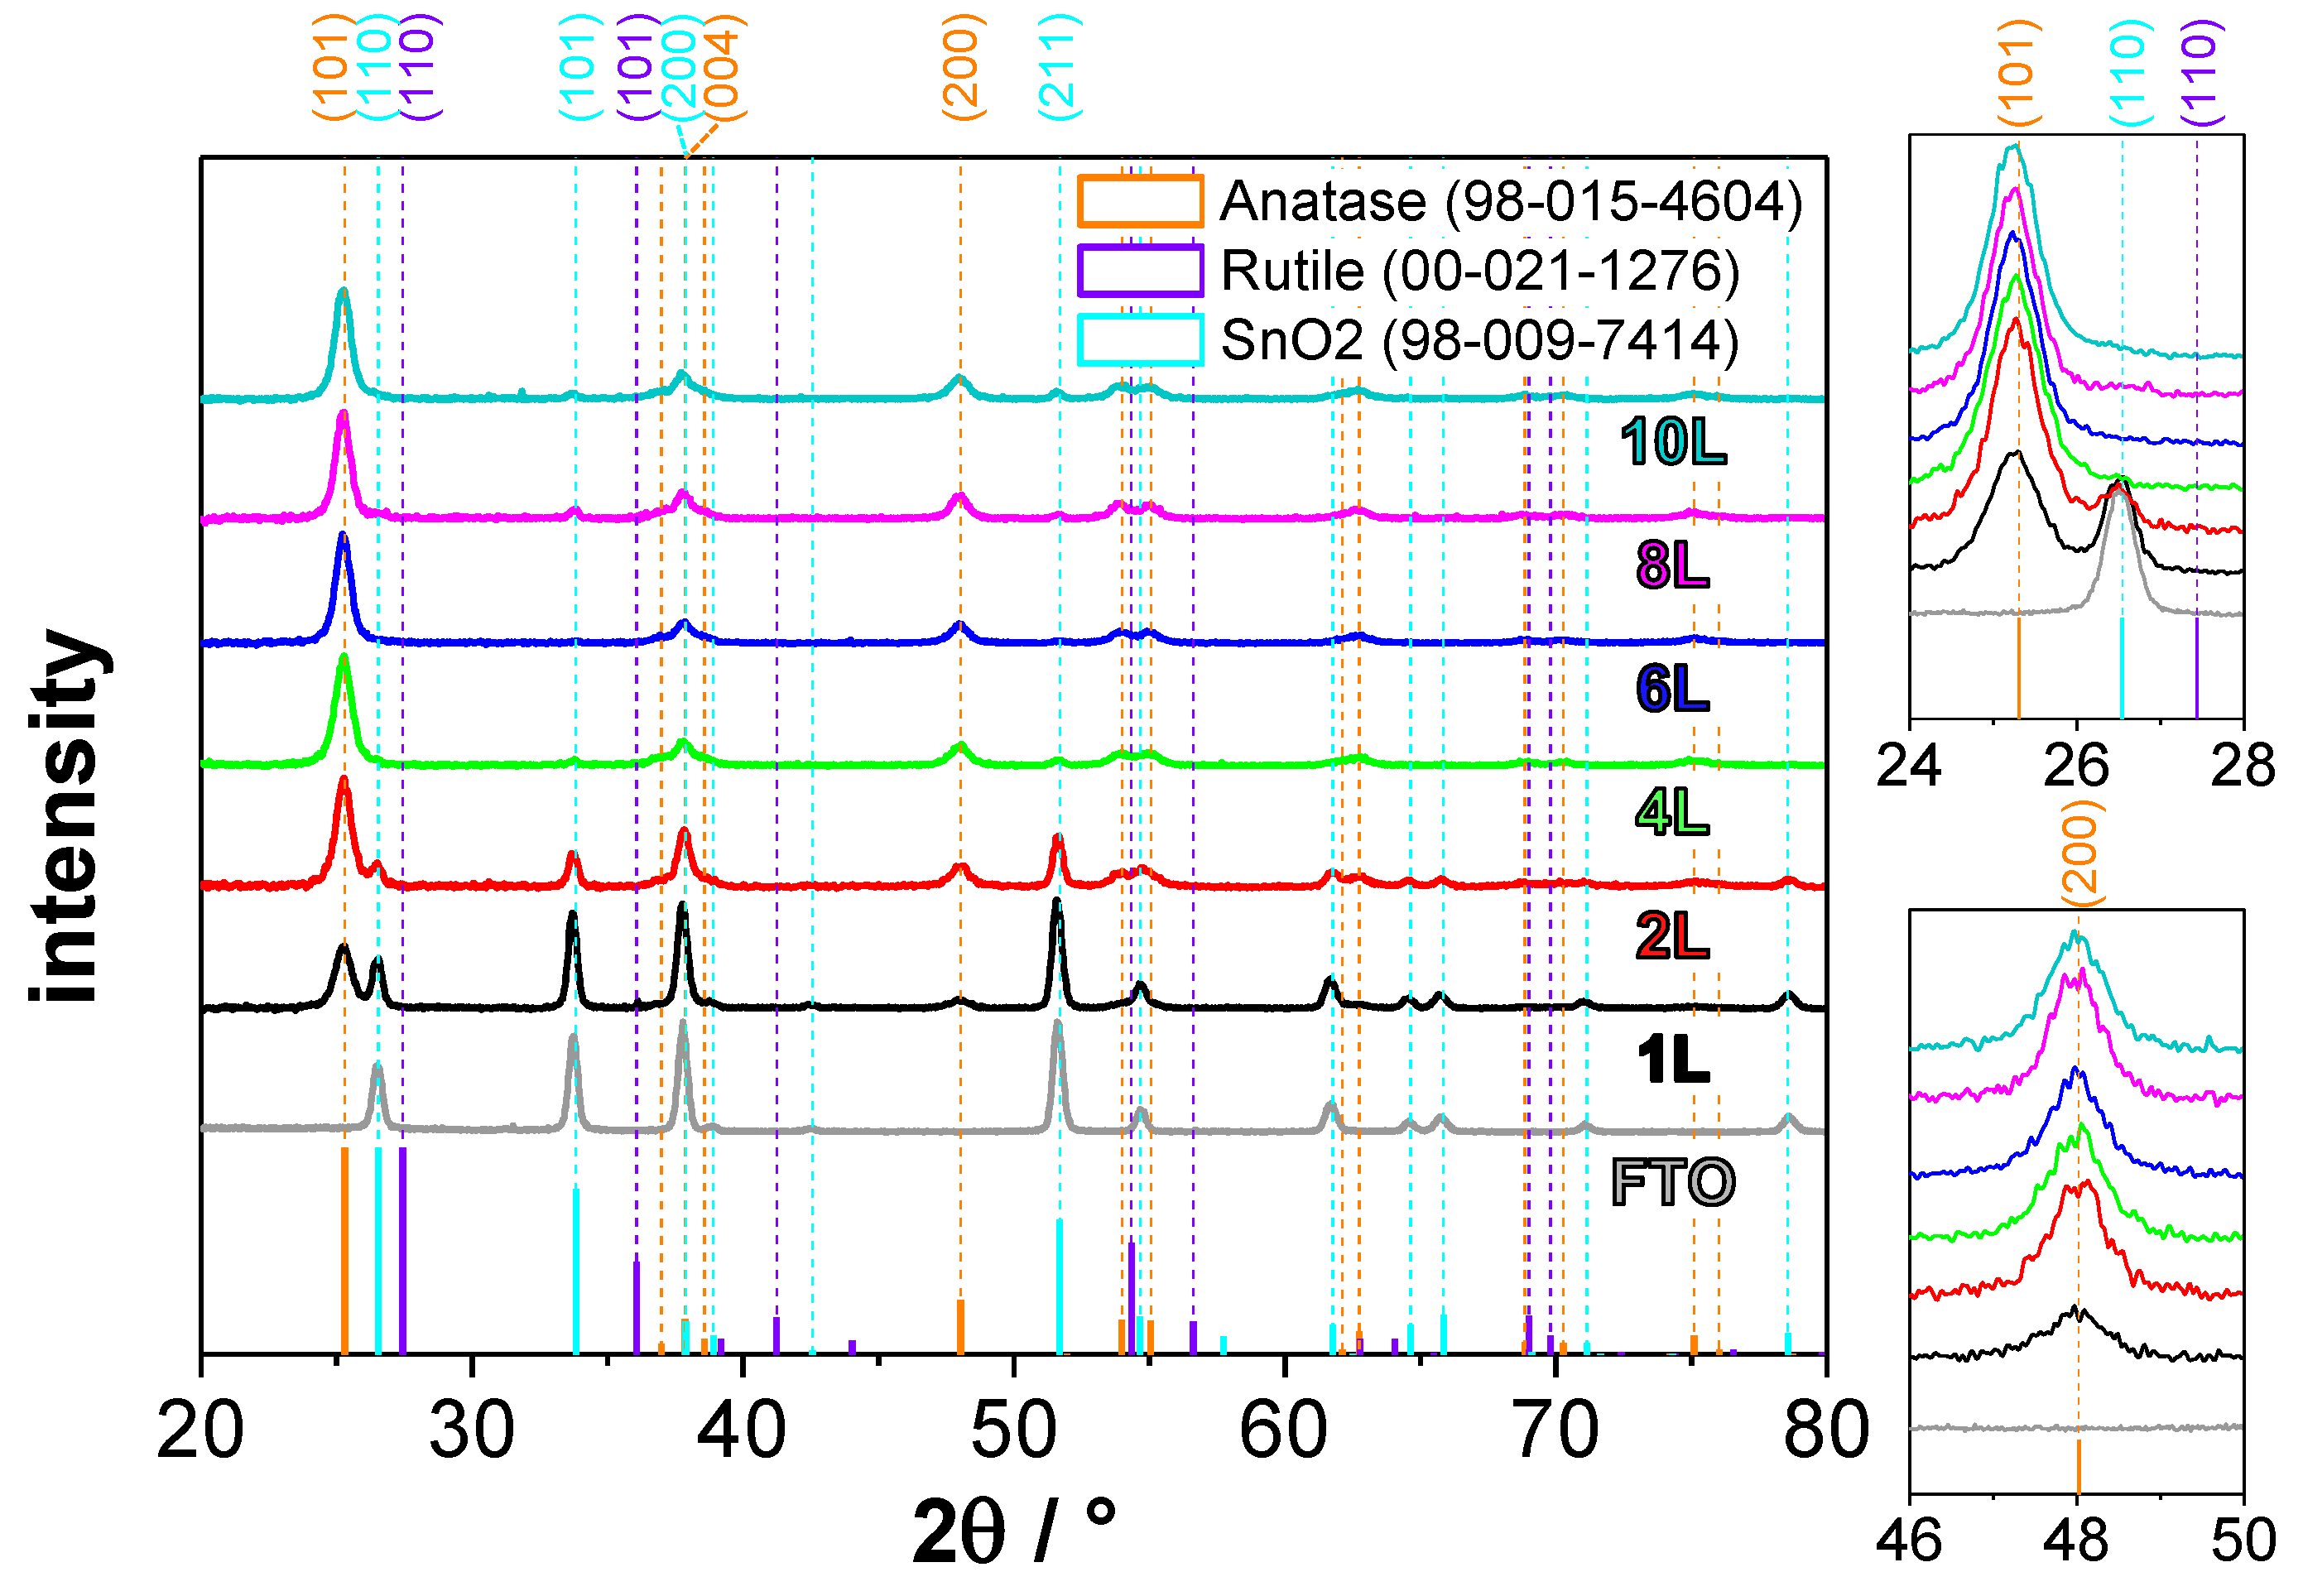
Figure 8 shows GI-XRD patterns of the obtained multi-layered MTTFs together with reference patterns.
In case of single- and double-layered films, FTO-related reflexes are dominant, but they quickly decline with further layers. Still noticeable FTO reflexes such as (101) and (211) (at 33.7 and 51.3 of 2, respectively) for 10-layered films could possibly be related to the porous and non-compact TiO structure. All multi-layered MTTFs appear to consist entirely of the anatase phase. An improved crystallinity in terms of sharper anatase reflexes as a result of the multiple thermal treatments was expected, since improved crystallinity of anatase within the bottom layers (resulting from repeated thermal processing with the additional layer) had already been demonstrated for a relatively lower interim temperature treatment at 350 C [74]. The authors performed incident angle dependent GI-XRD scans between 0.1–0.4 on a five-layered MTTF, thus manipulating the X-ray’s penetration depth and obtain insights on the crystallinity changes at the bottom layers. Similarly, the MTTFs investigated in our work may have improved bottom-layer crystallinity as the intermediate thermal treatment was higher (550 C) than in the previous report [74]. The average crystallite sizes obtained from the most dominant (101) reflexes remain relatively unaltered at 27 nm (see Table 2).
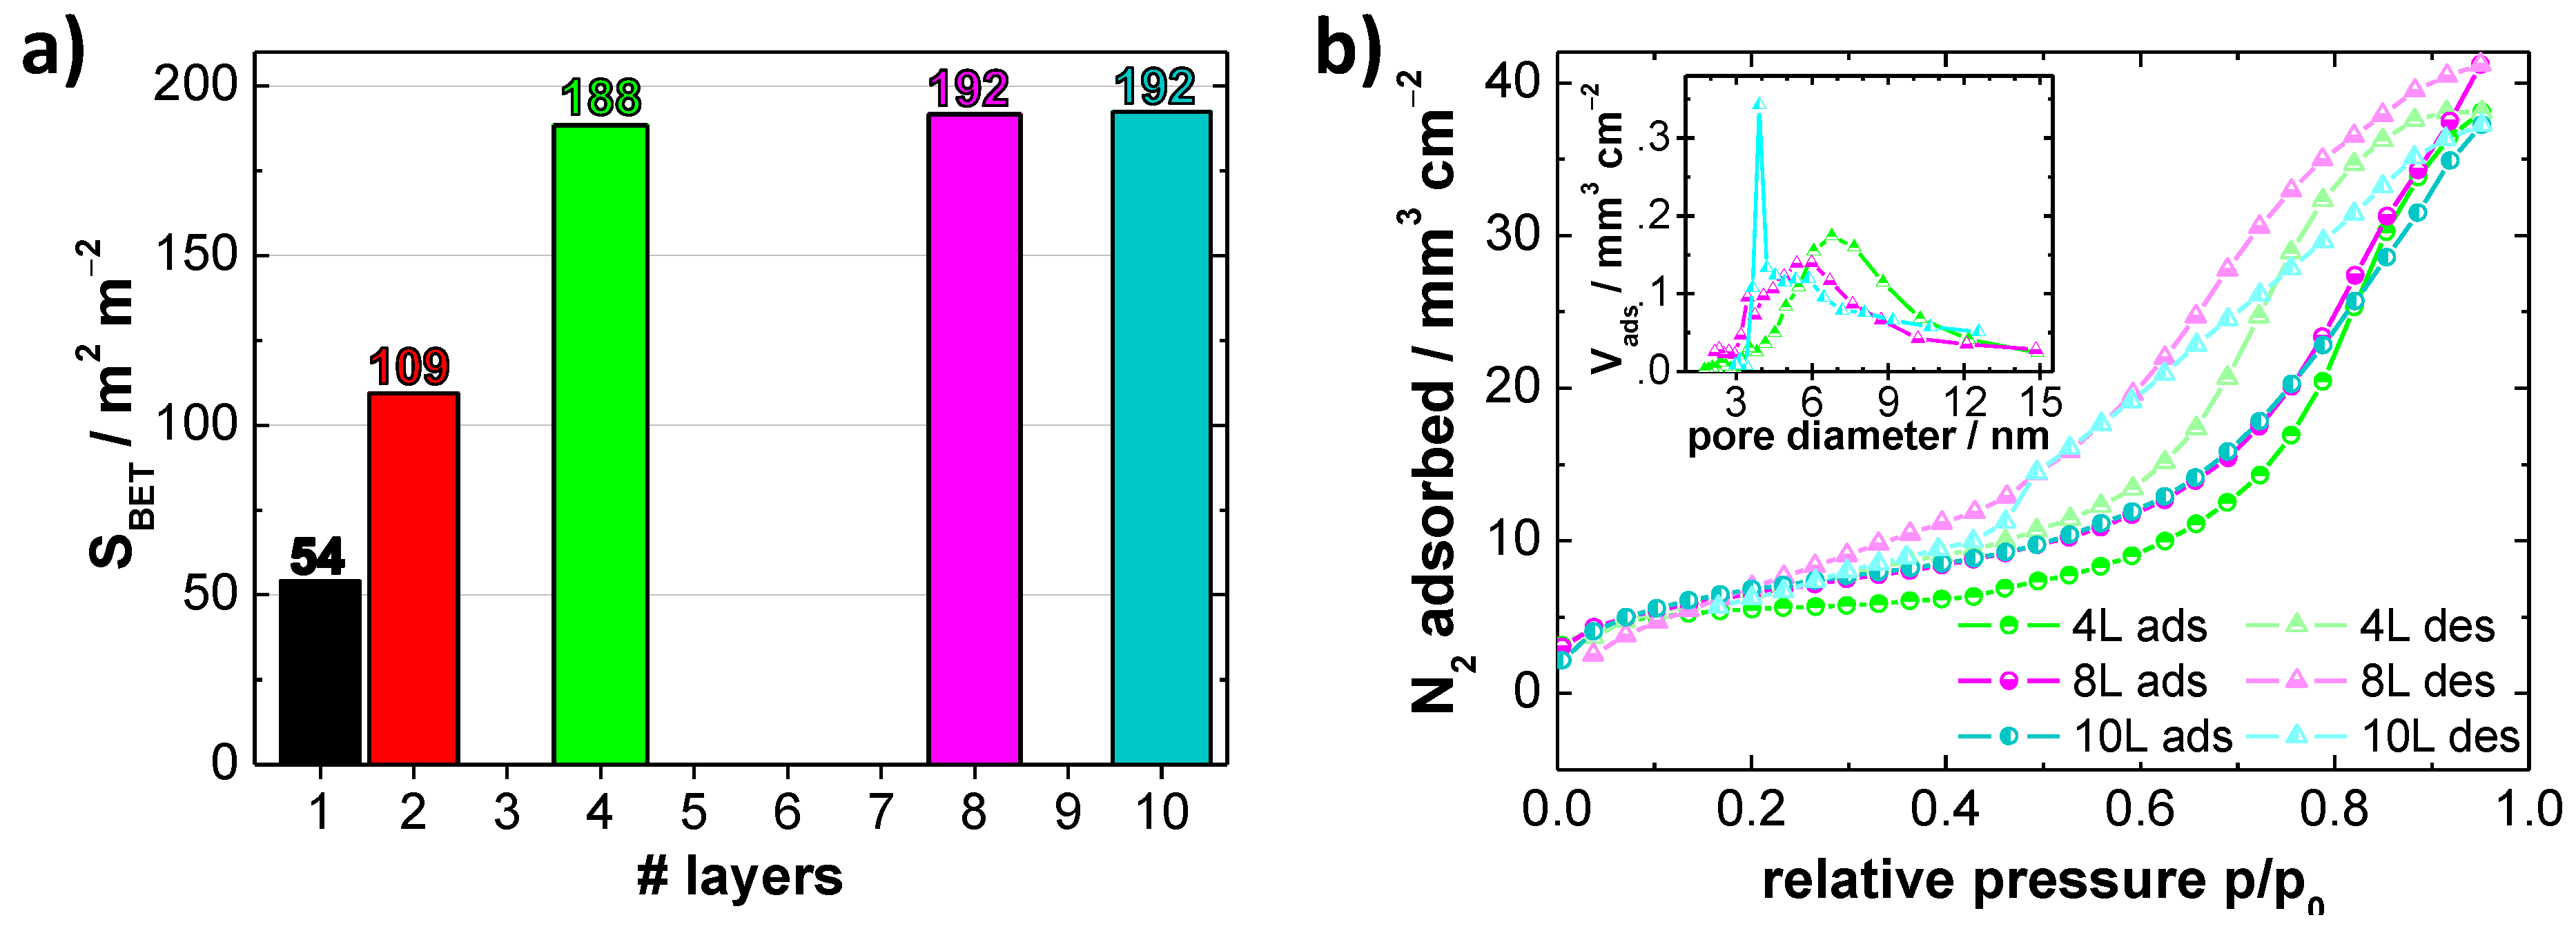
The specific surface area of the films was investigated with nitrogen sorption experiments and BET analysis. The BET surface areas were derived from two selected partial pressures (0.005 p/p and 0.038 p/p) and were related to the MTTFs’ geometric surfaces due to the very low and in general difficult to determine mass of individual films. Figure 9a shows the calculated BET surfaces as a function of the number of deposited MTTF layers.
Surface areas increased almost linearly up to four layers where it reached 188 m·m. Beyond that almost no changes were observed. However, the trend of quickly saturated surface areas is in very good agreement with similar observation by Procházka et al. [74]. They studied P123-templated MTTFs with 1–5 layers which were obtained via layer-by-layer dip-coating onto FTO/glass and with 2 h lasting thermal treatment at 350 C prior to the next deposition cycle (but without interruption by characterization/cleaning). Their finding of an unchanged surface area for more than 3 layers was explained by the compensation of two opposing processes: added surface area per deposition and lost surface area due sintering of bottom layers upon thermal treatment [74]. This very explanation is likely to apply here as well. Moreover, they documented two additional features: the stepwise improvement of the crystallinity of anatase nanoparticles within bottom layers during repeated thermal processing and the formation of denser crust films surfaces as a result of one-dimensional constrained sintering. Although these effects might apply here as well, they are not clearly pronounced in the collected XRD and SEM data, respectively as stated before. Figure 9b presents full nitrogen sorption isotherms of selected multi-layer films (4 L, 8 L, 10 L) showing mesopore condensation. An inset shows pore size distribution from desorption isotherms. With additional layers (and additional thermal treatments), the pore size distributions shift to smaller values indicating pore narrowing due to “wall thickening” during the subsequent sol infiltration process.
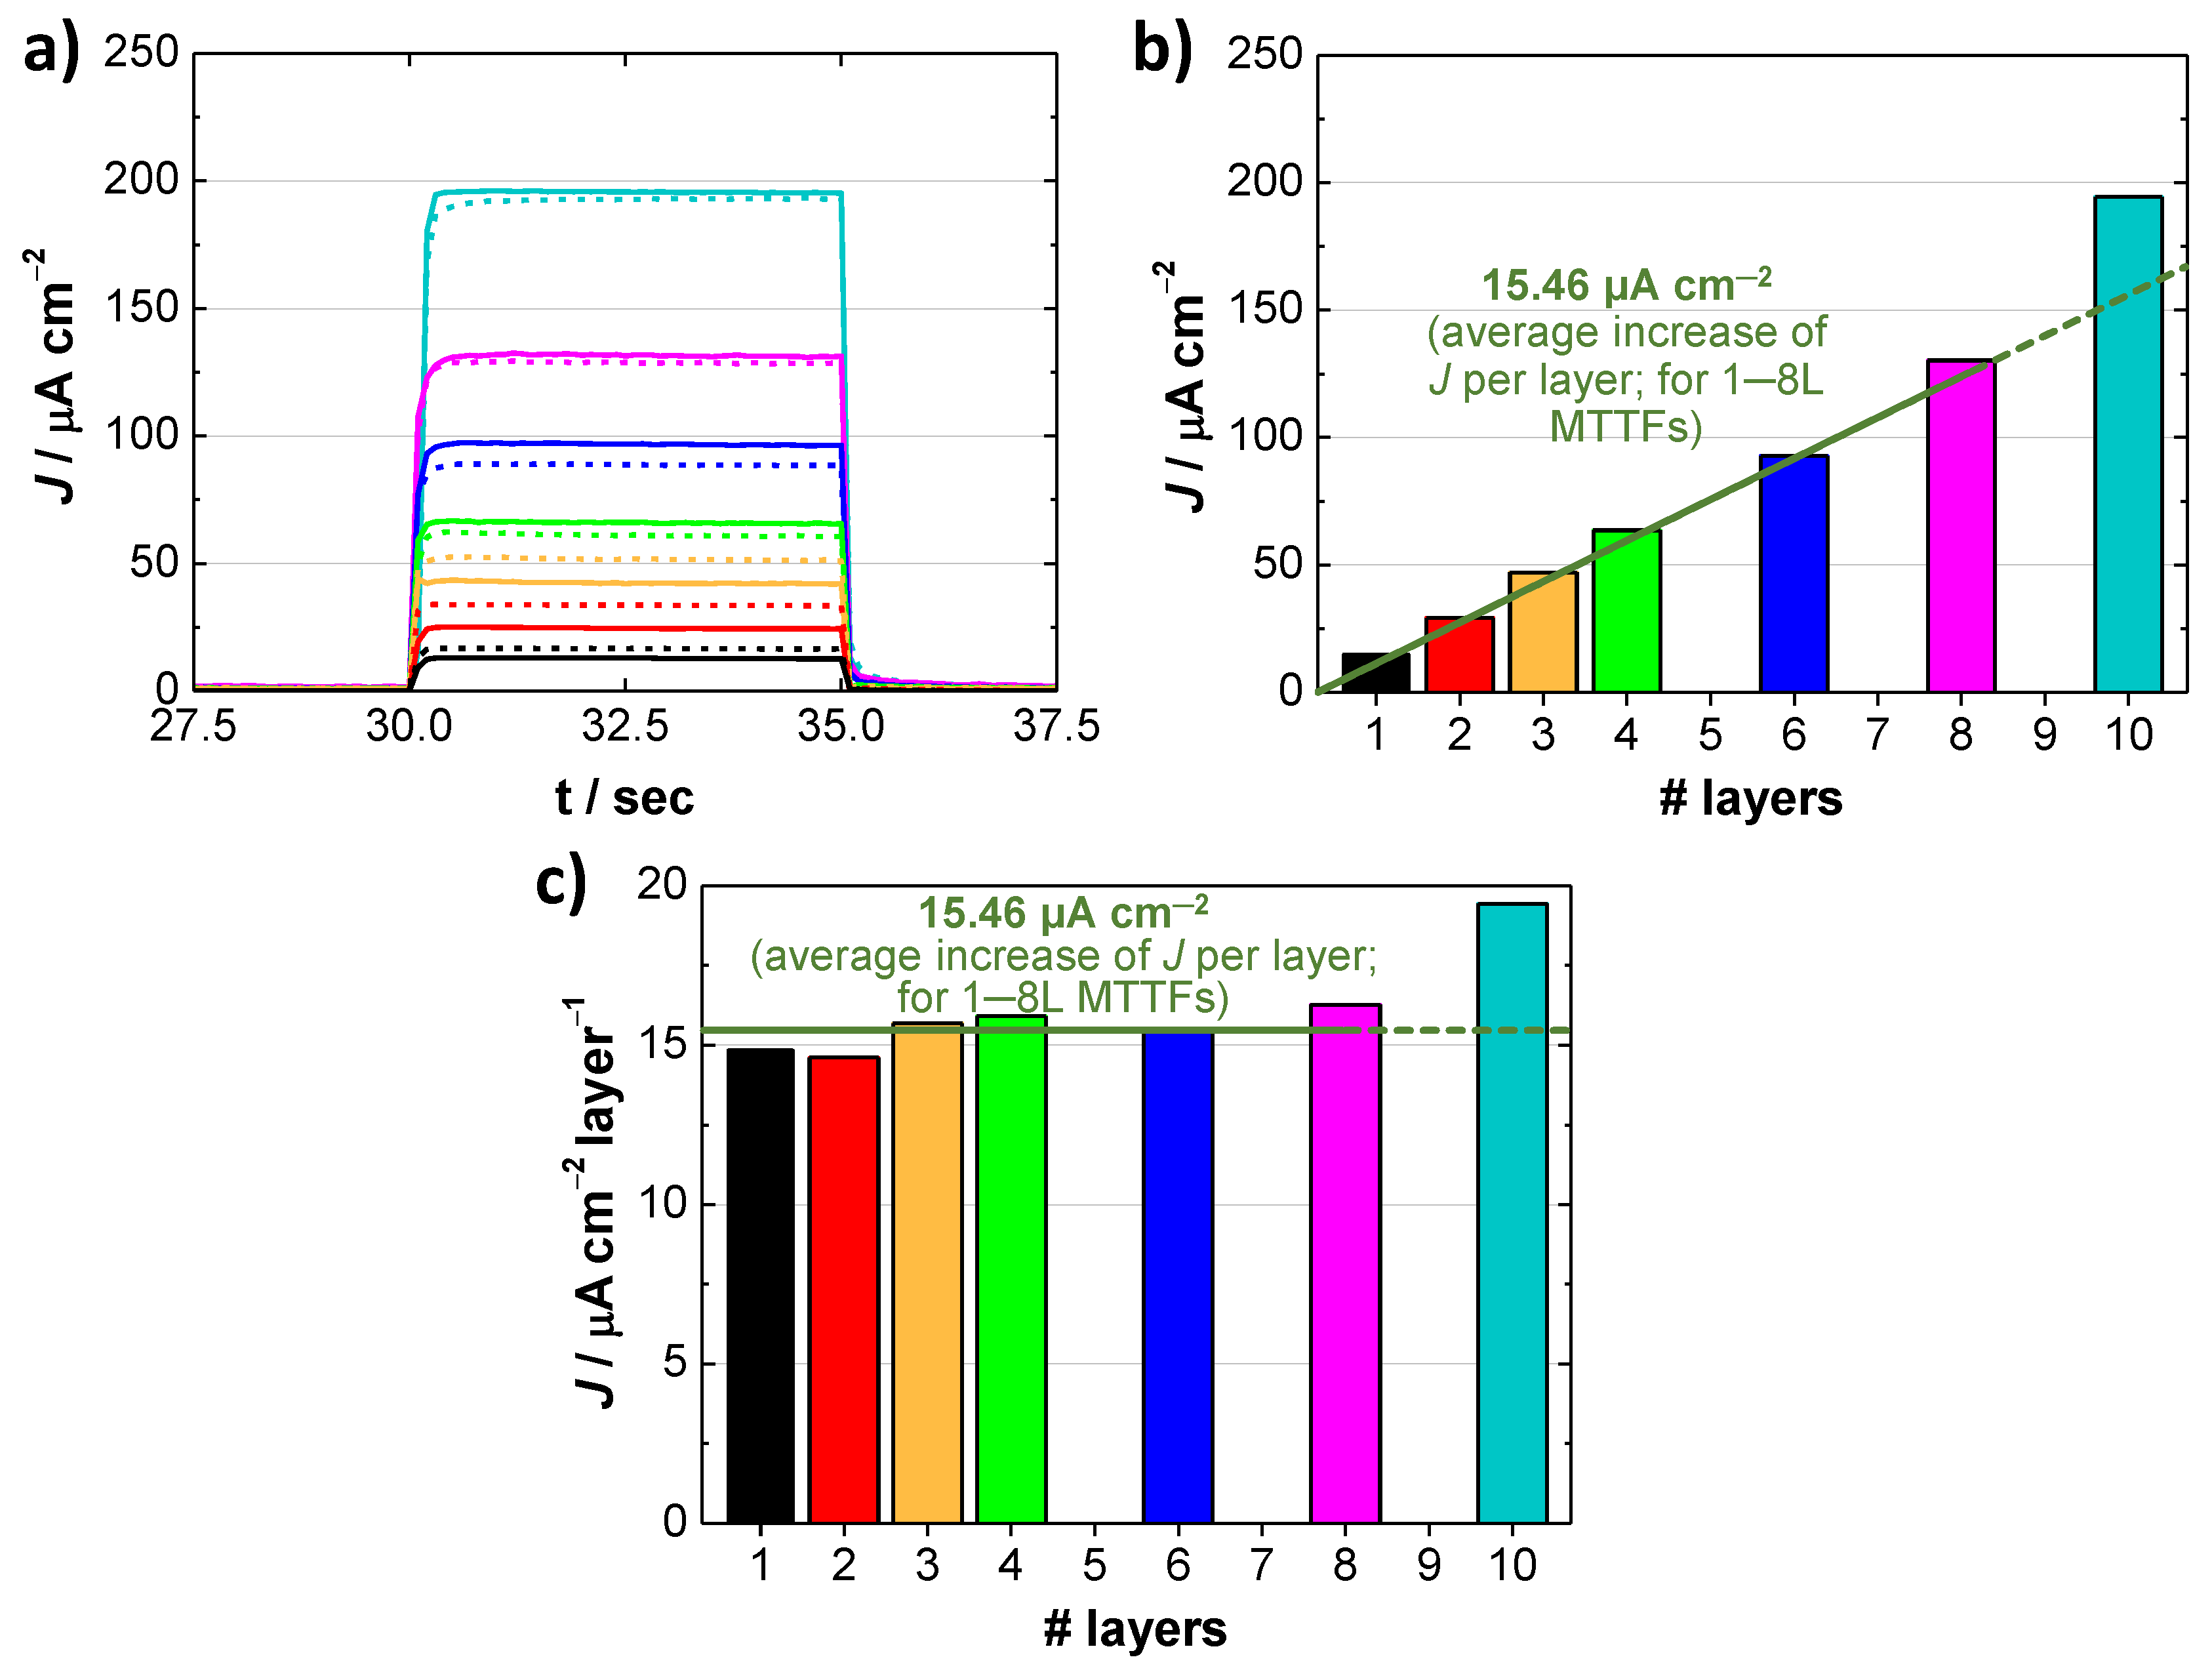
To correlate the structural properties of MTTFs involved in the present study with their activity, PEC water oxidation in a highly alkaline media was used as a test reaction. More precisely, chronoamperometric experiments were carried out under controlled chopped-light UV illumination conditions at 1.2 V versus RHE. For a better reliability, two identically prepared samples were tested. The corresponding experimental results are depicted in Figure 10.
From the raw data depicted in Figure 10a it is clearly visible that the photocurrent increases with the number of layers. The similarity of results for a pair of samples with the same number of layers (denoted as dashed and solid lines of same color) underlines their good reproducibility. Figure 10b shows the average photocurrents of each pair as a function of the number of layers. It becomes clearly visible that the activity increases almost linearly in the range of 1–8 layers, leading to an average increase of ≈15.5 A·cm per layer. To our surprise, the 10-layered MTTFs exceed this trend by exhibiting a significantly higher photocurrent per layer value of ≈19.4 A·cm layer. Figure 10c further emphasizes this circumstance in terms of a derivate plot.
Without focusing too much on the exceptionally active 10-layered films, the observation of an undiminished activity increases up to 10 L (if even beyond was not tested) has to be explained in the context of the already discussed findings: One is that the thickness increases almost linearly (at least if single- and double-layered films are not considered). Another is that the surface area is almost constant (again if single- and double-layered MTTFs are not considered). Therefore, the enhanced activity needs to be explained by access to more active sites derived from improved optoelectrochemical properties and decreased recombinational losses in bottom layers near the FTO. Additionally, the higher rates of charge carrier formation due to stronger absorption of thicker materials contribute as well. It should be pointed out that the same thickness-versus-surface-area behavior was observed and successfully explained in terms of increased bottom-layer crystallinity before [74].
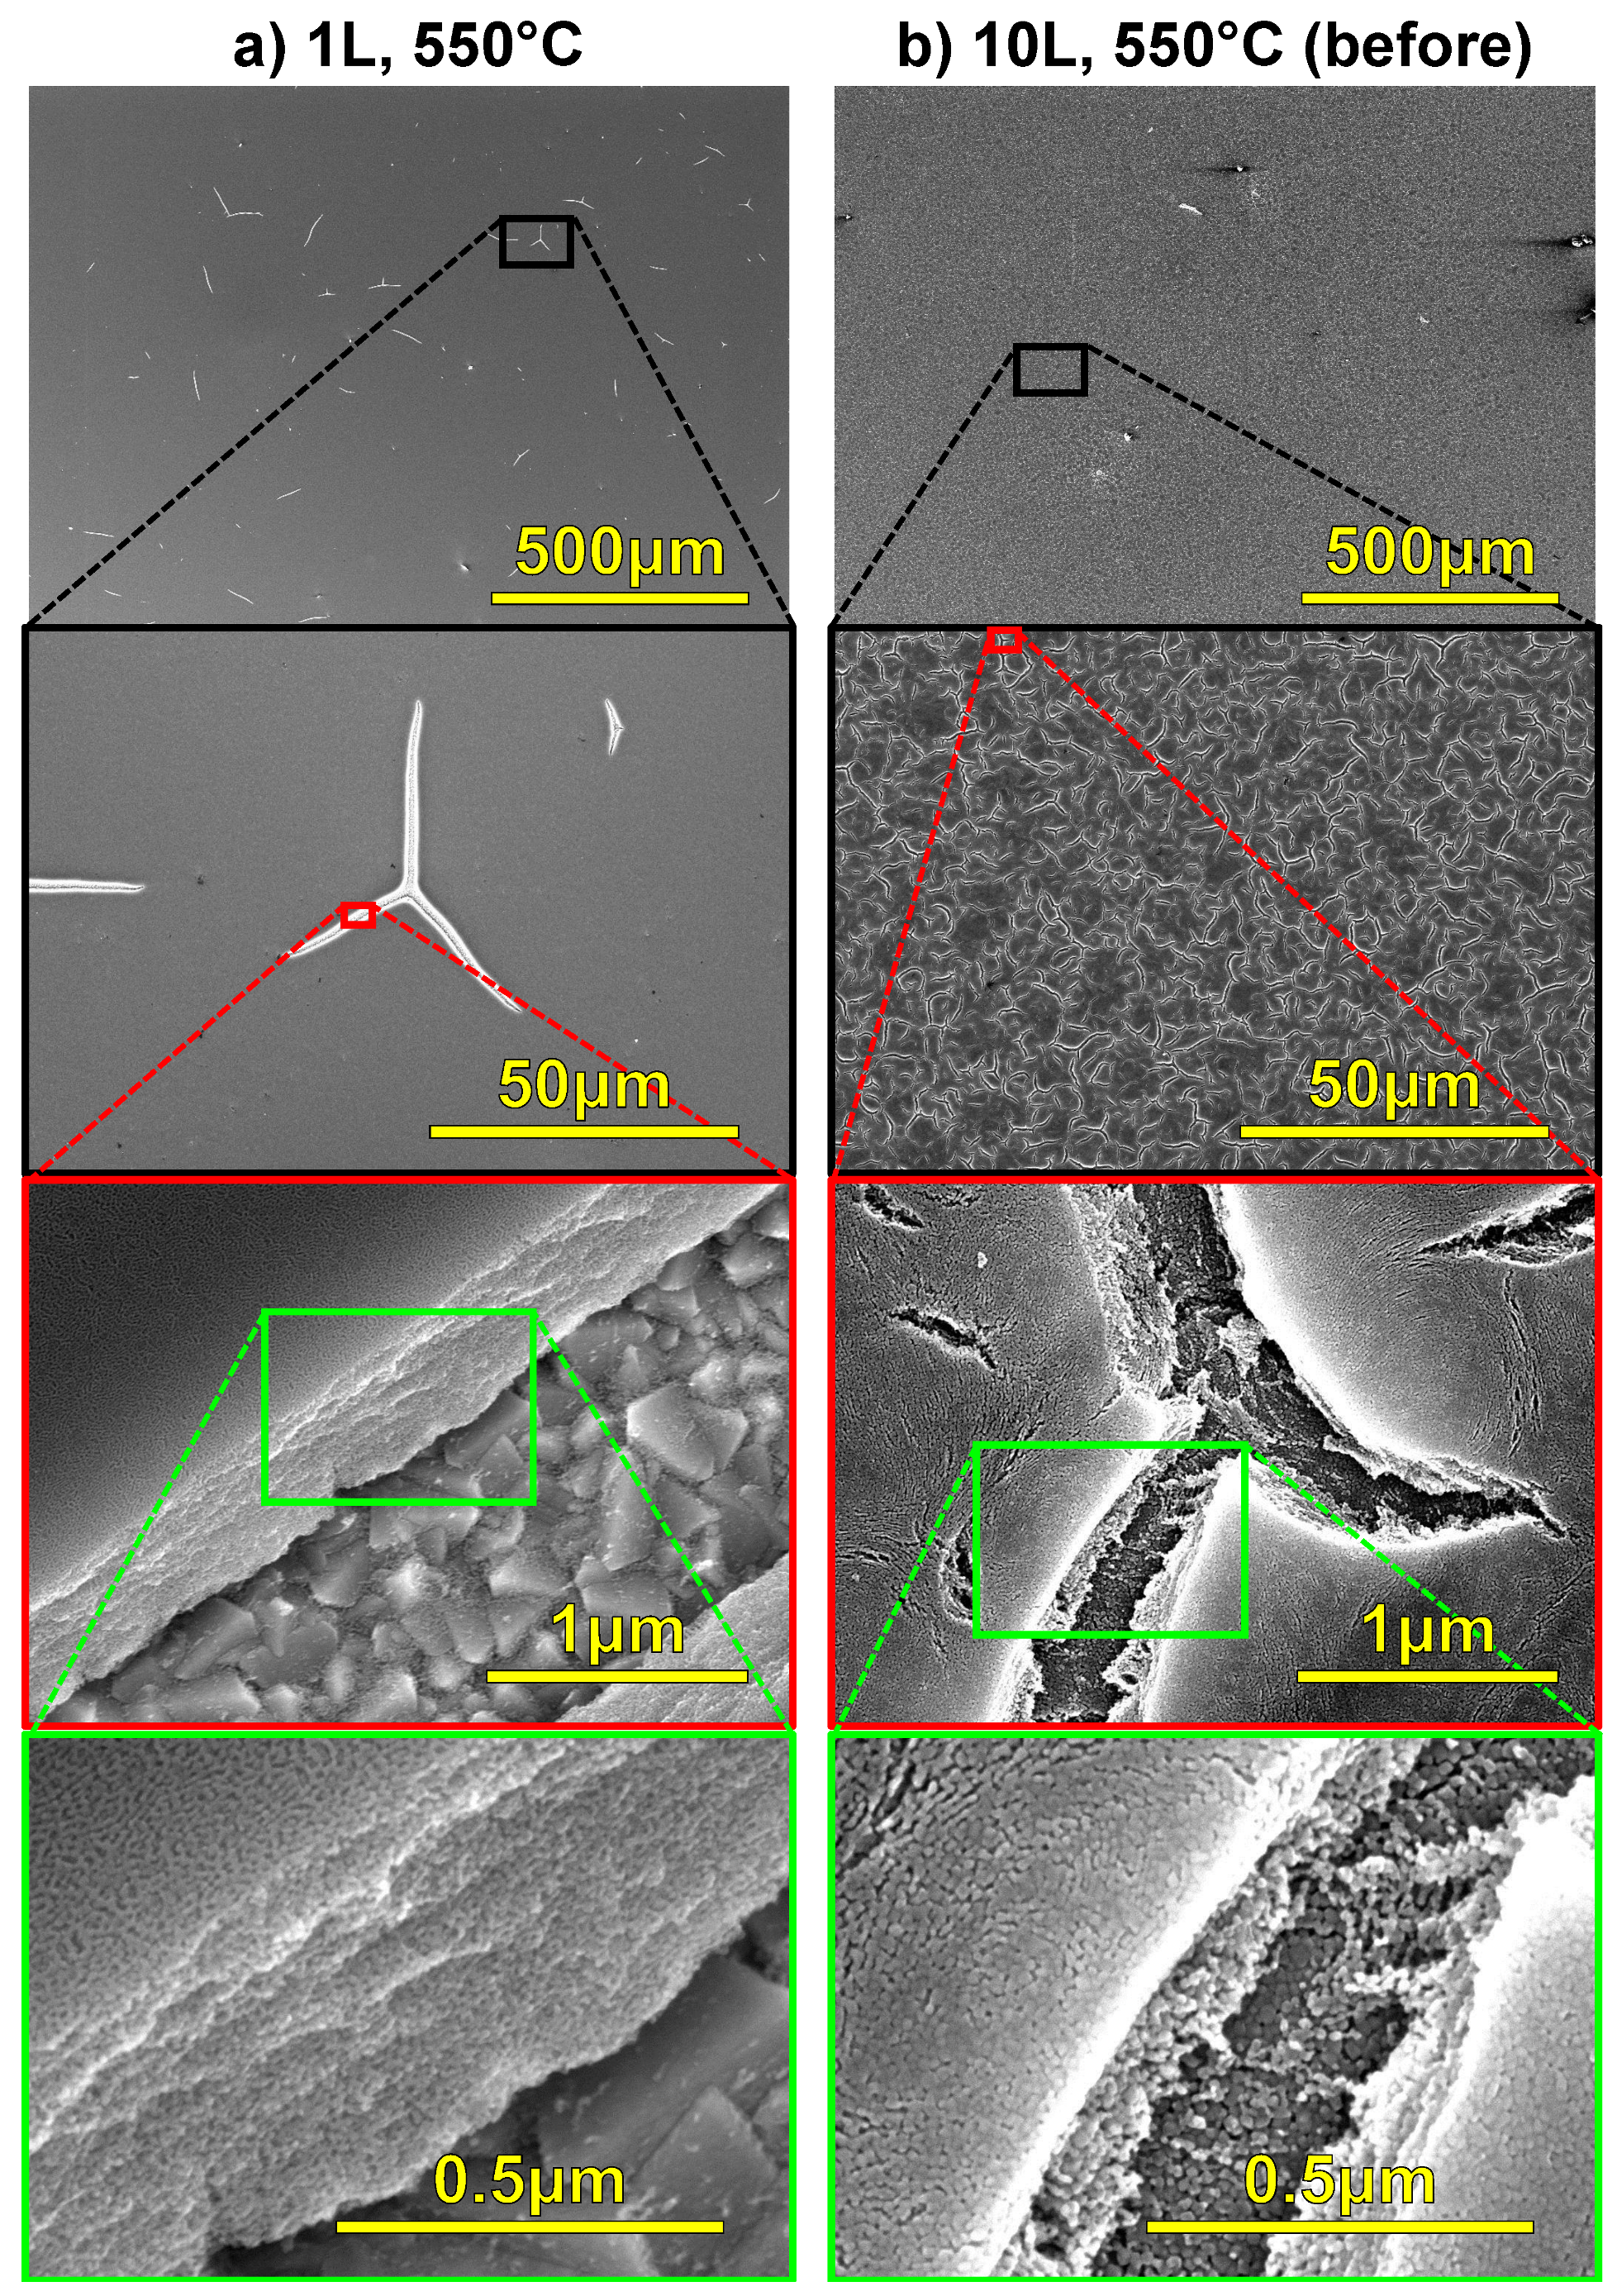
A further possible explanation could be related to the “interrupted” layer-by-layer deposition. In fact, it may induce structural altering as result of characterization/cleaning steps between each deposition. Figure 11 shows top-view SEM images of single- versus ten-layered MTTFs at four different magnifications.
Single-layered films show some isolated cracks which expose the FTO back contact (white lines in the images). The topology of the ten-layered films, however, was not expected. SEM imaging reveals the formation of an extended network of small cracks which are much smaller in size but much more prominent than those for single-layered films. Topologically, these structures resemble a hierarchically macro-mesoporous systems that were prepared by controlled phase separation and surfactant templating [89]. Such a structure provides improved transport properties as the electrolyte’s infiltration/diffusion into the MTTF becomes facilitated and therefore is likely to contribute to the enhanced activity as well. At this point it must be determined in terms of uninterrupted control experiments whether this extensive crack formation is related to the characterization/cleaning step between deposition or if it is caused by the multiple calcination steps.
3.3. Multi-Layered Films Stability
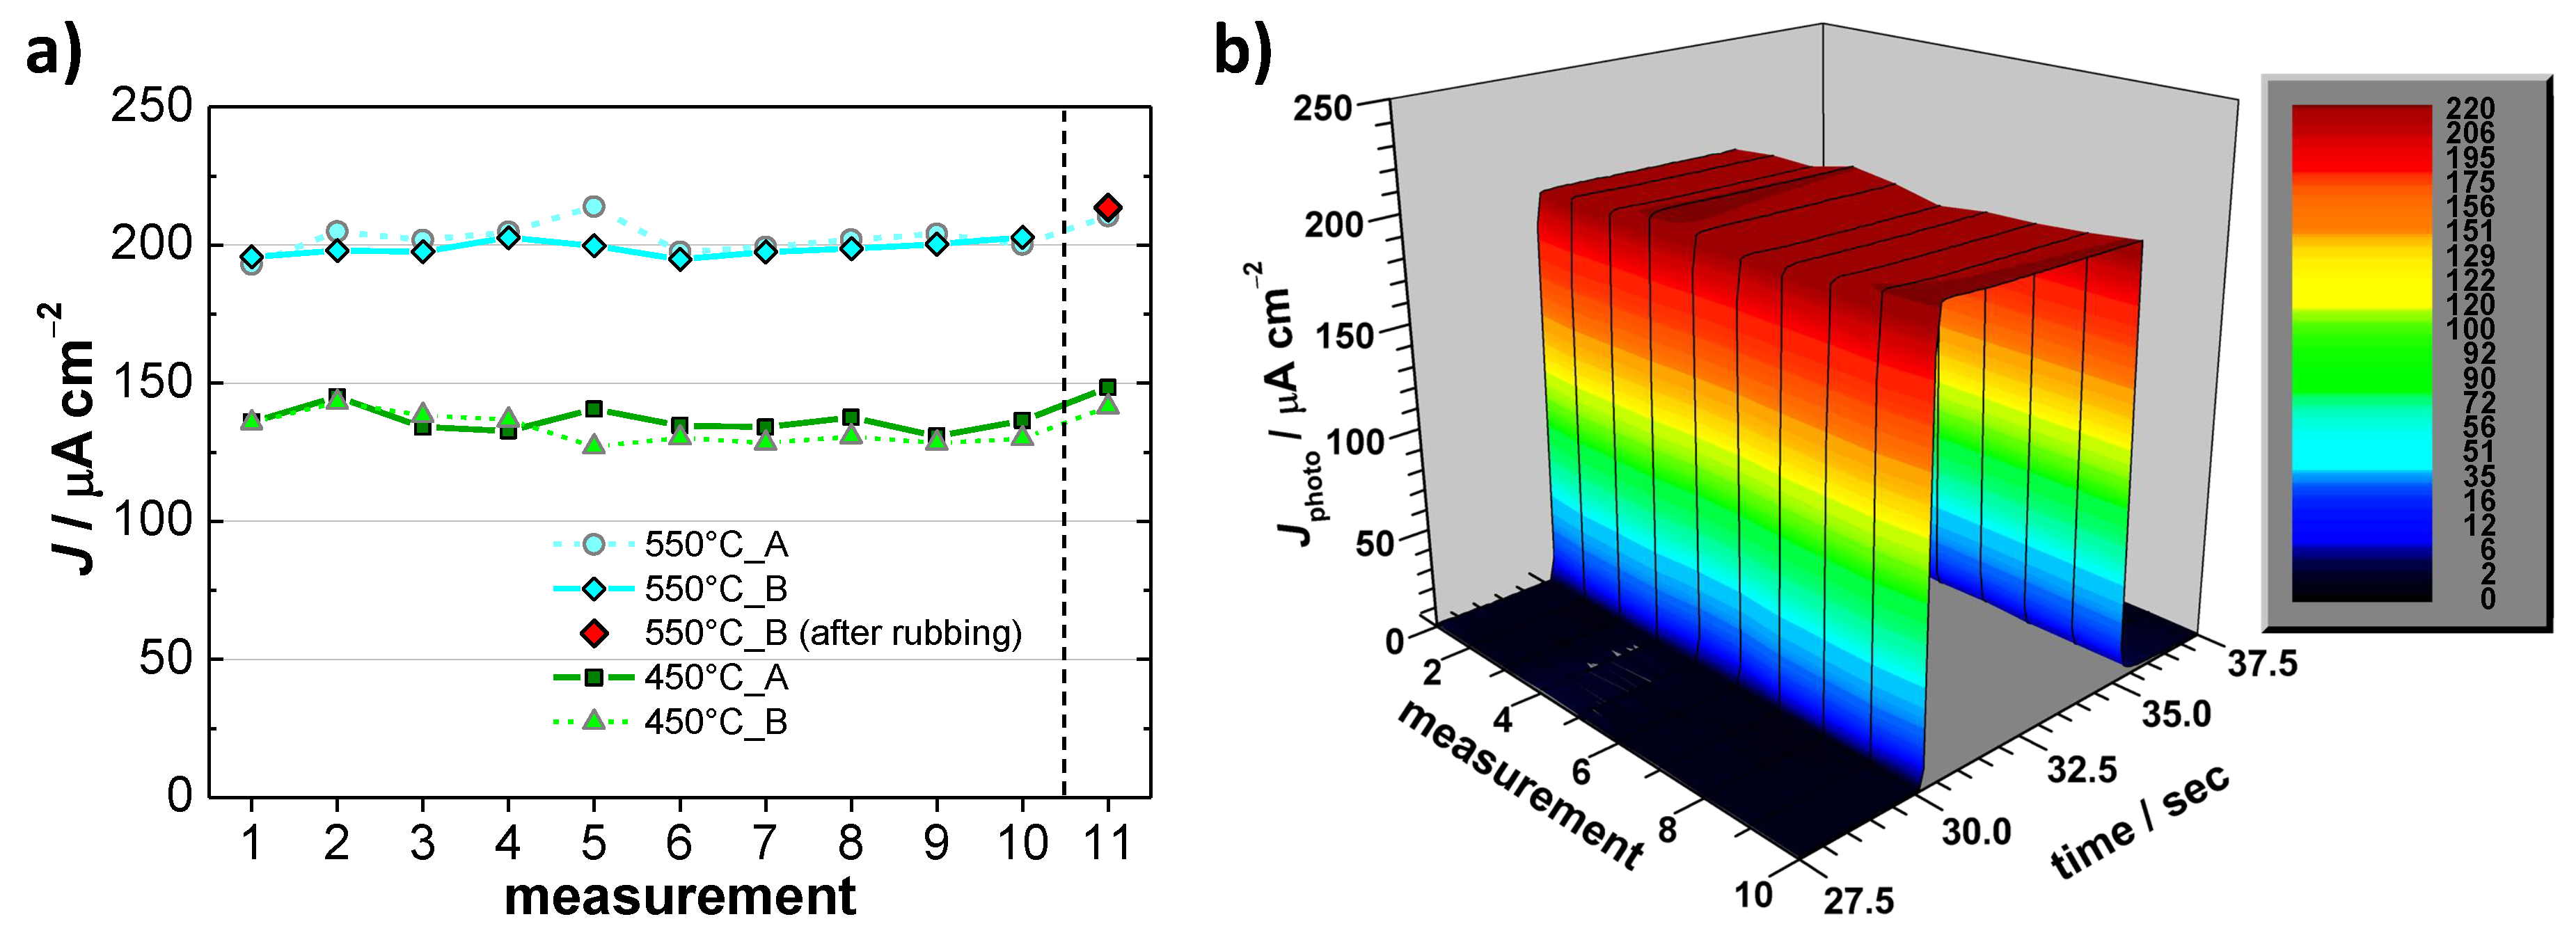
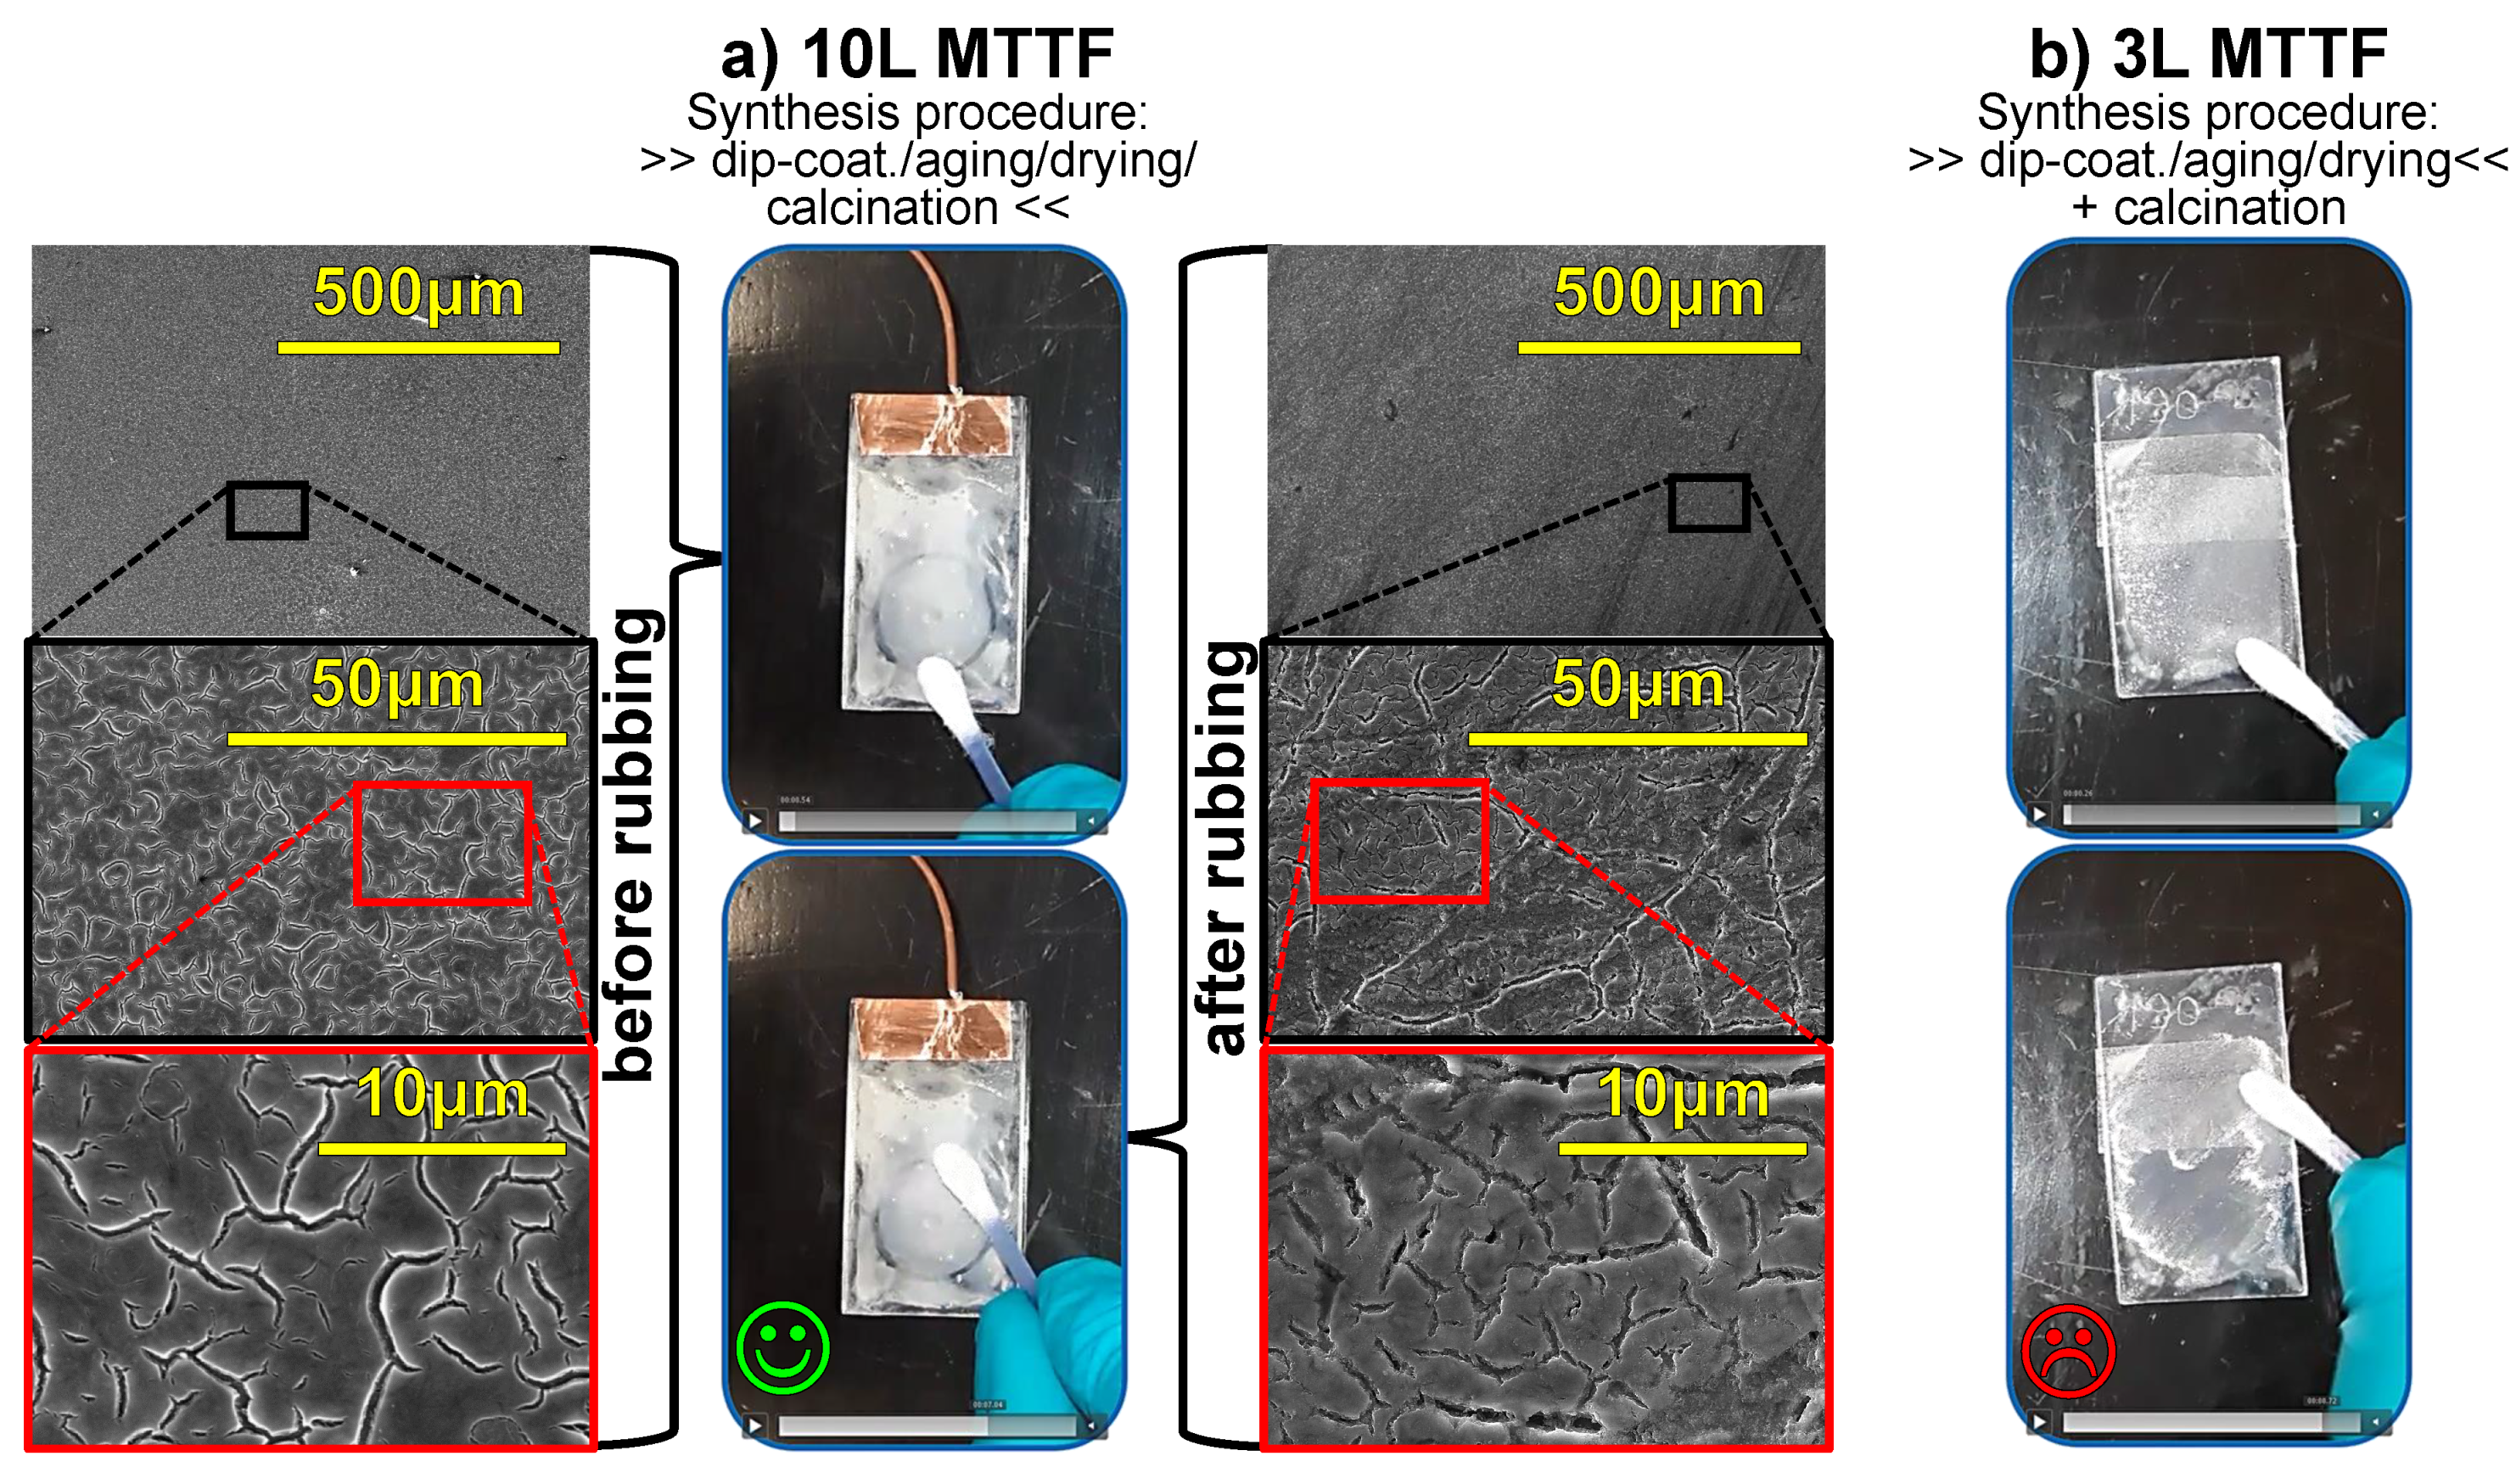
To gain insights on the chemical and mechanical stability of the films, we have performed different sets of stability measurements. Electrochemical stability tests were performed on 10-layered MTTFs and involved the steps of disassembling, cleaning, drying and assembling between each chronoamperometry measurement. These measurements were carried out for ten consecutive days and—for better reproducibility—two sets of samples treated at 450 C and 550 C (two films each) were used (see Figure 12a). At the end of the tenth measurement, the sample “550 C_A” was mechanically rubbed with a cotton bud (Q-Tip) (see Figure 13a).
As shown in Figure 12a,b, all films deliver stable photocurrents during the first 10 experiments. Films treated at 450 C show values around ≈140 A·cm and films treated at 550 C ≈ 200 A·cm. To set this into perspective, stable photocatalytic activities of MTTFs (loaded with Pt NPs) were reported previously by Ismail for both long term and repeated measurements of the photocatalytic gas-phase oxidation of acetaldehyde [75].
After the rubbing test of “550 C_A” (red diamond), still comparable photocurrents are observed with very slight variations, suggesting the films are quite robust and intact. The slight increase of photocurrents at measurement 11 might be related to the use of a freshly prepared new electrolyte solution. When considering the photographs taken before and after rubbing, the applied mechanical stress did not result in macroscopic changes of the films (see Figure 13a). Corresponding SEM micrographs, however, show that the structural integrity of the films is affected to an extent as scratch marks and microstructural changes reveal. Overall, there seems to be no significant material abrasion since the activity stays nearly unaffected which confirms the good adhesion. However, MTTFs cannot withstand a scotch tape adhesion test (not shown).
In hope for an accelerated film preparation process, two sets of comparative experiments were carried out: In the first set, we have prepared multi-layered films without an intermediate temperature step and tested the mechanical stability in a similar way. Unfortunately, these films are not mechanically stable at all and can be peeled off easily (see Figure 13b). It is worth mentioning that a very comparable synthesis route (also without intermediate calcination) was recently reported by Rankin et al. They used MTTFs with up to five layers as negative electrodes in Li-ion batteries and did not report stability problems [88]. In another attempt towards faster production of thicker films, a more viscous EISA-sol was used by having a lower amount of the solvent EtOH in the initial EISA-sol. The obtained MTTFs exhibited the same problem of bad adhesion (photograph not shown).
3.4. Proof of Concept: SPR-Active Gold Nanoparticles Inside MTTFs
In this brief subsection, the suitability of our MTTFs as porous host systems for the incorporation of SPR-active noble metal particles is investigated. As a test reaction, the cathodic pulsed electrodeposition (pulsed-ED) of gold nanoparticles was used.
The pulsed-ED technique provides the benefit of being simple to operate but still versatile, since it allows introduction of Au nanoparticles of different size/shape by use of different deposition potentials, pulse/pause sequences, pulse numbers etc. [50,90]. Therefore, pulsed-ED enables both fine-tuning of plasmonic properties and intense contact areas between TiO and Au the same time. Individual single-layered MTTFs were treated with three different amounts of pulses, namely 1, 8 and 16.
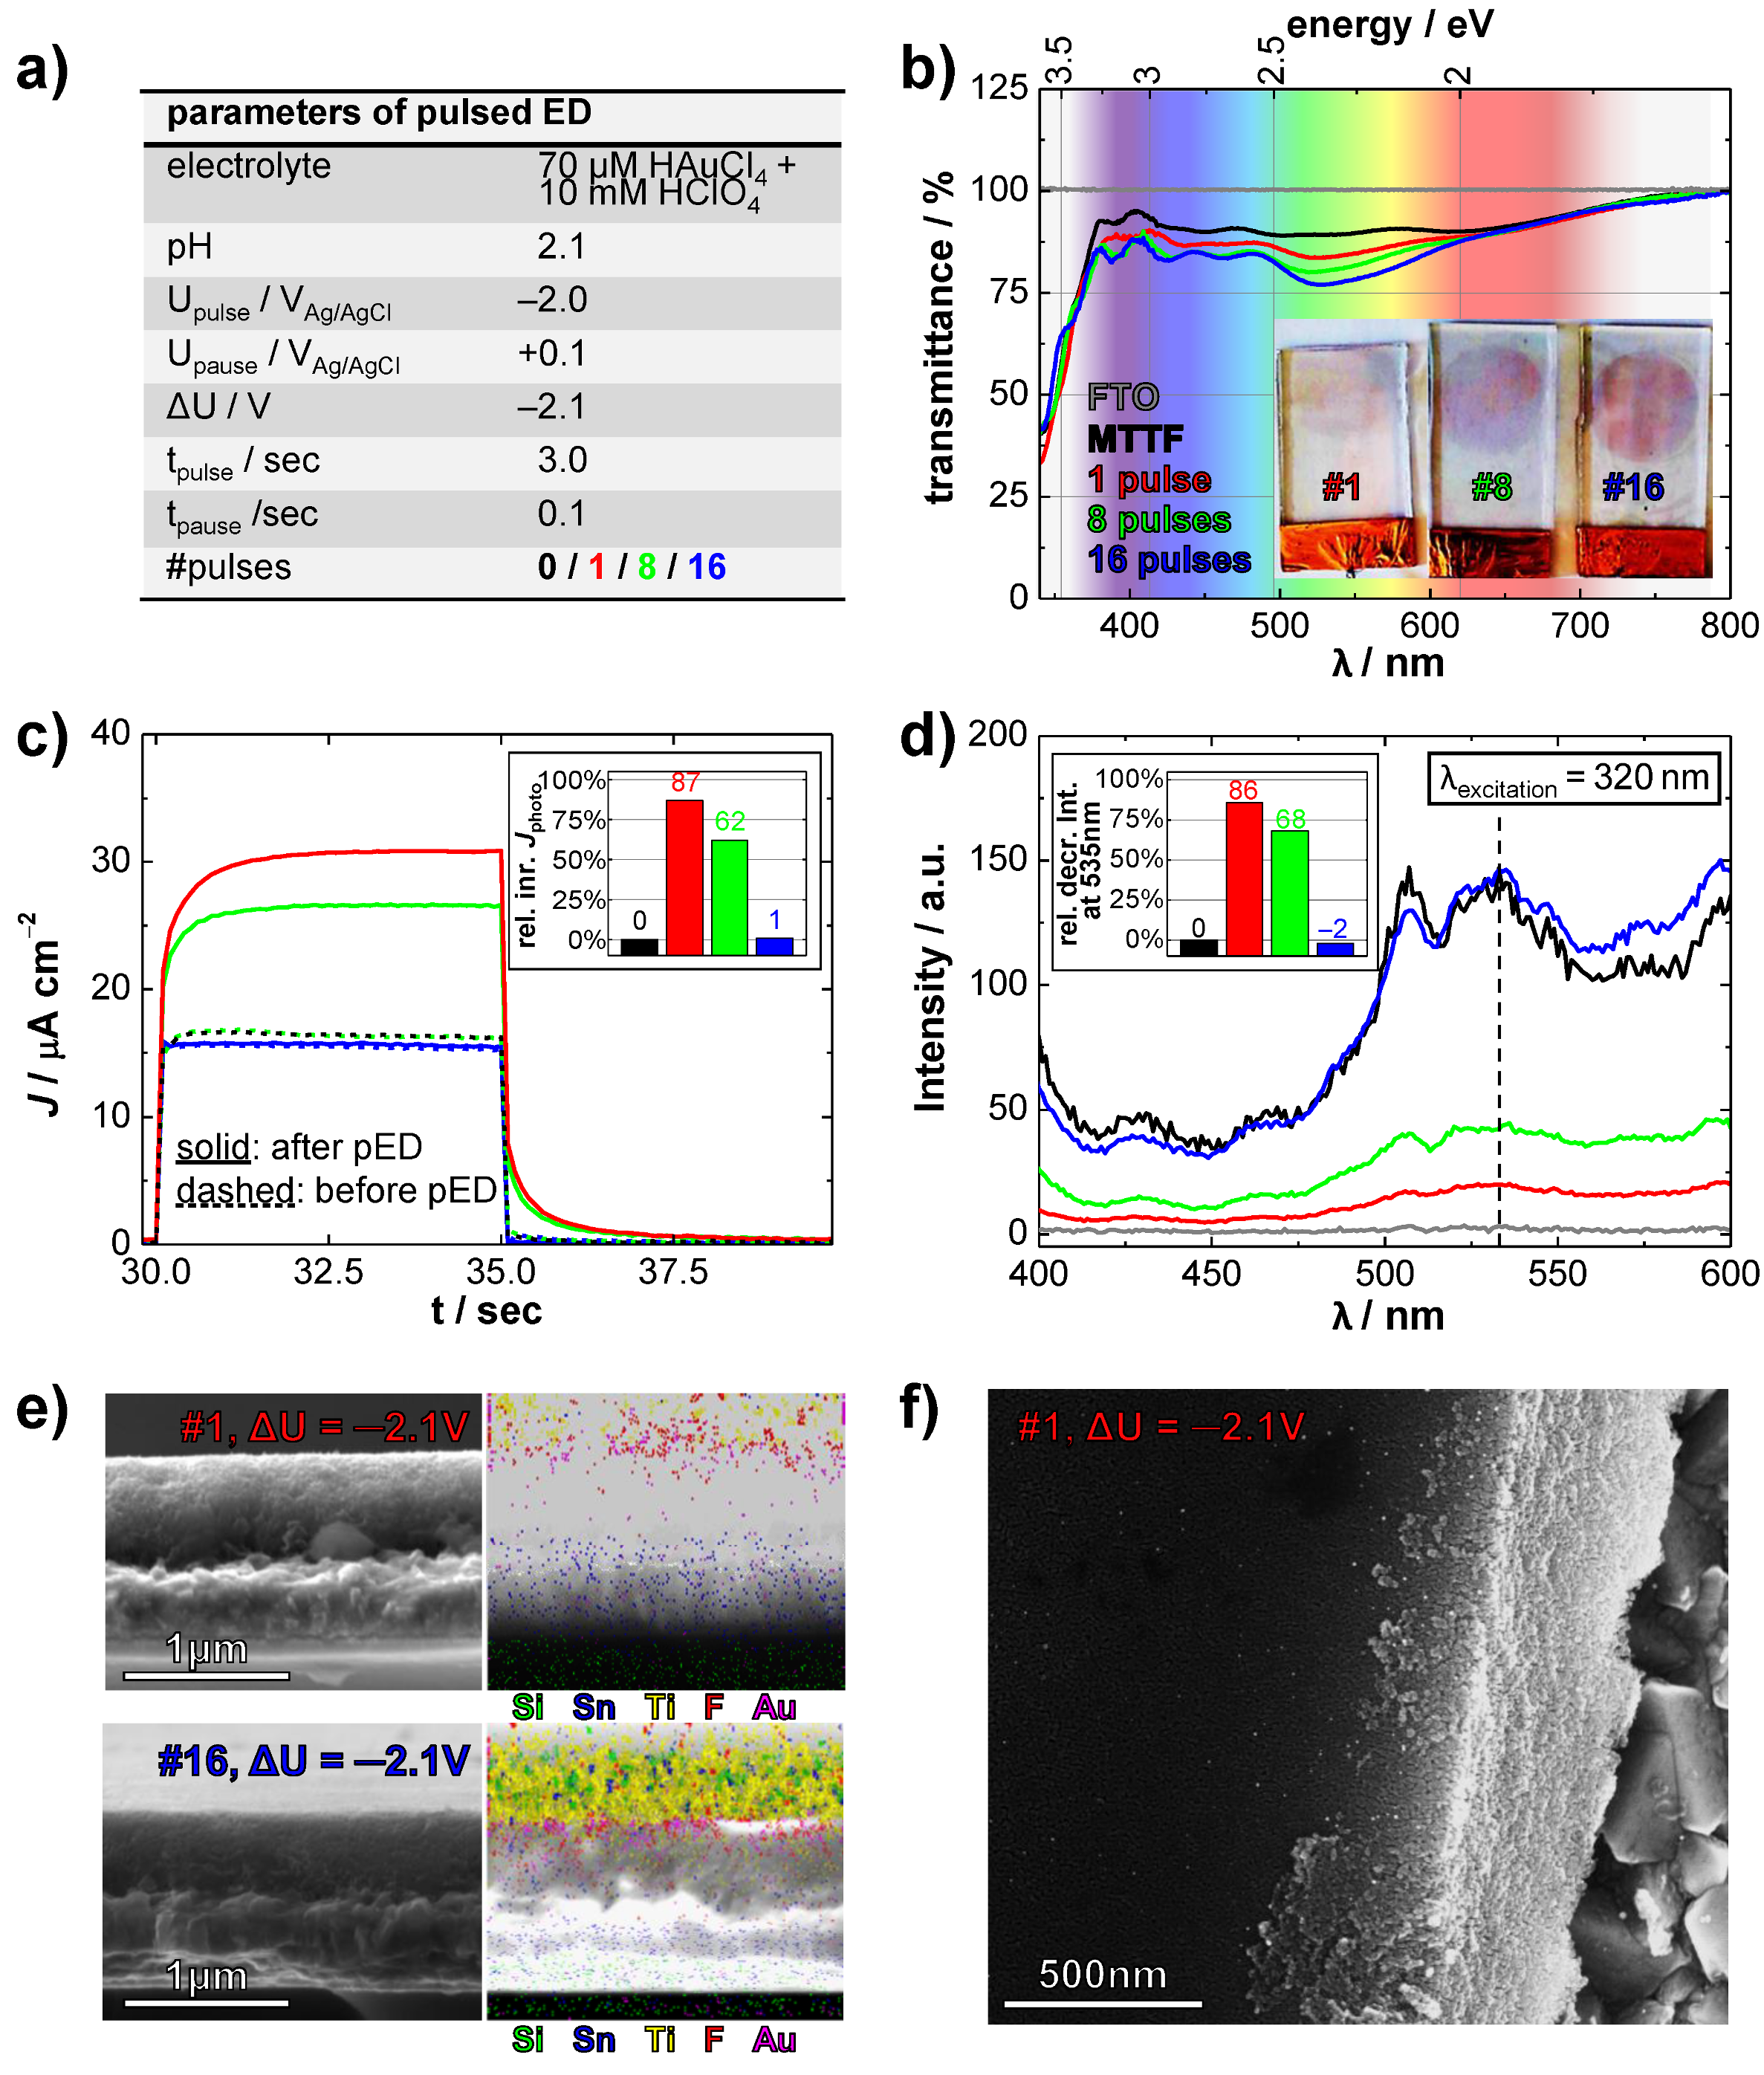
Figure 14 shows the results of the experiments. Figure 14a summarizes the deposition bath composition and electrochemical pulse parameters. Optical analysis is shown in Figure 14b, where both a photograph and the corresponding UV/Vis transmittance spectra show the surface plasmon resonance features related to the introduced gold particles. Specifically, an SPR band is present for all three Au-modified samples and is in the green region of the visible electromagnetic spectrum around wavelengths of 530 nm. The tendency towards slightly increased wavelengths after more applied pulses goes along with the expected particle growth and the size (and shape) dependence of SPR features [57]. Furthermore, it should be pointed out that the porous TiO host structure confines the growth of incorporated gold inside the film—with the limit being dendritic Au structures as partial replica of the original pore system [50].
The activity before and after the pulsed-ED was determined in terms PEC water oxidation under UV illumination and the corresponding chronoamperometric measurements are shown Figure 14c. The data show that exposure to 1, 8 and 16 pulses leads to highest, second highest and lowest photocurrents, respectively with corresponding relative photocurrent increases of 87%, 62% and 1% (inset of Figure 14c). These increased activities are explained by the formation of a Schottky barrier at the Au–TiO interface which causes spatial separation of photogenerated charge carriers involving transfer of electrons towards the noble metal [41,49]. The consequence is a reduced rate of charge carrier recombination which extends the amount of harvested charge carriers and their participation in photoelectrochemical reaction—ultimately leading to the observed improved photocurrents. This is astonishingly well confirmed in terms fluorescence emissions whose relative decreases of 86%, 68% and −2% (shown in Figure 14d) go almost perfectly hand in hand with the relative photocurrent increases. Both experiments prove that the formation of intense contact areas between the noble metal and the semiconductor is possible with the chosen pulsed-ED approach. The observed decreased activity for additional pulses might be a result of pore blocking or screening due to an excessive amount of gold. In fact, MTTFs that experienced an extended electrochemical treatment involving ≫16 pulses have an extensive deposition of Au on the film surface (not shown).
To further demonstrate the successful incorporation and to possibly obtain first insights regarding spatial distributions of Au-NPs, SEM-EDX mapping was performed on breaking edges of the samples exposed to 1 and 16 pulses. The corresponding SEM images and SEM-EDX overlays are shown in Figure 14e. Regions related to glass, FTO and TiO can be easily identified and distinguished. More importantly, the incorporation of Au-NPs is indicated but information related to their spatial distribution (and their structural properties including size distribution) cannot be extracted from those images. It appears from the presented overlays that Au is enriched at the film surface. SEM-EDX mapping confirms the incorporation of Au but for more detailed information of spatial and size distribution, selected thin Au/MTTF filaments should be analyzed by transmission electron microscopy (TEM) which is intended for future investigation. Finally, a top-view SEM image of the most active sample is shown in Figure 14f. It was measured nearby a crack in the MTTF and the incorporation of Au-NPs is confirmed once more as they appear as small dots with much brighter contrast compared to the TiO or the FTO.
4. Conclusions
Multi-layered mesoporous TiO thin film (photo)electrodes with up to 10 layers were prepared by an EISA method and repeated dip-coating/aging/drying/calcination cycles (“interrupted” layer-by-layer deposition). The experimental conditions were derived from an existing route towards single-layered films and were optimized with respect to the calcination temperature.
Each additional layer was accompanied with an almost linear increase of activity due to increased amounts of immobilized TiO and access to more active sites as a combined effect of increased surface area and better crystallinity. While additional TiO causes stronger absorption of UV photons and thus more photogenerated e–h pairs, accessible porous structure plus improved crystallinity allows their collection and participation in photochemical reactions. Another contribution is related to improved transport properties due to an extended network of cracks which likely derived from the interim characterization/cleaning steps. These combined effects explain the enhanced activity. Since 10-layered films show the highest photocurrents in this study, there is no indication of an already saturated activity which implies that the it can be further maximized with additional layers.
Moreover, the 10-layered films possess both a good photoelectrocatalytical and mechanical stability making them suitable candidates for future modifications. It was further shown that two faster routes towards thicker films lead to poor adhesion (an easy peeling off) rendering them useless for a further usage.
Initial results show the suitability of MTTFs as porous host substrates. Plasmonic gold nanoparticles were incorporated via pulsed electrochemical deposition and the presence of Au-NPs was confirmed (SEM-EDX, UV/Vis spectroscopy). All nanocomposites showed improved activities under UV illumination compared to pure MTTFs which is in excellent agreement with decreased fluorescence emissions. These observations are explained by reduced h–e rates the Au–TiO interface (Schottky barrier). Further study is in progress to get in depth insights at structural properties of noble metal deposits, visible-light responses and optimum number of layers of the MTTF host.
Author Contributions
Conceptualization, E.G., D.H.T. and M.W.; Methodology, E.G. and D.H.T.; Software, E.G.; Validation, E.G. and D.H.T.; Formal Analysis, E.G. and D.H.T.; Investigation, E.G.; Resources, M.W.; Data Curation, E.G. and D.H.T.; Writing—Original Draft Preparation, E.G.; Writing—Review and Editing, E.G. and D.H.T.; Visualization, E.G.; Supervision, M.W.; Project Administration, M.W.; Funding Acquisition, M.W.
Funding
This research was funded by the Deutsche Forschungsgemeinschaft (DFG) within the SPP 1613 (WA 1116/28-1) and INST 184/154-1 FUGG and the Bundesministerium für Bildung und Forschung (BMBF) within the project PROPHECY (PROzesskonzepte für die PHotokatalytische CO-Reduktion verbunden mit LifE-CYcle-Analysis).
Acknowledgments
The authors further thank Lea Mohrmann who was significantly involved in the preparation of multi-layered MTTFs.
Conflicts of Interest
The authors declare no conflict of interest.
References
- Fujishima, A.; Honda, K. Electrochemical Photolysis of Water at a Semiconductor Electrode. Nature 1972, 238, 37–38. [Google Scholar] [CrossRef] [PubMed]
- Diebold, U. The surface science of titanium dioxide. Surf. Sci. Rep. 2003, 48, 53–229. [Google Scholar] [CrossRef]
- Fujishima, A.; Zhang, X.; Tryk, D.A. TiO2 photocatalysis and related surface phenomena. Surf. Sci. Rep. 2008, 63, 515–582. [Google Scholar] [CrossRef]
- Fattakhova-Rohlfing, D.; Zaleska, A.; Bein, T. Three-Dimensional Titanium Dioxide Nanomaterials. Chem. Rev. 2014, 114, 9487–9558. [Google Scholar] [CrossRef]
- Fujishima, A.; Rao, T.N.; Tryk, D.A. Titanium dioxide photocatalysis. J. Photochem. Photobiol. C 2000, 1, 1–21. [Google Scholar] [CrossRef]
- Hashimoto, K.; Irie, H.; Fujishima, A. TiO2 Photocatalysis: A Historical Overview and Future Prospects. Jpn. J. Appl. Phys. 2005, 44, 8269–8285. [Google Scholar] [CrossRef]
- Haider, A.J.; Jameel, Z.N.; Al-Hussaini, I.H. Review on: Titanium Dioxide Applications. Energy Procedia 2019, 157, 17–29. [Google Scholar] [CrossRef]
- Bai, J.; Zhou, B. Titanium Dioxide Nanomaterials for Sensor Applications. Chem. Rev. 2014, 114, 10131–10176. [Google Scholar] [CrossRef]
- Wang, Y.; Wu, T.; Zhou, Y.; Meng, C.; Zhu, W.; Liu, L. TiO2-Based Nanoheterostructures for Promoting Gas Sensitivity Performance: Designs, Developments, and Prospects. Sensors 2017, 17, 1971. [Google Scholar] [CrossRef]
- O’Regan, B.; Grätzel, M. A low-cost, high-efficiency solar cell based on dye-sensitized colloidal TiO2 films. Nature 1991, 353, 737–740. [Google Scholar] [CrossRef]
- Gong, J.; Sumathy, K.; Qiao, Q.; Zhou, Z. Review on dye-sensitized solar cells (DSSCs): Advanced techniques and research trends. Renew. Sustain. Energy Rev. 2017, 68, 234–246. [Google Scholar] [CrossRef]
- Liu, Y.; Yang, Y. Recent Progress of TiO2-Based Anodes for Li Ion Batteries. J. Nanomat. 2016, 2016, 8123652. [Google Scholar] [CrossRef]
- Madian, M.; Eychmüller, A.; Giebeler, L. Current Advances in TiO2-Based Nanostructure Electrodes for High Performance Lithium Ion Batteries. Batteries 2018, 4, 7. [Google Scholar] [CrossRef]
- Nakajima, A.; Hashimoto, K.; Watanabe, T.; Takai, K.; Yamauchi, G.; Fujishima, A. Transparent Superhydrophobic Thin Films with Self-Cleaning Properties. Langmuir 2000, 16, 7044–7047. [Google Scholar] [CrossRef]
- Ollis, D.F. Photocatalytic purification and remediation of contaminated air and water. CR ACAD Sci. IIC Chem. 2000, 3, 405–411. [Google Scholar] [CrossRef]
- Hay, S.O.; Obee, T.; Luo, Z.; Jiang, T.; Meng, Y.; He, J.; Murphy, S.C.; Suib, S. The Viability of Photocatalysis for Air Purification. Molecules 2015, 20, 1319–1356. [Google Scholar] [CrossRef] [PubMed] [Green Version]
- Yuan, J.; Fujisawa, R.; Tsujikawa, S. Photopotentials of Copper Coated with TiO2 by Sol-Gel Method. Zairyo-to-Kankyo 1994, 43, 433–440. [Google Scholar] [CrossRef]
- Sahnesarayi, M.; Sarpoolaky, H.; Rastegari, S. Influence of Multiple Coating and Heat Treatment Cycles on the Performance of a Nano-TiO2 Coating in the Protection of 316L Stainless Steel Against Corrosion under UV Illumination and Dark Conditions. Iran. J. Mater. Sci. Eng. 2019, 16, 33–42. [Google Scholar] [CrossRef]
- Dhakshinamoorthy, A.; Navalon, S.; Corma, A.; Garcia, H. Photocatalytic CO2 reduction by TiO2 and related titanium containing solids. Energy Environ. Sci. 2012, 5, 9217–9233. [Google Scholar] [CrossRef]
- Wei, L.; Yu, C.; Zhang, Q.; Liu, H.; Wang, Y. TiO2-based heterojunction photocatalysts for photocatalytic reduction of CO2 into solar fuels. J. Mater. Chem. A 2018, 6, 22411–22436. [Google Scholar] [CrossRef]
- Li, X.; Yu, J.; Jaroniec, M.; Chen, X. Cocatalysts for Selective Photoreduction of CO2 into Solar Fuels. Chem. Rev. 2019, 119, 3962–4179. [Google Scholar] [CrossRef] [PubMed]
- Osterloh, F.E. Inorganic Materials as Catalysts for Photochemical Splitting of Water. Chem. Mater. 2008, 20, 35–54. [Google Scholar] [CrossRef]
- Nuida, T.; Kanai, N.; Hashimoto, K.; Watanabe, T.; Ohsaki, H. Enhancement of photocatalytic activity using UV light trapping effect. Vacuum 2004, 74, 729–733. [Google Scholar] [CrossRef]
- Kajihara, K.; Yao, T. Macroporous Morphology of the Titania Films Prepared by a Sol-Gel Dip-Coating Method from the System Containing Poly(Ethylene Glycol). II. Effect of Solution Composition. J. Sol-Gel Sci. Technol. 1998, 12, 193–201. [Google Scholar] [CrossRef]
- Grosso, D.; de A. A. Soler-Illia, G.J.; Babonneau, F.; Sanchez, C.; Albouy, P.A.; Brunet-Bruneau, A.; Balkenende, A.R. Highly Organized Mesoporous Titania Thin Films Showing Mono-Oriented 2D Hexagonal Channels. Adv. Mater. 2001, 13, 1085–1090. [Google Scholar] [CrossRef]
- Roy, P.; Berger, S.; Schmuki, P. TiO2 Nanotubes: Synthesis and Applications. Angew. Chem. Int. Ed. 2011, 50, 2904–2939. [Google Scholar] [CrossRef] [PubMed]
- Park, J.T.; Roh, D.K.; Patel, R.; Kim, E.; Ryu, D.Y.; Kim, J.H. Preparation of TiO2 spheres with hierarchical pores via grafting polymerization and sol–gel process for dye-sensitized solar cells. J. Mater. Chem. 2010, 20, 8521–8530. [Google Scholar] [CrossRef]
- Chen, D.; Caruso, R.A. Recent Progress in the Synthesis of Spherical Titania Nanostructures and Their Applications. Adv. Funct. Mater. 2013, 23, 1356–1374. [Google Scholar] [CrossRef]
- Ghosh, M.; Lohrasbi, M.; Chuang, S.S.C.; Jana, S.C. Mesoporous Titanium Dioxide Nanofibers with a Significantly Enhanced Photocatalytic Activity. ChemCatChem 2016, 8, 2525–2535. [Google Scholar] [CrossRef]
- Ghosh, M.; Jana, S.C. Bi-component inorganic oxide nanofibers from gas jet fiber spinning process. RSC Adv. 2015, 5, 105313–105318. [Google Scholar] [CrossRef]
- Liu, B.; Aydil, E.S. Growth of Oriented Single-Crystalline Rutile TiO2 Nanorods on Transparent Conducting Substrates for Dye-Sensitized Solar Cells. J. Am. Chem. Soc. 2009, 131, 3985–3990. [Google Scholar] [CrossRef] [PubMed]
- Ghosh, M.; Liu, J.; Chuang, S.S.C.; Jana, S.C. Fabrication of Hierarchical V2O5 Nanorods on TiO2 Nanofibers and Their Enhanced Photocatalytic Activity under Visible Light. ChemCatChem 2018, 10, 3305–3318. [Google Scholar] [CrossRef]
- Lee, K.; Mazare, A.; Schmuki, P. One-Dimensional Titanium Dioxide Nanomaterials: Nanotubes. Chem. Rev. 2014, 114, 9385–9454. [Google Scholar] [CrossRef] [PubMed] [Green Version]
- Chandra, D.; Bhaumik, A. Super-microporous TiO2 synthesized by using new designed chelating structure directing agents. Micropor. Mesopor. Mat. 2008, 112, 533–541. [Google Scholar] [CrossRef]
- Lv, J.; Zhu, L. Highly efficient indoor air purification using adsorption-enhanced-photocatalysis-based microporous TiO2 at short residence time. Environ. Technol. 2013, 34, 1447–1454. [Google Scholar] [CrossRef] [PubMed]
- Fuertes, M.C.; Soler-Illia, G.J.A.A. Processing of Macroporous Titania Thin Films: From Multiscale Functional Porosity to Nanocrystalline Macroporous TiO2. Chem. Mater. 2006, 18, 2109–2117. [Google Scholar] [CrossRef]
- Yao, J.; Takahashi, M.; Yoko, T. Controlled preparation of macroporous TiO2 films by photo polymerization-induced phase separation method and their photocatalytic performance. Thin Solid Films 2009, 517, 6479–6485. [Google Scholar] [CrossRef]
- Malfatti, L.; Bellino, M.G.; Innocenzi, P.; Soler-Illia, G.J.A.A. One-Pot Route to Produce Hierarchically Porous Titania Thin Films by Controlled Self-Assembly, Swelling, and Phase Separation. Chem. Mater. 2009, 21, 2763–2769. [Google Scholar] [CrossRef]
- Sun, W.; Zhou, S.; You, B.; Wu, L. Facile Fabrication and High Photoelectric Properties of Hierarchically Ordered Porous TiO2. Chem. Mater. 2012, 24, 3800–3810. [Google Scholar] [CrossRef]
- Chen, X.; Burda, C. The Electronic Origin of the Visible-Light Absorption Properties of C-, N- and S-Doped TiO2 Nanomaterials. J. Am. Chem. Soc. 2008, 130, 5018–5019. [Google Scholar] [CrossRef]
- Devi, L.G.; Kavitha, R. A review on plasmonic metal–TiO2 composite for generation, trapping, storing and dynamic vectorial transfer of photogenerated electrons across the Schottky junction in a photocatalytic system. Appl. Surf. Sci. 2016, 360, 601–622. [Google Scholar] [CrossRef]
- Islam, S.Z.; Nagpure, S.; Kim, D.Y.; Rankin, S.E. Synthesis and Catalytic Applications of Non-Metal Doped Mesoporous Titania. Inorganics 2017, 5, 15. [Google Scholar] [CrossRef]
- Zaleska, A. Doped-TiO2: A Review. Recent Pat. Eng. 2008, 2, 157–164. [Google Scholar] [CrossRef]
- Hwang, Y.J.; Boukai, A.; Yang, P. High Density n-Si/n-TiO2 Core/Shell Nanowire Arrays with Enhanced Photoactivity. Nano Lett. 2009, 9, 410–415. [Google Scholar] [CrossRef] [PubMed]
- Qi, K.; Cheng, B.; Yu, J.; Ho, W. A review on TiO2-based Z-scheme photocatalysts. Chin. J. Catal. 2017, 38, 1936–1955. [Google Scholar] [CrossRef]
- Low, J.; Jiang, C.; Cheng, B.; Wageh, S.; Al-Ghamdi, A.A.; Yu, J. A Review of Direct Z-Scheme Photocatalysts. Small Meth. 2017, 1, 1700080. [Google Scholar] [CrossRef]
- Feng, D.; Luo, W.; Zhang, J.; Xu, M.; Zhang, R.; Wu, H.; Lv, Y.; Asiri, A.M.; Khan, S.B.; Rahman, M.M.; et al. Multi-layered mesoporous TiO2 thin films with large pores and highly crystalline frameworks for efficient photoelectrochemical conversion. J. Mater. Chem. A 2013, 1, 1591–1599. [Google Scholar] [CrossRef]
- Chen, X.; Liu, L.; Huang, F. Black titanium dioxide (TiO2) nanomaterials. Chem. Soc. Rev. 2015, 44, 1861–1885. [Google Scholar] [CrossRef]
- Tian, Y.; Tatsuma, T. Plasmon-induced photoelectrochemistry at metal nanoparticles supported on nanoporous TiO2. Chem. Commun. 2004, 1810–1811. [Google Scholar] [CrossRef]
- Bannat, I.; Wessels, K.; Oekermann, T.; Rathouský, J.; Bahnemann, D.; Wark, M. Improving the Photocatalytic Performance of Mesoporous Titania Films by Modification with Gold Nanostructures. Chem. Mater. 2009, 21, 1645–1653. [Google Scholar] [CrossRef]
- Gellé, A.; Moores, A. Water splitting catalyzed by titanium dioxide decorated with plasmonic nanoparticles. Pure Appl. Chem. 2017, 89, 1817–1827. [Google Scholar] [CrossRef]
- Ghanem, M.A.; Arunachalam, P.; Amer, M.S.; Al-Mayouf, A.M. Mesoporous titanium dioxide photoanodes decorated with gold nanoparticles for boosting the photoelectrochemical alkali water oxidation. Mater. Chem. Phys. 2018, 213, 56–66. [Google Scholar] [CrossRef]
- Couzon, N.; Maillard, M.; Chassagneux, F.; Brioude, A.; Bois, L. Photoelectrochemical Behavior of Silver Nanoparticles inside Mesoporous Titania: Plasmon-Induced Charge Separation Effect. Langmuir 2019, 35, 2517–2526. [Google Scholar] [CrossRef] [PubMed]
- Primo, A.; Corma, A.; Garcí-a, H. Titania supported gold nanoparticles as photocatalyst. Phys. Chem. Chem. Phys. 2011, 13, 886–910. [Google Scholar] [CrossRef] [PubMed]
- Neaţu, Ş.; Maciá-Agulló, J.A.; Concepción, P.; Garcia, H. Gold–Copper Nanoalloys Supported on TiO2 as Photocatalysts for CO2 Reduction by Water. J. Am. Chem. Soc. 2014, 136, 15969–15976. [Google Scholar] [CrossRef]
- Jeong, S.; Kim, W.D.; Lee, S.; Lee, K.; Lee, S.; Lee, D.; Lee, D.C. Bi2O3 as a Promoter for Cu/TiO2 Photocatalysts for the Selective Conversion of Carbon Dioxide into Methane. ChemCatChem 2016, 8, 1641–1645. [Google Scholar] [CrossRef]
- Eustis, S.; El-Sayed, M.A. Why gold nanoparticles are more precious than pretty gold: Noble metal surface plasmon resonance and its enhancement of the radiative and nonradiative properties of nanocrystals of different shapes. Chem. Soc. Rev. 2006, 35, 209–217. [Google Scholar] [CrossRef]
- Pan, J.H.; Zhao, X.; Lee, W.I. Block copolymer-templated synthesis of highly organized mesoporous TiO2-based films and their photoelectrochemical applications. Chem. Eng. J. 2011, 170, 363–380. [Google Scholar] [CrossRef]
- Mahoney, L.; Koodali, R.T. Versatility of Evaporation-Induced Self-Assembly (EISA) Method for Preparation of Mesoporous TiO2 for Energy and Environmental Applications. Materials 2014, 7, 2697–2746. [Google Scholar] [CrossRef]
- Sanchez, C.; Boissière, C.; Grosso, D.; Laberty, C.; Nicole, L. Design, Synthesis, and Properties of Inorganic and Hybrid Thin Films Having Periodically Organized Nanoporosity. Chem. Mater. 2008, 20, 682–737. [Google Scholar] [CrossRef]
- Antonelli, D.M.; Ying, J.Y. Synthesis of a Stable Hexagonally Packed Mesoporous Niobium Oxide Molecular Sieve Through a Novel Ligand-Assisted Templating Mechanism. Angew. Chem. Int. Ed. 1996, 35, 426–430. [Google Scholar] [CrossRef]
- Soler-Illia, G.J.A.A.; Angelome, P.C.; Fuertes, M.C.; Grosso, D.; Boissiere, C. Critical aspects in the production of periodically ordered mesoporous titania thin films. Nanoscale 2012, 4, 2549–2566. [Google Scholar] [CrossRef] [PubMed]
- Li, W.; Wu, X.; Wang, J.; Elzatahry, A.A.; Zhao, D. A Perspective on Mesoporous TiO2 Materials. Chem. Mater. 2014, 26, 287–298. [Google Scholar] [CrossRef]
- Sánchez, V.M.; Martínez, E.D.; Martínez Ricci, M.L.; Troiani, H.; Soler-Illia, G.J.A.A. Optical Properties of Au Nanoparticles Included in Mesoporous TiO2 Thin Films: A Dual Experimental and Modeling Study. J. Phys. Chem. C 2013, 117, 7246–7259. [Google Scholar] [CrossRef]
- Martínez, E.D.; Boissière, C.; Grosso, D.; Sanchez, C.; Troiani, H.; Soler-Illia, G.J.A.A. Confinement-Induced Growth of Au Nanoparticles Entrapped in Mesoporous TiO2 Thin Films Evidenced by in Situ Thermo-Ellipsometry. J. Phys. Chem. C 2014, 118, 13137–13151. [Google Scholar] [CrossRef]
- Granja, L.P.; Martínez, E.D.; Troiani, H.; Sanchez, C.; Soler-Illia, G.J.A.A. Magnetic Gold Confined in Ordered Mesoporous Titania Thin Films: A Noble Approach for Magnetic Devices. ACS Appl. Mater. Int. 2017, 9, 965–971. [Google Scholar] [CrossRef]
- Zalduendo, M.M.; Langer, J.; Giner-Casares, J.J.; Halac, E.B.; Soler-Illia, G.J.A.A.; Liz-Marzan, L.M.; Angelome, P.C. Au Nanoparticles-Mesoporous TiO2 Thin Films Composites as SERS Sensors: A Systematic Performance Analysis. J. Phys. Chem. C 2018, 122, 13095–13105. [Google Scholar] [CrossRef]
- Steinberg, P.Y.; Zalduendo, M.M.; Giménez, G.; Soler-Illia, G.J.A.A.; Angelomé, P.C. TiO2 mesoporous thin film architecture as a tool to control Au nanoparticles growth and sensing capabilities. Phys. Chem. Chem. Phys. 2019, 21, 10347–10356. [Google Scholar] [CrossRef]
- Li, H.; Shen, L.; Zhang, K.; Sun, B.; Ren, L.; Qiao, P.; Pan, K.; Wang, L.; Zhou, W. Surface plasmon resonance-enhanced solar-driven photocatalytic performance from Ag nanoparticle-decorated self-floating porous black TiO2 foams. Appl. Catal. B Environ. 2018, 220, 111–117. [Google Scholar] [CrossRef]
- Violi, I.L.; Perez, M.D.; Fuertes, M.C.; Soler-Illia, G.J.A.A. Highly Ordered, Accessible and Nanocrystalline Mesoporous TiO2 Thin Films on Transparent Conductive Substrates. ACS Appl. Mat. Int. 2012, 4, 4320–4330. [Google Scholar] [CrossRef]
- Brinker, C.J.; Hurd, A.J. Fundamentals of sol-gel dip-coating. J. Phys. III France 1994, 4, 1231–1242. [Google Scholar] [CrossRef]
- Fuertes, M.C.; Colodrero, S.; Lozano, G.; González-Elipe, A.R.; Grosso, D.; Boissière, C.; Sánchez, C.; Soler-Illia, G.J.d.A.A.; Míguez, H. Sorption Properties of Mesoporous Multilayer Thin Films. J. Phys. Chem. C 2008, 112, 3157–3163. [Google Scholar] [CrossRef] [Green Version]
- Krins, N.; Faustini, M.; Louis, B.; Grosso, D. Thick and Crack-Free Nanocrystalline Mesoporous TiO2 Films Obtained by Capillary Coating from Aqueous Solutions. Chem. Mater. 2010, 22, 6218–6220. [Google Scholar] [CrossRef]
- Procházka, J.; Kavan, L.; Shklover, V.; Zukalová, M.; Frank, O.; Kalbáč, M.; Zukal, A.; Pelouchová, H.; Janda, P.; Mocek, K.; et al. Multilayer Films from Templated TiO2 and Structural Changes during their Thermal Treatment. Chem. Mater. 2008, 20, 2985–2993. [Google Scholar] [CrossRef]
- Ismail, A.A.; Bahnemann, D.W.; Rathouský, J.; Yarovyi, V.; Wark, M. Multilayered ordered mesoporous platinum/titania composite films: Does the photocatalytic activity benefit from the film thickness? J. Mater. Chem. 2011, 21, 7802–7810. [Google Scholar] [CrossRef]
- Koganti, V.R.; Dunphy, D.; Gowrishankar, V.; McGehee, M.D.; Li, X.; Wang, J.; Rankin, S.E. Generalized Coating Route to Silica and Titania Films with Orthogonally Tilted Cylindrical Nanopore Arrays. Nano Lett. 2006, 6, 2567–2570. [Google Scholar] [CrossRef] [PubMed]
- Nagpure, S.; Das, S.; Garlapalli, R.K.; Strzalka, J.; Rankin, S.E. In Situ GISAXS Investigation of Low-Temperature Aging in Oriented Surfactant-Mesostructured Titania Thin Films. J. Phys. Chem. C 2015, 119, 22970–22984. [Google Scholar] [CrossRef]
- Choi, S.; Mamak, M.; Coombs, N.; Chopra, N.; Ozin, G. Thermally Stable Two-Dimensional Hexagonal Mesoporous Nanocrystalline Anatase, Meso-nc-TiO2: Bulk and Crack-Free Thin Film Morphologies. Adv. Funct. Mater. 2004, 14, 335–344. [Google Scholar] [CrossRef]
- Vanýsek, P. Chapter 8: Preparation of Special Analytical Reagents—Electrochemical Series. In CRC Handbook of Chemistry and Physics; Lide, D.R., Ed.; CRC Press: Boca Raton, FL, USA, 2009; pp. 8.1–8.131. [Google Scholar]
- Jiang, X.; Suzuki, N.; Bastakoti, B.P.; Chen, W.J.; Huang, Y.T.; Yamauchi, Y. Controlled Synthesis of Well-Ordered Mesoporous Titania Films with Large Mesopores Templated by Spherical PS-b-PEO Micelles. Eur. J. Inorg. Chem. 2013, 2013, 3286–3291. [Google Scholar] [CrossRef]
- Bass, J.D.; Grosso, D.; Boissiere, C.; Sanchez, C. Pyrolysis, Crystallization, and Sintering of Mesostructured Titania Thin Films Assessed by in Situ Thermal Ellipsometry. J. Am. Chem. Soc. 2008, 130, 7882–7897. [Google Scholar] [CrossRef]
- Djerdj, I.; Tonejc, A. Structural investigations of nanocrystalline TiO2 samples. J. Alloys Compd. 2006, 413, 159–174. [Google Scholar] [CrossRef]
- Swanson, H.E.; McMurdie, H.F.; Morris, M.C.; Evans, E.H. Standard X-ray Diffraction Powder Patterns — Data for 81 Substances; National Bureau of Standards: Washington, DC, USA, 1969; pp. 1–188. [Google Scholar]
- Toledo-Antonio, J.; Gutiérrez-Baez, R.; Sebastian, P.; Vázquez, A. Thermal stability and structural deformation of rutile SnO2 nanoparticles. J. Solid State Chem. 2003, 174, 241–248. [Google Scholar] [CrossRef]
- Grosso, D.; Soler-Illia, G.J.d.A.A.; Crepaldi, E.L.; Cagnol, F.; Sinturel, C.; Bourgeois, A.; Brunet-Bruneau, A.; Amenitsch, H.; Albouy, P.A.; Sanchez, C. Highly Porous TiO2 Anatase Optical Thin Films with Cubic Mesostructure Stabilized at 700 ∘C. Chem. Mater. 2003, 15, 4562–4570. [Google Scholar] [CrossRef]
- Zhou, W.; Sun, F.; Pan, K.; Tian, G.; Jiang, B.; Ren, Z.; Tian, C.; Fu, H. Well-Ordered Large-Pore Mesoporous Anatase TiO2 with Remarkably High Thermal Stability and Improved Crystallinity: Preparation, Characterization, and Photocatalytic Performance. Adv. Funct. Mater. 2011, 21, 1922–1930. [Google Scholar] [CrossRef]
- Tao, J.; Sun, Y.; Ge, M.; Chen, X.; Dai, N. Non-Prefabricated Nanocrystal Mesoporous TiO2-Based Photoanodes Tuned by A Layer-by-Layer and Rapid Thermal Process. ACS Appl. Mater. Int. 2010, 2, 265–269. [Google Scholar] [CrossRef]
- Nagpure, S.; Zhang, Q.; Khan, M.A.; Islam, S.Z.; Xu, J.; Strzalka, J.; Cheng, Y.T.; Knutson, B.L.; Rankin, S.E. Layer-by-Layer Synthesis of Thick Mesoporous TiO2 Films with Vertically Oriented Accessible Nanopores and Their Application for Lithium-Ion Battery Negative Electrodes. Adv. Funct. Mater. 2018, 28, 1801849. [Google Scholar] [CrossRef]
- Wu, Q.L.; Subramanian, N.; Rankin, S.E. Hierarchically Porous Titania Thin Film Prepared by Controlled Phase Separation and Surfactant Templating. Langmuir 2011, 27, 9557–9566. [Google Scholar] [CrossRef]
- Bicelli, L.P.; Bozzini, B.; Mele, C. A review of nanostructural aspects of metal electrodeposition. Int. J. Electrochem. Sci. 2008, 3, 356–408. [Google Scholar]
Figure 1.
(a) Flowchart of steps involved in the film preparation. Green and blue arrows represent pathways to single- and multi-layered MTTFs, respectively. The pale blue arrow indicates a shortcut by skipping characterization/cleaning of MTTFs. (b) Scheme and photograph of a TiO thin film. Green and blue areas represent the bare FTO and TiO part, respectively. The circle indicates the region where electrodeposition might take place later; but more importantly, where optical spectroscopy and photoelectrochemistry are performed.

Figure 2.
Pulsed electrodeposition of Au-NPs into MTTFs. (a) schematic representation of the used setup and (b) adjustable parameters.
Figure 2.
Pulsed electrodeposition of Au-NPs into MTTFs. (a) schematic representation of the used setup and (b) adjustable parameters.

Figure 3.
Influence of calcination temperature on mesofilm morphology as observed by top-view SEM. Higher calcination temperatures cause mesostructure deteriorations and the formation of cracks at T > 500 C.
Figure 3.
Influence of calcination temperature on mesofilm morphology as observed by top-view SEM. Higher calcination temperatures cause mesostructure deteriorations and the formation of cracks at T > 500 C.

Figure 4.
Normalized GI-XRD patterns of single-layered MTTFs calcined at different temperatures. Reference patterns [82,83,84] and selected hkl values are displayed for better interpretation.

Figure 5.
Influence of calcination temperature on photoelectrochemical water oxidation activity. (a) Voltammetric scans and (b) selected photocurrent densities for each corresponding calcination program.
Figure 5.
Influence of calcination temperature on photoelectrochemical water oxidation activity. (a) Voltammetric scans and (b) selected photocurrent densities for each corresponding calcination program.

Figure 6.
Photograph and optical spectra of multi-layered MTTFs calcined at 550 C. (a) Photographs of selected samples, (b) UV/Vis transmittance spectra, (c) Tauc plots, and (d) fluorescence spectra.
Figure 6.
Photograph and optical spectra of multi-layered MTTFs calcined at 550 C. (a) Photographs of selected samples, (b) UV/Vis transmittance spectra, (c) Tauc plots, and (d) fluorescence spectra.

Figure 7.
Development of film thickness as function of deposited MTTF layers. (a) Breaking edge SEM images of multi-layered MTTFs calcined at 550 C and (b) their corresponding thickness-versus-layer plot.
Figure 7.
Development of film thickness as function of deposited MTTF layers. (a) Breaking edge SEM images of multi-layered MTTFs calcined at 550 C and (b) their corresponding thickness-versus-layer plot.

Figure 8.
Normalized GI-XRD patterns of multi-layered MTTFs calcined at 550 C. Reference patterns [82,83,84] and selected hkl values are displayed for better interpretation.

Figure 9.
Nitrogen adsorption-desorption isotherms of multi-layered MTTFs calcined at 550 C. (a) The calculated BET surface areas as a function of the number of deposited MTTF layers and (b) nitrogen sorption isotherms and pore size distribution of selected substrates.
Figure 9.
Nitrogen adsorption-desorption isotherms of multi-layered MTTFs calcined at 550 C. (a) The calculated BET surface areas as a function of the number of deposited MTTF layers and (b) nitrogen sorption isotherms and pore size distribution of selected substrates.

Figure 10.
Photocurrent densities (during PEC water oxidation) of multi-layered MTTFs calcined at 550 C as a function of the number of deposited MTTF layers. (a) The corresponding chronoamperometric measurements. (b) Average values of the two sets of samples used during the chronoamperometric experiment. A green line indicates the average activity increase for the first eight layers. (c) derivative representation of (b) to emphasize the specialty of both 10L films.

Figure 11.
SEM top-view image of (a) single- and (b) ten-layered MTTFs at different magnifications showing that an extended network of microscopic cracks is formed in case of the multi-layered sample.
Figure 11.
SEM top-view image of (a) single- and (b) ten-layered MTTFs at different magnifications showing that an extended network of microscopic cracks is formed in case of the multi-layered sample.

Figure 12.
(a) Photocurrent stability tests of four 10-layered MTTFs (2× 450 C, 2× 550 C) recorded at ten different days (disassembling, cleaning, drying, assembling between each measurement). Photocurrent densities were derived from chronoamperometric experiments and taken after 32.5 s (right in the middle of an illumination phase). (b) Three-dimensional representation of the chronoamperometric results that correspond to a the “550 C_A” sample from (a).

Figure 13.
Two different samples before and after the “rubbing test”. (a) Photograph and SEM top-view images of the 10-layered MTTF “550 C_A” from Figure 12. Although its microscopic structure is affected by the rubbing, this sample has delivered stable photocurrents prior and after this procedure. (b) Photograph of a 3-layered MTTF that had been calcined only once to save energy and time, namely after the drying phase of its third and last deposition cycle. This film is not mechanically stable.

Figure 14.
Properties of SPR-active gold-modified MTTFs obtained after three different amounts of applied cathodic pulses. (a) physicochemical conditions and pulse parameters during pulsed electrodeposition, (b) UV/Vis transmittance spectra and photograph, (c) chronoamperometric results (dashed and solid lines before and after pulsed-ED, respectively) with inset showing relative increase of photocurrents, (d) fluorescence spectra with inset showing relative decrease of emission intensity, (e) cross-sectional SEM images and corresponding EDX mapping of two selected samples, (f) top-view SEM image of most active sample near a cracked part showing Au-NPs.


Table 1.
Analysis of anatase (101) GI-XRD peak broadening of single-layered MTTFs calcined at different temperatures.
Table 1.
Analysis of anatase (101) GI-XRD peak broadening of single-layered MTTFs calcined at different temperatures.
| T/C | FWHM/ | Average Crystallite |
|---|---|---|
| Size/nm | ||
| 400 | 0.859 | ≈16 |
| 500 | 0.709 | ≈24 |
| 550 | 0.638 | ≈28 |
Table 2.
Analysis of anatase (101) GI-XRD peak broadening of single-layered MTTFs calcined at different temperatures.
Table 2.
Analysis of anatase (101) GI-XRD peak broadening of single-layered MTTFs calcined at different temperatures.
| FWHM/ | Average Crystallite | |
|---|---|---|
| Size/nm | ||
| 1 L | 0.638 | ≈28 |
| 2 L | 0.672 | ≈25 |
| 4 L | 0.729 | ≈22 |
| 6 L | 0.623 | ≈30 |
| 8 L | 0.626 | ≈29 |
| 10 L | 0.658 | ≈26 |
© 2019 by the authors. Licensee MDPI, Basel, Switzerland. This article is an open access article distributed under the terms and conditions of the Creative Commons Attribution (CC BY) license (http://creativecommons.org/licenses/by/4.0/).
Share and Cite
MDPI and ACS Style
Gent, E.; Taffa, D.H.; Wark, M. Multi-Layered Mesoporous TiO2 Thin Films: Photoelectrodes with Improved Activity and Stability. Coatings 2019, 9, 625. https://doi.org/10.3390/coatings9100625
AMA Style
Gent E, Taffa DH, Wark M. Multi-Layered Mesoporous TiO2 Thin Films: Photoelectrodes with Improved Activity and Stability. Coatings. 2019; 9(10):625. https://doi.org/10.3390/coatings9100625
Chicago/Turabian StyleGent, Enno, Dereje H. Taffa, and Michael Wark. 2019. "Multi-Layered Mesoporous TiO2 Thin Films: Photoelectrodes with Improved Activity and Stability" Coatings 9, no. 10: 625. https://doi.org/10.3390/coatings9100625
Note that from the first issue of 2016, this journal uses article numbers instead of page numbers. See further details here.